Article

Age-Related Differences in Motor-Vehicle Crash Severity in California

1
Department of Civil and Architectural Engineering and Construction Management, College of Engineering and Applied Science, University of Cincinnati, Cincinnati, OH 45221, USA
2
Department of Civil and Environmental Engineering, FAMU/FSU College of Engineering, Florida A&M University, Tallahassee, FL 32307, USA
3
Department of Civil and Environmental Engineering, FAMU/FSU College of Engineering, Florida State University, Tallahassee, FL 32306, USA
*
Author to whom correspondence should be addressed.
Safety 2019, 5(3), 48; https://doi.org/10.3390/safety5030048
Submission received: 18 June 2019 / Revised: 1 August 2019 / Accepted: 5 August 2019 / Published: 7 August 2019

Abstract

:
With ongoing changes in the age distribution of drivers in the United States, it is important to obtain insights on how to make the roadways equally safe for drivers across different age groups. In light of this, the objective of this study is to examine various crash characteristics and make recommendations on how to potentially improve roadway safety for all age groups. Using the Highway Safety Information System (HSIS) data, this study investigates the factors influencing motor-vehicle crash injury severity for young (aged 16–25), middle-aged (aged 26–64), and older drivers (above 64) in the state of California. A multinomial logit model was used to separately model crashes involving each age group and to evaluate the weight of different predictor variables on driver injury severity. The predictor variables were classified into four—driver, roadway, accident and environmental characteristics. Results suggest that there are close relationships between severity determinants for young and middle-aged drivers. However, older drivers tend to be most cautious among all age groups under all environmental and roadway conditions. Young drivers are more likely to explore their driving skills due to newness to driving. Middle-aged drivers are familiar with driving and tend to demonstrate less cautious behaviors, especially male drivers. Another insight obtained from this study is that older driver behavior is less dynamic compared to other age groups; their driving pattern is usually regular regardless of the surrounding conditions.

1. Introduction

The 2018 World Health Organization report showed that every year more than 1.25 million people die because of road traffic crashes. Non-fatal injuries were also recorded among about 50 million people, and these injuries usually result in permanent disabilities [1]. For the fiscal year 2010, approximately $240 billion worth of loss resulted from motor-vehicle crashes, representing about 2% of the United States (U.S.) Gross Domestic Product [1]. It is projected that by the year 2030, if no preventive measures are implemented, road traffic crashes will become the seventh leading cause of death [1].
In the U.S., statistical investigations have shown a reduction in traffic collisions between the years 2003 and 2011. Notwithstanding, traffic fatalities and fatality rates increased in the year 2012 [1], which emphasizes the need to not only examine collision frequency but also injury severity and fatalities. There were approximately 6.3 million police-reported motor vehicle traffic crashes, with 0.6% (32,166) fatal, 27.2% (1,715,000) being injury and 72.2% (4,548,000) being property damage only crashes [2] in 2015. Compared to 2015, records showed that the year 2016 had even more fatal crashes (34,439) and more fatalities [2].
The Center for Disease Control and Prevention reported that motor-vehicles were the leading cause of death for individuals age 10 and ages 16–23 in 2015 [2]. According to the injury facts produced by the National Safety Council in 2017, most deaths for individuals aged 1–24 are recorded from motor vehicle crashes, and individuals of age 25–84 have their second leading cause of death from traffic collisions. Furthermore, six deaths are recorded every day for teens between the ages of 16 and 19 as a result of motor vehicle collision injuries. The likelihood of teen drivers to be involved in fatal crashes is almost three times that of drivers aged 20 [3].
In 2015, hospital emergency departments treated approximately 250,000 adults for motor vehicle collision injuries, with an additional 7000 individuals dying from their injuries. Using simple statistics, this means 19 older adults are killed and about 700 are injured in crashes on a daily basis [3]. More specifically, in 2014, California has ranked the second-highest state for young driver (aged 15–20 years old) crashes in the United States after Texas [2]. It is also important to know that road crashes cost the U.S. an average of $820 per person per year.
With these facts, the frequency and severity analysis of collisions have been the two major branches for assessing traffic safety [1]. Collision frequency analyses are conducted at a macroscopic level (county, state, traffic analysis zones, area-wide, etc.), while severity analyses are done at a microscopic level (driver, occupant, pedestrian, etc.). The frequency level considers factors such as social, economic, demographic factors, which have to do with a large population of people in an area.
Severity analysis is conducted with individual crash victim characteristics. Factors considered include the age, gender, driving ability, and other variables personal to the victim. Information related to this is usually reported by the police. Using accident reconstruction strategies, law enforcement agents can give a near-accurate description of events that occurred right before the crash [2]. Along with testimonies from witnesses, an overview of the crash causes and resulting injuries can be provided in official reports.
In modeling crashes, different explanatory variables have been used in the past. Roadway (speed limit, road surface, number of lanes, lane width, curvature, grade, paving, roadway class, roadway function, alignment, AADT, shoulder width, barrier, etc.), driver (age, gender, seatbelt use, seating position, driver alcohol involvement, familiarity with road, etc.) and environmental (Lighting condition, weather, time of day, day of the week, etc.) factors have been a point of focus for studies [3,4,5].
Existing studies have observed that factors such as inadequate roadway lighting conditions, bad weather conditions, and the number of vehicles involved can significantly contribute to an increased injury severity for drivers [6]. In addition, Uddin and Huynh [7] established that truck drivers carrying hazardous materials have higher injury severity outcome compared to passengers inside the same truck. The same researchers also found that on non-interstate highways, truck occupants are about 50% more likely not to sustain any injury in events of traffic collision [7].
A taxi–pedestrian crash analysis [2] provided insights on factors affecting the severity of injuries. Results showed that speed and the absence of a roadway median were among the major contributors to increased injury severity. The study also pointed out that collisions between a vehicle moving in a straight path and a pedestrian are usually less severe.
Haleem et al. analyzed pedestrian–intersection crash-related injuries using the mixed logit model. Two severity levels (fatal and non-fatal) were considered in crash modeling. Results showed that the truck composition in the traffic, posted speed limit, the age of pedestrian, the annual average daily traffic, time of crash, lighting, and weather conditions were among the significant predictor variables. At un-signalized intersections, they found that the type of crosswalk, bad lighting, age of pedestrian, and condition of the road surface were significant in crash injury severity prediction [4].
Additionally, Behnood et al. used the latent class model to analyze the effect of age, gender and alcohol consumption on driver-injury severities. It was found that the blood alcohol content of drivers had a significant effect on injury severity outcomes among different genders [8]. Kim et al. [9] also found that the likelihood of fatal injury increased for male drivers. They also found that an older driver driving an older vehicle can potentially increase crash injury severity.
Human factors are one of the most relevant determinants of crash severity. In most cases, crashes usually occur due to errors of human driving. This has led to many studies which consider the human-related characteristics in determining injury severity outcomes. Some studies [10,11] have considered severity prediction in terms of the at-fault driver, while others have considered age [12,13], sex [14,15,16], and experience [17]. All these studies have pointed to the significance of human factors in injury severity outcomes.
Specifically, age-related differences have been established. Ulak et al. [18] analyzed crashes in northern Florida based on different age groups. The study found that older driver crashes totally differ from crashes involving other age groups, both spatially and temporally. They found that older driver crashes are more frequent in downtown areas that are highly populated with older individuals. Considering novice teenage drivers, Braitman et al. [19] discovered that for every crash involving teenagers, the teenage driver was at fault for 75% of the crashes. Donmez and Liu [12] observed that driver distractions, such as texting on phones and chatting with passengers, resulted in increased injury severity for young and middle-aged drivers. They also found a closer relationship between crash characteristics for young and middle-aged drivers than between older drivers and any other age groups.
The investigation of crash injury severity has not only been in terms of motor-vehicles. It has also been established that there are age-related differences in crash characteristics even for cyclists [20,21] and pedestrians [22]. For example, the cycling intensity of younger drivers was found to be a significant predictor of risky behavior. On the other hand, cycling intensity was not associated with risky behavior for older cyclists [20]. Deb et al. [22] found that older pedestrians showed more positive behaviors than younger pedestrians. In fact, they found that there was not much difference between young and middle-aged pedestrian behaviors, but there was a significant difference between older pedestrians and other age groups.
With all these studies reviewed, the first inference is that human factors are major considerations in examining crash characteristics and considering possible solutions to achieve the objective of safer roadways. More importantly, a recent study [23] provided the most up-to-date investigation of aging crash risks in the U.S.—though focusing on intersections, the study found that older drivers are facing numerous challenges as a result of natural aging and depletion in sensory, perception, cognitive, and vehicle navigation skills. This calls for intervention, as the U.S. population is continually aging.
Specifically for the state of California, it was said earlier that the state was recently ranked as the second-highest state for young driver crashes. With this, it is important to find a means for improving the roadway safety performance for all age groups. This calls for further investigation. As a result, the objective of this study was to obtain insights on factors that are significant determinants of crash severity for different age groups and to provide some recommendations on how to possibly improve the roadways equally for all age groups. To the best of our knowledge, this study is the most recent study that considers age-related differences, specifically for the state of California. In 2013, Kim et al. [9] conducted a similar study but only investigated single-vehicle crashes; they did not consider each age group differently.
Using the Highway Safety Information System (HSIS) data, this study sought to identify factors contributing to motor-vehicle injury severities by driver age in the state of California. Three different age groups were identified: Young drivers (aged 16–25), middle-aged drivers (aged 26–64) and older drivers (aged 65 and above). We examined the effect of different characteristics on the likelihood of injury fatalities for each age group. We also examined the difference across each of the age groups.
This report continues with a methodology section that describes the data used, the variables used in developing the model, the model formulation, and model development. The result section follows the methodology section, and it gives the results obtained for each age group and provides a detailed discussion of the results. Finally, the conclusion section provides a general explanation of the research objective, the results obtained, and recommendations in line with this study. The last section provides the limitations of this study suggested for future research.

2. Materials and Methods

Data

The HSIS is a coordinated effort by the U.S. Federal Highways Administration (FHWA) in which nine (9) member states including California, North Carolina, Illinois, Ohio, Maine, Utah, Michigan, Washington, and Minnesota voluntarily provide the FHWA with crash data. It is a system that provides rich data on roadway and accident variables. The roadway file contains information on roadway type, including the number of lanes, shoulder type, median and shoulder width, and other relevant geometric characteristics. The accident file contains the vehicle and occupant information, which includes the type of vehicle, occupant age, sex, accident severity, weather condition, and other environmental variables. The HSIS database does not provide personal and/or confidential details about the crash victims. Therefore, there are no risks for the integrity of the victims. Since the HSIS only provides previously published data, there was no breach of ethical issues in this study.
Crashes for California from the years 2005–2014 were obtained from the HSIS database. The data contains only police-reported crashes for the state of California. The crash files were first merged for accidents, vehicles, and roadway characteristics. The merging was done using case numbers, and then the roadway characteristics were incorporated using the milepost variable from the accident and roadway files. Once the 10-year data were successfully merged, crashes involving motor-vehicles were extracted as the required data for this study. The was a total of 1,638,013 crashes over the 10-year period.
Rows containing empty data points were removed from the overall crash data. In cases where a variable had too many empty data points, the variable was removed totally. After data cleaning and filtering, there were 17 variables left for model development. The total remaining number of crashes is 1,520,465. The data were then grouped into crashes involving young (16–25 years old), middle-aged (26–64), and older (above 64 years) drivers. All 17 variables obtained after cleaning and filtering were used to develop the model at the initial stages. The variables fall into four major categories: Roadway, driver, accident, and environmental characteristics. The variables were converted to categorical variables.
Injury severity in the HSIS database is classified into five (5) levels using the KABCO scale defined as; fatal injury (K), and 4 levels of severe injuries: Severe/incapacitating injury (level 1, A), non-incapacitating/other visible injury (level 2, B), possible injury (level 3, C), and no injury (level 4, O). Each of these crash severity levels was accounted for in modeling severity factors in this study. 2.2. Model Formation
To identify factors contributing to the crash severity for each age group, this study used the multinomial logit (MNL) modeling technique. There are numerous models used in crash severity analysis in literature. However, MNL is the most used statistical approach for establishing the significance of predictor variables in determining the outcome of response variables [24]. The MNL model does not put a restriction on the coefficient of predictor variables in different severity functions, thereby making it possible to observe the impact of a single variable on different injury outcomes [25].
The dependent variable (injury severity) was coded as a polytomous nominal response, which is suitable for the MNL model. The MNL model explains the odds of an outcome being in one injury severity category relative to the reference category, k, by assuming that the combination of independent variables is linear. As a result, the probability of each outcome is a nonlinear function of p predictor variables. The MNL model is given as:
  ln ( π 1 π k ) =   α 1 + β 11 X 1 + β 12 X 2 + + β 1 X p ,
ln ( π 2 π k ) =   α 2 + β 21 X 1 + β 22 X 2 + + β 2 p X p , . . .
ln ( π k 1 π k ) =   α ( k 1 ) + β ( k 1 ) 1 X 1 + β ( k 1 ) 2 X 2 + + β ( k 1 ) p X p ,
In which π j = P ( y = j ) is the probability of the resulting prediction being in category j, k specifies the number of dependent variables, and p provides the number of independent variables. The total of j 1 equations are solved using the repeatedly weighted least squares optimization procedure that finds the maximum likelihood estimates of the coefficient of each independent variable. The resulting coefficient provides the effects of the predictor variable on the odds of being in one injury severity category j against the selected reference category k. The resulting outcome is given as:
π j = P ( y = j ) = 1 1 + j 1 k 1 e α j + l = 1 p β j x l
The model development considered only the crashes related to motor-vehicles for all age groups. The MNL models were developed using MATLAB statistical software. The HSIS data used the KABCO scale as described earlier, and a baseline injury severity level had to be selected for the MNL. This study used the “no-injury” severity level as the baseline for the other 4 severity levels. Therefore, the MNL provided a set of four coefficients, representing the other four severely levels versus the base category (no-injury).

3. Results

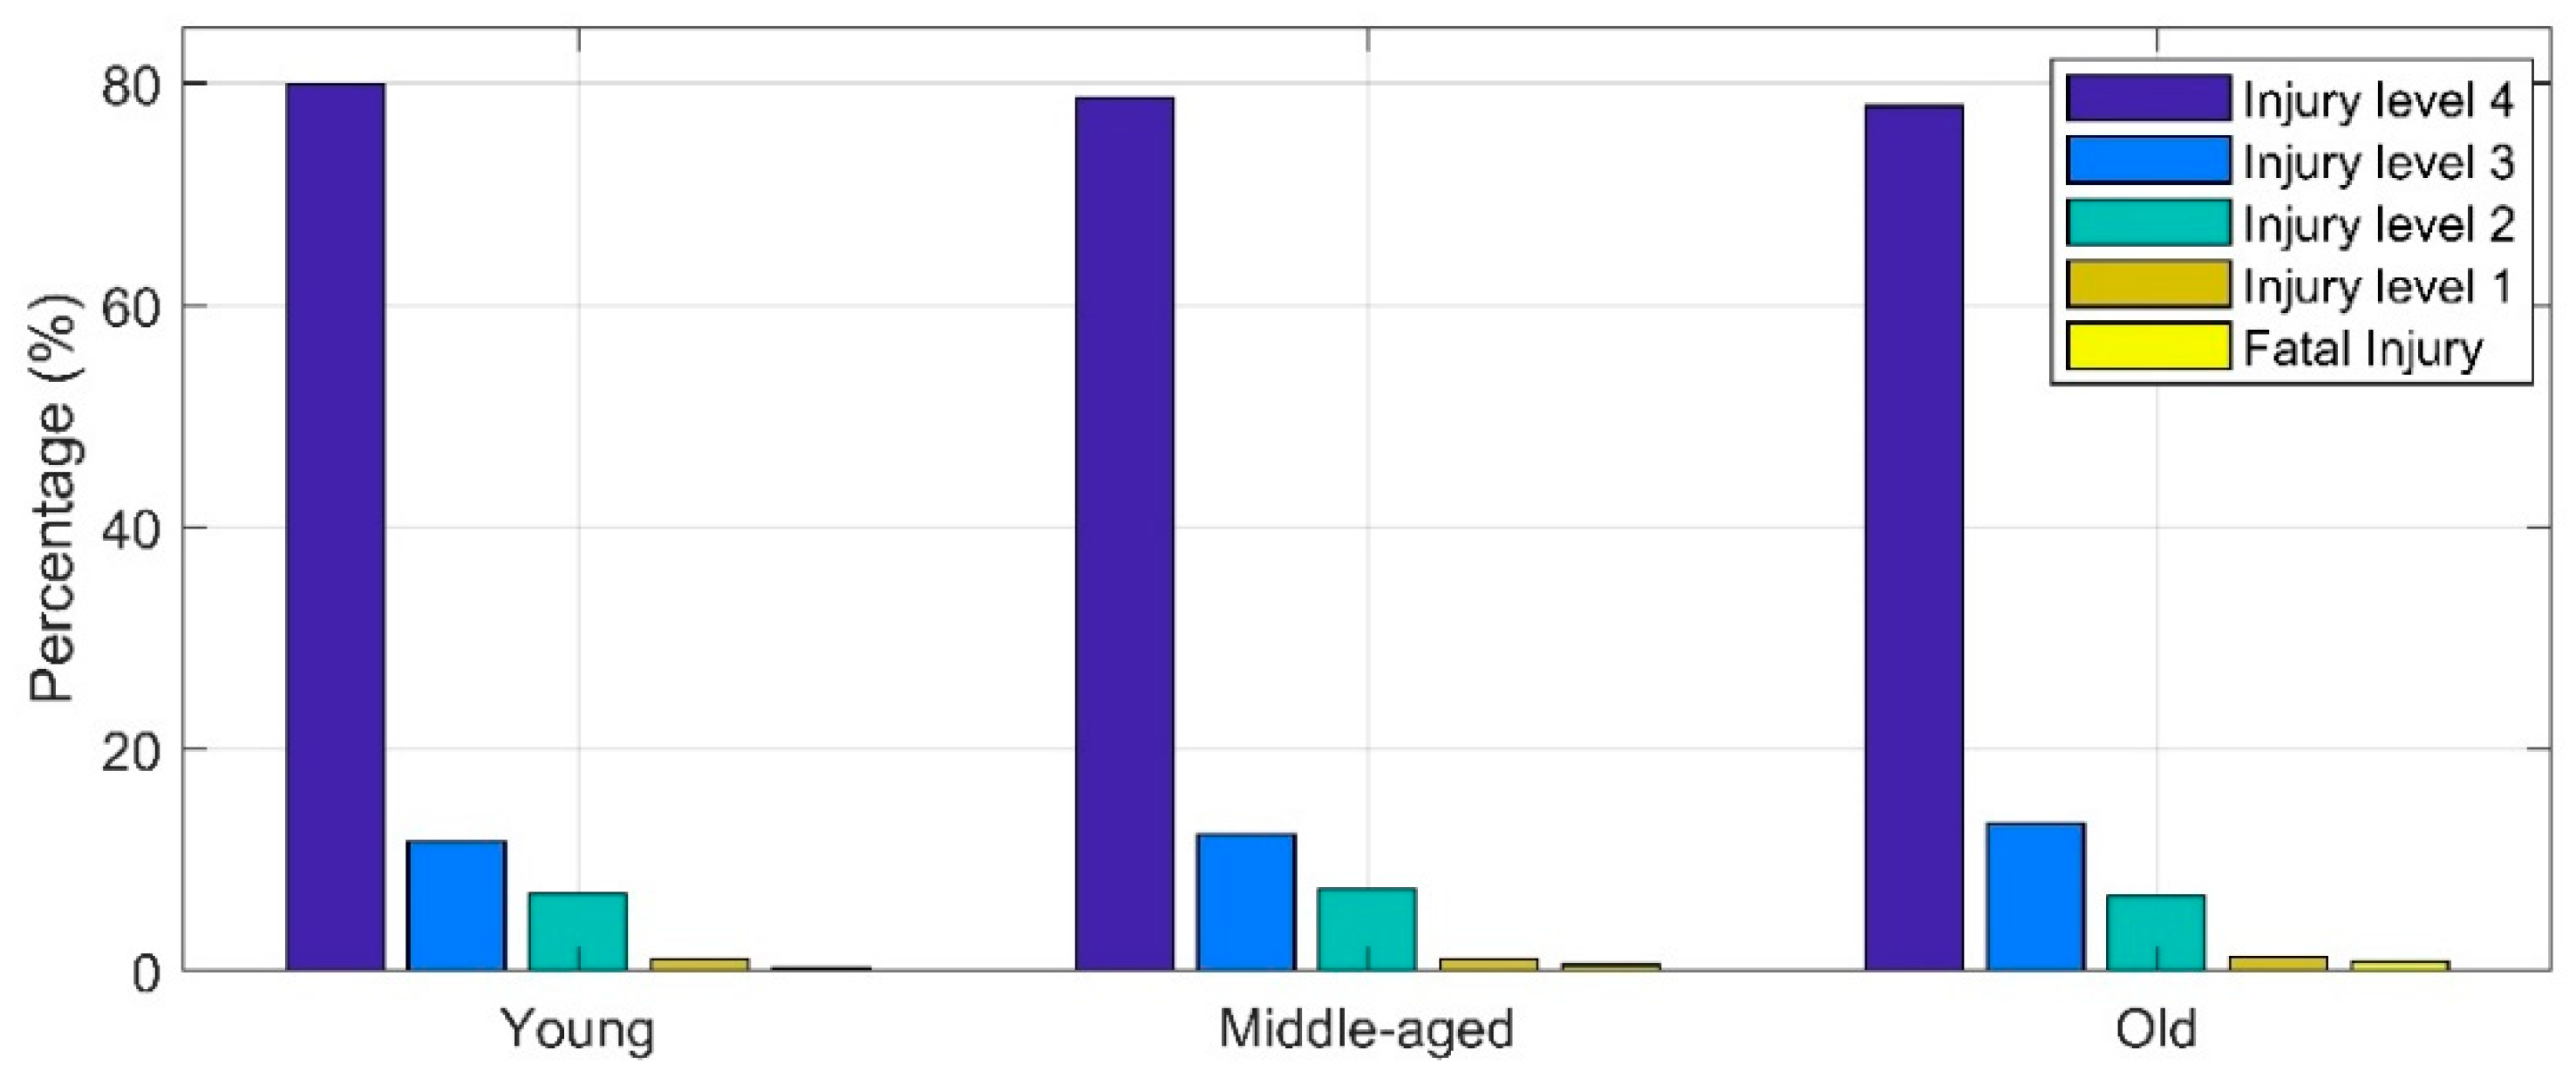
The distribution of frequency for each crash level is shown in Figure 1 for all age groups under consideration. Similar trends were observed in the crash frequency distribution for all age groups. Older drivers had a higher percentage of fatal crashes over the 10-year period compared to young drivers. They also had fewer non-incapacitating crashes compared to young and middle-aged drivers. This result is reasonable considering the frailness of the older human’s body state. Older drivers are more susceptible to external forces than other age groups, thereby resulting in more injury severity.
Table 1, Table 2 and Table 3 gives the proportions (prop.) of the categorical variables used. The tables show the frequency distribution of crash severity levels for each age group based on each of the variables. In terms of environmental factors, for young drivers, 80% of daylight crashes were no-injury crashes, while 76% of crashes in dark, street-lighted conditions were no-injury (Table 1). Similarly, middle-aged drivers had 80% no-injury crashes in daylight and 78% in dark, street-lighted conditions (Table 2). On the other hand, older drivers had 77% no-injury crashes in daylight and 79% no-injury crashes in dark, street-lighted conditions (Table 3). The same trends were observed for young and middle-aged drivers, and a different trend was observed for older drivers. Older drivers possibly take more precaution while driving at night than they do in the day. Clear weather conditions provided the highest no-injury crashes for all age groups with 78%, 79%, and 77% for young, middle-aged, and older drivers, respectively (Table 1, Table 2 and Table 3).
For roadway factors, divided and paved medians gave the highest no-injury crashes for all age groups. This is logical, as paved medians provide proper separation between two opposing traffic streams, and can reduce the risk of vehicle-to-vehicle head-on collisions, potentially reducing injury severity. Furthermore, all age groups had more injury-involved crashes on rolling terrains compared to flat terrains. When the road surface was wet, 76% of crashes were no-injury for young and middle-aged drivers (Table 1 and Table 2), while 74% were no-injury for older drivers (Table 3). This indicates that more injury-involved crashes were recorded for older drivers in such conditions.
Accident characteristics reveal that head-on collisions provided the most injury-involved crashes compared to sideswipe and rear-end. 45%, 47%, and 54% of head-on collisions had some level of injury for young, middle-aged, and older drivers, respectively. Finally, driver characteristics reveal that the nonuse of belts and left-turn maneuvers resulted in more injury for drivers. Summarily, the frequency distribution of the crashes reveals already-established facts and also point out the potential similarities for crashes involving young and middle-aged drivers. More insights can be further obtained using the modeling technique already described in the methodology section.
The modeling results for all crashes involving all age groups are provided in Table 4, Table 5, Table 6, Table 7, Table 8 and Table 9. To explore insights from these results, we will explain the effect of each variable over the injury severity outcome based on the category of the variable. The variables were already categorized into four: Driver, accident, environmental, and roadway characteristics. Each consecutive pair of tables provides the results for each age group, resulting in six tables for the three age groups.
We will explain the results in terms of the coefficient for each predictor variable, the p-value, and the odds ratio (O.R.). The coefficient values determine the weight of a specific predictor variable on the probability of a crash injury severity level relative to the baseline. The p-values signify the significance of a predictor variable in explaining a crash outcome at a specific confidence interval (C.I.). In this study, we used a C.I. of 90%. Therefore, p-value ≤0.1 denote a significant variable. The O.R. is the exponential value of the logit coefficient which states to what magnitude a unit increases in a variable affects the crash severity outcomes when all other factors are kept constant.
From applying the MNL, the resulting mathematical prediction equations are provided in Equations (5)–(7) for young, middle-aged, and older drivers, respectively. Only the mathematical equations for fatality prediction are provided here. Equations for other injury severity levels take the same form as provided by the coefficients in the table.
log [ P ( Y = F a t a l ) P ( Y = N o   I n j u r y ) ] = 1.90 + 0.11 X 1 0.03 X 3 0.12 X 5 0.04 X 6 0.10 X 8 0.07 X 9   0.34 X 13 + 0.99 X 14 + 0.69 X 15 0.27 X 17 0.46 X 20 0.39 X 21 0.08 X 22 + 0.69 X 23 + 0.23 X 25 0.16 X 26
log [ P ( Y = F a t a l ) P ( Y = N o   I n j u r y ) ] = 1.60 + 0.05 X 1 0.04 X 3 0.13 X 5 0.03 X 6 0.06 X 7 0.06 X 9   0.58 X 13 + 0.93 X 14 + 0.29 X 15 + 0.12 X 16 0.26 X 20 0.36 X 21 + 0.62 X 23 + 0.08 X 25 0.17 X 26
log [ P ( Y = F a t a l ) P ( Y = N o   I n j u r y ) ] = 1.45 0.11 X 5 0.09 X 10 0.69 X 13 + 1.27 X 14 + 0.27 X 15 + 0.41 X 16 + 0.35 X 17 + 0.39 X 18 0.16 X 22 + 0.54 X 23 0.74 X 24 + 0.13 X 25 0.42 X 26
where:
  • X 1 = Lighting (1 if daylight, 0 otherwise)
  • X 2 = Lighting (1 if dark, street lighted, 0 otherwise)
  • X 3 = Day (1 if weekend, 0 otherwise)
  • X 4 = Median type (1 if undivided, not striped, 0 otherwise)
  • X 5 = Median type (1 if undivided, striped, 0 otherwise)
  • X 6 = Median type (1 if divided, paved, 0 otherwise)
  • X 7 = Median type (1 if divided, unpaved, 0 otherwise)
  • X 8 = Terrain type (1 if flat, 0 otherwise)
  • X 9 = Terrain type (1 if flat, 0 otherwise)
  • X 10 = Roadway type (1 if urban, 0 otherwise)
  • X 11 = Functional class (1 if minor arterial, 0 otherwise)
  • X 12 = Functional class (1 if major collector, 0 otherwise)
  • X 13 = Accident type (1 if head-on, 0 otherwise)
  • X 14 = Accident type (1 if sideswipe, 0 otherwise)
  • X 15 = Accident type (1 if rear-end, 0 otherwise)
  • X 16 = Weather (1 if clear, 0 otherwise)
  • X 17 = Weather (1 if rainy, 0 otherwise)
  • X 18 = Weather (1 if cloudy, 0 otherwise)
  • X 19 = Weather (1 if windy, 0 otherwise)
  • X 20 = Road surface (1 if dry, 0 otherwise)
  • X 21 = Road surface (1 if wet, 0 otherwise)
  • X 22 = Vehicle deficiency (1 if none, 0 otherwise)
  • X 23 = Gender (1 if male, 0 otherwise)
  • X 24 = Seatbelt (1 if not used, 0 otherwise)
  • X 25 = Maneuver type (1 if left turn, 0 otherwise)
  • X 26 = Sobriety (1 if not driving under influence, 0 otherwise)
  • X 27 = Number of lanes (1 if 2 lanes, 0 otherwise)

4. Discussion

4.1. Environmental Characteristics

In terms of lighting conditions, for young drivers, daytime driving was shown to more likely result in fatal crashes compared to other possible lighting conditions, as shown in Table 4. As new drivers, young drivers tend to explore their driving ability and try to perform risky maneuvers when they have the opportunity. Additionally, less experience could be a contributing factor to this result. Even more interestingly, driving at night did not seem to have any effect on the likelihood of being involved in fatal crashes, in line with findings by Haleem and Gan [26] for drivers aged 20–24. Haghighi et al. [3] obtained similar results and stated that nighttime driving crashes are usually associated with animal collisions and are usually less severe compared to vehicle-to-vehicle collisions. This could be as a result of more cautious night driving due to reduced visibility. Relatively similar results were also obtained for middle-aged drivers, as shown in Table 6. However, the likelihood of fatal crashes was less for middle-aged drivers than for young drivers. The odds of fatal crashes were increased by a factor of 1.12 for young drivers and 1.05 for middle-aged drivers driving in daylight, as provided by the odds ratio (O.R.).
Interestingly for older drivers, lighting conditions were not a significant factor for fatality likelihood. In fact, they had no effect across all injury severity levels. This suggests that older drivers are generally more cautious across all driving periods. Ulak et al. [18] also found that factors related to visibility (such as lighting conditions) were negatively correlated with crash involvement for older drivers, possibly pointing to the reason why it was nonsignificant in this study. Weekend crashes were less severe than weekday crashes, as found in Uddin and Huynh [7].
Weather conditions provided quite interesting results. Clear, rainy, and windy weather were non-significant factors to injury severity for young drivers. Young drivers may feel more reluctant to drive under adverse conditions due to inexperience, and clear weather, on the other hand, is good for driving, thereby resulting in less likelihood of being involved in fatal crashes. These results are similar to findings in Celik and Oktay [27]. Rainy weather conditions reduced the likelihood of fatal injuries, as there is more cautious driving behavior. This translates to the fact that, although young drivers are not willing to drive under windy or adverse weather, they are willing to drive cautiously under rainy conditions. Similar observations and conclusions were made by Osman et al. in [28,29]. On the other hand, middle-aged and older drivers’ injury fatality rates were affected by the presence of clear weather conditions—for both age groups, the likelihood of fatality was increased. The increase was, however, higher for older drivers than for middle-aged drivers. The odds ratio shows that the risk of a fatality was increased by a factor of 1.13 and 1.51 for middle-aged and older drivers, respectively. Most driving activity for both age groups was usually under clear weather; it is then reasonable to assume that there was more traffic during clear conditions and possibly more crash risks.

4.2. Roadway Characteristics

Table 4, Table 5, Table 6, Table 7, Table 8 and Table 9 show that undivided and unpaved medians were not contributing factors to injury severity at all levels for all age groups. Possible reasons could be that the crashes in the HSIS database have a low number of roadways with such median type, or there are few roadways in the state of California with such median type. It is reasonable to assume that undivided unstriped roadways have lower speed limits, thereby reducing the possibility of crash involvement to the bare minimum. Furthermore, if the roadway was undivided but striped, the likelihood of fatal injury for all age groups was reduced. Similar results held for roadway segments with divided and paved median types. Xie et al. [25] also observed that crashes on roadways with medians are less likely to result in incapacitating injuries.
Flat and rolling terrains reduced the likelihood of fatal crashes for young drivers. However, a flat terrain had more fatality-likelihood reduction power (coefficient of −0.10) than a rolling terrain (coefficient of −0.07). In the case of a crash on both terrain, injury severity was likely to be higher on a rolling terrain than flat terrain. For middle-aged drivers (Table 6), flat terrain had no impact on the likelihood of fatal crashes, but it increased the likelihood of severe injury crashes. These results are similar to those found in Uddin and Huynh [7]. Older drivers were cautious drivers regardless of the terrain type, as shown in Table 8. The functional class of the roadways did not affect the likelihood of fatal injuries for all age groups; however, their effects could be seen at other levels of injury severity. Urban segments did not contribute to the likelihood of fatal crashes for young and middle-aged drivers. However, they reduced the likelihood of fatal crashes for older drivers. This could be because of more traffic control devices on urban roadways. These results were exactly as found in [24,30].
Finally, the roadway surface factor indicates that the dryness or wetness of the road had an effect on the likelihood of a fatality. Both dryness and wetness reduced the likelihood of fatal crashes for young and middle-aged drivers, similar to findings in Chen and Fan [24]. However, driving on a dry roadway surface lessened the likelihood (coefficient of −0.46) more than driving on a wet surface (coefficient of −0.39) for young drivers. Similar results were found in [31]. This indicated that even though young drivers travel carefully on wet surfaces, other factors such as tire conditions can contribute to crash probability and injury severity. Both factors did not contribute to older driver injury severity at all levels, possibly explaining earlier results that older drivers are generally cautious drivers regardless of surrounding conditions. Ulak et al. [32] obtained similar results for older drivers.

4.3. Accidents Characteristics

Three accident types were considered in this study: Rear-end, sideswipe, and head-on collisions. Results show that sideswipe and rear-end collisions increased the likelihood of being involved in a fatal crash for all age groups. Bogue et al. [33] also obtained the same results. Head-on collisions, on the other hand, reduced the likelihood of fatal crashes. This could be due to the type of objects with which the majority of the head-on collisions are. If head-on collisions are with another vehicle, they could be expected to be fatal. However, considering that most roadways are divided and paved, as shown in Table 1, Table 2 and Table 3, it is reasonable to assume that most head-on collisions were not between vehicles but rather between vehicles and objects, possibly leading to less fatalities.

4.4. Drivers’ Characteristics

Specifically, for young drivers, it appears there were strict seatbelt usage laws. The usage of the seatbelt was insignificant across all severity levels. Additionally, a male driver increased the likelihood of fatal injury, and the O.R. was the highest among all the predictor variables considered, confirming the results by Kim et al. [9]. Usually, female drivers were more cautious, and male drivers were usually aggressive, thereby translating into more severe injuries. Left-turn maneuvers increase the likelihood of a fatality, a finding also established in Shaheed et al. [34]. Not driving under the influence and a non-deficient vehicle reduced the likelihood of a fatality. Bogue et al. [33] and Wu et al. [35] also observed similar findings. For middle-aged and older drivers, male drivers increased the likelihood of fatal crashes, similar to the findings of Kim et al. [9], and left turn maneuvers were more dangerous, as they also increased the likelihood of fatal crashes. The likelihood was actually higher for older drivers, probably due to the frailness of the body. The risk of a fatal crash compared to other severity levels resulting from left-turn maneuver increased by a factor of 1.13 for older drivers and 1.09 for middle-aged drivers.

5. Conclusions

This study presents an injury severity modeling of motor-vehicle crashes in the state of California. This was done based on age groups. Three age groups were identified for the analysis: Young drivers (ages 16–24), middle-aged drivers (age 25–64) and older drivers (age above 64). The data used were obtained from the Federal Highways Administration’s Highway Safety Information System. Certain variables were selected from the data after cleaning. The data include roadway characteristics, environmental characteristics, driver characteristics, and accident characteristics.
The results showed similar trends between young and middle-aged driver injury severity outcomes. The driving behavior for both age groups tended to be similar, resulting in a closely related impact of predictors on the injury severity for both groups. Older drivers, on the other hand, had distinct results. The results showed that older drivers tend to have a regular driving behavior regardless of changes roadway characteristics. As a result of this, changes in such factors did not readily have a significant effect on the injury severity outcome. The factors that had more influence on their driving ability were accident type and weather conditions.
There are some contributions that can be directly obtained from the findings in this study. As the results indicated, environmental conditions, especially weather conditions, influence older driver crash injury severity the most. This could inform transportation professionals of the possibility of reducing older driver injury severity by providing policies that put some level of restriction on aging drivers in adverse weather and bad lighting conditions. These policies could be implemented in the form of variable message signs (VMS) that are only active during bad environmental conditions. These VMS methods would not in any way affect the driving of other age groups.
Furthermore, the study found that young and middle-aged drivers’ injury severities have very close relationships. This infers that safety-improvement strategies can be implemented for one of these age groups and have an equal impact on the other age group. Emerging transportation systems management and operations (TSMO) strategies can be directed towards the safety of young and middle-aged drivers to simultaneously reduce injury severity for both age groups.
Some limitations in this study should be considered for future exploration. First, only crashes involving motor-vehicles were considered, thereby limiting the scope of the conclusions to motor-vehicles alone. Future studies can investigate the insights that can be obtained by including crashes involving cyclists and pedestrian crashes. Secondly, the age group distribution considered three sets, but it would be interesting to perform more a micro-level analysis by having crash subsets for each age group, similar to the one performed by Ulak et al. [32] for older drivers. Thirdly, instead of the multinomial logit model utilized in this study, a more advanced modeling technique could be implemented to account for possible model or data bias. Lastly, this study used the HSIS database, which is presently being encouraged by the U.S. FHWA to be used in safety research. Other data sources can be used to perform the same analysis and compare the results. This can be a form of validation for the HSIS database.

Author Contributions

Conceptualization, A.A., J.M. (Jaqueline Masaki) and J.S.; formal analysis, A.A., J.M. (Jiaqi Ma) and J.M. (Jaqueline Masaki); methodology, A.A., J.M. (Jiaqi Ma) and J.S.; writing—original draft, A.A. and J.M. (Jaqueline Masaki); writing—review and editing, A.A., J.M. (Jiaqi Ma) and J.S.

Funding

This research received no external funding.

Acknowledgments

The authors acknowledge the Highway Safety Information Systems Laboratory for providing the data.

Conflicts of Interest

The authors declare no conflict of interest

References

  1. Lee, J.; Yasmin, S.; Eluru, N.; Abdel-Aty, M.; Cai, Q. Analysis of crash proportion by vehicle type at traffic analysis zone level: A mixed fractional split multinomial logit modeling approach with spatial effects. Accid. Anal. Prev. 2018, 111, 12–22. [Google Scholar] [CrossRef] [PubMed]
  2. Chung, Y. Injury severity analysis in taxi-pedestrian crashes: An application of reconstructed crash data using a vehicle black box. Accid. Anal. Prev. 2018, 111, 345–353. [Google Scholar] [CrossRef] [PubMed]
  3. Haghighi, N.; Liu, X.C.; Zhang, G.; Porter, R.J. Impact of roadway geometric features on crash severity on rural two-lane highways. Accid. Anal. Prev. 2018, 111, 34–42. [Google Scholar] [CrossRef] [PubMed]
  4. Haleem, K.; Alluri, P.; Gan, A. Analyzing pedestrian crash injury severity at signalized and non-signalized locations. Accid. Anal. Prev. 2015, 81, 14–23. [Google Scholar] [CrossRef] [PubMed]
  5. Cerwick, D.M.; Gkritza, K.; Shaheed, M.S.; Hans, Z. A comparison of the mixed logit and latent class methods for crash severity analysis. Anal. Methods Accid. Res. 2014, 3–4, 11–27. [Google Scholar] [CrossRef]
  6. Chen, C.; Zhang, G.; Tarefder, R.; Ma, J.; Wei, H.; Guan, H. A multinomial logit model-Bayesian network hybrid approach for driver injury severity analyses in rear-end crashes. Accid. Anal. Prev. 2015, 80, 76–88. [Google Scholar] [CrossRef] [PubMed]
  7. Uddin, M.; Huynh, N. Factors influencing injury severity of crashes involving HAZMAT trucks. Int. J. Transp. Sci. Technol. 2018, 7, 1–9. [Google Scholar] [CrossRef]
  8. Behnood, A.; Roshandeh, A.M.; Mannering, F.L. Latent class analysis of the effects of age, gender, and alcohol consumption on driver-injury severities. Anal. Methods Accid. Res. 2014, 3–4, 56–91. [Google Scholar] [CrossRef]
  9. Kim, J.K.; Ulfarsson, G.F.; Kim, S.; Shankar, V.N. Driver-injury severity in single-vehicle crashes in California: A mixed logit analysis of heterogeneity due to age and gender. Accid. Anal. Prev. 2013, 50, 1073–1081. [Google Scholar] [CrossRef]
  10. Islam, S.; Brown, J. A comparative injury severity analysis of motorcycle at-fault crashes on rural and urban roadways in Alabama. Accid. Anal. Prev. 2017, 108, 163–171. [Google Scholar] [CrossRef]
  11. Salon, D.; McIntyre, A. Determinants of pedestrian and bicyclist crash severity by party at fault in San Francisco, CA. Accid. Anal. Prev. 2018, 110, 149–160. [Google Scholar] [CrossRef]
  12. Donmez, B.; Liu, Z. Associations of distraction involvement and age with driver injury severities. J. Saf. Res. 2015, 52, 23–28. [Google Scholar] [CrossRef]
  13. Boele-Vos, M.J.; van Duijvenvoorde, K.; Doumen, M.J.A.; Duivenvoorden, C.W.A.E.; Louwerse, W.J.R.; Davidse, R.J. Crashes involving cyclists aged 50 and over in the Netherlands: An in-depth study. Accid. Anal. Prev. 2017, 105, 4–10. [Google Scholar] [CrossRef]
  14. Morgan, A.; Mannering, F.L. The effects of road-surface conditions, age, and gender on driver-injury severities. Accid. Anal. Prev. 2011, 43, 1852–1863. [Google Scholar] [CrossRef]
  15. Wu, Q.; Zhang, G.; Chen, C.; Tarefder, R.; Wang, H.; Wei, H. Heterogeneous impacts of gender-interpreted contributing factors on driver injury severities in single-vehicle rollover crashes. Accid. Anal. Prev. 2016, 94, 28–34. [Google Scholar] [CrossRef]
  16. Regev, S.; Rolison, J.J.; Moutari, S. Crash risk by driver age, gender, and time of day using a new exposure methodology. J. Saf. Res. 2018, 66, 131–140. [Google Scholar] [CrossRef]
  17. Lee, S.E.; Simons-Morton, B.G.; Klauer, S.E.; Ouimet, M.C.; Dingus, T.A. Naturalistic assessment of novice teenage crash experience. Accid. Anal. Prev. 2011, 43, 1472–1479. [Google Scholar] [CrossRef] [Green Version]
  18. Ulak, M.B.; Ozguven, E.E.; Spainhour, L.; Vanli, O.A. Spatial investigation of aging-involved crashes: A GIS-based case study in Northwest Florida. J. Transp. Geogr. 2017, 58, 71–91. [Google Scholar] [CrossRef]
  19. Braitman, K.A.; Kirley, B.B.; McCartt, A.T.; Chaudhary, N.K. Crashes of novice teenage drivers: Characteristics and contributing factors. J. Saf. Res. 2008, 39, 47–54. [Google Scholar] [CrossRef]
  20. Useche, S.A.; Alonso, F.; Montoro, L.; Esteban, C. Explaining self-reported traffic crashes of cyclists: An empirical study based on age and road risky behaviors. Saf. Sci. 2019, 113, 105–114. [Google Scholar] [CrossRef]
  21. Useche, S.A.; Alonso, F.; Montoro, L.; Tomas, J.M. When age means safety: Data to assess trends and differences on rule knowledge, risk perception, aberrant and positive road behaviors, and traffic crashes of cyclists. Data Brief 2019, 22, 627–634. [Google Scholar] [CrossRef]
  22. Deb, S.; Strawderman, L.; DuBien, J.; Smith, B.; Carruth, D.W.; Garrison, T.M. Evaluating pedestrian behavior at crosswalks: Validation of a pedestrian behavior questionnaire for the U.S. population. Accid. Anal. Prev. 2017, 106, 191–201. [Google Scholar] [CrossRef]
  23. Lombardi, D.A.; Horrey, W.J.; Courtney, T.K. Age-related differences in fatal intersection crashes in the United States. Accid. Anal. Prev. 2017, 99, 20–29. [Google Scholar] [CrossRef]
  24. Chen, Z.; Fan, W. A multinomial logit model of pedestrian-vehicle crash severity in North Carolina. Int. J. Transp. Sci. Technol. 2019, 8, 43–52. [Google Scholar] [CrossRef]
  25. Xie, Y.; Zhao, K.; Huynh, N. Analysis of driver injury severity in rural single-vehicle crashes. Accid. Anal. Prev. 2012, 47, 36–44. [Google Scholar] [CrossRef]
  26. Haleem, K.; Gan, A. Effect of driver’s age and side of impact on crash severity along urban freeways: A mixed logit approach. J. Saf. Res. 2013, 46, 67–76. [Google Scholar] [CrossRef]
  27. Çelik, A.K.; Oktay, E. A multinomial logit analysis of risk factors influencing road traffic injury severities in the Erzurum and Kars Provinces of Turkey. Accid. Anal. Prev. 2014, 72, 66–77. [Google Scholar] [CrossRef]
  28. Osman, M.; Paleti, R.; Mishra, S. Analysis of passenger-car crash injury severity in different work zone configurations. Accid. Anal. Prev. 2018, 111, 161–172. [Google Scholar] [CrossRef]
  29. Osman, M.; Paleti, R.; Mishra, S.; Golias, M.M. Analysis of injury severity of large truck crashes in work zones. Accid. Anal. Prev. 2016, 97, 261–273. [Google Scholar] [CrossRef]
  30. Lee, C.; Abdel-Aty, M. Comprehensive analysis of vehicle–pedestrian crashes at intersections in Florida. Accid. Anal. Prev. 2005, 4, 775–786. [Google Scholar] [CrossRef]
  31. Gong, L.; Fan, W. Modeling single-vehicle run-off-road crash severity in rural areas: Accounting for unobserved heterogeneity and age difference. Accid. Anal. Prev. 2017, 101, 124–134. [Google Scholar] [CrossRef]
  32. Ulak, M.B.; Ozguven, E.E.; Spainhour, L. Age-Based Stratification of Drivers to Evaluate the Effects of Age on Crash Involvement. Transp. Res. Procedia 2017, 22, 551–560. [Google Scholar] [CrossRef]
  33. Bogue, S.; Paleti, R.; Balan, L. A Modified Rank Ordered Logit model to analyze injury severity of occupants in multivehicle crashes. Anal. Methods Accid. Res. 2017, 14, 22–40. [Google Scholar] [CrossRef]
  34. Shaheed, M.S.B.; Gkritza, K.; Zhang, W.; Hans, Z. A mixed logit analysis of two-vehicle crash severities involving a motorcycle. Accid. Anal. Prev. 2013, 61, 119–128. [Google Scholar] [CrossRef]
  35. Wu, Q.; Chen, F.; Zhang, G.; Liu, X.C.; Wang, H.; Bogus, S.M. Mixed logit model-based driver injury severity investigations in single- and multi-vehicle crashes on rural two-lane highways. Accid. Anal. Prev. 2014, 72, 105–115. [Google Scholar] [CrossRef]
Figure 1. Crash injury-severity distribution for both all groups from 2005 to 2014.
Safety 05 00048 g001
Table 1. Frequency distribution for crash severity involving young drivers.
CBAKO
VariableCountProp.CountProp.CountProp.CountProp.CountProp.
Environmental Characteristics
Lighting
Daylight13,1940.1274940.078940.012360.0089,4150.80
Dark, street lighted33530.1228240.104090.011360.0021,0700.76
Weather
Clear15,9150.1211,1670.0816850.015810.00104,0000.78
Rainy11240.148040.10760.01220.0058480.74
Cloudy39300.1227680.094030.011340.0024,9070.77
Windy50.1170.1500.0000.00350.74
Roadway Characteristics
Median type
Undivided, Not striped240.13170.0920.0110.011440.77
Undivided, striped43470.1436440.127380.022990.0122,2830.71
Div., Paved70130.1242320.075110.011580.0048,3370.80
Div. Unpaved50720.1239350.095510.011660.0033,0380.77
Terrain
Flat14,1470.1290900.0812110.014220.0094,1670.79
Rolling51070.1240670.106930.022240.0130,9470.75
Roadway type
Urban13,3770.1285500.0710890.013120.0091,6090.80
Functional class
Min. Arterial29520.1424540.114710.021900.0115,7240.72
Major Coll.3970.142900.11520.02290.0119750.72
2 lanes43350.1435920.117150.022870.0122,6210.72
Road surface
Dry18,1030.1212,8220.0819290.016600.00119,0000.78
Wet28800.1319570.092550.01850.0016,4520.76
Accident Characteristics
Head-on5470.174900.152650.081260.0417790.55
Sideswipe20510.0812000.041180.00210.0023,5130.87
Rear-end73310.1022070.031930.00670.0062,1280.86
Driver Characteristics
Belt (None)170.15120.1010.0100.00850.74
Left turn6040.142910.07410.0160.0033960.78
Male86250.0985660.0913060.015140.0177,3040.80
Not DUI19,4340.1210,8800.0713330.013080.00125,0000.80
No deficiency20,2890.1214,3550.0921150.017200.001.30E+050.78
Table 2. Frequency distribution for crash severity involving middle-aged drivers.
CBAKO
VariableCountProp.CountProp.CountProp.CountProp.CountProp.
Environmental Characteristics
Lighting
Daylight34,1940.1412,3140.0519910.016980.00200,5900.80
Dark, street lighted57090.1329100.075750.012050.0033,9330.78
Weather
Clear35,7150.1315,6740.0630350.0111830.00215,2500.79
Rainy23980.1710490.071520.01350.0010,7160.75
Cloudy92340.1437820.066870.012800.0049,9530.78
Windy140.1340.0440.0400.00840.79
Roadway Characteristics
Median type
Undivided, Not striped460.15240.0860.0220.012250.74
Undivided, striped95690.1557890.0915690.036480.0144,5010.72
Div., Paved16,7640.1357280.048320.012780.00105,2400.82
Div., Unpaved10,5870.1450540.079080.013830.0060,0010.78
Terrain
Flat31,7500.1312,1710.0520860.018280.00192,8900.80
Rolling11,4630.1457940.0712520.024660.0160,6500.76
Roadway type
Urban31,4610.1311,5410.0517450.016260.00192,7200.81
Functional class
Min. Arterial64870.1537540.099890.023900.0130,4330.72
Major Coll.7500.154150.081080.02370.0136240.73
2 lanes94860.1555860.0914810.026260.0144,8320.72
Road surface
Dry40,9760.1317,7770.0634250.0113430.00245,5700.79
Wet62860.1626490.074400.011610.0029,4970.76
Accident Characteristics
Head-on14410.219080.145290.083060.0535280.53
Sideswipe50200.0819440.032450.00780.0056,8790.89
Rear-end23,5530.1440140.025190.001410.00140,5700.83
Driver Characteristics
Belt (None)350.13130.0530.0100.002090.80
Left turn14100.164400.05790.01140.0066930.78
Male19,9720.1011,7200.0623620.0110340.01158,6300.82
Not DUI45,0100.1415,4800.0525110.016740.00259,2100.80
No deficiency45,7320.1419,9020.0637620.0114620.00266,0500.79
Table 3. Frequency distribution for crash severity involving older drivers.
CBAKO
VariableCountProp.CountProp.CountProp.CountProp.CountProp.
Environmental Characteristics
Lighting
Daylight37770.1323140.084090.012820.0122,2200.77
Dark, street lighted3590.131900.07270.01230.0122460.79
Weather
Clear36380.1322530.084060.012970.0122,0890.77
Rainy1750.16800.07210.0260.018180.74
Cloudy7710.135080.09940.02680.0143610.75
Windy00.0020.1400.0000.00120.86
Roadway Characteristics
Median type
Undivided, Not striped70.1690.2100.0000.00270.63
Undivided, striped14080.1411740.122870.031950.0269030.69
Divided, Paved12800.135420.05490.00560.0181070.81
Divided Unpaved9530.126530.081060.01830.0160680.77
Terrain
Flat27010.1314060.072210.011620.0116,9890.79
Rolling13660.149700.101910.021430.0173750.73
Roadway type
Urban27070.1312970.061570.011320.0116,6270.79
Functional class
Min. Arterial9570.147710.111870.031280.0248280.70
Major Coll.1080.15560.08120.0250.015320.75
2 lanes13830.1411520.122770.031920.0269550.70
Road surface
Dry41080.1325590.084640.013320.0124,9210.77
Wet4720.152660.09520.02340.0122910.74
Accident Characteristics
Head-on2130.211700.17700.07840.084660.46
Sideswipe4290.062700.04420.01210.0066450.90
Rear-end20250.146090.04580.00470.0011,6800.81
Driver Characteristics
Belt (None)70.2500.0010.0400.00200.71
Left turn3070.151940.09360.02180.0115210.73
Male23090.1117240.082930.012400.0117,2100.79
Not DUI45380.1327040.084650.012740.0126,4940.77
No deficiency44420.1327590.085160.023660.0125,9730.76
Table 4. Modeling results for young drivers.
VariablesFatalInjury Level 1Injury Level 2Injury Level 3
Coef.P-ValCoef.P-ValCoef.P-ValCoef.P-Val
Intercept1.900.00−3.650.00−1.250.000.900.00
Lighting (daylight)0.110.00−0.490.00−0.340.00−0.060.02
Lighting (dark, street lighted)0.020.37−0.540.00−0.330.00−0.110.00
Day of week (weekend)−0.030.04−0.0680.23−1.010.60−0.480.16
Median (Undivided, unstriped)0.000.99−0.680.52−1.010.18−0.480.14
Median (Undivided, striped)−0.120.000.280.100.190.060.001.00
Median (Divided, Paved)−0.040.03−0.01−0.95−0.040.54−0.040.21
Median (Divided, Not paved)0.010.790.030.790.120.10−0.280.02
Terrain (Flat)−0.100.000.090.50−0.160.04−0.200.00
Terrain (Rolling)−0.070.020.130.330.050.54−0.100.02
Urban0.020.27−0.580.00−0.240.00−0.070.01
Functional class (Min. Arterial)0.010.84−0.220.09−0.200.01−0.070.13
Functional class (Major Coll.)−0.040.52−0.230.30−0.480.00−0.220.01
Accident type (Head-on)−0.340.001.680.001.290.00−0.030.68
Accident type (Sideswipe)0.990.00−1.060.00−0.630.00−0.380.00
Accident type (Rear-end)0.690.00−1.000.00−1.330.00−1.000.00
Weather (Clear)−0.050.530.150.68−0.190.34−0.120.29
Weather (Rainy)−0.230.01−0.330.44−0.490.040.030.81
Weather (Cloudy)−0.060.490.130.71−0.170.40−0.070.55
Weather (Windy)0.240.63−17.81.00−19.31.000.400.51
Road surface (Dry)−0.460.002.250.030.970.000.130.27
Road surface (Wet)−0.390.002.110.040.710.02−0.110.38
None−0.080.04−0.0080.70−0.040.710.010.82
Gender (Male)0.690.000.710.000.450.000.510.00
Seatbelt (None)−0.310.25−17.91.00−0.540.60−0.040.91
Maneuver (Left turn)0.230.00−1.660.00−0.820.00−0.550.00
Sobriety (Not DUI)−0.160.00−2.350.00−1.610.00−1.170.00
No of lanes (2)−0.060.120.090.580.090.340.000.93
Table 5. Odds ratio for young drivers.
VariablesFatalInjury Level 1Injury Level 2Injury Level 3
Intercept6.680.030.292.47
Lighting (daylight)1.120.610.710.94
Lighting (dark, street lighted)1.020.590.720.90
Day of week (weekend)0.970.911.031.03
Median (Undivided, unstriped)1.000.510.360.62
Median (Undivided, striped)0.891.321.211.00
Median (Divided, Paved)0.960.990.960.96
Median (Divided, Not paved)1.011.031.131.08
Terrain (Flat)0.911.090.850.82
Terrain (Rolling)0.931.131.050.91
Urban1.020.560.790.93
Functional class (Min. Arterial)1.010.800.820.94
Functional class (Major Coll.)0.960.790.620.80
Accident type (Head-on)0.725.363.620.97
Accident type (Sideswipe)2.700.350.530.69
Accident type (Rear-end)1.990.370.270.37
Weather (Clear)0.951.160.820.89
Weather (Rainy)0.790.720.611.03
Weather (Cloudy)0.941.140.840.93
Weather (Windy)1.270.000.001.50
Road surface (Dry)0.639.482.641.14
Road surface (Wet)0.688.252.030.90
None0.930.920.961.01
Gender (Male)1.992.031.571.66
Seatbelt (None)0.730.000.580.96
Maneuver (Left turn)1.260.190.440.58
Sobriety (Not DUI)0.850.090.200.31
No of lanes (2)0.951.091.101.00
Table 6. Modeling results for middle-aged drivers.
VariablesFatalInjury Level 1Injury Level 2Injury Level 3
Coef.P-ValCoef.P-ValCoef.P-ValCoef.P-Val
Intercept1.600.00−1.910.00−1.200.000.460.00
Lighting (daylight)0.050.00−0.310.00−0.360.00−0.120.00
Lighting (dark, street lighted)0.000.80−0.510.00−0.240.00−0.170.00
Day of week (weekend)−0.040.00−0.010.850.020.590.050.01
Median (Undivided, unstriped)−0.060.70−0.620.41−0.160.73−0.330.21
Median (Undivided, striped)−0.130.000.340.000.390.000.070.06
Median (Divided, Paved)−0.030.02−0.0020.860.000.96−0.040.07
Median (Divided, Not paved)−0.060.000.390.000.190.000.060.02
Terrain (Flat)−0.030.110.180.030.040.50−0.110.00
Terrain (Rolling)−0.060.010.060.480.090.09−0.060.04
Urban0.000.00−0.510.00−0.420.00−0.130.00
Functional class (Min. Arterial)−0.020.00−0.400.00−0.210.00−0.130.00
Functional class (Major Coll.)0.020.00−0.700.00−0.320.01−0.170.01
Accident type (Head-on)−0.580.001.450.000.940.00−0.140.00
Accident type (Sideswipe)0.930.00−0.860.00−0.810.00−0.570.00
Accident type (Rear-end)0.290.00−1.670.00−1.520.00−1.350.00
Weather (Clear)0.120.020.100.640.320.040.200.02
Weather (Rainy)−0.010.89−0.600.040.130.470.190.04
Weather (Cloudy)0.070.180.060.790.230.160.130.14
Weather (Windy)0.310.30−18.61.001.370.02−0.430.46
Road surface (Dry)−0.260.000.640.010.380.010.150.05
Road surface (Wet)−0.360.000.390.130.060.68−0.050.51
None−0.030.19−0.100.47−0.020.800.100.01
Gender (Male)0.620.000.720.000.510.000.460.00
Seatbelt (None)0.060.75−18.81.00−0.040.95−0.220.51
Maneuver (Left turn)0.080.01−1.750.00−0.970.00−0.720.00
Sobriety (Not DUI)−0.170.00−2.490.00−1.680.00−1.300.00
No of lanes (2)−0.030.160.270.010.050.50−0.020.69
Table 7. Odds ratio for middle-aged drivers.
VariablesFatalInjury Level 1Injury Level 2Injury Level 3
Intercept4.960.150.301.58
Lighting (daylight)1.050.730.700.88
Lighting (dark, street lighted)1.010.600.780.84
Day of week (weekend)0.960.991.021.05
Median (Undivided, unstriped)0.940.540.860.72
Median (Undivided, striped)0.881.401.481.08
Median (Divided, Paved)0.970.981.000.96
Median (Divided, Not paved)0.941.471.211.07
Terrain (Flat)0.971.201.040.89
Terrain (Rolling)0.951.061.100.94
Urban0.950.600.660.88
Functional class (Min. Arterial)0.980.670.810.88
Functional class (Major Coll.)1.020.500.730.85
Accident type (Head-on)0.564.262.570.87
Accident type (Sideswipe)2.540.420.450.56
Accident type (Rear-end)1.330.190.220.26
Weather (Clear)1.131.111.381.22
Weather (Rainy)0.990.551.141.21
Weather (Cloudy)1.081.061.261.14
Weather (Windy)1.360.003.940.65
Road surface (Dry)0.771.891.461.16
Road surface (Wet)0.701.481.070.95
None0.970.910.981.11
Gender (Male)1.852.051.671.58
Seatbelt (None)1.060.000.960.80
Maneuver (Left turn)1.090.170.380.49
Sobriety (Not DUI)0.840.080.190.27
No of lanes (2)0.971.311.050.98
Table 8. Modeling results for older drivers.
VariablesFatalInjury Level 1Injury Level 2Injury Level 3
Coef.P-ValCoef.P-ValCoef.P-ValCoef.P-Val
Intercept1.450.00−0.930.13−1.180.04−0.110.72
Lighting (daylight)−0.020.70−0.090.54−0.160.210.040.60
Lighting (dark, street lighted)0.000.96−0.380.14−0.380.11−0.050.69
Day of week (weekend)0.010.790.040.74−0.120.250.050.41
Median (Undivided, unstriped)−0.300.50−21.31.00−1.81.000.330.52
Median (Undivided, striped)−0.110.090.380.090.270.120.190.04
Median (Divided, Paved)−0.030.500.0200.36−0.600.00−0.070.40
Median (Divided, Not paved)0.010.790.600.000.040.820.200.01
Terrain (Flat)−0.010.900.010.93−0.080.58−0.110.015
Terrain (Rolling)−0.050.350.110.50−0.090.51−0.050.054
Urban−0.090.03−0.550.00−0.750.00−0.280.00
Functional class (Min. Arterial)−0.040.54−0.270.10−0.300.02−0.180.02
Functional class (Major Coll.)−0.080.51−1.470.00−0.980.00−0.670.00
Accident type (Head-on)−0.690.001.300.000.570.00−0.130.22
Accident type (Sideswipe)1.270.00−0.610.01−0.340.05−0.280.00
Accident type (Rear-end)0.270.00−1.320.00−1.550.00−1.030.00
Weather (Clear)0.410.010.520.290.510.260.410.09
Weather (Rainy)0.350.06−0.470.480.800.130.180.52
Weather (Cloudy)0.390.010.540.270.620.170.450.06
Weather (Windy)23.411.002.671.002.401.0023.61.00
Road surface (Dry)0.000.98−0.120.760.270.450.200.35
Road surface (Wet)−0.110.51−0.250.55−0.150.0700.020.94
None−0.160.040.330.310.630.040.070.57
Gender (Male)0.540.000.430.000.210.030.420.00
Seatbelt (None)−0.740.10−21.61.000.060.95−23.41.00
Maneuver (Left turn)0.130.07−0.860.00−0.490.01−0.300.00
Sobriety (Not DUI)−0.420.00−2.550.00−1.550.00−0.800.00
No of lanes (2)0.040.540.350.090.130.430.120.21
Table 9. Odds ratio for older drivers.
VariablesFatalInjury Level 1Injury Level 2Injury Level 3
Intercept4.250.390.310.90
Lighting (daylight)0.980.910.851.04
Lighting (dark, street lighted)1.000.680.680.96
Day of week (weekend)1.101.040.881.05
Median (Undivided, unstriped)0.74.0000.001.39
Median (Undivided, striped)0.901.461.311.21
Median (Divided, Paved)0.971.220.550.94
Median (Divided, Not paved)1.011.831.041.22
Terrain (Flat)0.991.010.930.89
Terrain (Rolling)0.951.120.920.95
Urban0.910.580.470.76
Functional class (Min. Arterial)0.970.770.740.84
Functional class (Major Coll.)0.930.230.370.51
Accident type (Head-on)0.503.681.760.87
Accident type (Sideswipe)3.580.550.710.76
Accident type (Rear-end)1.310.270.210.36
Weather (Clear)1.511.681.661.50
Weather (Rainy)1.420.622.231.20
Weather (Cloudy)1.481.721.871.58
Weather (Windy)14.714.411.018.3
Road surface (Dry)1.000.891.311.22
Road surface (Wet)0.900.780.861.02
None0.851.381.871.07
Gender (Male)1.721.531.231.53
Seatbelt (None)0.480.001.070.00
Maneuver (Left turn)1.130.420.610.74
Sobriety (Not DUI)0.660.080.210.45
No of lanes (2)1.041.421.141.12

