Experience as a Safety Factor in Driving; Methodological Considerations in a Sample of Bus Drivers


Abstract
1. Introduction
2. Materials and Methods
2.1. Data
2.2. Analysis
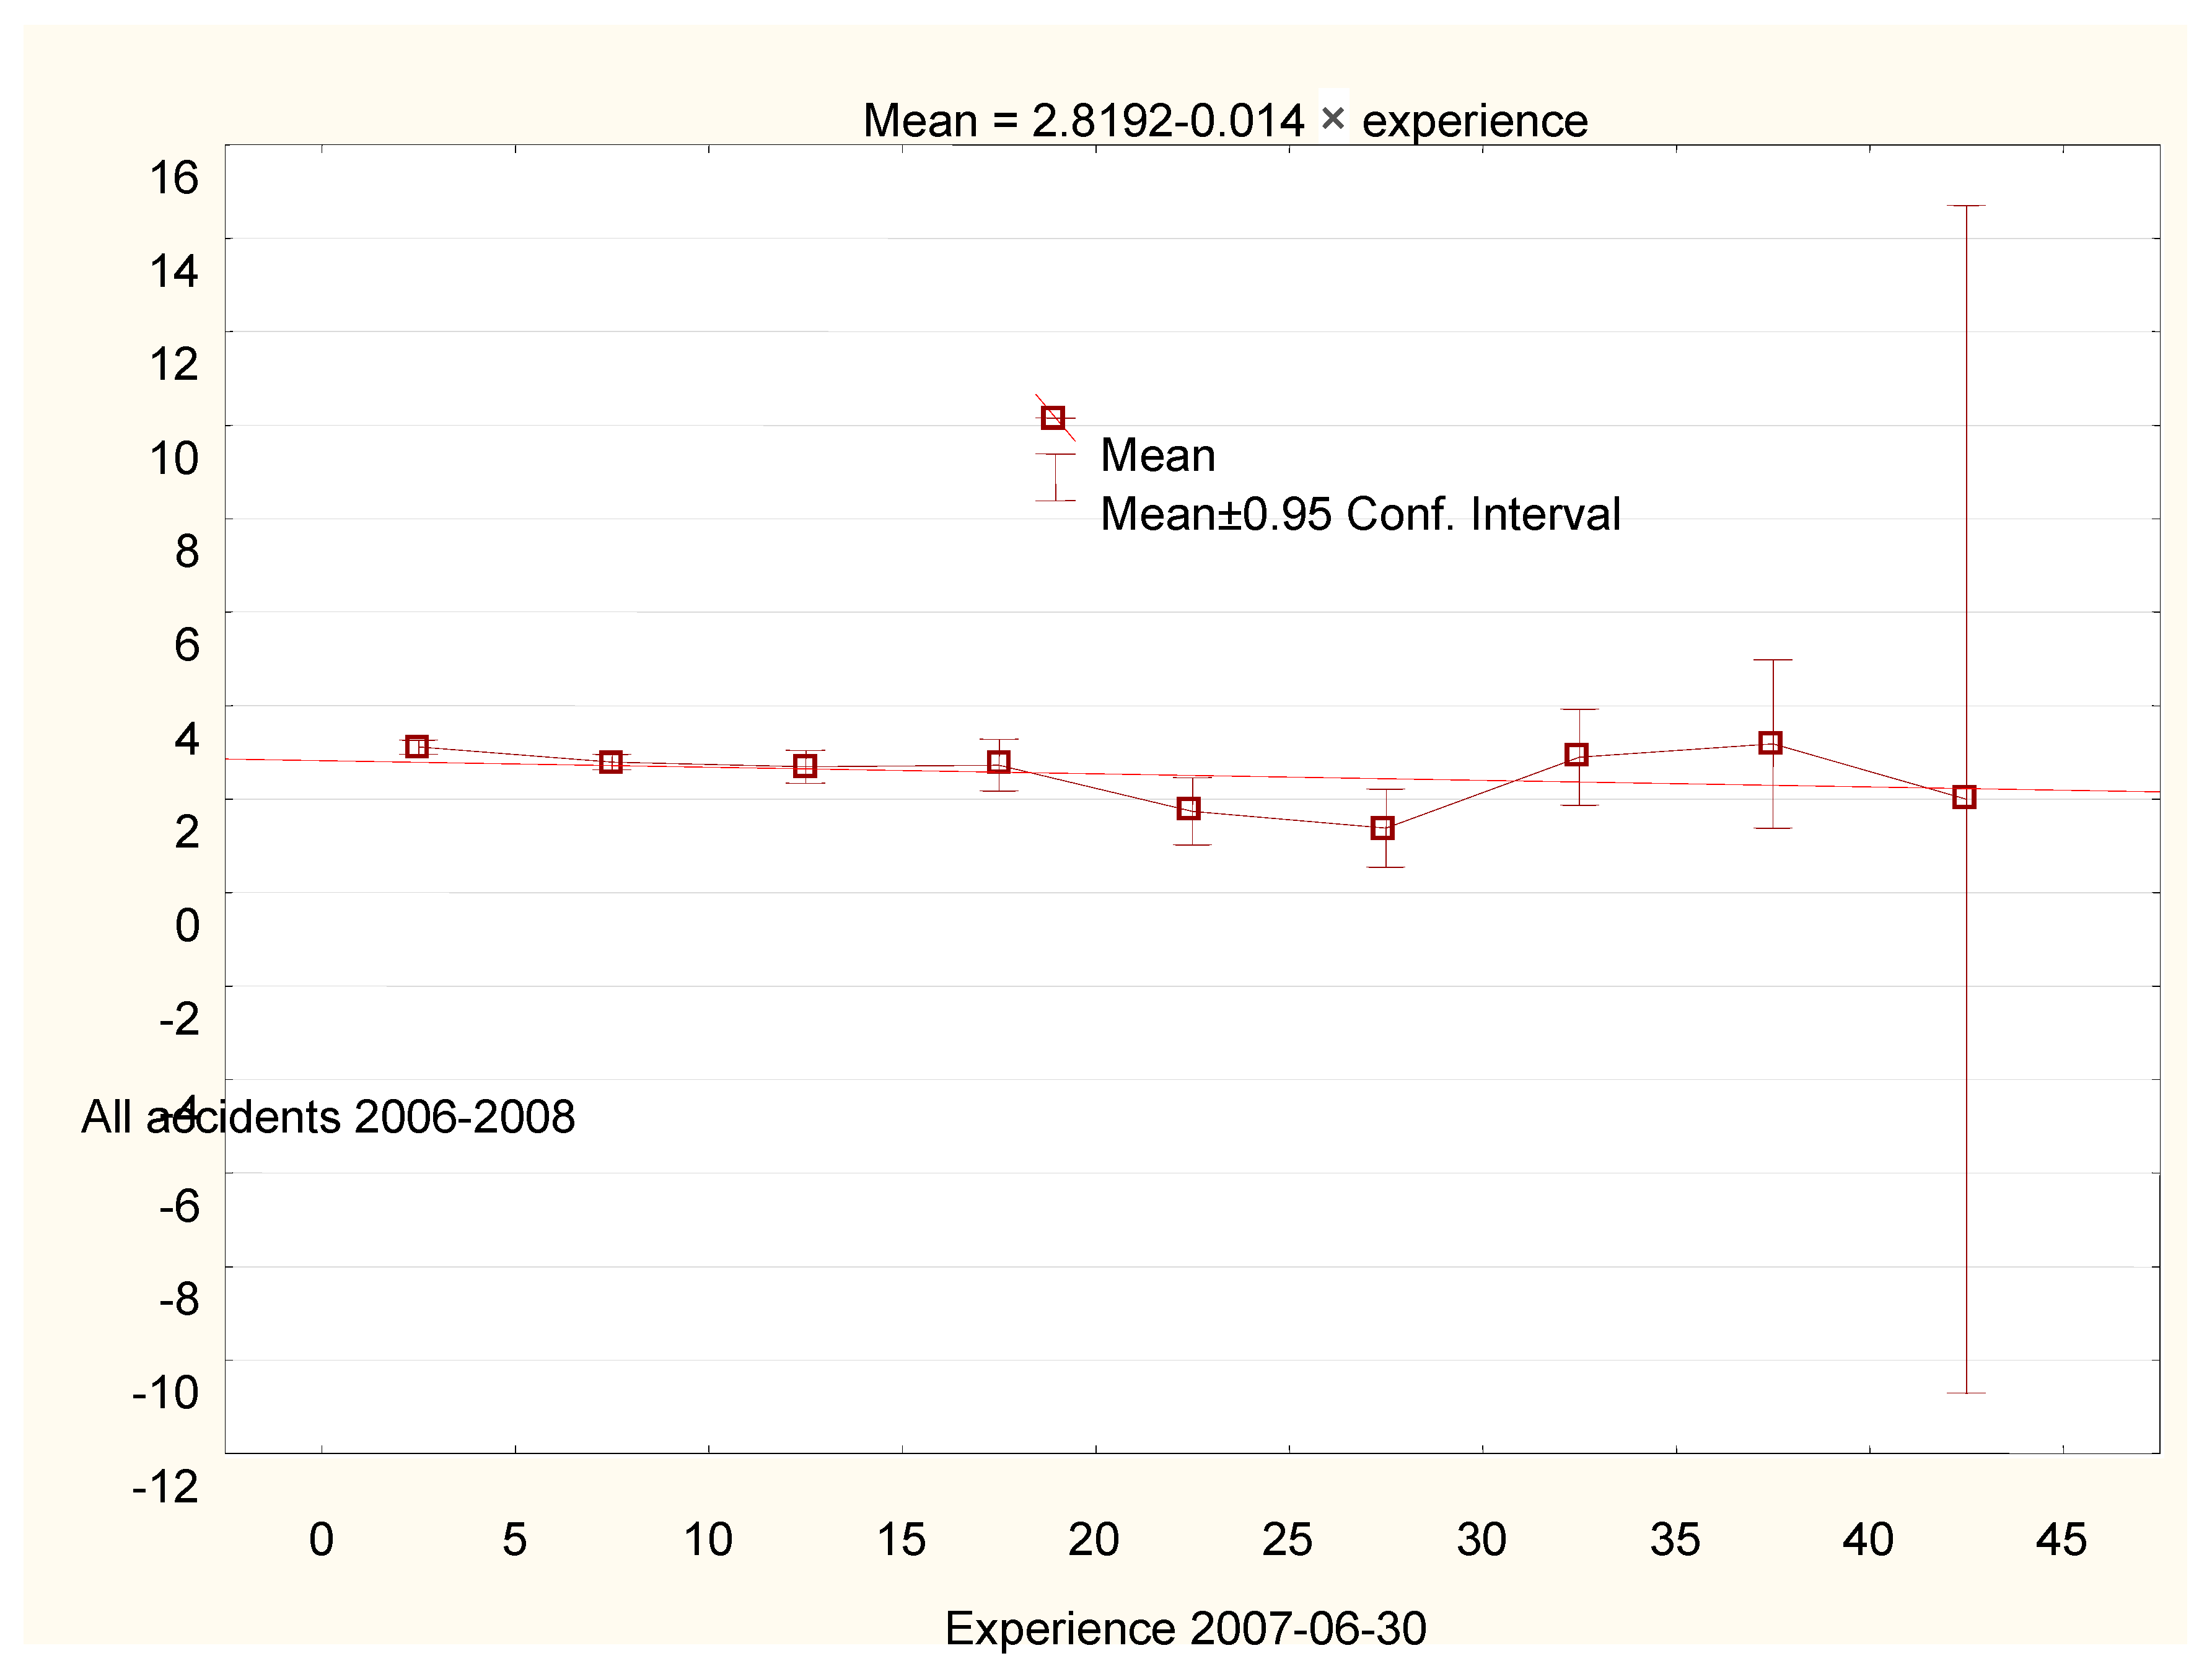
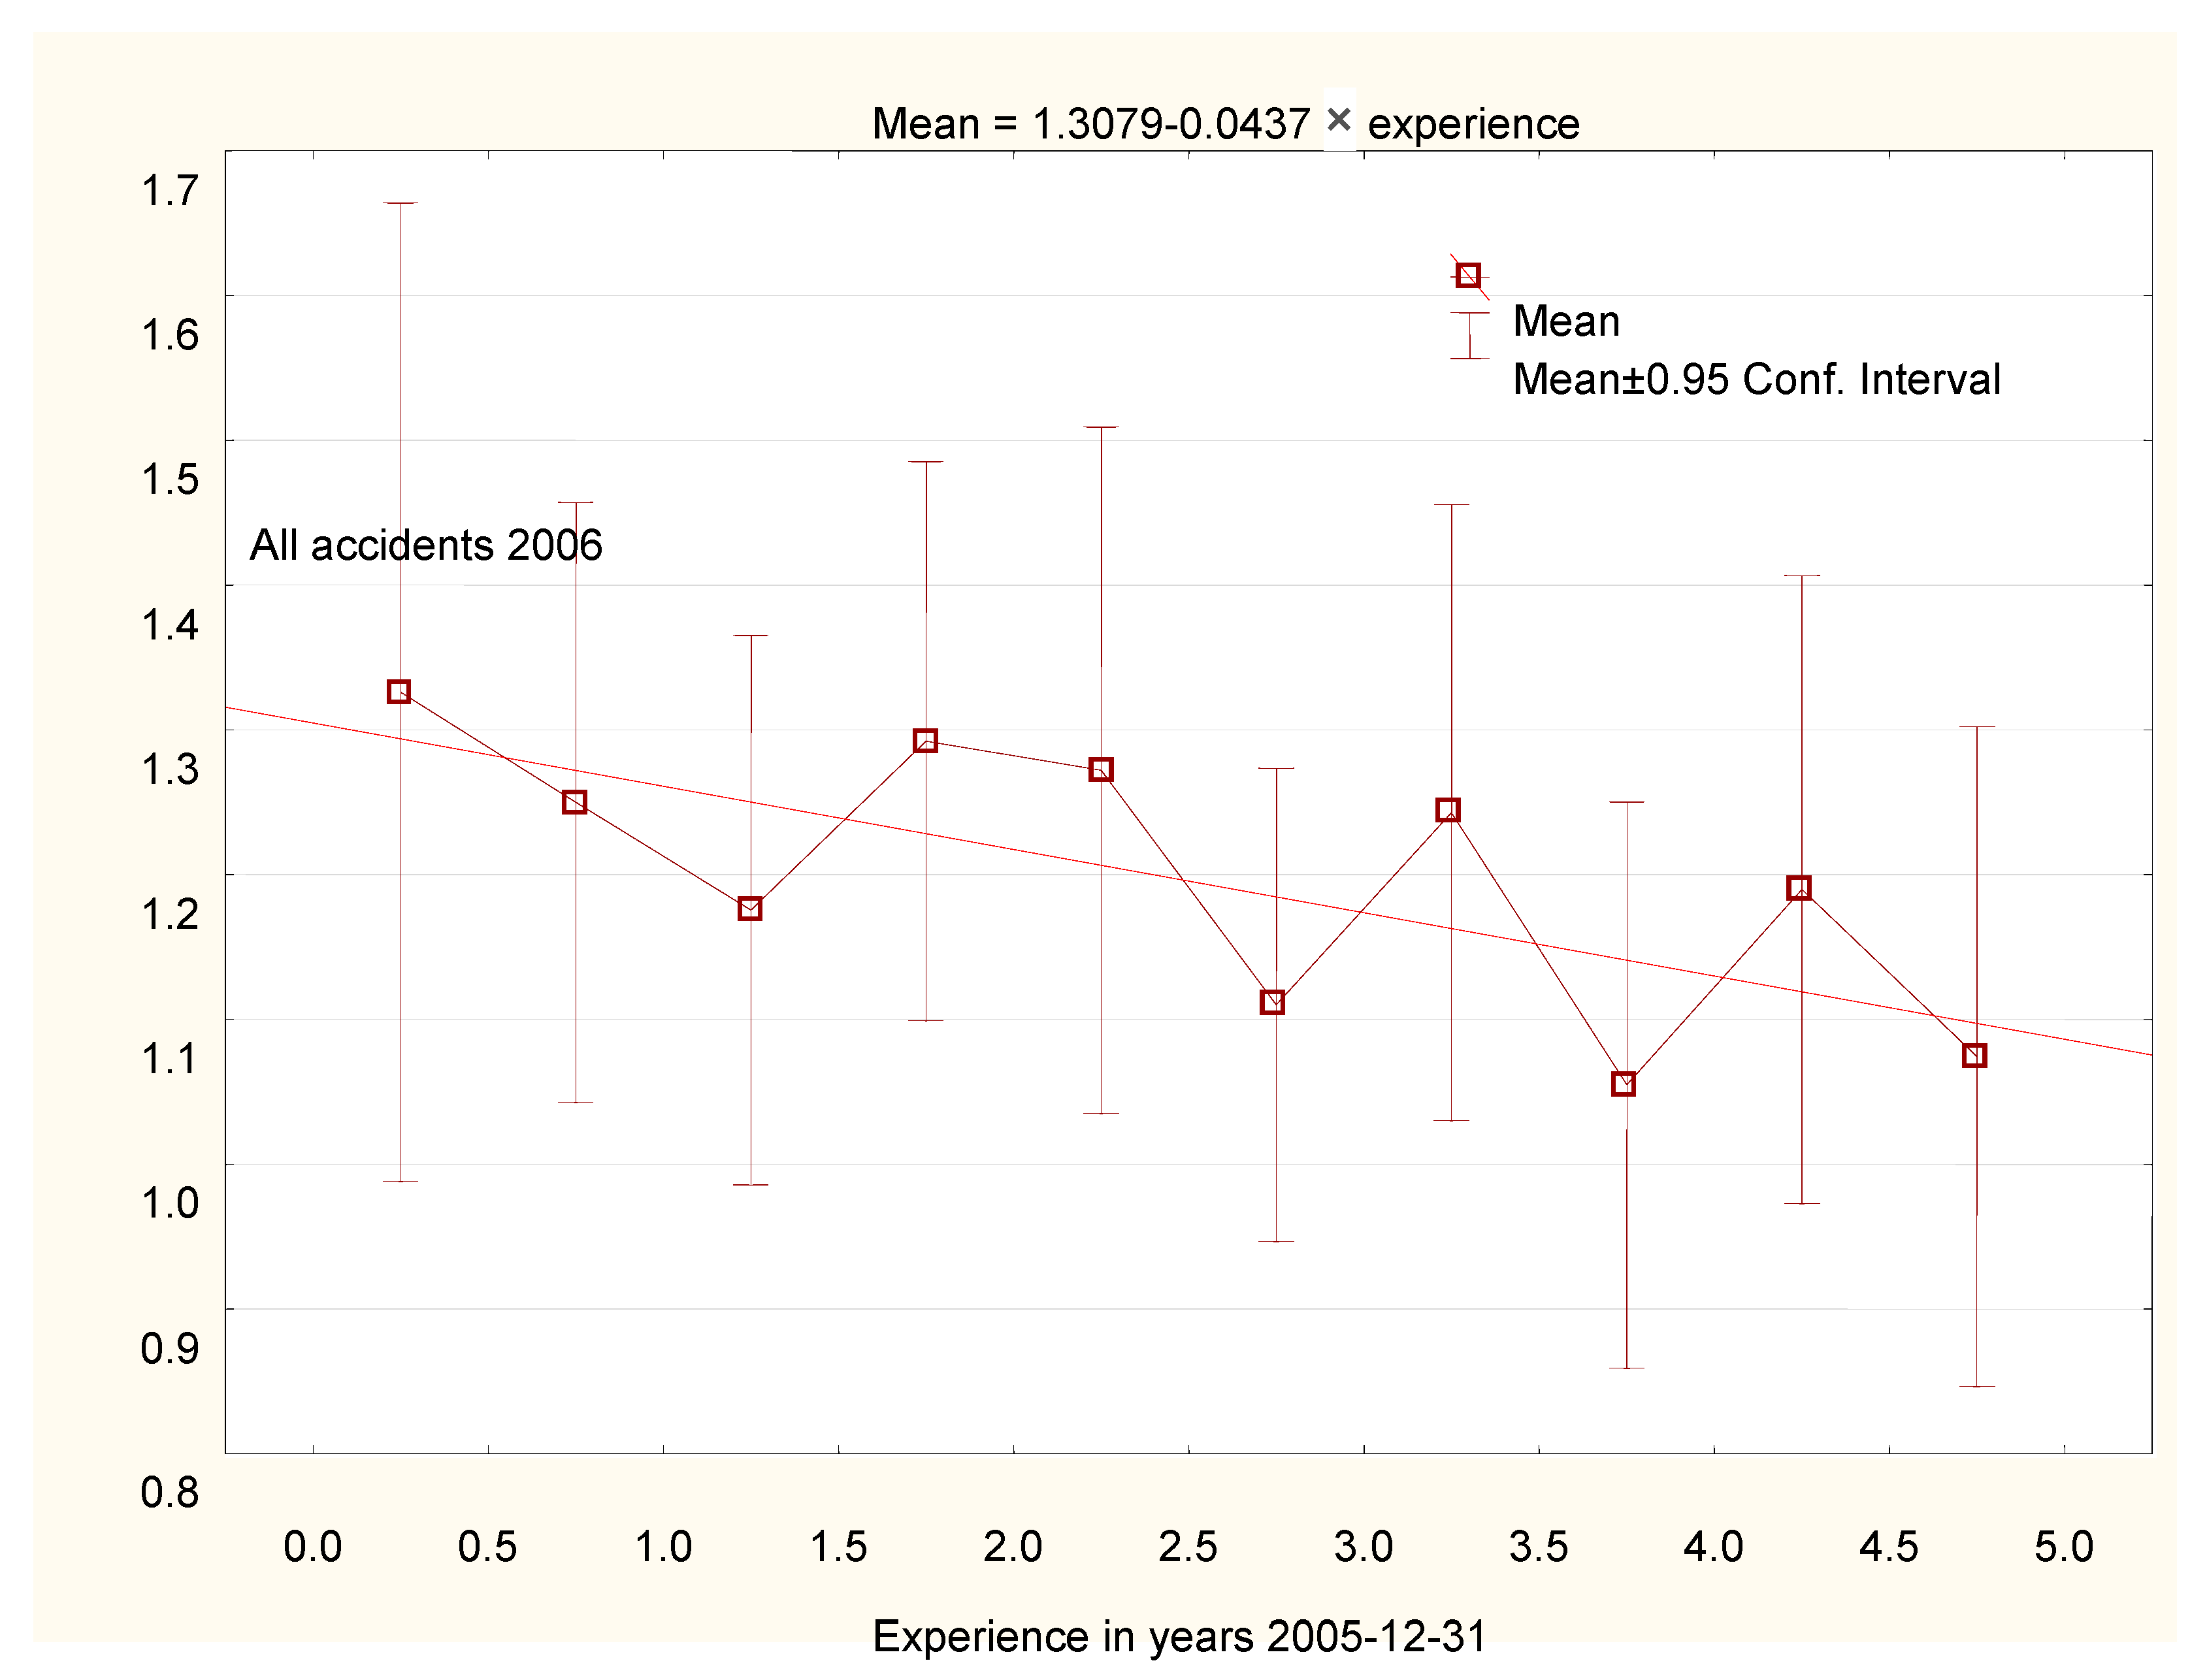
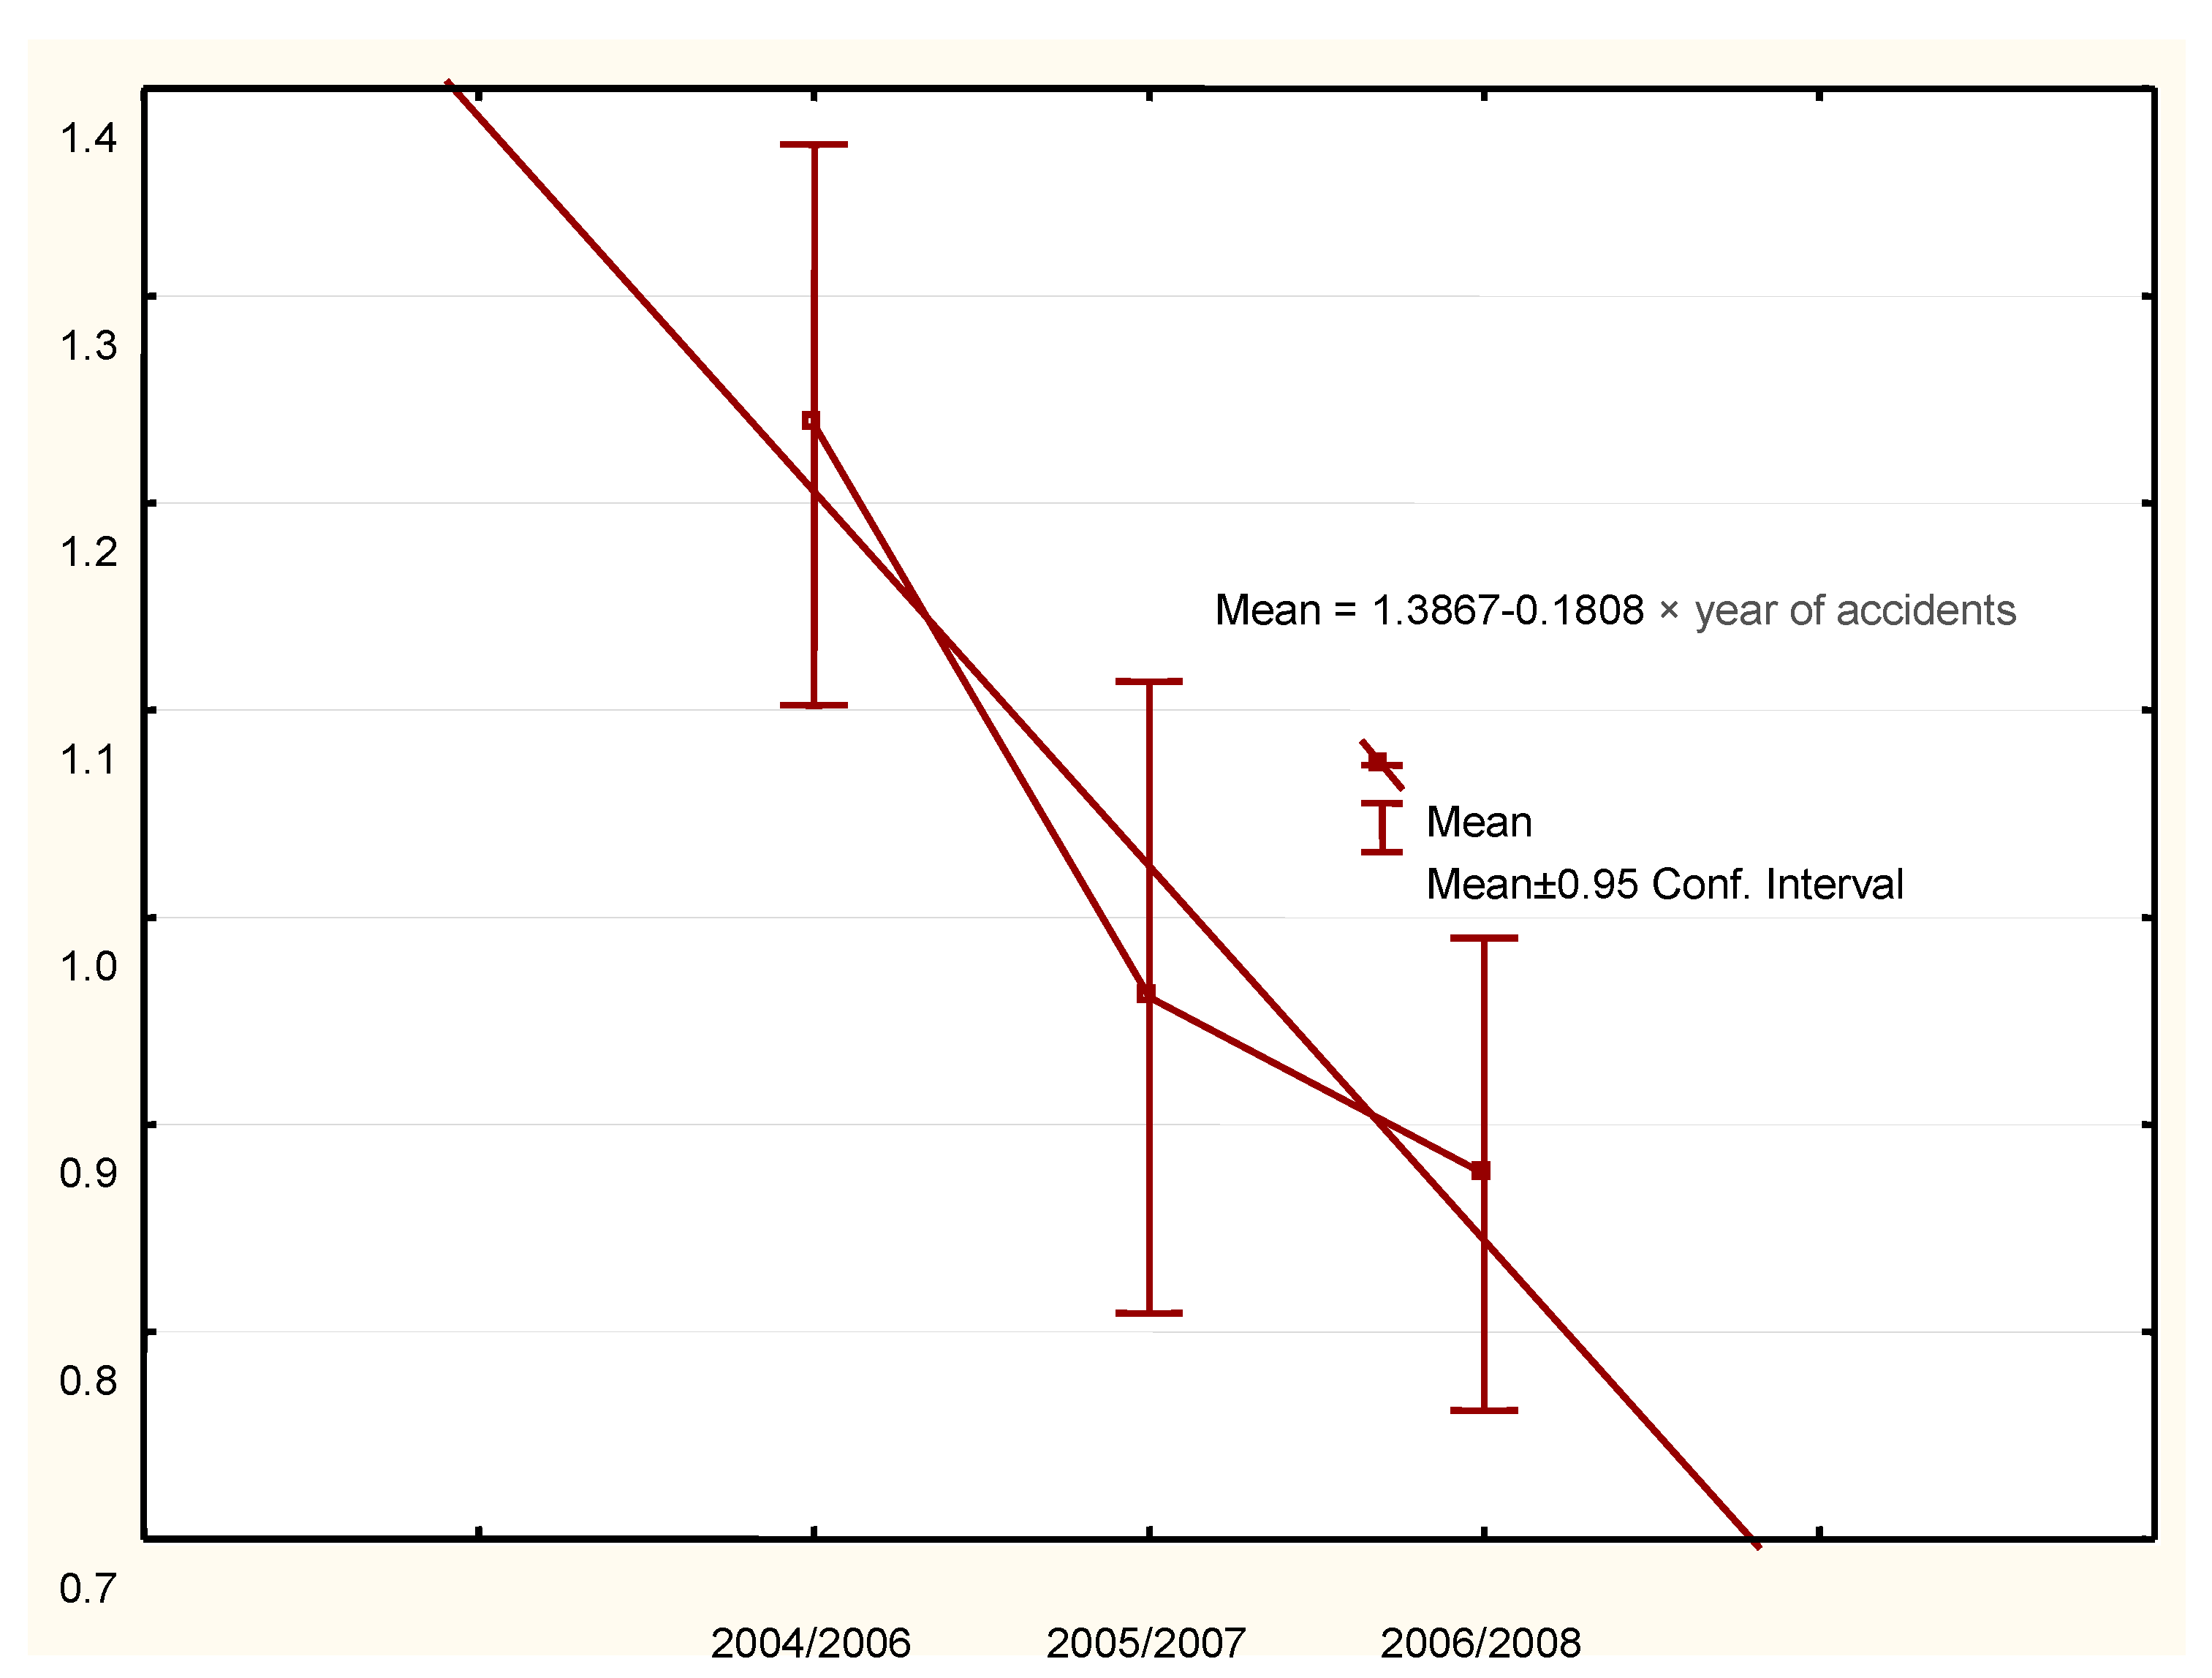
3. Results
3.1. General
3.2. Between- Versus within-Subjects Design
3.3. Non-Linear Effects
3.4. Controlling for Exposure
3.5. Environmental Effects
4. Discussion
4.1. Results
4.2. Limitations
4.3. Further Methodological Problems
5. Conclusions
Author Contributions
Funding
Acknowledgments
Conflicts of Interest
References
- Duke, J.; Guest, M.; Boggess, M. Age-related safety in professional heavy vehicle drivers: A literature review. Accid. Anal. Prev. 2010, 42, 364–371. [Google Scholar] [CrossRef] [PubMed]
- Simons-Morton, B.; Ehsani, J.P. Learning to Drive Safely: Reasonable Expectations and Future Directions for the Learner Period. Safety 2016, 2, 20. [Google Scholar] [CrossRef] [PubMed]
- Simons-Morton, B.G.; Ehsani, J.P.; Gershon, P.; Klauer, S.G.; Dingus, T.A. Teen Driving Risk and Prevention: Naturalistic Driving Research Contributions and Challenges. Safety 2017, 3, 29. [Google Scholar] [CrossRef]
- Bristow, J.; Kirwan, B.; Taylor, D.H. Cognition and affect in measures of driving style. Ergonomics 1982, 25, 935–940. [Google Scholar] [CrossRef] [PubMed]
- Gully, S.M.; Whitney, D.J.; Vanosdall, F.E. Prediction of police officers’ traffic accident involvement using behavioral observations. Accid. Anal. Prev. 1995, 27, 355–362. [Google Scholar] [CrossRef]
- Ferguson, S.A.; Leaf, W.A.; Williams, A.F.; Preusser, D.F. Differences in young driver crash involvement in states with varying licensure practices. Accid. Anal. Prev. 1996, 28, 171–180. [Google Scholar] [CrossRef]
- Brown, I.D.; Groeger, J.A. Risk perception and decision taking during the transition between novice and experienced driver status. Ergonomics 1988, 31, 585–597. [Google Scholar] [CrossRef]
- McCartt, A.T.; Mayhew, D.R.; Braitman, K.A.; Ferguson, S.A.; Simpson, H.M. Effects of Age and Experience on Young Driver Crashes: Review of Recent Literature. Traffic Inj. Prev. 2009, 10, 209–219. [Google Scholar] [CrossRef]
- Cresswell, W.L.; Froggatt, P. The Causation of Bus Driver Accidents: An Epidemiological Study; University Press: London, UK, 1963. [Google Scholar]
- Ghiselli, E.E.; Brown, C.W. Learning in accident reduction. J. Appl. Psych. 1947, 31, 580–582. [Google Scholar] [CrossRef]
- Gulliver, P.; Begg, D.; Brookland, R.; Ameratunga, S.; Langley, J. Learner driver experiences and crash risk as an unsupervised driver. J. Saf. Res. 2013, 46, 41–46. [Google Scholar] [CrossRef] [PubMed]
- Kim, D.-H.; Ramjan, L.M.; Mak, K.-K. Prediction of vehicle crashes by drivers’ characteristics and past traffic violations in Korea using a zero-inflated negative binomial model. Traf. Inj. Prev. 2016, 17, 86–90. [Google Scholar] [CrossRef] [PubMed]
- Maycock, J.; Lockwood, C.; Lester, J.F. The Accident Liability of Car Drivers; TRRL Research Report No. 315; Transport and Road Research Laboratory: Crowthorne, UK, 1991. [Google Scholar]
- Peck, R.C. The identification of multiple accident correlates in high risk drivers with specific emphasis on the role of age, experience and prior traffic violation frequency. Alcohol Drugs Driv. 1993, 9, 145–166. [Google Scholar]
- Af Wåhlberg, A.E. Driver Behaviour and Accident Research Methodology: Unresolved Problems; Ashgate: Farnham, UK, 2009. [Google Scholar]
- Af Wåhlberg, A.E. The effect of driver improvement interventions on crash involvement; has it been under-estimated? Transp. Res. Part F Traffic Psychol. Behav. 2018, 54, 349–356. [Google Scholar] [CrossRef]
- Af Wåhlberg, A.E.; Barraclough, P.; Freeman, J. The Driver Behaviour Questionnaire as accident predictor; A methodological re-meta-analysis. J. Saf. Res. 2015, 55, 185–212. [Google Scholar] [CrossRef] [PubMed]
- Af Wåhlberg, A.E.; Barraclough, P.; Freeman, J. Personality versus traffic accidents; meta-analysis of real and method effects. Transp. Res. Part F Traffic Psychol. Behav. 2016, 44, 90–104. [Google Scholar] [CrossRef]
- Vaa, T. ADHD and relative risk of accidents in road traffic: A meta-analysis. Accid. Anal. Prev. 2014, 62, 415–425. [Google Scholar] [CrossRef] [PubMed]
- Blom, D.H.J.; Pokorny, M.L.I.; Van Leeuwen, P. The Role of Age and Experience in Bus Drivers’ Accidents. Int. J. Epidemiol. 1987, 16, 35–43. [Google Scholar] [CrossRef] [PubMed]
- Chipman, M.L. The role of exposure, experience and demerit point levels in the risk of collision. Accid. Anal. Prev. 1982, 14, 475–483. [Google Scholar] [CrossRef]
- Kaneko, T.; Jovanis, P.P. Multiday driving patterns and motor carrier accident risk: A disaggregate analysis. Accid. Anal. Prev. 1992, 24, 437–456. [Google Scholar] [CrossRef]
- Pelz, D.C.; Schuman, S.H. Are young drivers really more dangerous after controlling for exposure and experience? J. Saf. Res. 1971, 3, 68–79. [Google Scholar]
- Begg, D.J.; Langley, J.D.; Brookland, R.L.; Ameratunga, S.; Gulliver, P. Pre-licensed driving experience and car crash involvement during the learner and restricted, licence stages of graduated driver licensing: Findings from the New Zealand Drivers Study. Accid. Anal. Prev. 2014, 62, 153–160. [Google Scholar] [CrossRef] [PubMed]
- Brown, I. Exposure and experience are a confounded nuisance in research on driver behaviour. Accid. Anal. Prev. 1982, 14, 345–352. [Google Scholar] [CrossRef]
- Ferdun, G.S.; Peck, R.C.; Coppin, R.S. The teen-aged driver: An evaluation of age, experience, driving exposure and driver training as they relate to driving record. High Res. Rec. 1967, 163, 31–53. [Google Scholar]
- McCartt, A.T.; Shabanova, V.I.; Leaf, W.A. Driving experience, crashes and traffic citations of teenage beginning drivers. Accid. Anal. Prev. 2003, 35, 311–320. [Google Scholar] [CrossRef]
- Cornwall, C.J. The Accident Experience of London Bus Drivers. Ann. Occup. Hyg. 1962, 5, 69–82. [Google Scholar]
- Clarke, D.D.; Ward, P.J.; Bartle, C.; Truman, W. Young driver accidents in the UK: The influence of age, experience, and time of day. Accid. Anal. Prev. 2006, 38, 871–878. [Google Scholar] [CrossRef]
- Dorn, L.; af Wåhlberg, A.E. Work-Related Road Safety: An Analysis Based on U.K. Bus Driver Performance. Risk Anal. 2008, 28, 25–35. [Google Scholar] [CrossRef] [PubMed]
- Chipman, M.L.; MacGregor, C.G.; Smiley, A.M.; Lee-Gosselin, M. Time vs. distance as measures of exposure in driving surveys. Accid. Anal. Prev. 1992, 24, 679–684. [Google Scholar] [CrossRef]
- Chipman, M.L.; MacGregor, C.G.; Smiley, A.M.; Lee-Gosselin, M. The role of exposure in comparisons of crash risk among different drivers and driving environments. Accid. Anal. Prev. 1993, 25, 207–211. [Google Scholar] [CrossRef]
- Haight, F.A. Induced exposure. Acc. Anal. Prev. 1973, 5, 111–126. [Google Scholar] [CrossRef]
- Dorn, L. Differential accident involvement of bus drivers. In Proceedings of the Second International Conference on Driver Behaviour and Training, Edinburgh, UK, 15–17 November 2005; Ashgate: Aldershot, UK, 2005; pp. 383–391. [Google Scholar]
- Häkkinen, S. Traffic accidents and professional driver characteristics: A follow-up study. Accid. Anal. Prev. 1979, 11, 7–18. [Google Scholar] [CrossRef]
- Department for Transport. Reported Road Casualties 2007: Annual Report; Transport Statistics Publication: London, UK, 2008.
- Department for Transport. Reported Road Casualties 2008: Annual Report; Transport Statistics Publication: London, UK, 2009.
- Dorn, L.; af Wåhlberg, A.E. Behavioural culpability for traffic accidents. Transp. Res. Part F Traffic Psychol. Behav. 2018, 60, 505–514. [Google Scholar] [CrossRef]
- Af Wåhlberg, A.E.; Dorn, L. Culpable versus non-culpable traffic accidents; what is wrong with this picture? J. Saf. Res. 2007, 38, 453–459. [Google Scholar] [CrossRef] [PubMed]
- Carr, B.R. A statistical analysis of rural ontario traffic accidents using induced exposure data. Accid. Anal. Prev. 1969, 1, 343–357. [Google Scholar] [CrossRef]
- Häkkinen, S. Traffic Accidents and Driver Characteristics. Ph.D. Thesis, Finland’s Institute of Technology, Helsinki, Finland, 1958. [Google Scholar]
- Farmer, E.; Chambers, E.G. A Study of Accident Proneness among Motor Drivers; Report 84; Medical Research Council, Industrial Health Research Board, His Majesty’s Stationary Office: London, UK, 1939.
- Besharati, M.M.; Kashani, A.T. Factors contributing to intercity commercial bus drivers’ crash involvement risk. Arch. Environ. Occup. Health 2018, 73, 243–250. [Google Scholar] [CrossRef] [PubMed]
- Af Wåhlberg, A.E.; Dorn, L. Bus drivers who leave; were they more crash-involved? Transp. Res. Part F: Traffic Psychol. Behav. 2018, 60, 524–535. [Google Scholar] [CrossRef]
- Van Zelst, R.H. The effect of age and experience upon accident rate. J. Appl. Psychol. 1954, 38, 313–317. [Google Scholar] [CrossRef]
- Af Wåhlberg, A.E. Changes in driver celeration behavior over time; do drivers learn from collisions? Transp. Res. Part F Traffic Psychol. Behav. 2012, 15, 471–479. [Google Scholar] [CrossRef]
- Af Wåhlberg, A.E.; Dorn, L. Bus driver accident record: The return of accident proneness. Theor. Issues Ergon. Sci. 2009, 10, 77–91. [Google Scholar] [CrossRef]
- Af Wåhlberg, A.E. The relation of non-culpable traffic incidents to bus drivers’ celeration behavior. J. Saf. Res. 2008, 39, 41–46. [Google Scholar] [CrossRef]
- Cooper, P.J.; Pinili, M.; Chen, W. An examination of the crash involvement rates of novice drivers aged 16 to 55. Accid. Anal. Prev. 1995, 27, 89–104. [Google Scholar] [CrossRef]
- Eby, D.W. An Analysis of Crash Likelihood: Age Versus Driving Experience; Report No. UMTRI-95-14; University of Michigan Transportation Research Institute: Ann Arbor, MI, USA, 1995. [Google Scholar]
- Goh, K.; Currie, G.; Sarvi, M.; Logan, D. Factors affecting the probability of bus drivers being at-fault in bus-involved accidents. Accid. Anal. Prev. 2014, 66, 20–26. [Google Scholar] [CrossRef] [PubMed]
- Williams, A.F.; Shabanova, V.I. Responsibility of drivers, by age and gender, for motor-vehicle crash deaths. J. Saf. Res. 2003, 34, 527–531. [Google Scholar] [CrossRef]
- Af Wåhlberg, A.E. The accident-exposure association: Self-reported versus recorded collisions. J. Saf. Res. 2011, 42, 143–146. [Google Scholar] [CrossRef] [PubMed]
- Rudin-Brown, C.M.; Edquist, J.; Lenné, M.G. Effects of driving experience and sensation-seeking on drivers’ adaptation to road environment complexity. Saf. Sci. 2014, 62, 121–129. [Google Scholar] [CrossRef]
- Barraclough, P.; Af Wåhlberg, A.E.; Freeman, J.; Watson, B.; Watson, A. Predicting crashes using traffic offences. A Meta-Analysis that examines potential bias between self-report and archival data. PLoS ONE 2016. [Google Scholar] [CrossRef] [PubMed]
- Af Wåhlberg, A.E. A reporting guide for studies on individual differences in safety. J. Saf. Res. 2010, 41, 381–383. [Google Scholar] [CrossRef]


| Variable | Mean | Standard Deviation | Min–Max |
|---|---|---|---|
| All accidents | 2.14 | 2.34 | 0–18 |
| All accidents/kday employed | 3.19 | 6.95 | 0–333 |
| Age 30 June 2007 (years) | 42.2 | 10.4 | 18.6–77.6 |
| Experience at end of service or time period (years) | 5.33 | 5.59 | 0–45.32 |
| Effects for Comparing One Year Periods for 1–5 Years of Experience | Mean | |||
| Between, comparing drivers hired 2005 and 2004 (N = 208 + 366) | 2006 | 2007 | 2008 | |
| −0.034 −3.6% | 0.162 17.2% | −0.007 −0.9% | 0.040 4.2% | |
| Within, hired 2005 (N = 208) | 2006, 2007 | 2007, 2008 | - | |
| −0.259 −25.1% | −0.107 −12.0% | - | −0.183 −18.5% | |
| Effects for Comparing One Year Periods for 2–6 Years of Experience | Mean | |||
| Between, comparing drivers hired 2004 and 2003 (N = 366 + 363) | 2006 | 2007 | 2008 | |
| −0.036 −3.9% | −0.132 −14.4% | −0.043 −5.1% | −0.070 −7.8% | |
| Within, hired 2004 (N =366) | 2006, 2007 | 2007, 2008 | - | |
| −0.056 −6.2% | −0.278 −27.8% | - | −.167 −17.0% | |
| Group | N | Correlation with Experience |
|---|---|---|
| All levels of experience | 2277 | −.074 *** |
| >1 year experience | 2069 | −.074 *** |
| <20 years experience | 2200 | −.058 ** |
| ≤5 years experience in 2006 | 1481 | −.038 |
| Variable | All Drivers | <3 Years Work in 2006–2008 | <3 Years Work and <5 Years Experience |
|---|---|---|---|
| All accidents 2006–2008 | .113 *** | .072 *** | .173 *** |
| All accidents/kday 2006–2008 | −.046 *** | −.011 | .027 |
| N | 5060 | 2783 | 2526 |
| 2006 | Percent Change 2006 and 2007 | 2007 | Percent Change 2007 and 2008 | 2008 | |
|---|---|---|---|---|---|
| All accidents | 1.13/1.32 | −13.0% | 1.00/1.18 | −22.0% | 0.78/0.96 |
| At fault | 0.52/0.81 | −17.3% | 0.43/0.70 | −20.9% | 0.34/0.62 |
| Not at fault | 0.61/0.92 | −4.9% | 0.58/0.87 | −24.1% | 0.44/0.71 |
| Ratio at fault/not at fault | 0.85 | −10.6% | 0.74 | 4.1% | 0.77 |
© 2019 by the authors. Licensee MDPI, Basel, Switzerland. This article is an open access article distributed under the terms and conditions of the Creative Commons Attribution (CC BY) license (http://creativecommons.org/licenses/by/4.0/).
Share and Cite
af Wåhlberg, A.; Dorn, L. Experience as a Safety Factor in Driving; Methodological Considerations in a Sample of Bus Drivers. Safety 2019, 5, 37. https://doi.org/10.3390/safety5020037
af Wåhlberg A, Dorn L. Experience as a Safety Factor in Driving; Methodological Considerations in a Sample of Bus Drivers. Safety. 2019; 5(2):37. https://doi.org/10.3390/safety5020037
Chicago/Turabian Styleaf Wåhlberg, Anders, and Lisa Dorn. 2019. "Experience as a Safety Factor in Driving; Methodological Considerations in a Sample of Bus Drivers" Safety 5, no. 2: 37. https://doi.org/10.3390/safety5020037
APA Styleaf Wåhlberg, A., & Dorn, L. (2019). Experience as a Safety Factor in Driving; Methodological Considerations in a Sample of Bus Drivers. Safety, 5(2), 37. https://doi.org/10.3390/safety5020037