1. Introduction
User safety is one of the most important issues in road design. The Organization for Economic Co-operation and Development (OECD) demonstrated that in the last two decades, the trend of road accidents is not positive all over the world [
1]. The problem is serious, as confirmed by the attention given to it at international level [
2]. The United Nations General Assembly declared the years 2011–2020 as a Decade of Action for Road Safety [
3]. At the European level, the trend of road fatalities since 2001 appears not to be compliant with the Road Safety Program pursued by the European Commission, which aims at halving road casualties by 2020 [
4].
A non-negligible rate of road accidents (73% in Italy according to [
5]) occurs in urban areas, where externalities of motorized traffic (e.g., congestion, noise, and pollution) encourage the use of “soft mobility” [
6,
7]. In such conditions, different users and different vehicles share urban road spaces [
8,
9]. In the literature, several studies demonstrated that pedestrians, cyclists, and motorcyclists are the most vulnerable users in urban areas [
10,
11,
12].
In order to prevent accidents and reduce their consequences on people, the system composed of drivers, vehicles, the environment, and roads should be investigated [
8]. According to several studies available in the literature, most accidents are caused by bad behavior of drivers, i.e., the only ones capable of adapting their behavior towards non-living components [
13,
14]. However, it has been observed that the incorrect design or management of road infrastructure can induce bad behavior or failure to appreciate risk [
15,
16,
17,
18]. Therefore, in order to maximize on-going safety efforts, it is necessary to analyze each component of the road system and evaluate its effect on road safety. To this end, the European Directive 2008/96/EC [
19] on the safety management of road infrastructure establishes management procedures ensuring the safety of road networks. It defines four basic tools for road safety management: Road Safety Impact Assessment, Road Safety Audit, Safety Ranking and Management of the Road Network in Operation, and Road Safety Inspections. These activities work on planning, design, and management of both constructed and to-be-constructed roads included in the Trans-European Transport Network (TEN-T). Some Member States transposed the Directive as a code of good practice also for their national roads which are not included in TEN-T. For example, in Italy, the transposition acts [
20,
21] advised authorities to implement a road infrastructure safety management network composed of four phases: analysis, inspection, classification, and intervention. Particularly, Road Safety Inspections (RSI) should be carried out on existing roads in order to detect infrastructure elements/defects which could increase the rates of traffic conflicts and exacerbate their negative consequences.
Moreover, interesting and effective actions have been developed to promote tools and procedures in EU member states and in other countries [
22,
23,
24,
25].
The European Road Assessment Program (EuroRAP) has been developed by European road authorities to assess the risk to car occupants and highlight sections with the highest risk of death and serious injury [
26]. It is based on objective variables: crash types and seriousness, distance and type of roadside obstacles, speed, and traffic level of the road.
In the USA, the AASHTO Highway Safety Manual (HSM) provides standardized and accurate methods for the estimation of both crash frequency or severity for urban roads and the effects of road safety measures [
27,
28].
The New Zealand Transport Agency developed the procedure Road Infrastructure Safety Assessment to monitor road safety performances. Cross section, alignment, surface conditions, access ways, and statistical data on crashes are the examined variables [
29]. Moreover, in New Zealand, procedures for Safety Audit of Existing Roads (SAER) allowed for the development of an empirical measure of safety according to a subjective scale depending on the relative hazard frequency and the crash severity probability [
30].
In recent years, much research has analyzed the results from statistical data and RSI to evaluate safety condition towards physical components of road-system [
31,
32,
33]. The proposed methods permits us to assess, at section and branch level, the current level of safety for the most vulnerable users, to identify the most critical conditions, and to implement correct strategic decisions [
34]. The authors propose an original analytical model which is useful to assess the risk of road accidents in existing urban roads. The model relies on data collected during RSIs (e.g., geometric characteristics, road signs, and urban furniture, users’ categories); therefore, it can be implemented even when historical data about traffic volume or accidents are not available. The value of applying this technique in the risk assessment of a specific urban branch road lies in the possibility of identifying the critical defects related to potential accidents which cause deaths or serious injury. This, in turn, provides the information required by the road management body to adopt a strategy in order to adopt mitigation strategies and protect citizens’ well-being. The proposed method allows for an objective assessment of the risk level, and the numerical results of the analysis are comparable to a target level of risk to be defined during the analysis. Moreover, the method permits authorities to define guidelines for road design with the aim of creating safer roads for all types of users.
2. Methods
In this study, the authors proposed an innovative quantitative approach to assess the Branch Index Risk (
BIR) and the Section Index Risk (
SIR) of existing urban roads considering their geometry, layout, users, and traffic.
BIR assesses the overall risk of road accidents in urban branch roads: the higher
BIR value, the lower the safety along the examined infrastructure stretch. Therefore, the value of
BIR depends on the Section Factor Risk (
SFRj,r) of each homogeneous section
j which composes the branch
r. Each homogeneous section is 100 m ± 20%-long: road branches are considered homogeneous if they have uniform/homogeneous attributes related to physical and operating conditions (i.e., accident rate, geometric layout, composition of cross section, traffic spectrum, average operating speed) [
35]. This approach allows for the comparison of “density” of hazardous elements/defects between different (short) sections whose length is suited to the considered urban context. Moreover, it gives good results in terms of fitting the safety performance of road sections, as confirmed by Cafiso et al. [
36].
SFRj,r takes into account both the general characteristics of
r (i.e., type and frequency of hazardous elements/defects, expected damage on vulnerable road users, and traffic level), and all
n elements which affect the dangerousness of
j. Equation (1), which complies with an approach recently proposed to analyze and plan maintenance of road safety barriers [
32], allows us to calculate
SFRj,r:
Bi is the base value associated to defects i which are along j.
K1i is the priority factor of the category to which the element i belongs.
K2i is the vulnerability factor of users (i.e., pedestrians, cyclists and motorcyclists) along r; and it depends on their volume.
K3 is the motorized traffic factor of r.
K4i is the hazardousness factor; it depends on the consequences of defect i on the most vulnerable road users.
K5i is the extension factor; it depends on continuous or discrete elements/defects i along j.
Given
SFRj,r, the corresponding value of
SIR can be calculated according to Equation (2)
where
SIRj,r is the Section Index Risk of the section
j belonging to
r, and
SFRmax,r is the highest value of
SFRr by attributing the maximum values to defects found on
r.
Therefore, SFRj,r depends on the detected road elements/defects and the road users of the section j, and SIRj,r depends on the comparison between the attributed and the maximum values of K1i, K2i, K3, K4i, and K5i.
Similarly, the Branch Index Risk
BIRr can be calculated according to Equation (3):
where
Rr is the sum of the
SIRj,r of
m sections which compose the road branch
r given by Equation (4)
where
Rmax,r is the reference value of the Risk Factor given by Equation (5)
Similar to SIRj,r, BIRr depends on the attributed values of K1i, K2i, K3, K4i, and K5i, and on the defects found along r. Both SIRj,r and BIRr range between 0 and 1.
The implementation of the proposed method requires road inspections to identify and categorize elements and/or defects of infrastructure which could cause accidents. The authors identified 9 categories of elements/defects: geometry (G), cross-section (C); private access (A); pavement (P); lighting (L); road signs (S); intersection (J); urban furniture (F); and stopping (ST). The attribution of possible values of K1i, K2i, K4i, and K5i, and Bi required interviewing technicians from different backgrounds, as well as academic experts in the fields of roads (both geometry and safety), urban planning, transport management, and human health. Eight road engineers, eight urbanists, seven traffic managers, and six traumatologists were interviewed. The authors defined, for each variable, the maximum and minimum value, then each technician attributed the values within the established ranges. Finally, the geometric mean has been used to aggregate individual judgements.
Table 1 lists the priority factors
K1 for each category.
Taken together, the authors identified 55 road elements/defects which can cause accidents. Their base values
Bi satisfy Equation (6) and are listed in
Table 2. Road layout and geometry were evaluated against the Italian standards and recommendations about the geometric and functional characteristics of roads [
37] and intersections [
38], road infrastructure safety management [
21], and road lighting [
39]. These standards were considered as references to identify “not compliant” conditions, and to assign the
Bi values.
K2i depends on the observed traffic condition of vulnerable users (i.e., pedestrians, cyclists, and motorcyclists) which are exposed to the risk induced by defect
i. The Highway Capacity Manual [
40] suggests performing surveys during a 15 min count period in order to obtain the traffic volume data. The authors observed the traffic flow when weather conditions were not an obstacle to traffic, and when all work- and school-related activities were ongoing. Finally, they calculated
K2i according to Equation (7).
where
KPi,
KCi, and
KMi depend on the pedestrian, cyclist, and motorcyclist flow, respectively. Their values satisfy Equations (8)–(10), and depend on the traffic volume observed along the overall examined branches, if the analysis involves a road network.
Particularly, having considered all the examined branches, the average hourly flow of cyclists and motorcyclists (
ACF and
AMF, respectively), and their standard deviation (
DCF and
DMF, respectively) are calculated. Finally, these values are compared to the hourly flow of cyclists and motorcyclists (
ACFr and
AMFr, respectively) and the standard deviations (
DCFr and
DMFr, respectively) of the examined branch
r in order to calculate
KCi and
KMi, respectively (
Table 3).
The motorized traffic factor
K3 depends on the observed volume of motorized vehicles along the surveyed stretch. According to [
41,
42,
43,
44], the authors assumed that the higher their average speed, the greater the danger of exposure for vulnerable users. Therefore, the values of
K3 in
Table 4 depend on the typical observed traffic fluidity and the number of daylight hours with congested traffic flow. The term “congested flow” complies with the methodology proposed by [
45] to evaluate the level of service of an urban arterial: this condition occurs when the percentage speed reduction from free flow speed appears greater than 50%.
The hazardousness factor
K4i depends on the expected fatality induced by the defect
i on vulnerable road users. It is calculated according to Equation (11)
where
K4Vi and
K4Pi refer to expected consequences on motorized vehicle users (both drivers and passengers), and non-motorized users (pedestrians and cyclists), respectively. Their values satisfy Equations (12) and (13), and are listed in
Table 5.
The established ranges for
K4Vi and
K4Pi take into account that at the same speed, consequences on vulnerable users are higher than on users of motorized vehicles. On the road, vulnerable users conflict with vehicles with larger dimensions and masses; cyclists and pedestrians clearly constitute the “unprotected” element, and they are more exposed in the event of an accident, as confirmed by [
46]. Indeed, Wramborg defined probability curves to represent the fatality risk versus collision speed when a motorized vehicle collides with a vulnerable user, or frontal or hard object collision occurs to motorized vehicles.
K5i is the extension factor of each element
i found along
j. According to
Table 6, it considers both surveyed continuous and discrete elements/defects.
Given the above procedures, it is possible to simulate values of
BIRs and define appropriate classes of risk. To this end, the authors considered six probabilistic classes of risk level, as usually done for transport infrastructure risk assessment [
47,
48,
49,
50,
51,
52,
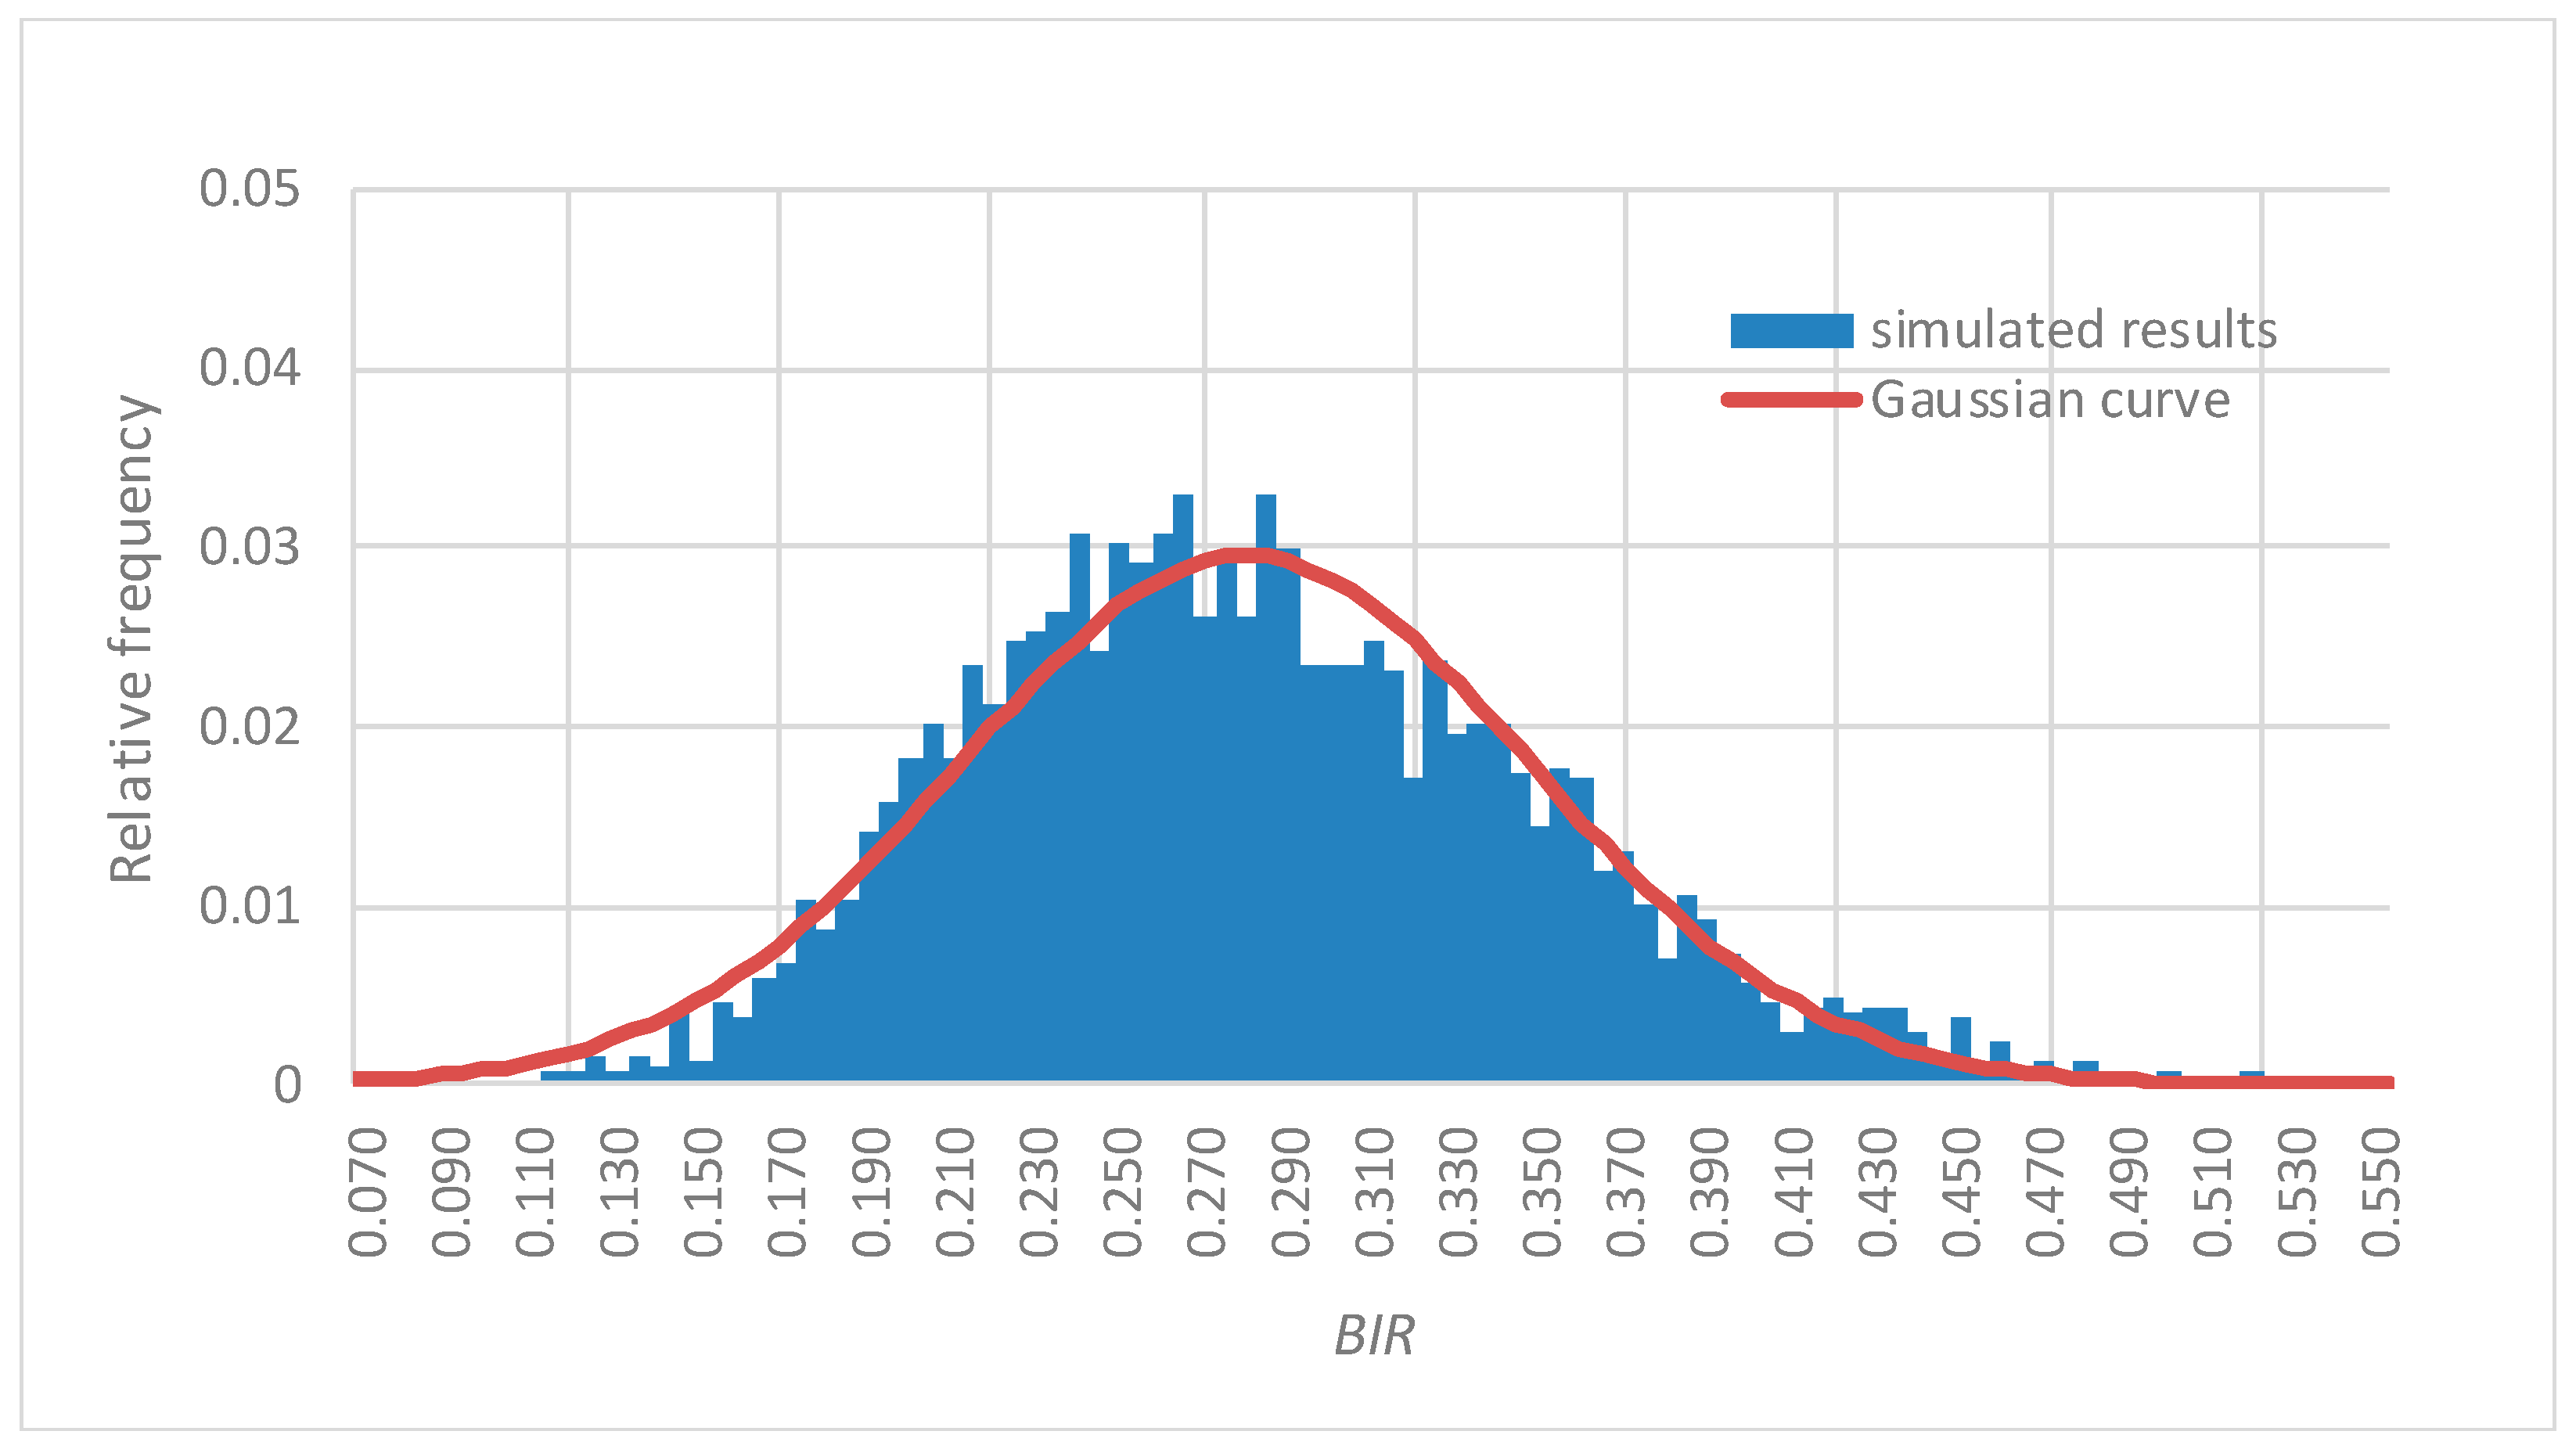
53]. The definition of ranges for each class requires a significant number of monitored branches. Monte Carlo simulations were used to generate a distribution of simulated
BIRs obtained from randomly-assigned values of the proposed variables. Therefore, the Monte Carlo technique gave a virtual sample useful to study the statistical variability of
BIR, assuming that the virtual sample was comparable to the real (surveyed) one. According to the Central Limit Theorem [
54], as the number of samples from any population increases, the probability distribution of the means will approach a normal distribution. Therefore, it was possible to compare the distribution of simulated
BIRs to a Gaussian distribution.
Figure 1 shows the results from 3000 simulations, and it compares the simulated and analytical frequency curves: the former derives from the Monte Carlo simulation, the latter represents the Gaussian curve [
55].
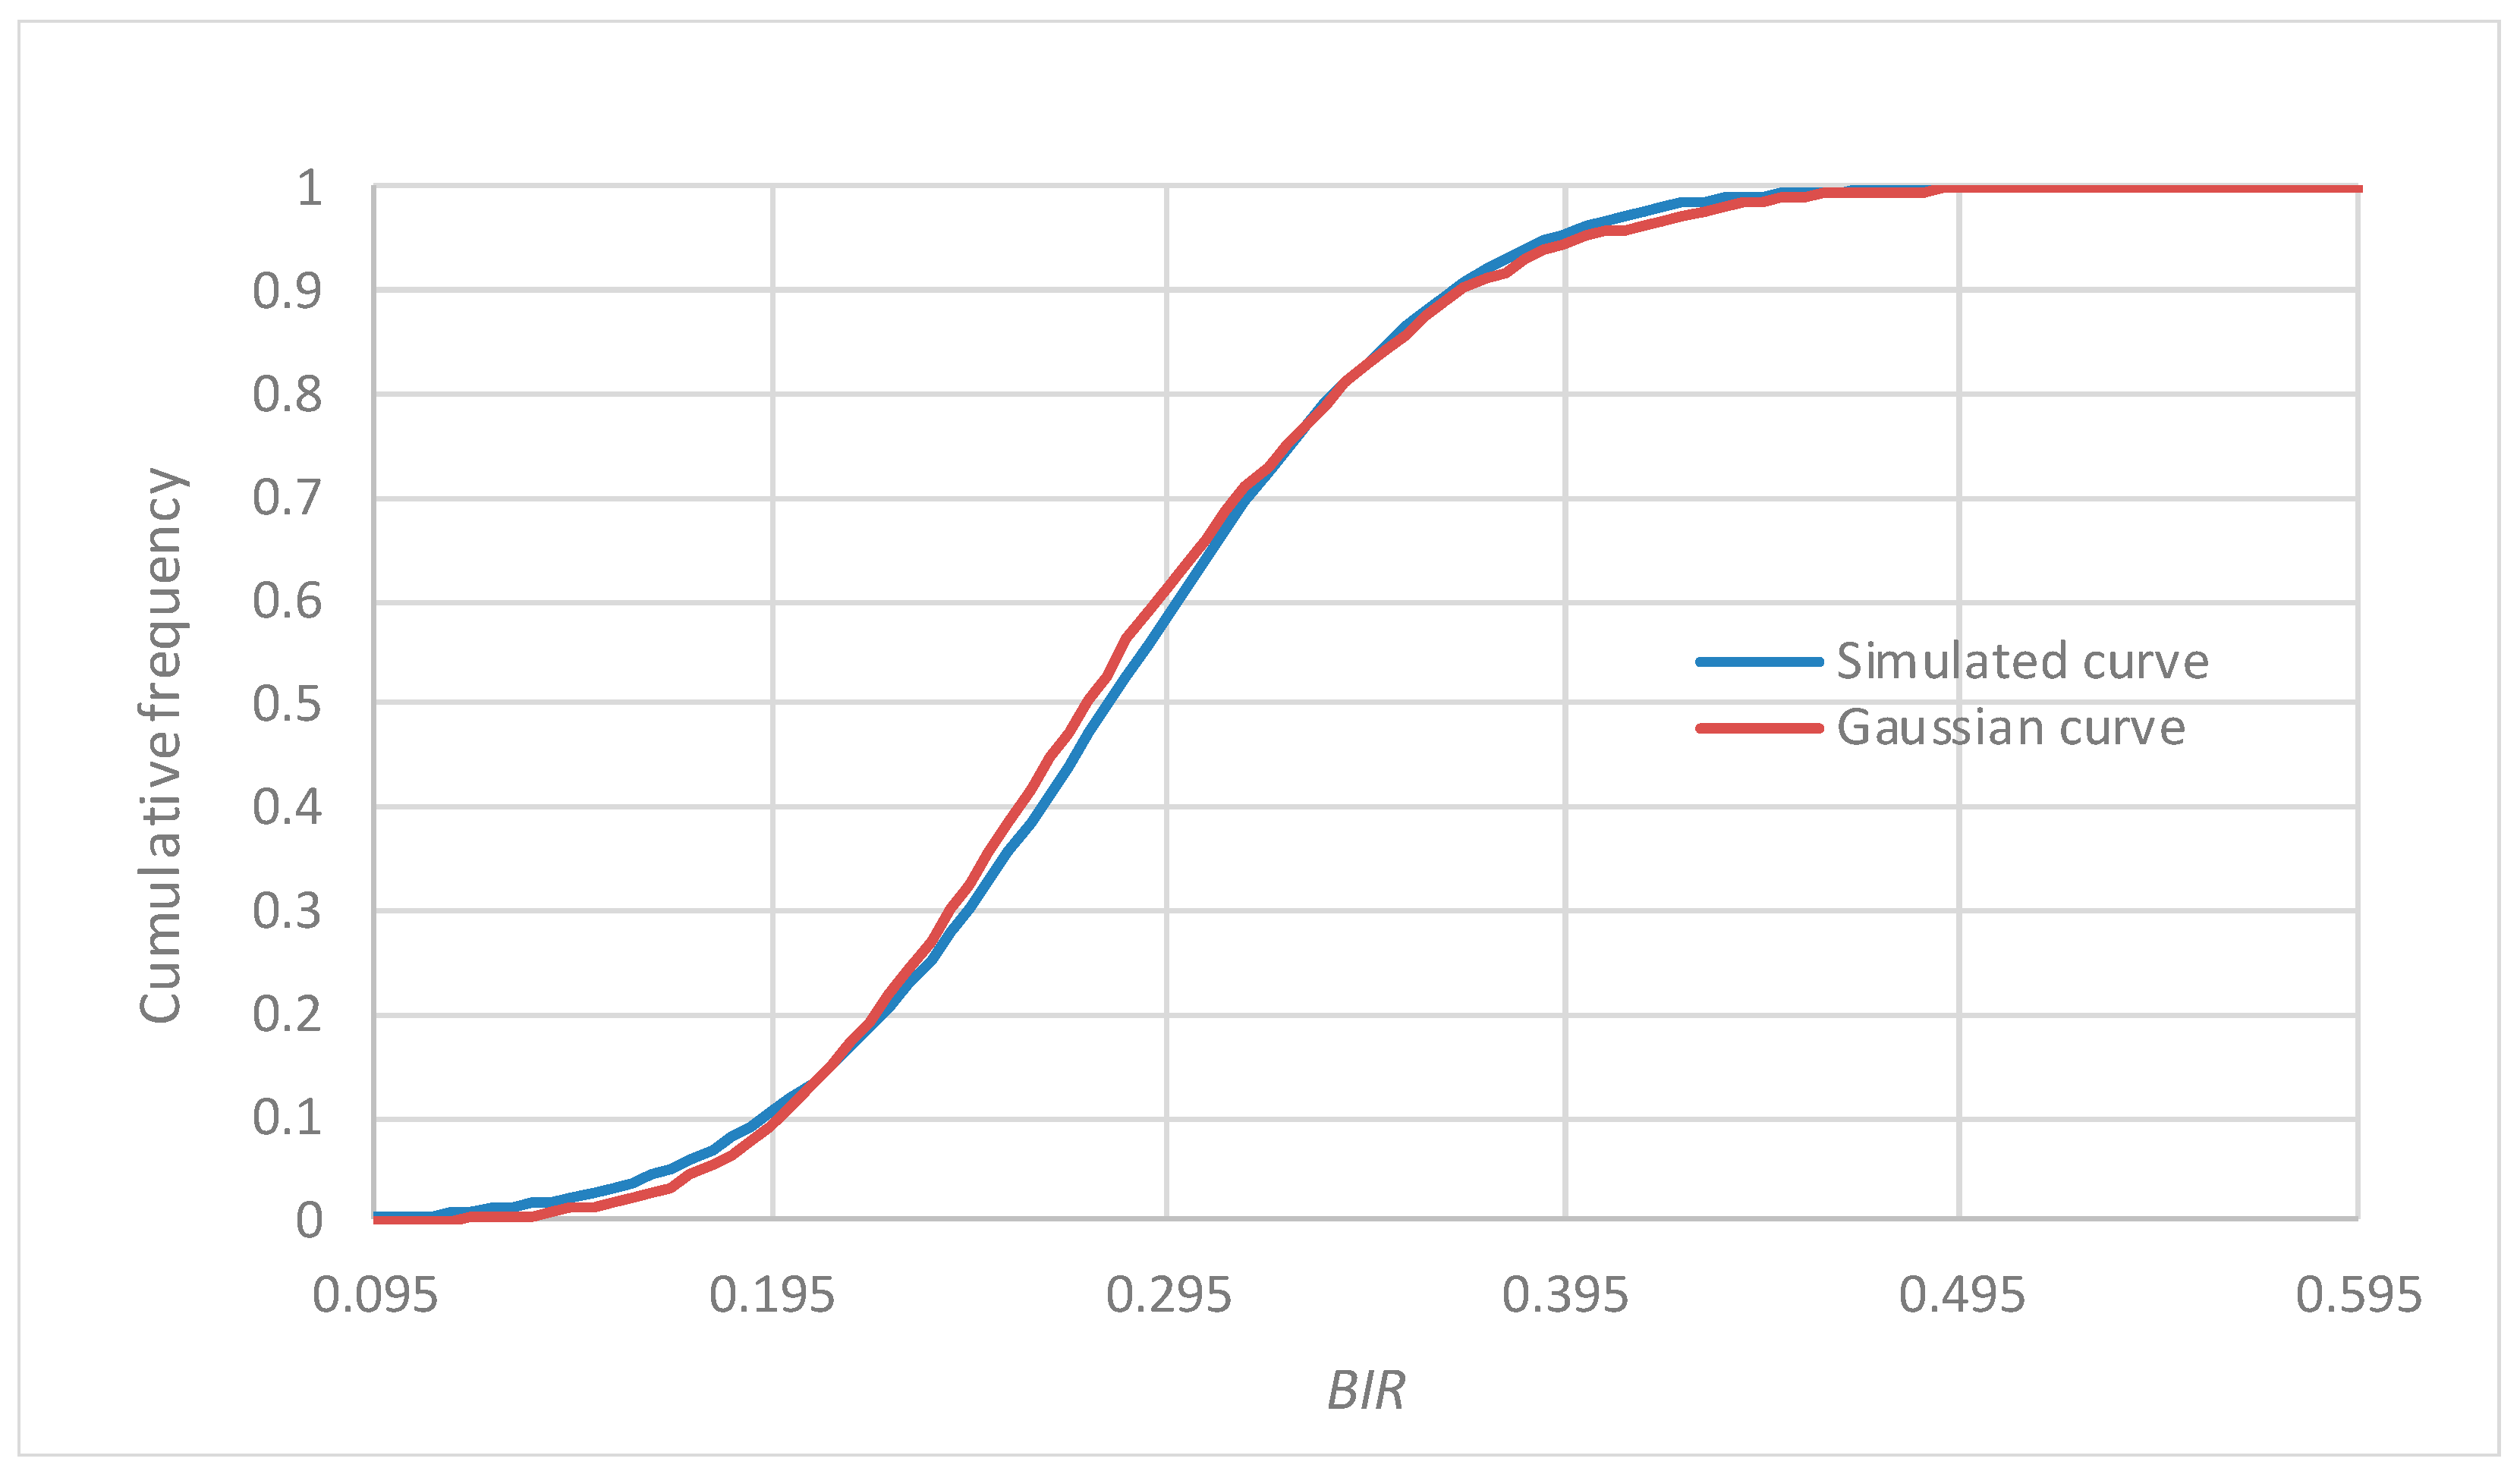
Figure 2 compares the cumulative frequency curves of the simulated and analytical distributions: their trend confirms the appropriateness of the procedure.
Table 7 lists the six classes of
BIR, their minimum and maximum values, and chromatic categorization.
The proposed method could be applied by policy and decision makers when they have to manage urban road safety because it provides results that could be used to critically approach this strategic sector whose impacts are economic, social, and environmental. Indeed, input data are available to a road management body, and the presented method is comprehensive and versatile; therefore, it may be applied to different urban scenarios varying the examined variables and their factors.
3. Case Study
The proposed methodology has been applied on multiple branches totaling 50 km together in an Italian municipality in order to assess their
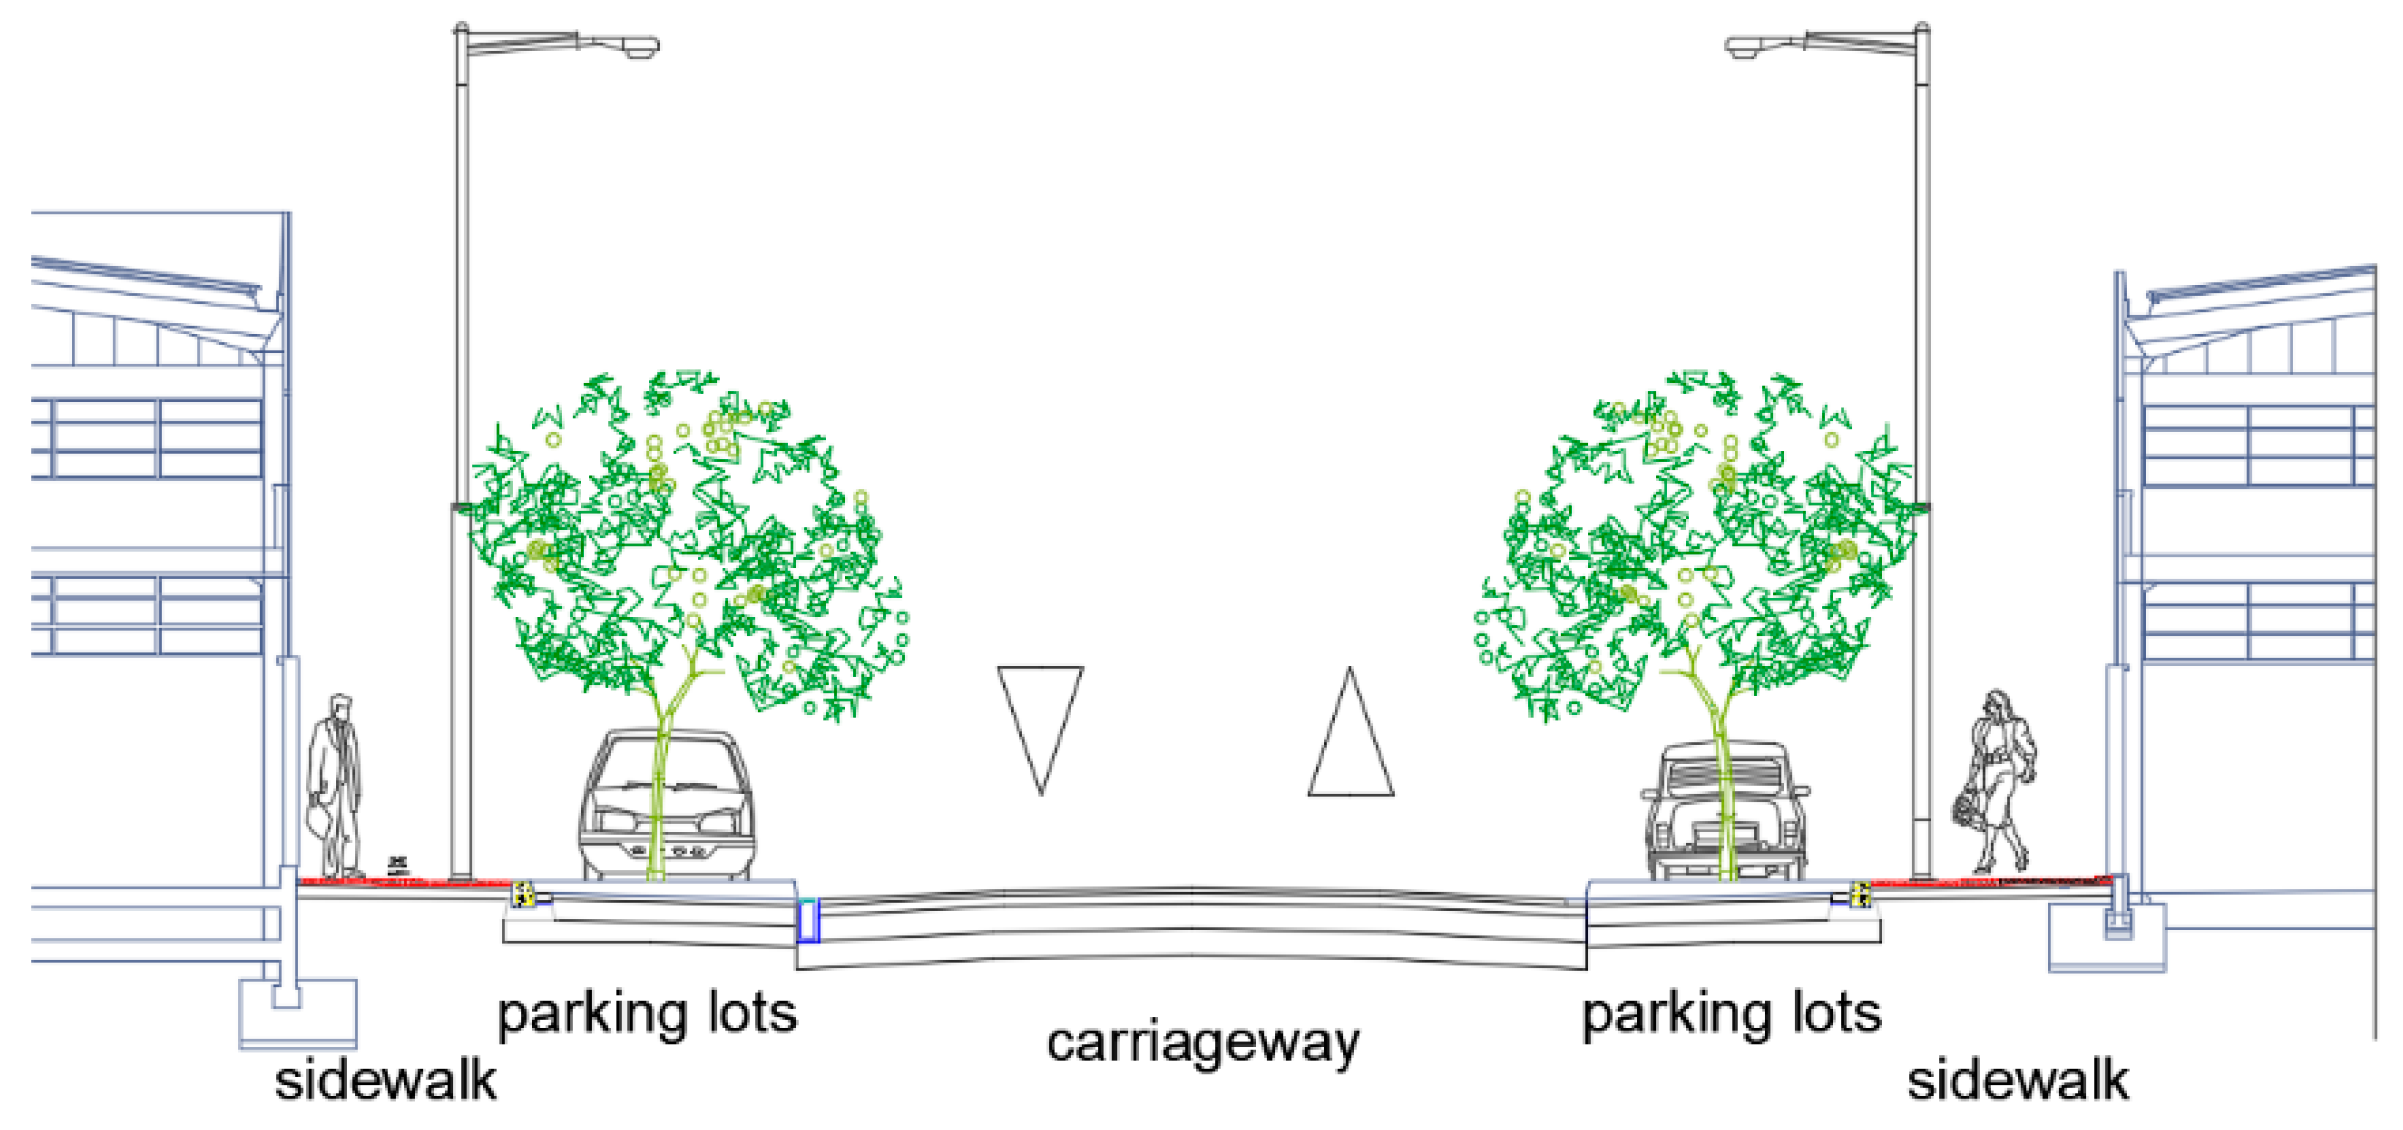
BIR values. All the roads had the same classification: two-lane urban roads with parking spaces and sidewalks on both sides (
Figure 3). Their maximum allowable speed was 50 km/h.
For the sake of brevity, in this study, the authors present the most interesting and critical roads, where users have to perform crucial and dangerous maneuvers (e.g., intersections without traffic lights, poor visibility, many conflict points).
Table 8 summarizes geometric and technical characteristics of the selected roads: they are 7 branches (i.e., ROAD1 to ROAD7) with similar geometric and traffic characteristics.
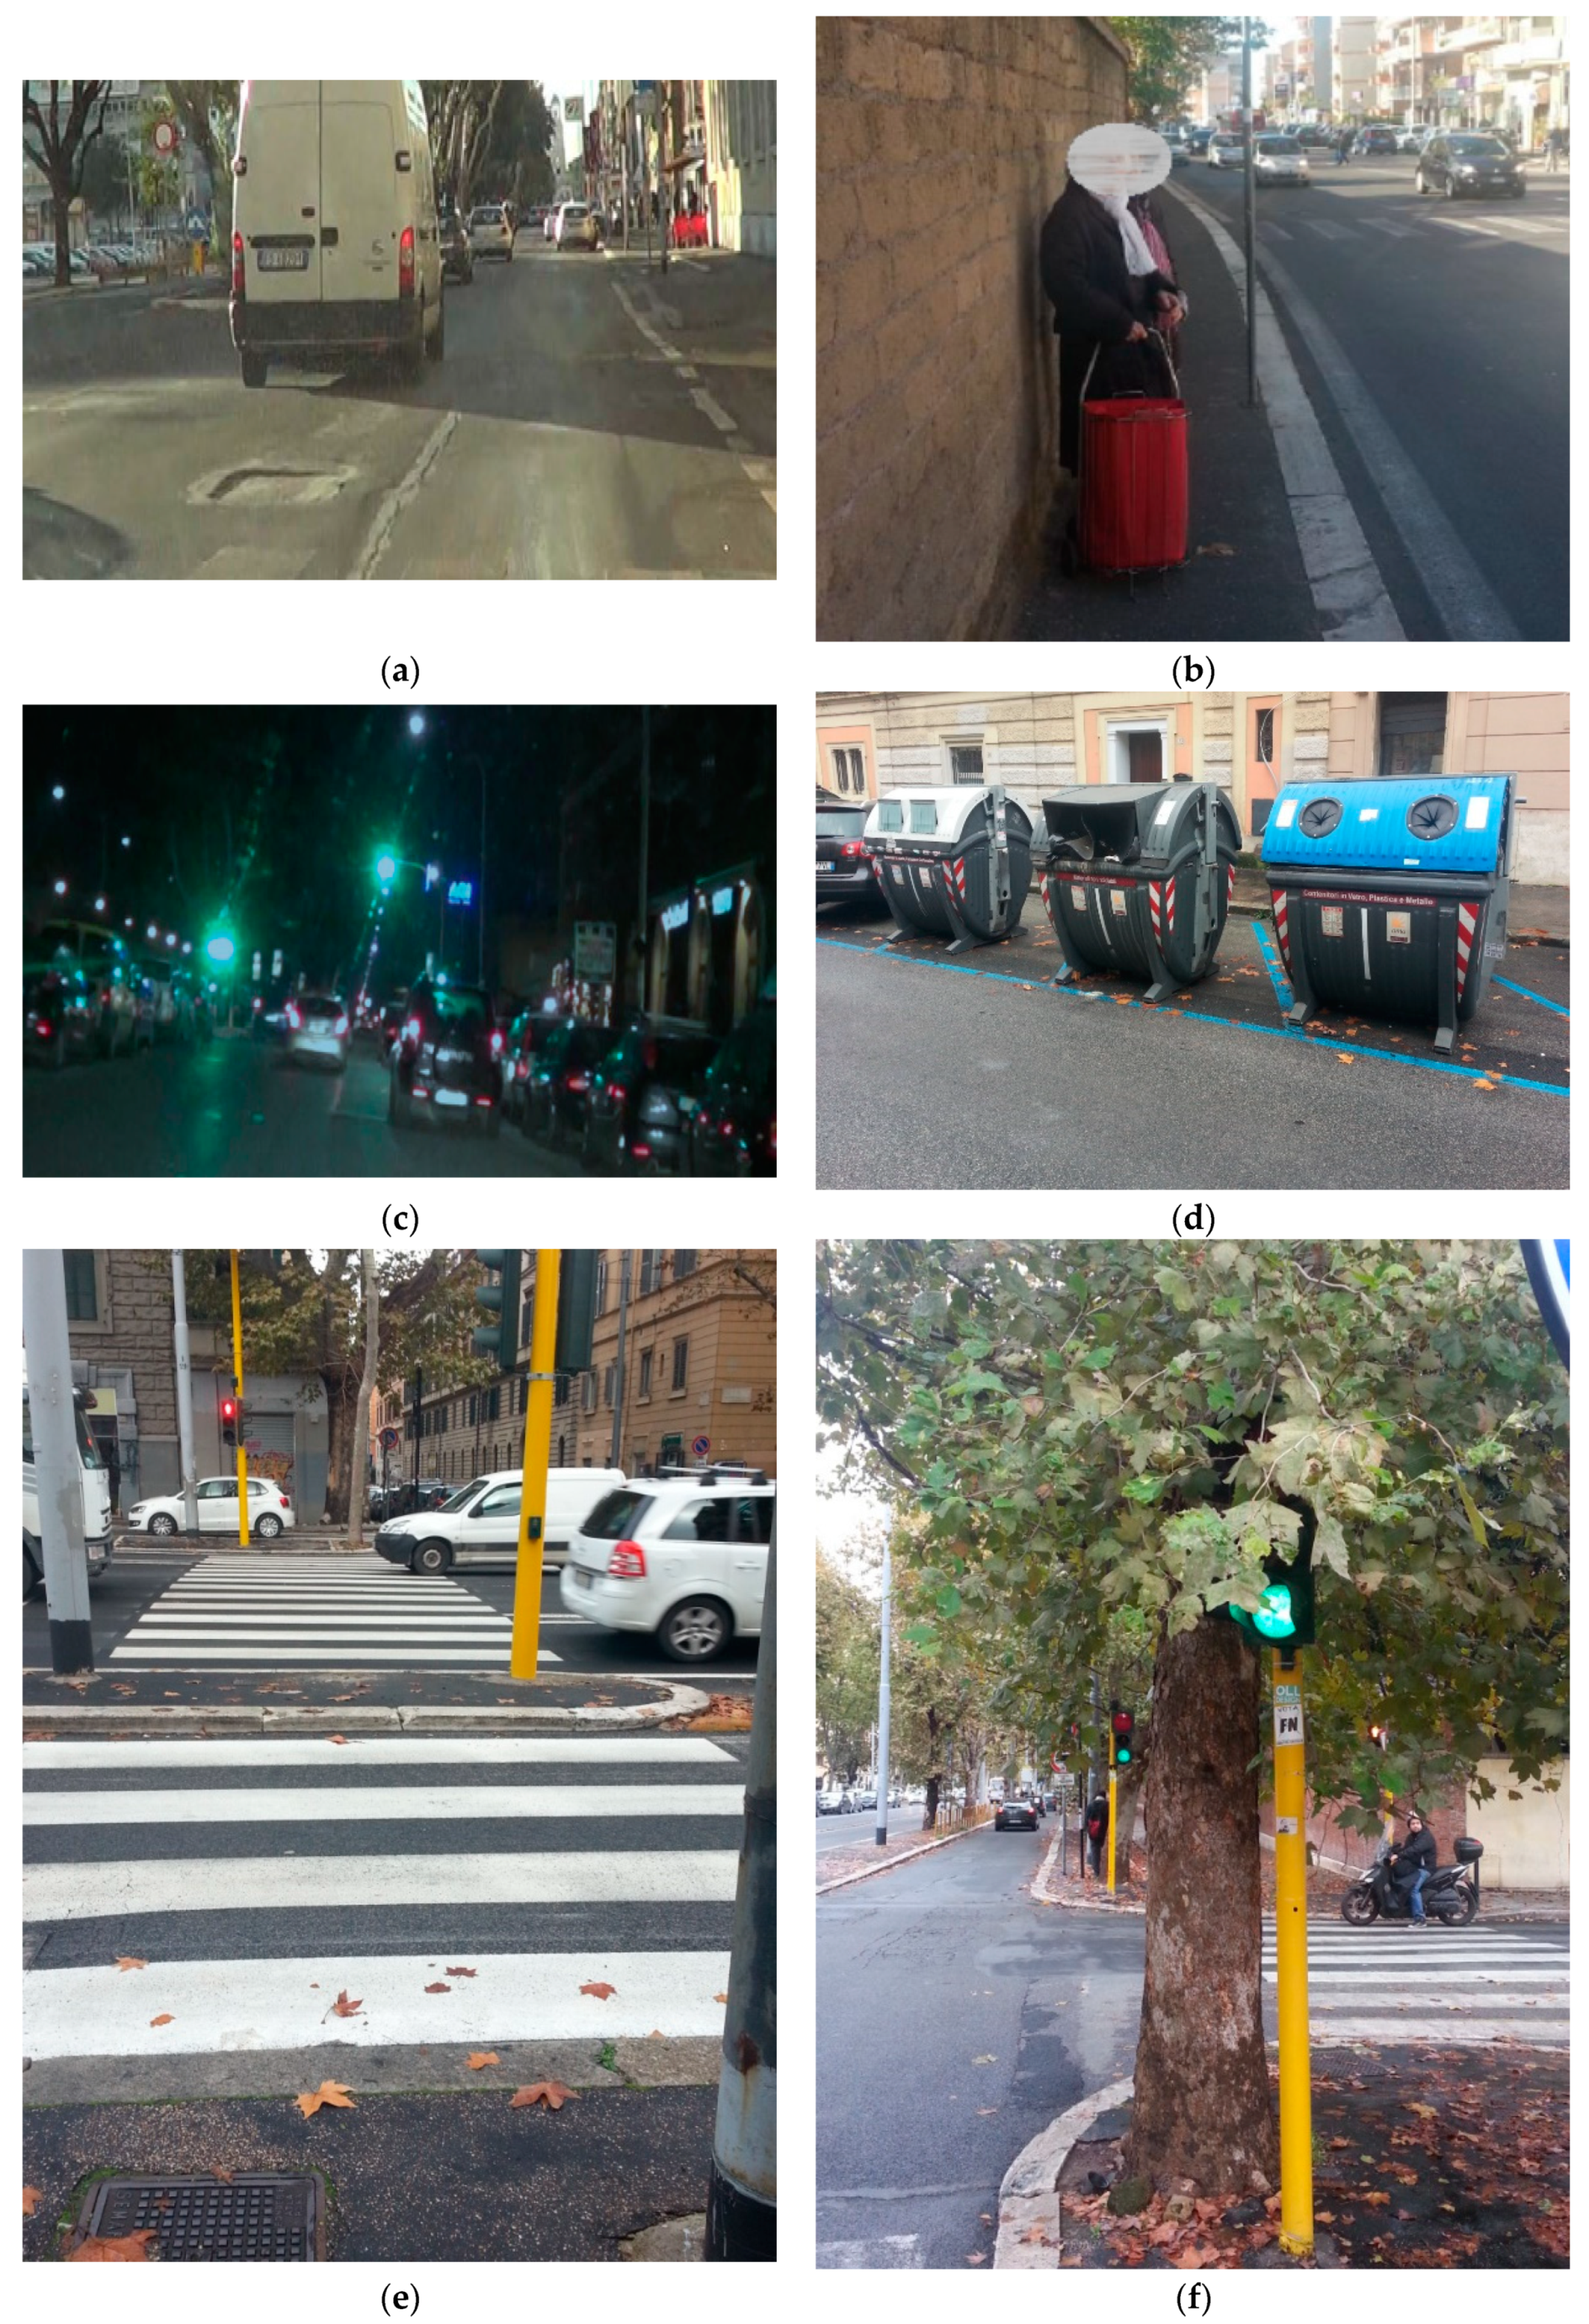
Figure 4a to f show some of the most frequently-detected defects: irregular pavement, narrow sidewalk, inefficient lighting system, urban furniture occupies shoulder and/or lane, pedestrian crossing without ramps, and not visible traffic light, respectively.
The bar graph in
Figure 5 represents, in descending order,
BIRs (i.e., blue bars) to better compare them to the accident density (
AD) (i.e., orange bars) retrieved by the authors from the Italian statistical geo-referenced database of occurred accidents [
56].
In
Figure 5, a good correlation between the data from surveys and the statistical data about accidents appears: the higher the accident density (
AD), the greater the
BIR values. ROAD1 and ROAD2 have the highest values of both
BIR and
AD. ROAD5 does not comply with this point because
AD and
BIR values refer to different conditions. Indeed,
AD refers to 2015, while surveys to obtain
BIR occurred in 2017, after safety works carried out in 2016. Therefore, ROAD5 has been removed from analysis of correlation between road defects and accidents in order to define Equation (14):
Moreover, the analysis of
SIRj,r allowed for the identification of the most hazardous sections according to
Table 7.
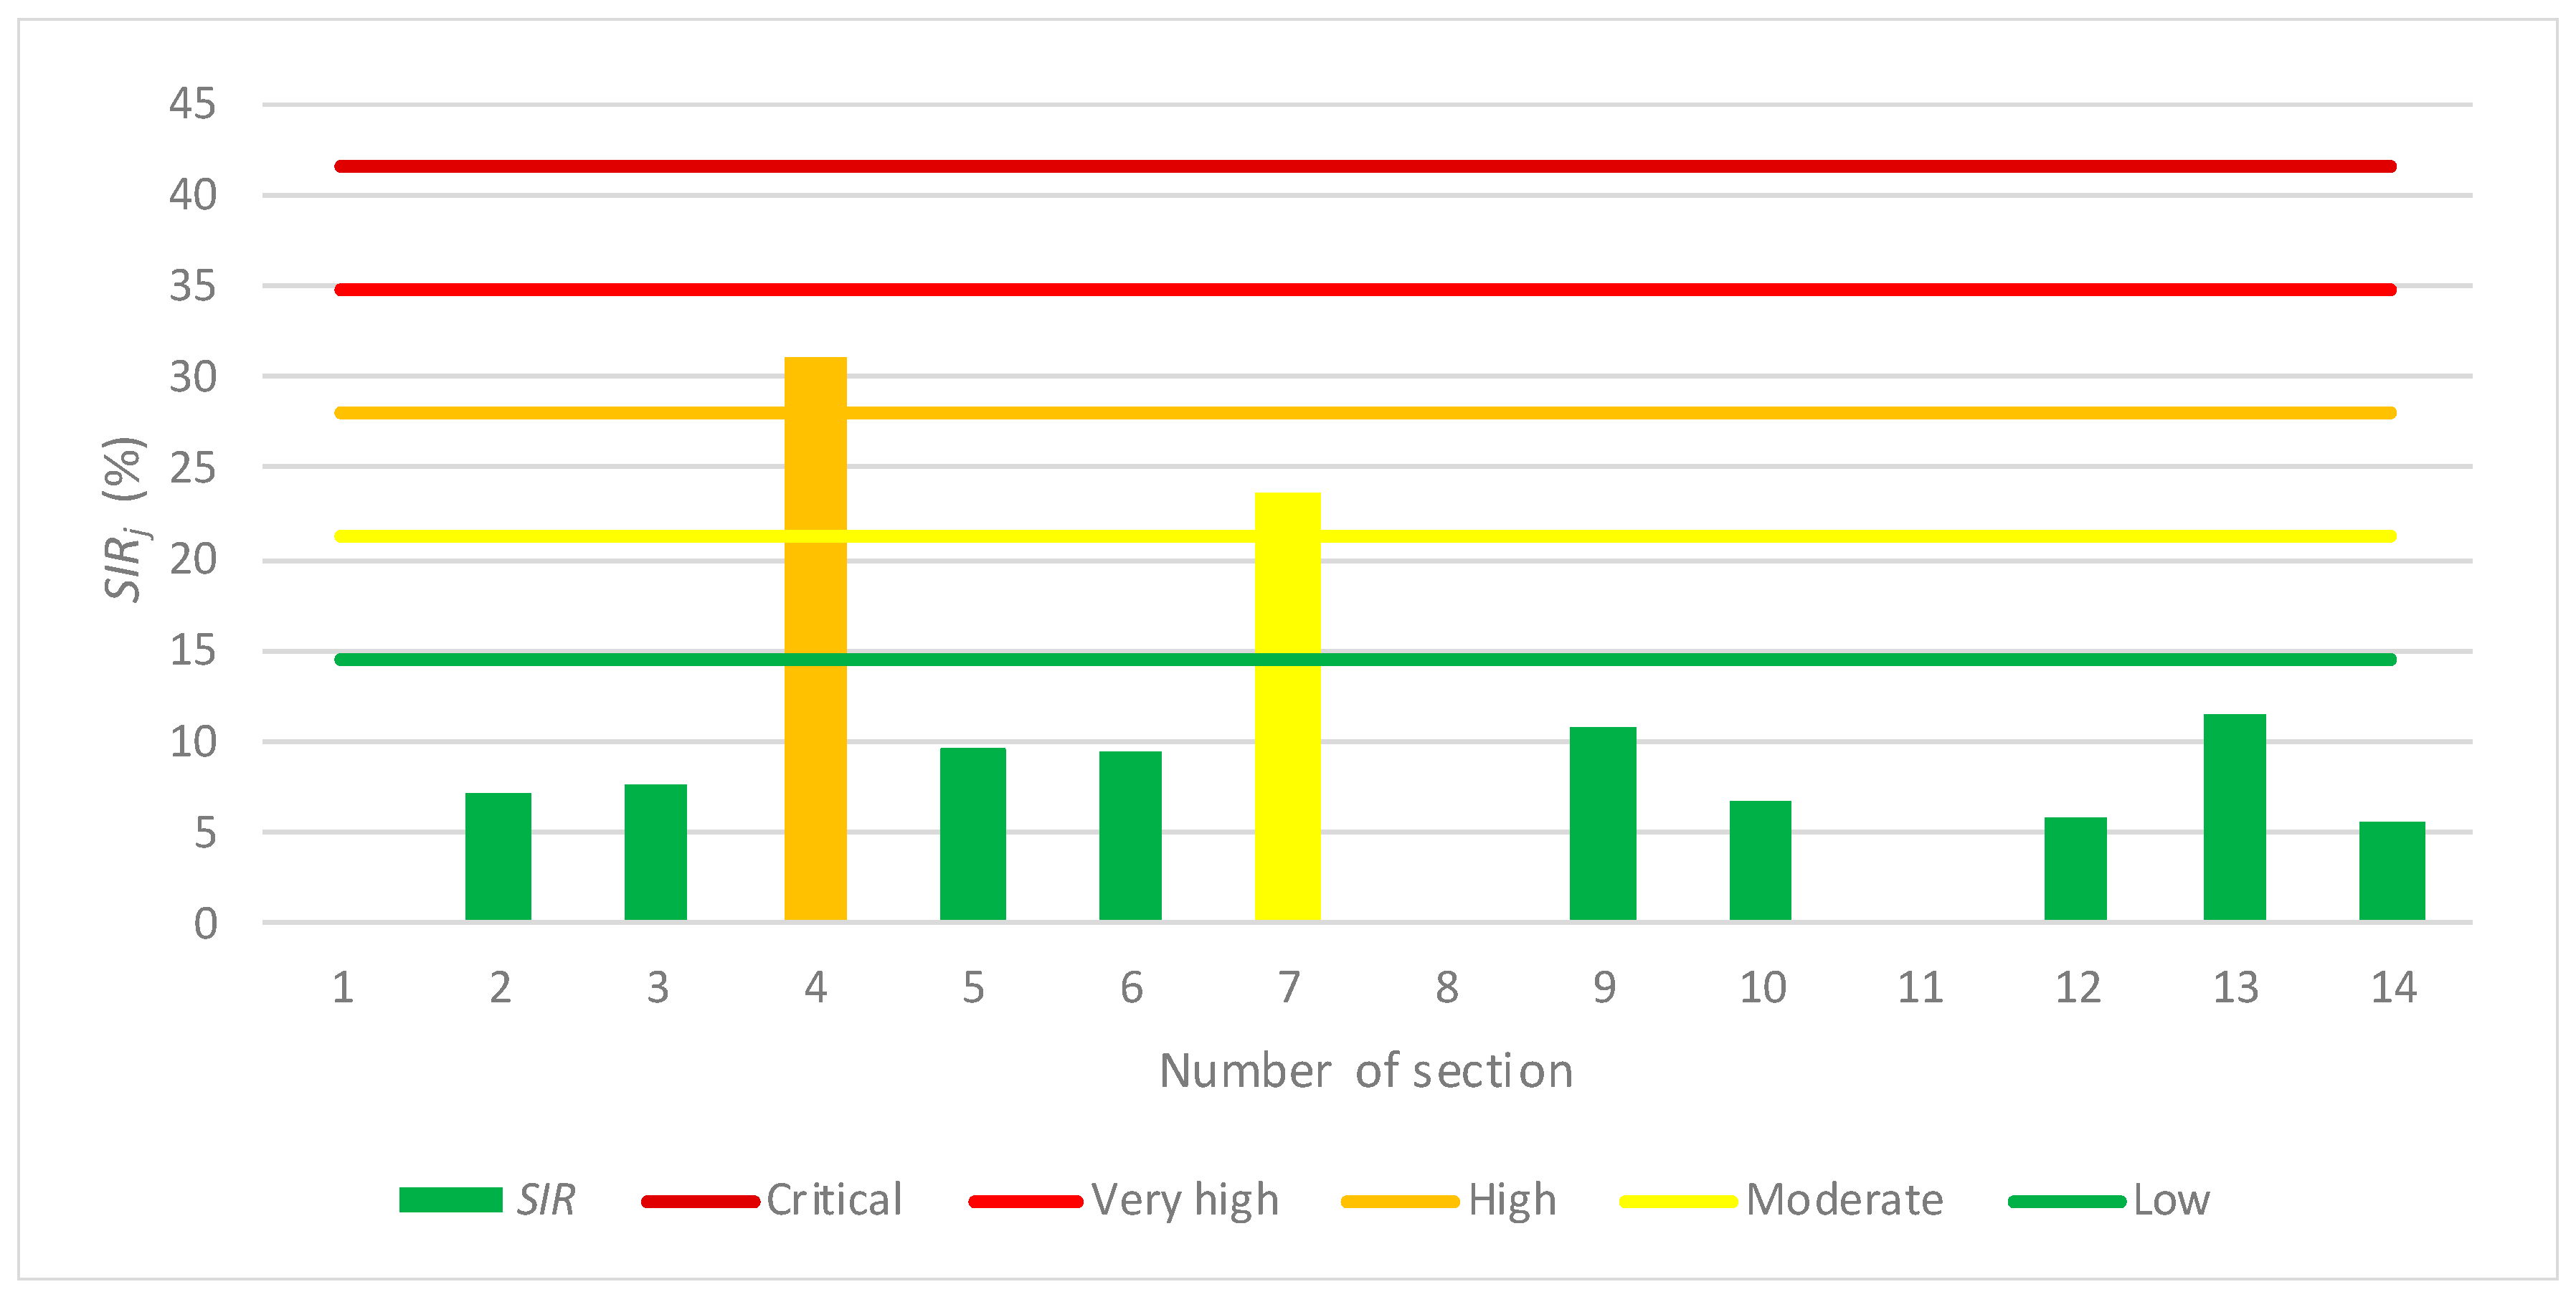
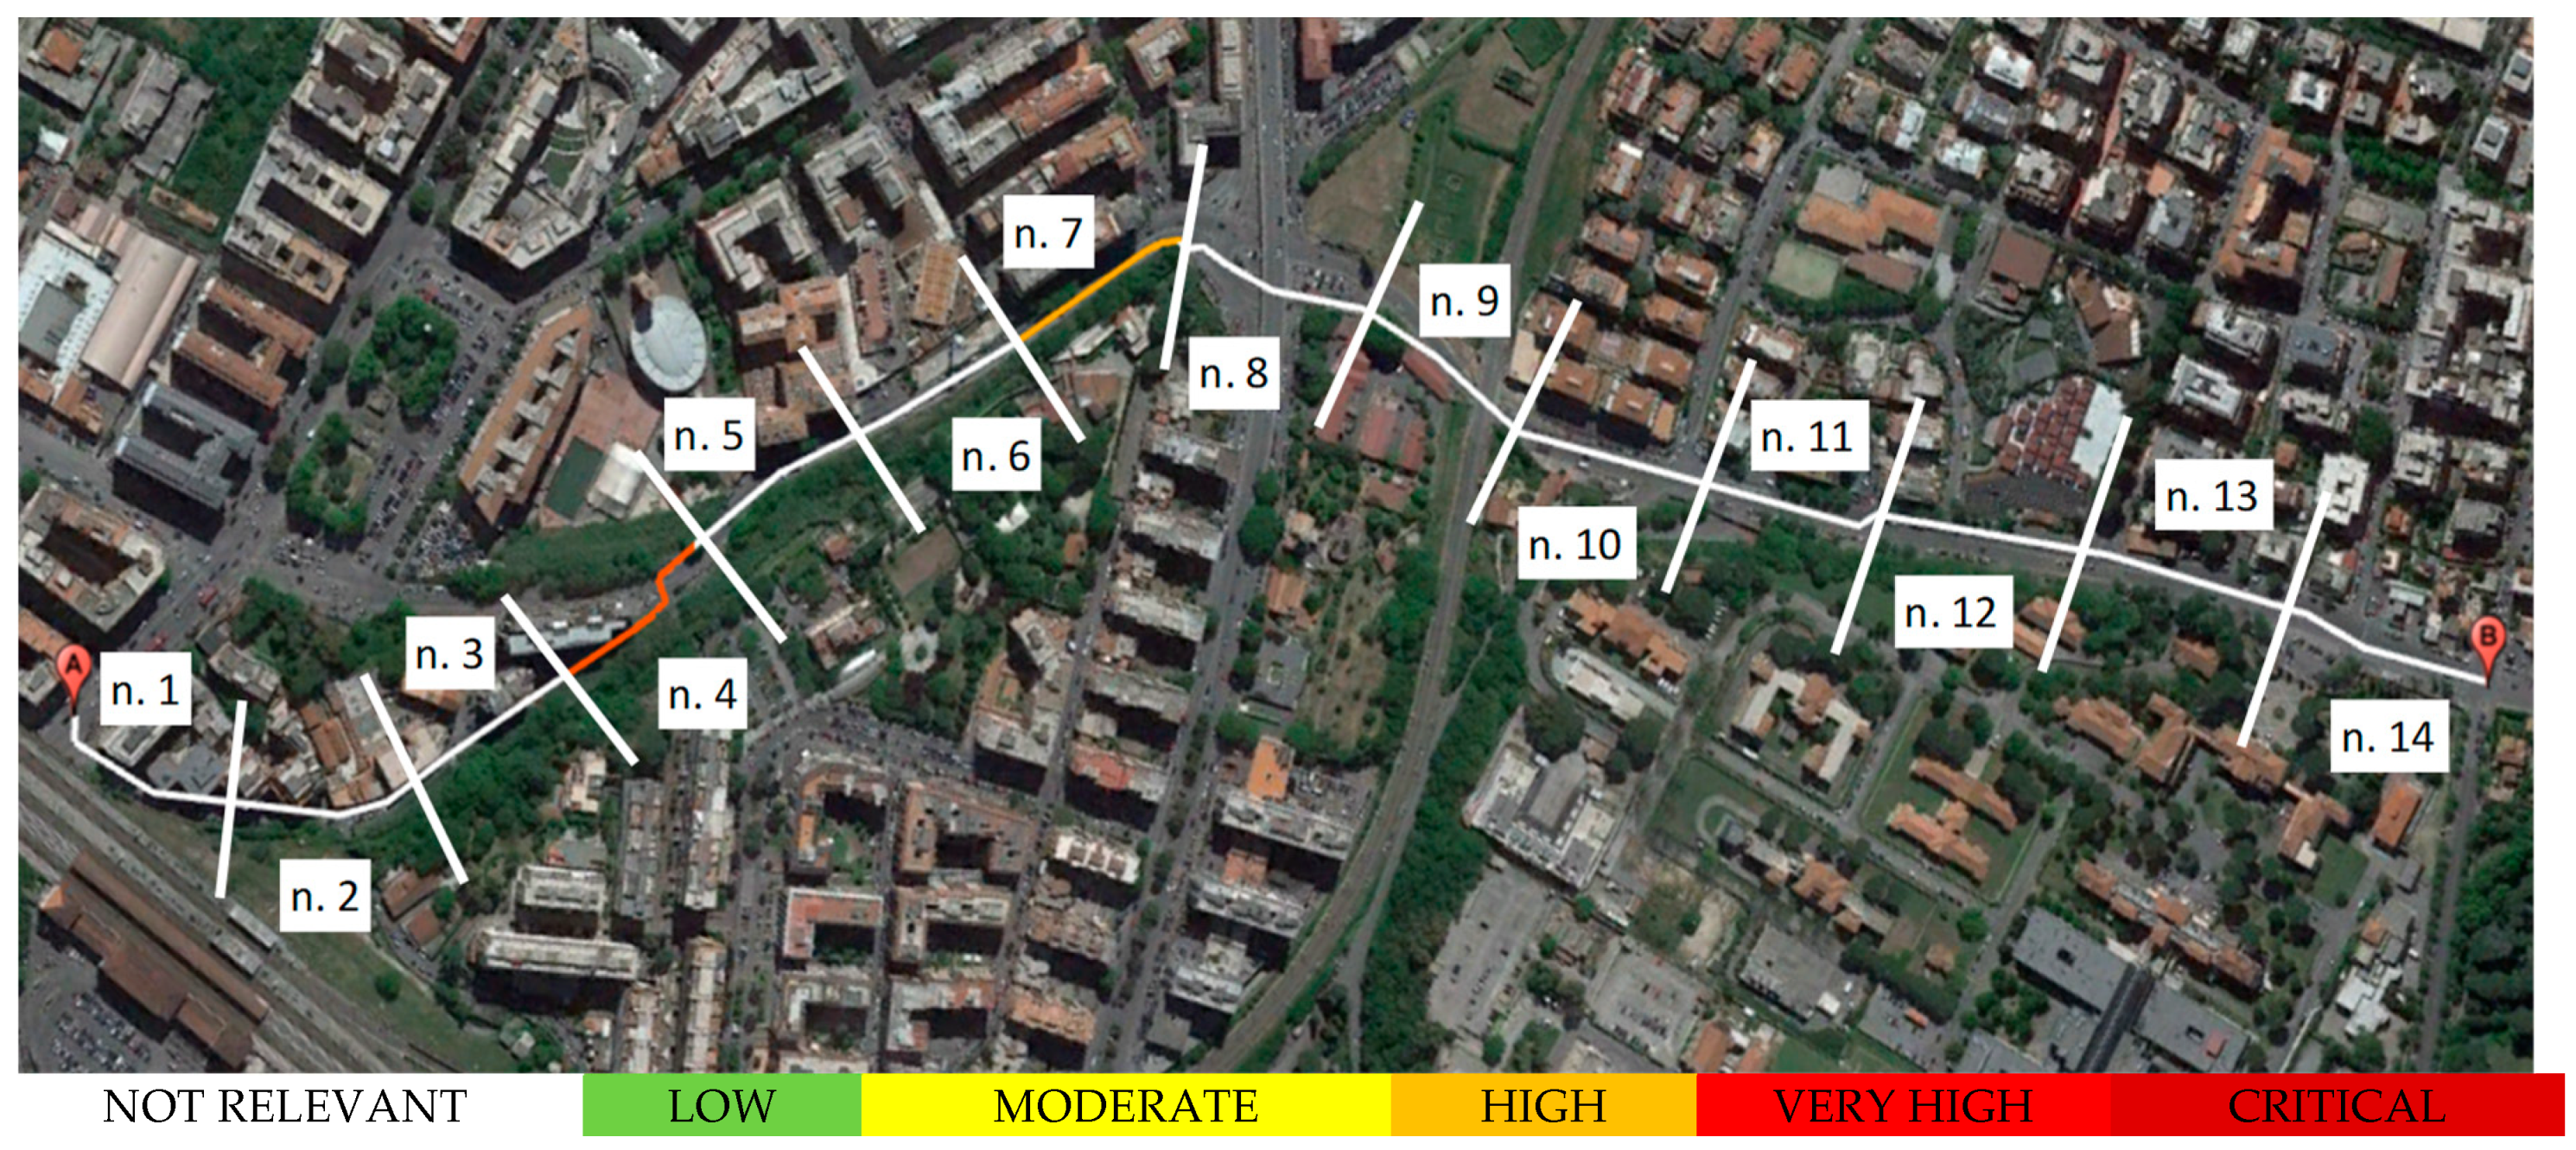
Figure 6 shows the results obtained for ROAD7. Its risk map is in
Figure 7, where it is possible to identify sections 4 and 7 (i.e., orange and yellow bars, respectively).
BIR of ROAD7 is equal to 9.15% (i.e., not relevant level of risk); however, according to
Figure 6 and
Figure 7, it is possible to observe that section n. 4 has a high level of risk (i.e., 31.2%).
Table 9 lists data used to perform the risk assessment.
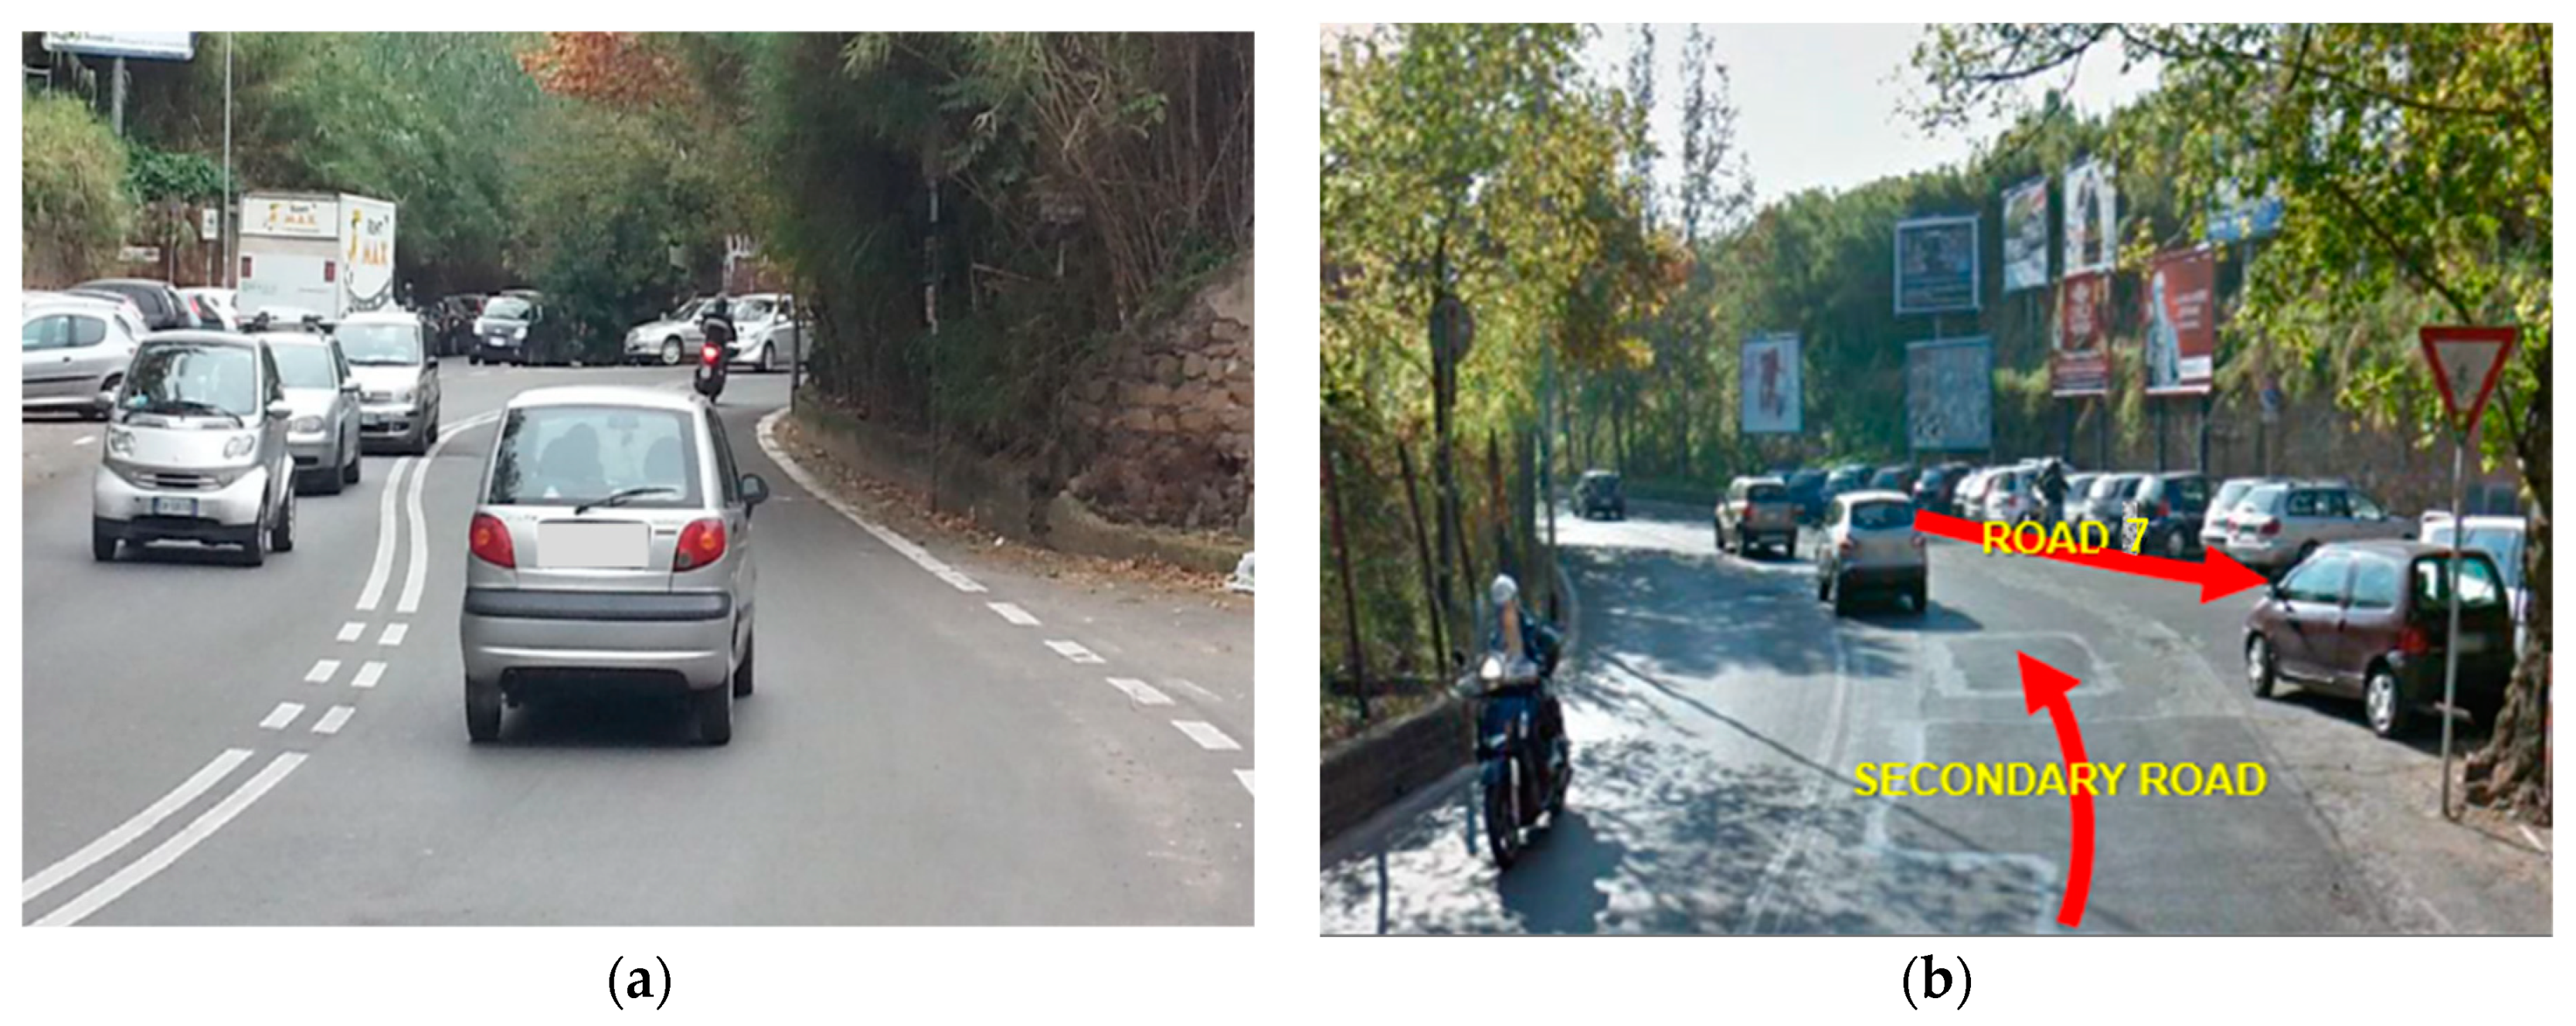
Figure 8a,b represent two surveyed conditions which belong to Section n.4.
The showed elements could cause rear-end collisions (
Figure 8a), and head-on and lateral collisions (
Figure 8b) along the examined section. Details about geo-referenced accidents are not available; therefore, it is not possible to correlate type of defects/elements and type of accidents: it is desirable that these data remain open for further investigation.
The implementation of the proposed methodology allows the management body to identify and make decisions about the strategic priorities for interventions of safety improvement at section and branch levels: geometric, functional, and traffic data of the branches contribute to the assessment of the accident risk for vulnerable users. Indeed, the results are numerical and synthetic, and in decision-making processes, they could allow the management body to identify and to determine the strategic priorities about urban road safety.
Moreover, the proposed model could be modified to assess the index risk of urban intersections. Indeed, the proposed procedure could be modified (e.g., modification of the extension factor), and new relevant coefficients could be calibrated. Finally, the implementation of the approach both at section and at intersection levels could permit us to pursue a network-level approach.
4. Conclusions
The road transport sector is currently adopting growing measures to prevent accidents and reduce their consequences on people, especially on the most vulnerable users (e.g., pedestrians and cyclists).
This paper presents a quantitative risk analysis of deaths and serious injuries caused by urban road accidents. The study proposed a methodology based on the visual inspection to interpret the results from Road Safety Inspections on urban roads, to quantify the safety conditions, and to direct the competent bodies towards the most appropriate interventions.
The method depends on the assumed ranges of variables and risk classes, as well as on the values attributed to the variables used for calculating the hazard index of examined homogeneous road sections and branches. Therefore, both the Section Index Risk (SIR) and the Branch Index Risk (BIR) depend on geometric, functional, physical, and environmental defects or elements which are potential source of road accidents. These factors are then related to the involved vulnerable road users and to existing traffic flows to assess the current levels of risk. The categorization of these values into six levels of risk allows the identification of the most severe conditions and the prioritization of road safety works.
The results from surveying 50 km of roads in an Italian municipality demonstrated the good performance of the proposed tool in identifying, planning, and scheduling all the work required for improving urban road safety, because it is sensitive to improvements of infrastructure.
Moreover, the proposed methodology has both a diagnostic purpose, in order to evaluate whether there may be a correlation between the observed defects and the occurred accidents, and a preventive purpose, in order to correct defects or anomalies that could cause death or serious injuries of road users.


