1. Introduction
Modern vehicles have many systems that offer the driver information that facilitate the driving task or provide details of the rapidly changing road environment in the interests of enhanced mobility. Many such systems are now available on an after-market or ‘nomadic’ device that can be transported into and out of the vehicle when required. Increasingly, however, the functions are also becoming available on a smartphone and the market penetration of these has been increasing rapidly (Statista) [
1]. Such proliferation of technology has, however, led to many questions relating to safety and efficiency. One such issue is the potential of information systems to cause distractions while driving. The National Highway Traffic Safety Administration (NHTSA (
https://www.nhtsa.gov/risky-driving/distracted-driving)) observes that “distracted driving is any activity that diverts attention from driving, including interacting with the navigation system”. When considering driver control of the vehicle, Young and Regan [
2] reviewed several studies showing that drivers consciously or unconsciously attempt to reduce their workload and thereby moderate their exposure to crash risk through distraction while interacting with in-vehicle devices. According to Young and Regan, drivers try to achieve this through a number of means including speed reduction (Alm and Nilsson; Burns, Parkes, Burton, Smith and Burch; Haigney et al.; Rakauskas, Gugerty and Ward) [
3,
4,
5,
6], increasing car-following distance (Jamson, Westerman; Strayer and Drews; Strayer, Drews and Johnston) [
7,
8,
9], moderating the level of attention given to the driving and non-driving tasks as the road environment changes (Brookhuis, de Vries, and de Waard; Chiang Brooks and Weir) [
10,
11], and ultimately accepting reduced overall driving performance (e.g., by checking mirrors and instruments less frequently—Brookhuis et al.; Harbluk, Noy, and Eizenmann) [
10,
12]. However, there appears to be a lack of research relating to individual drivers’ own perceptions of safety whilst interacting with in-vehicle information systems (IVISs). Of particular relevance is whether use of such systems increases the risk of driver distraction and therefore reduces drivers’ overall perceptions of safety. The study described in this paper aims to address this lack of research.
Field operational tests (FOTs) are being increasingly used in studies of road transportation and safety research. A definition of an FOT was made in the Field Operational Test Support Action (FESTA) handbook in 2008, now in its fifth revision (FESTA, 2016) [
13], which defines FOTs as “studies undertaken to evaluate a function or functions under normal operating conditions in environments typically encountered by the host vehicle(s) using quasi-experimental methods”. Essentially, therefore, an FOT involves a large-scale program that aims to assess the efficiency, quality, robustness, and acceptance of information and communication technology (ICT) solutions for smarter, safer, cleaner, and more comfortable transport and travel. Such ICT technologies include, for example, navigation and traffic information systems, advanced driver support systems, and co-operative vehicle-highway systems.
The TeleFOT project (Field operational tests of aftermarket nomadic devices in vehicles) involved a number of large-scale pan-European FOTs (LFOT) with the collective aim to assess the impacts of driver support functions provided by nomadic devices on the driving task as well as on the transportation process as a whole (testing and evaluation strategy reference). These functions were Navigation, Traffic Information, Speed Information/Alert, and Green Driving Support.
Whilst much of the safety analysis (Welsh, Morris et al.) [
14] within the TeleFOT project uses data based upon ‘facts’ logged in either travel diaries or collected using simple data acquisition systems placed in the vehicle, participants were also asked to judge the impact they ‘perceived’ the support function to have had upon their safety. This was established before, during, and at the end of the FOT. This paper focuses upon these perceptions and how they changed by comparing the pre-study expectations to the post-study evaluation. The paper also considers which of the functions were perceived to have the most potential in respect of increasing safety.
2. Method
Participants were recruited into the TeleFOT project based upon sampling criteria that related to age (25–55 years), number of years driving experience (>3 years), and number of kilometers driven per year (>10,000 km). In addition, it was intended that participants should have either no or very little/only occasional prior experience with the functions to be evaluated within the FOT. It is, however, acknowledged that some of the participants may have had more experience than they indicated, but it is not possible to verify this. Participants were invited to local briefing sessions where the systems and functions were demonstrated and the assistance they could expect to be provided by the function was explained. Participants had the opportunity to ask any questions concerning the systems/functions prior to undertaking the FOT and at any point during their participation.
During their involvement in the TeleFOT field operational tests, participants were asked on four occasions to indicate how their perception of safety was affected by using the specific support function under test (Navigation, Traffic Information, Speed Information/Alert, or Green Driving Support). At the outset, prior to using the function, they were asked ‘Do you think that your safety while driving will change with your access to the support system?’ This was then assessed at two further points during the FOT and then again finally once the FOT was completed. The post-study questionnaire asked ‘Do you find that your safety whilst driving has changed due to your access to the support system?’ Responses were given on a five-point Likert scale as follows: 1 = Radical Decrease (in safety), 2 = Slight Decrease, 3 = No Change, 4 = Slight Increase, 5 = Radical Increase.
Of the FOTs that took place during TeleFOT, those included in the analysis presented in this paper are listed in
Table 1 together with the FOT sample size, the duration of the FOT, the functions tested with the system used, and the analysis sample size. Only participants who completed both the pre- and post-FOT questionnaires are included in the analysis (which follows a repeated measures design).
The diver support offered by the functions was predefined via use cases that specified the functionality required for the FOTs. Navigation preference could be set by the participant and utilized both verbal and visual instructions with the options for fastest or shortest routing. Traffic Information was received while driving, via connection of the system being used with real-time updated databases with a warning displayed on the device each time a critical situation was detected along the pre-set (Navigation) path to be followed. For Speed Information/Alert, the actual speed limit at any point was displayed on the device screen, either continuously or each time the speed limit changed to alert the driver of the change. While driving, the system continuously checked the actual vehicle speed (either via the CAN-bus (Controller Area Network) or the GPS (Global Positioning System) speed) in comparison with the actual speed limit at every point. When the vehicle speed exceeded the speed limit by a predetermined percentage or amount, an alert was given to the driver by a visual/acoustical warning. The device screen displayed the actual speed as well as the speed limit. The Green Driving function collected information on fuel use and CO2 emissions. The system then informed the driver about, for example, excessive fuel use and driving habits (e.g., excessive acceleration) to give an overview of how ‘greenly’ the participant was driving and how they could improve.
The results focus first upon how the perception of safety at the end of the trial met the pre-trial expectation for each of the different functions. The Likert scale data is classified as ordinal data and each participant gave a response pre-FOT and post-FOT, thus resulting in paired data sets over a longitudinal study. Wilcoxon’s Signed Rank test is appropriate to establish significant differences in responses for paired ordinal data using the following null and alternative hypotheses:
H0 There is no difference between the pre and post-test perception of safety.
HA There is a difference between the pre and post-test perception of safety.
The second phase of the analysis considers, of all the functions and irrespective of FOT, which was perceived to have the most safety benefit prior to the study and then which was perceived to have been the most beneficial for safety at the end of the study. For this analysis, the responses were grouped into three categories (Decrease in Safety, No Change, and Increase in Safety) by combining the radical and slight categories together. To test for significant differences across the different functions, the Kruskal-Wallis test was used to test the following null and alternative hypotheses (both pre- and post-FOT):
H0 There is no difference in the perception of safety offered by the different functions.
HA There is a difference in the perception of safety offered by the different functions.
All statistical tests were carried out at the 95% significance level, with α = 0.05. Thus, significant results are obtained when sig(p) < 0.05. Significant results infer that that any observed differences in the TeleFOT sample data are highly likely (more than 95% chance) to be also observed in the population as a whole, whereas non-significant results are less likely to be representative.
3. Results
3.1. Navigation
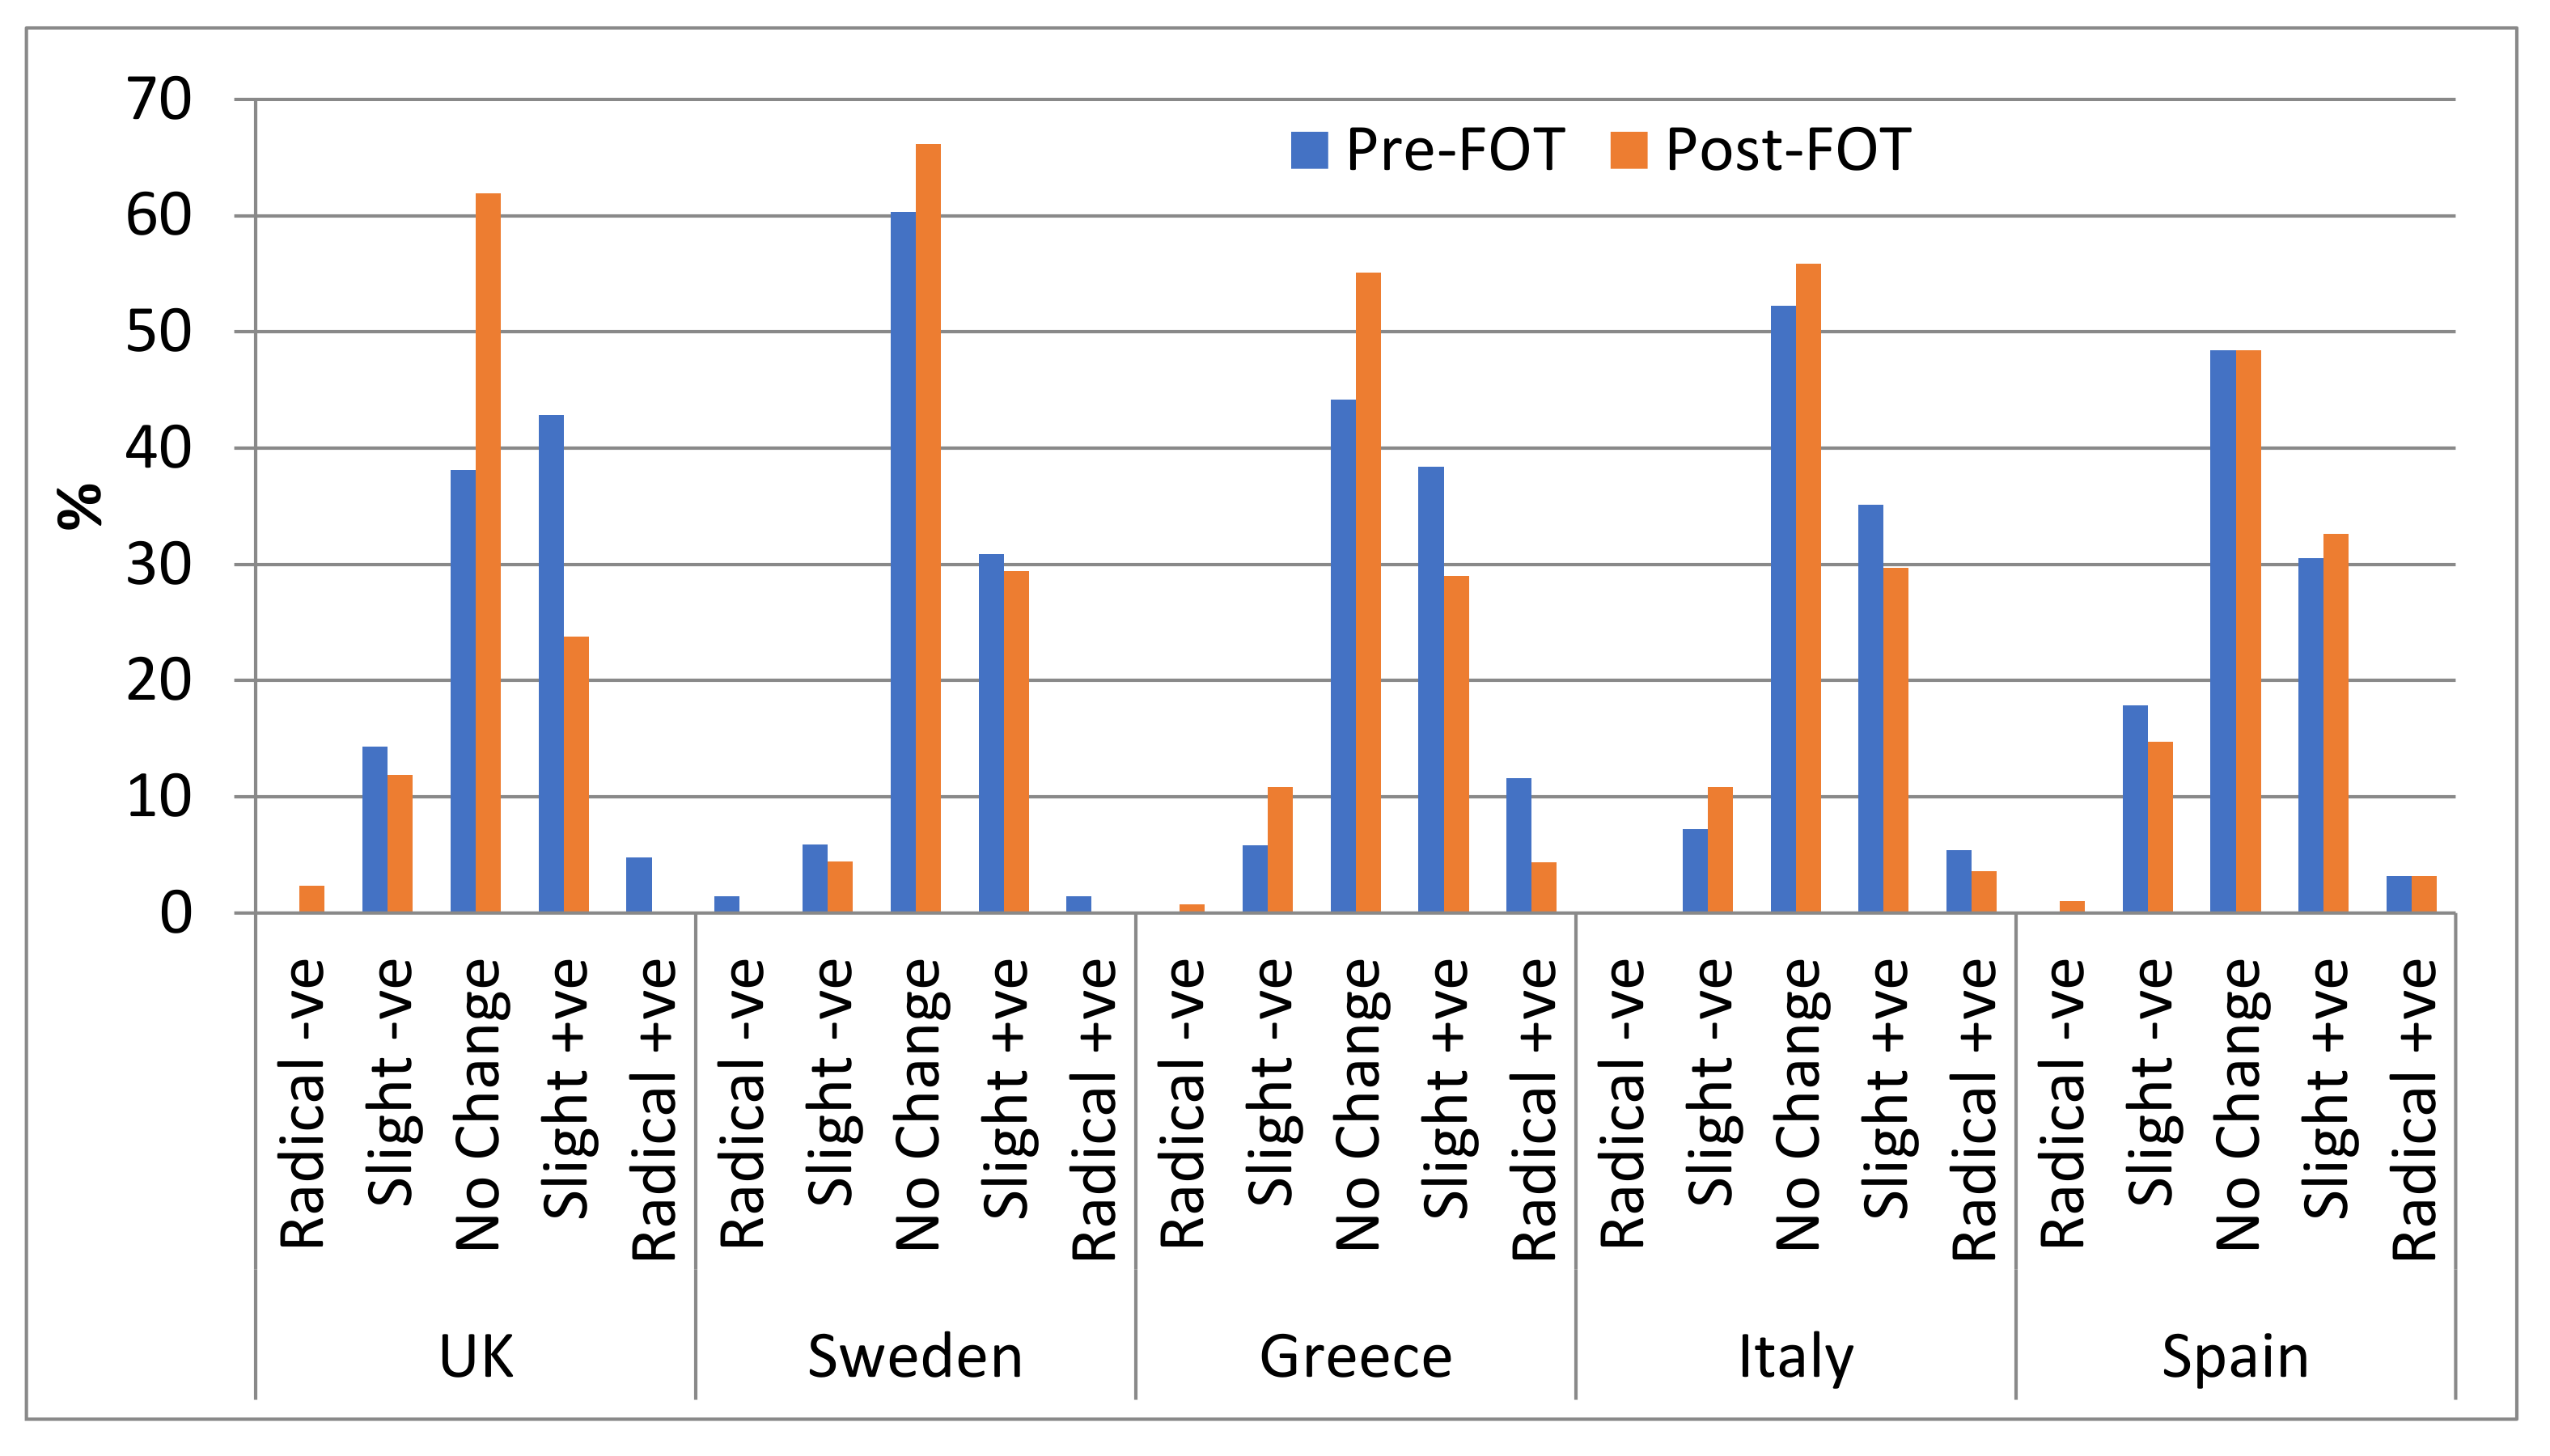
Navigation was assessed in five FOTs undertaken in Greece, Italy, Spain, Sweden, and the UK. Considering all participants across the five countries, 41% expected the safety of their driving to improve when they used navigation. The pre- and post-questionnaire responses per country are shown in
Figure 1 and the results of the Wilcoxon signed rank tests are presented in
Table 2.
For all countries, the modal value before the FOT commenced was 3 (‘No Change’) expected in safety while driving with the use of navigation. Drivers in Greece had the highest expectation (rating 4 and 5 combined) of safety improvements prior to the study (50%) followed by those in the UK (48%). For the other countries, safety benefits were generally anticipated by around a third of participants. Overall, in comparing pre-test with post-test responses, no changes in the distribution of responses were observed for Sweden, Italy, or Spain. However, in the UK and in Greece there was an overall reduction in the rating, with a shift towards a more neutral and slight perceived negative effect upon safety compared to original expectations.
3.2. Speed Information/Alert
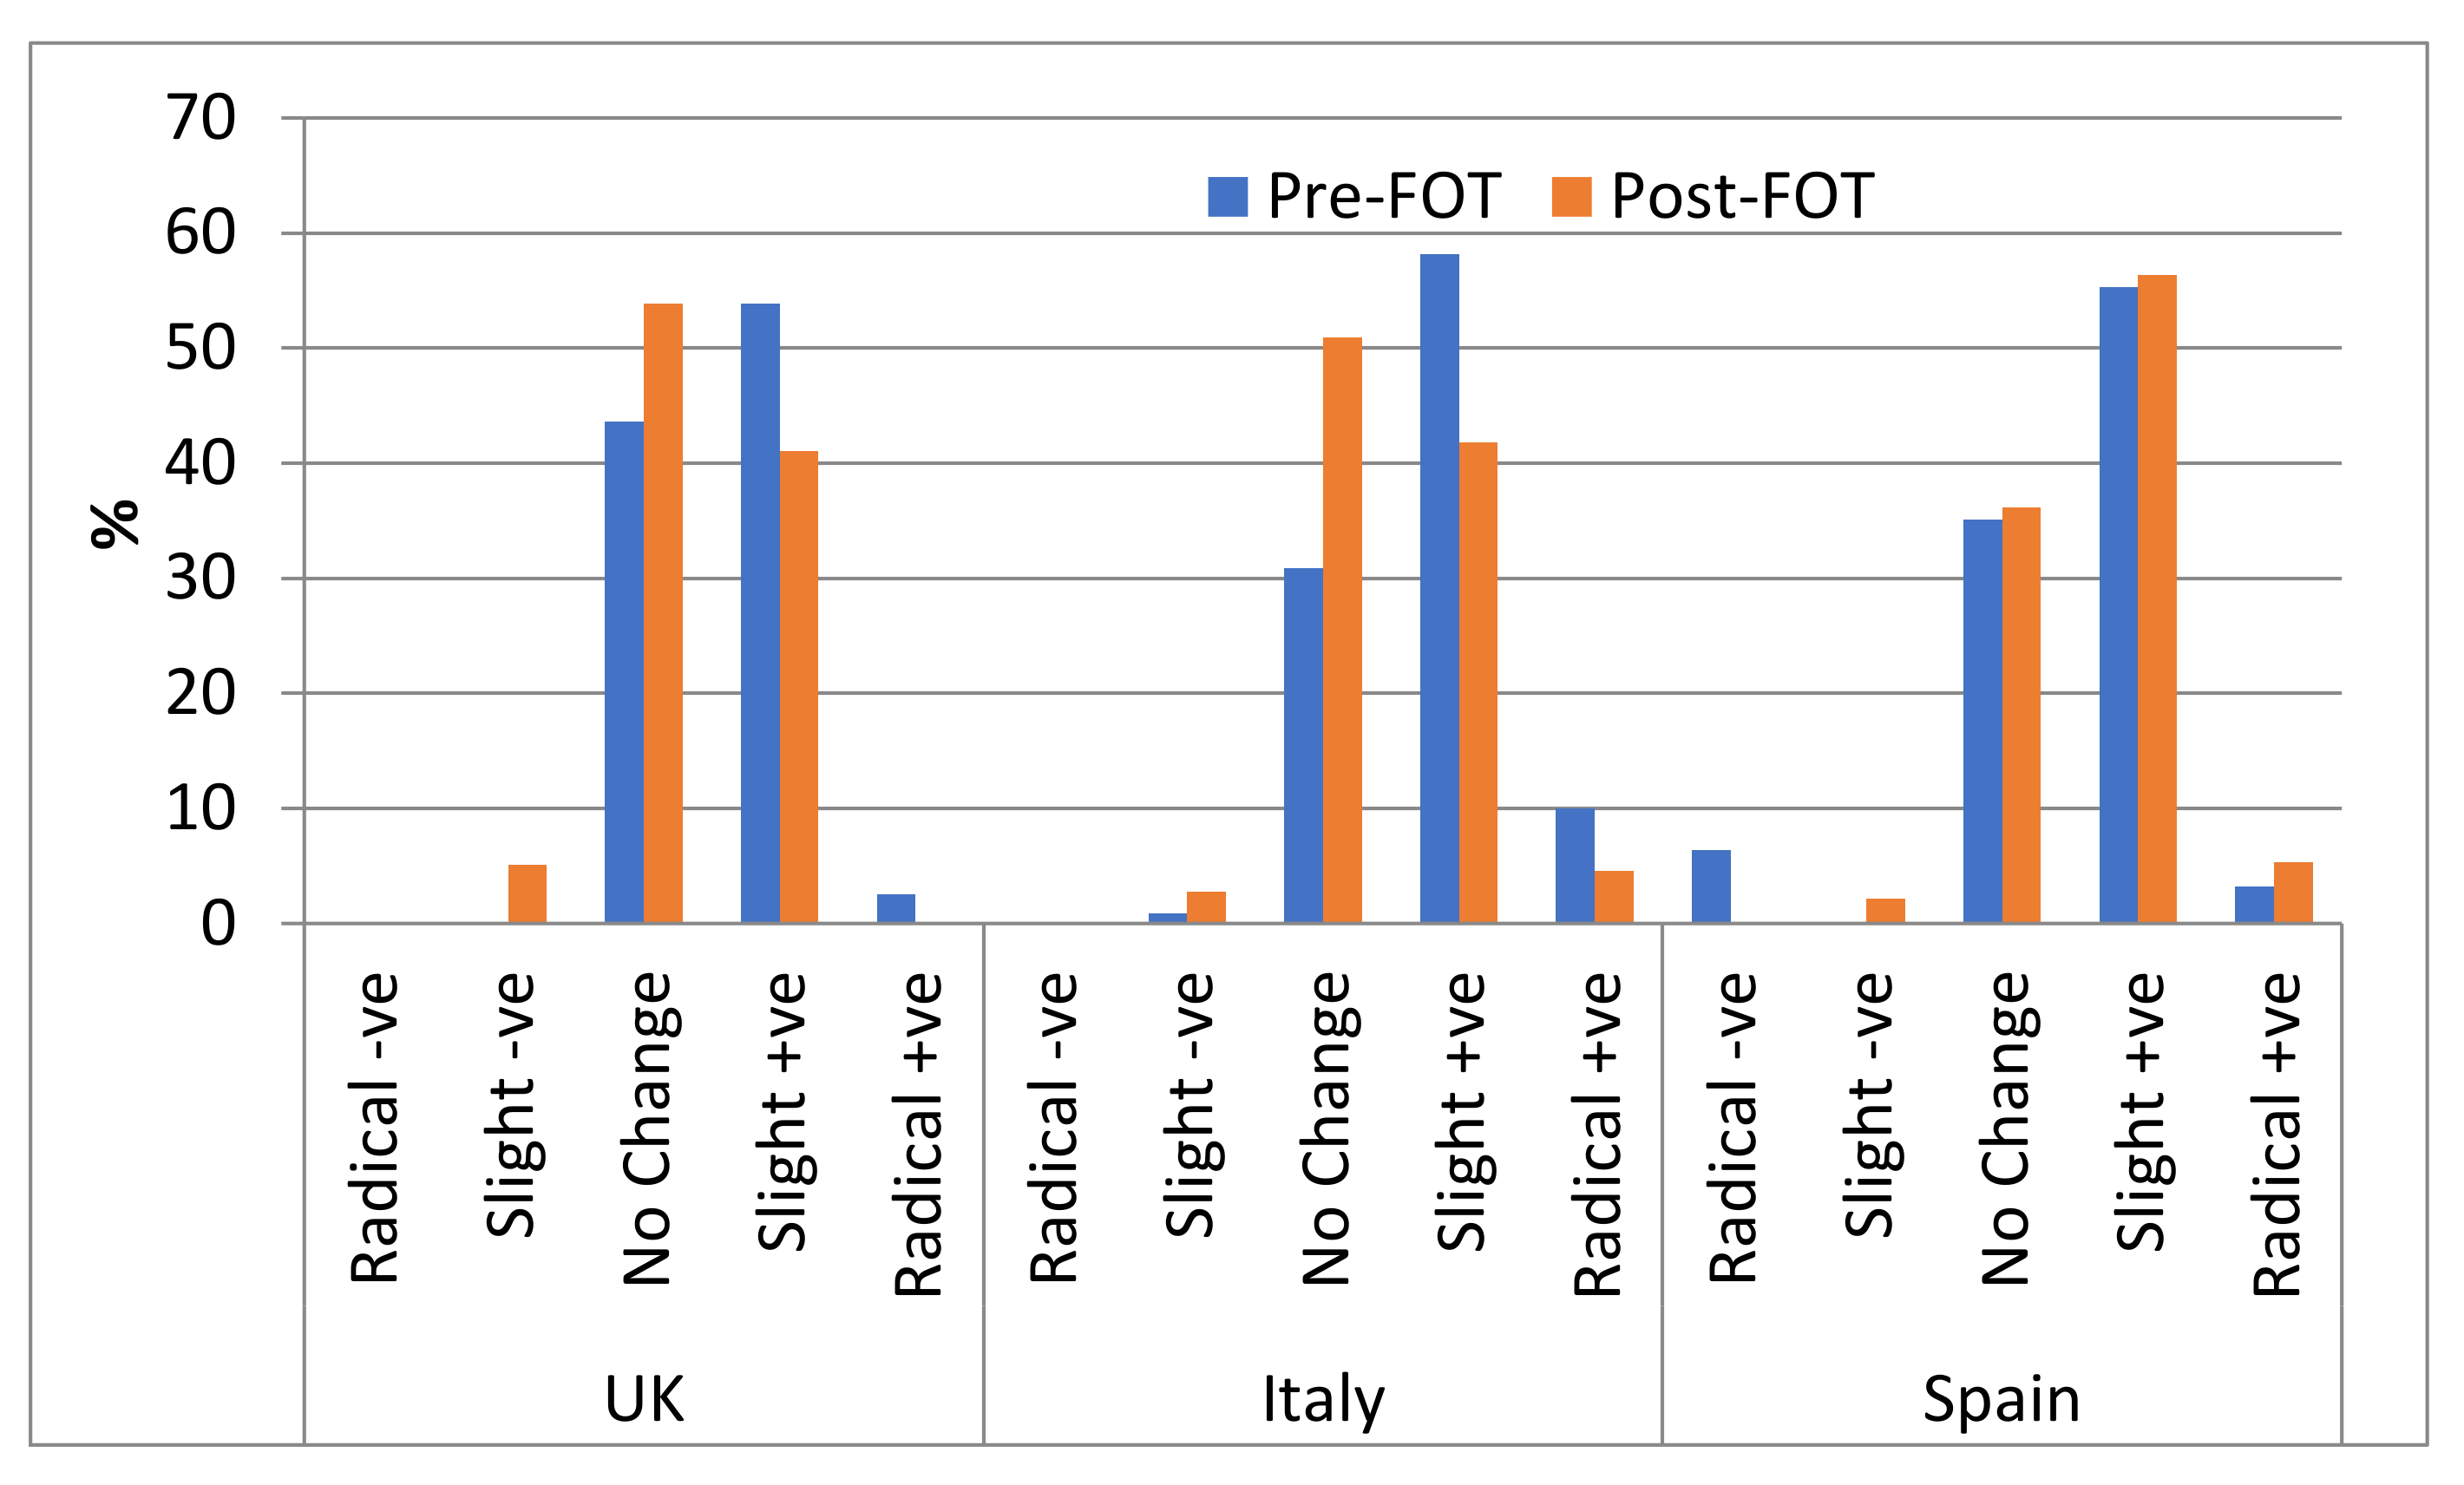
Speed Information/Alert featured in FOTs in the UK, Italy, and Spain. Combining all participants across the three FOTs, 62% anticipated an improvement in safety (response 4 or 5) with the use of Speed Information/Alert. The pre- and post-questionnaire responses per country are shown in
Figure 2 and the results of the Wilcoxon signed rank tests are presented in
Table 3.
The modal response was ‘Slight Increase’ in each country in the pre-FOT assessment, with 68% of Italian, 56% of Spanish, and 55% of UK participants expecting at least a slight increase in safety with the use of Speed Information/Alert. Upon completion of the FOT, there were significant differences in the perceived safety in the UK and Italy with a move towards ‘No Change’. There was no significant difference in the pre- and post-FOT responses overall for Spain. Very few participants either anticipated or reported through experience after the FOT that Speed Information/Alert had a negative impact on safety whilst driving.
3.3. Traffic Information
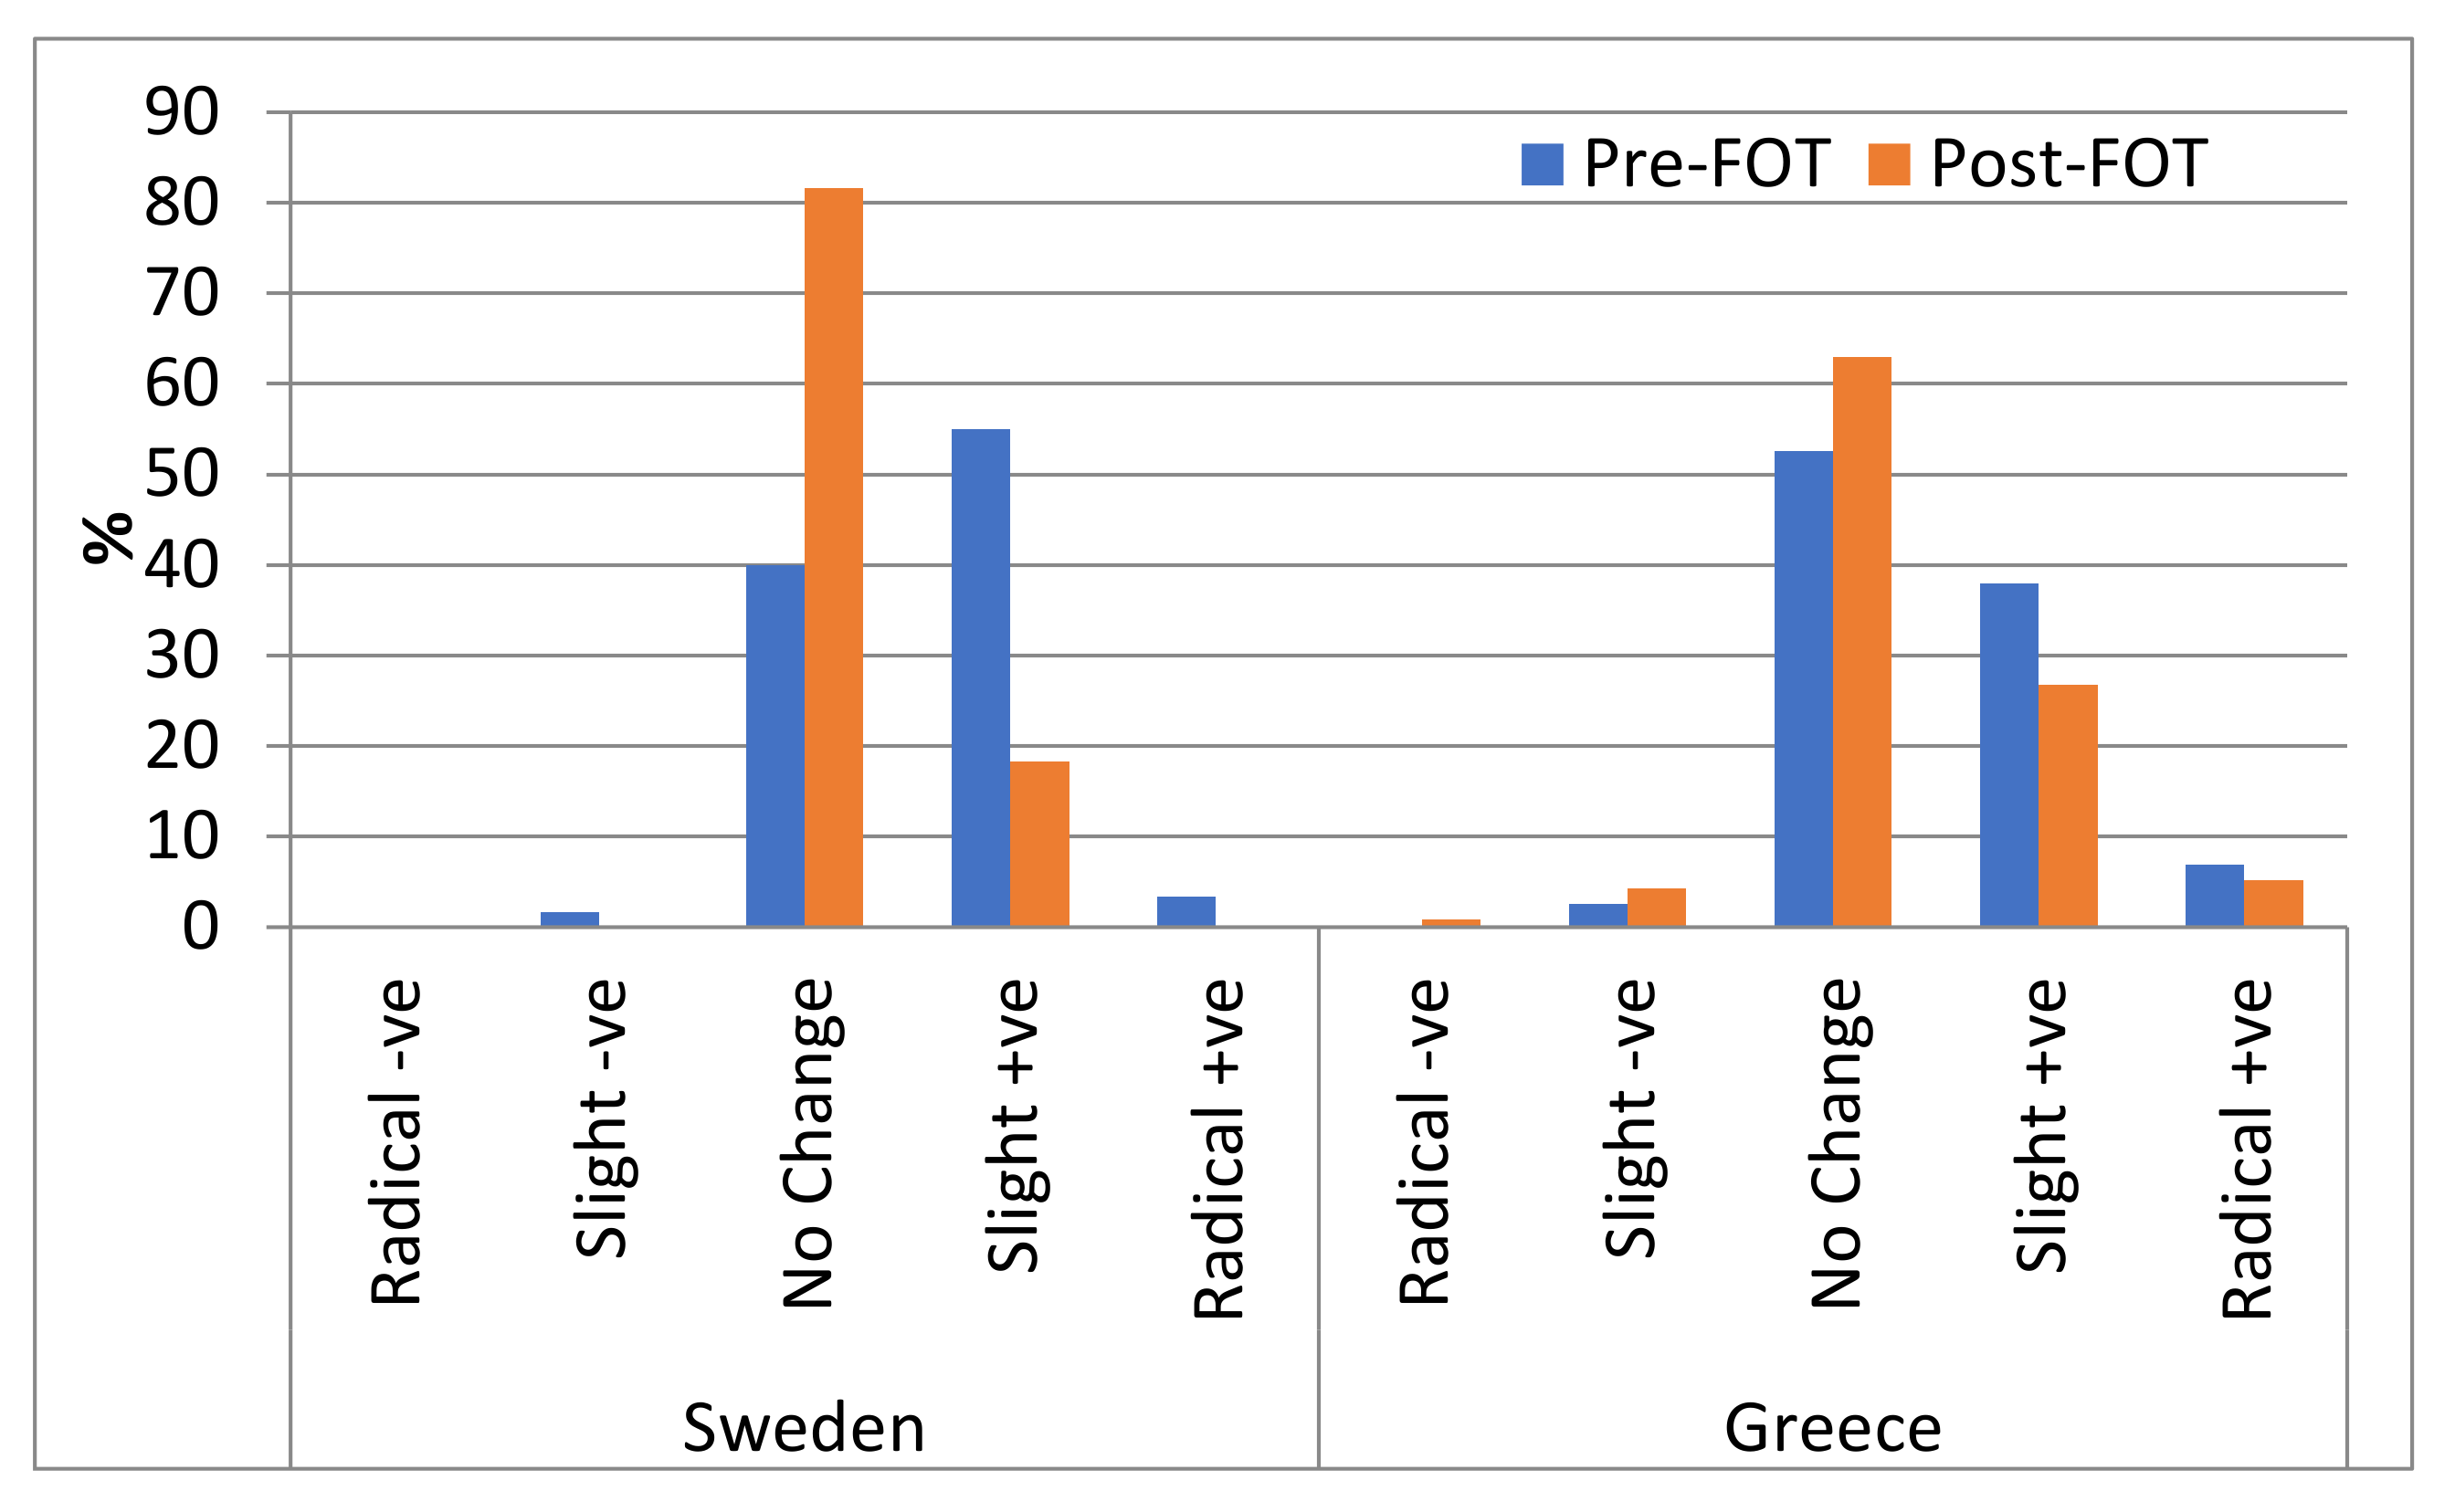
FOTs from Sweden and Greece contributed to the analysis relating to Traffic Information. In Sweden, 58% of participants expected Traffic Information to give a safety benefit and in Greece the figure was 45% (50% when countries are combined). The distribution of pre- and post-FOT questionnaire responses per country are shown in
Figure 3 and the results of the test of differences comparing pre- and post FOT are shown in
Table 4.
In Sweden, the modal pre-FOT response anticipated a slight increase in safety whilst in Greece the modal pre-FOT response anticipated ‘No Change’. There was a significant difference in the post-FOT response for Sweden with a distinct move towards perceiving no change in safety. There was a similar pattern in the data from Greece; however, in this case the result does not indicate a significant difference (although the result is marginal and would be significant for a directional test).
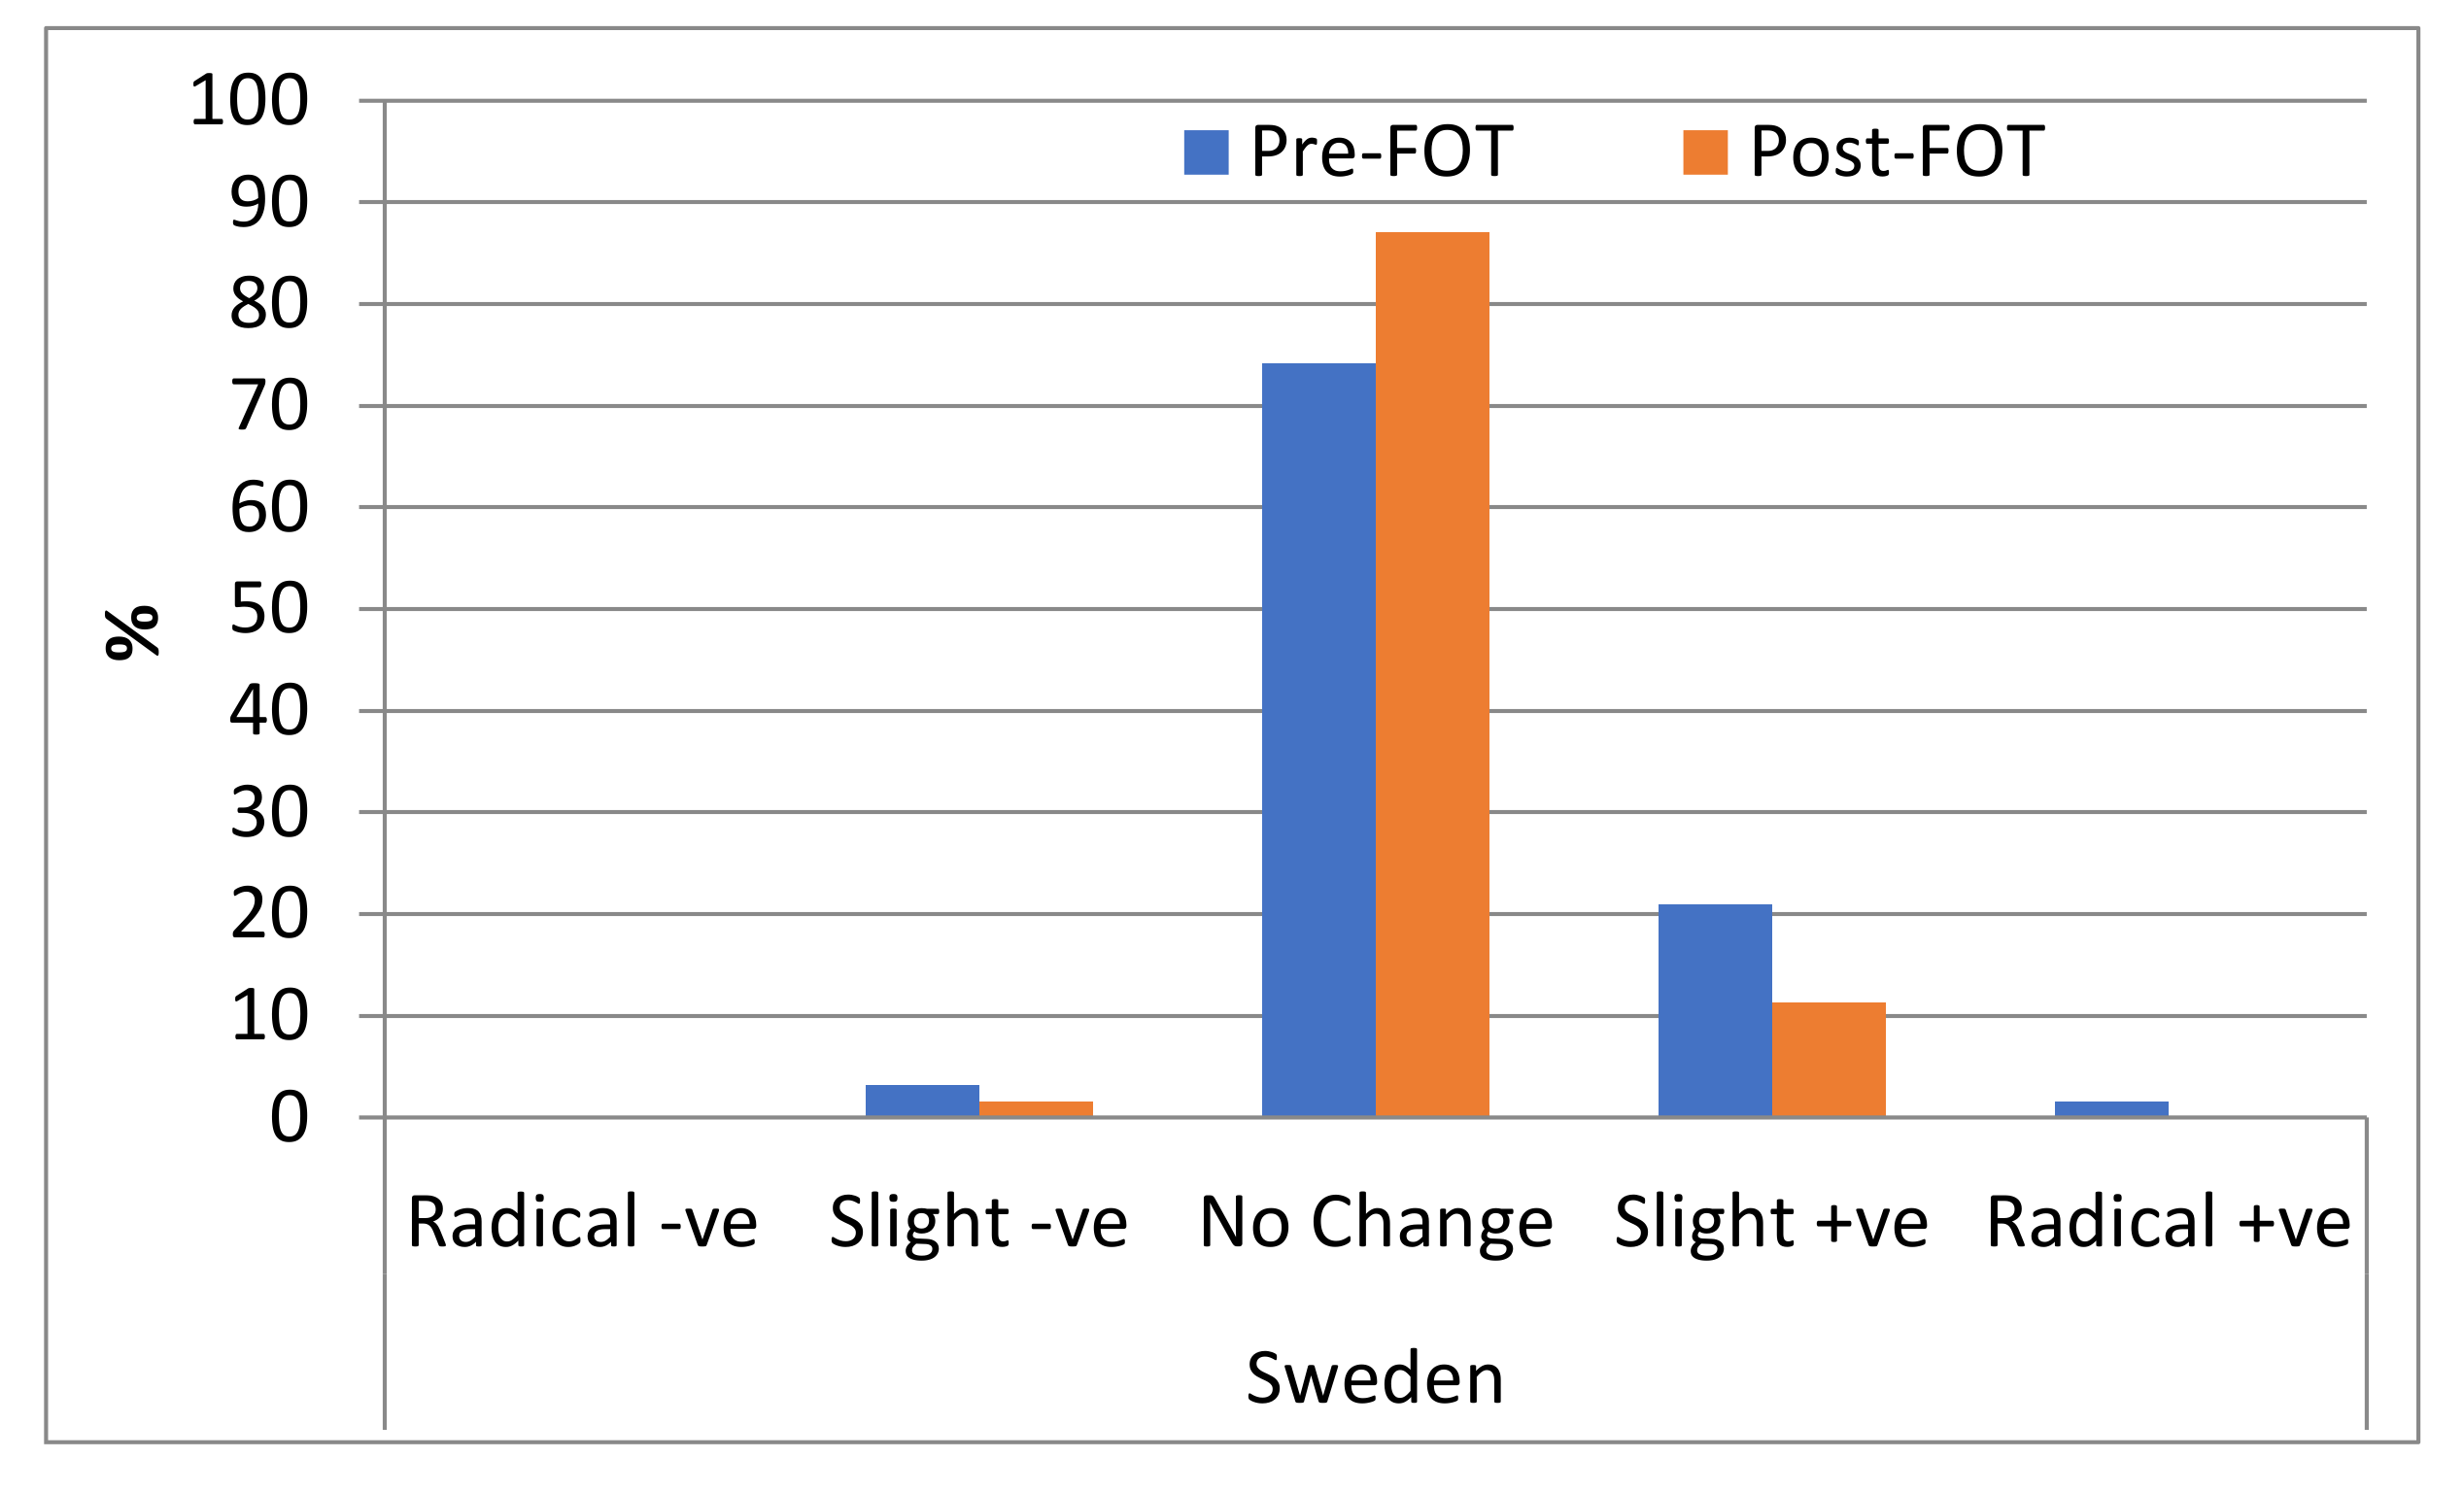
3.4. Green Driving
Green Driving Support was assessed as a function in the Swedish FOT. Just over 20% of the drivers anticipated an increase in safety whilst driving associated with the Green Driving Support. The vast majority anticipated no change (75%) and this increased post-FOT (88%), as shown in
Figure 4; however, the difference between pre- and post-FOT responses is not significant for the two-tailed hypothesis stated (see
Table 5). It would, however, be significant for a one-tailed test, had a direction been assigned to the alternative hypothesis.
3.5. Difference in Perceptions across Functions
Kruskal-Wallis Analyses of Variance (ANOVAs) show that there is a significant difference in the rating of both the perceived expected safety impact (pre-FOT) with use across the different functions (
p < 0.001) and also in the rating of the perceived safety impact (post-FOT,
p < 0.001).
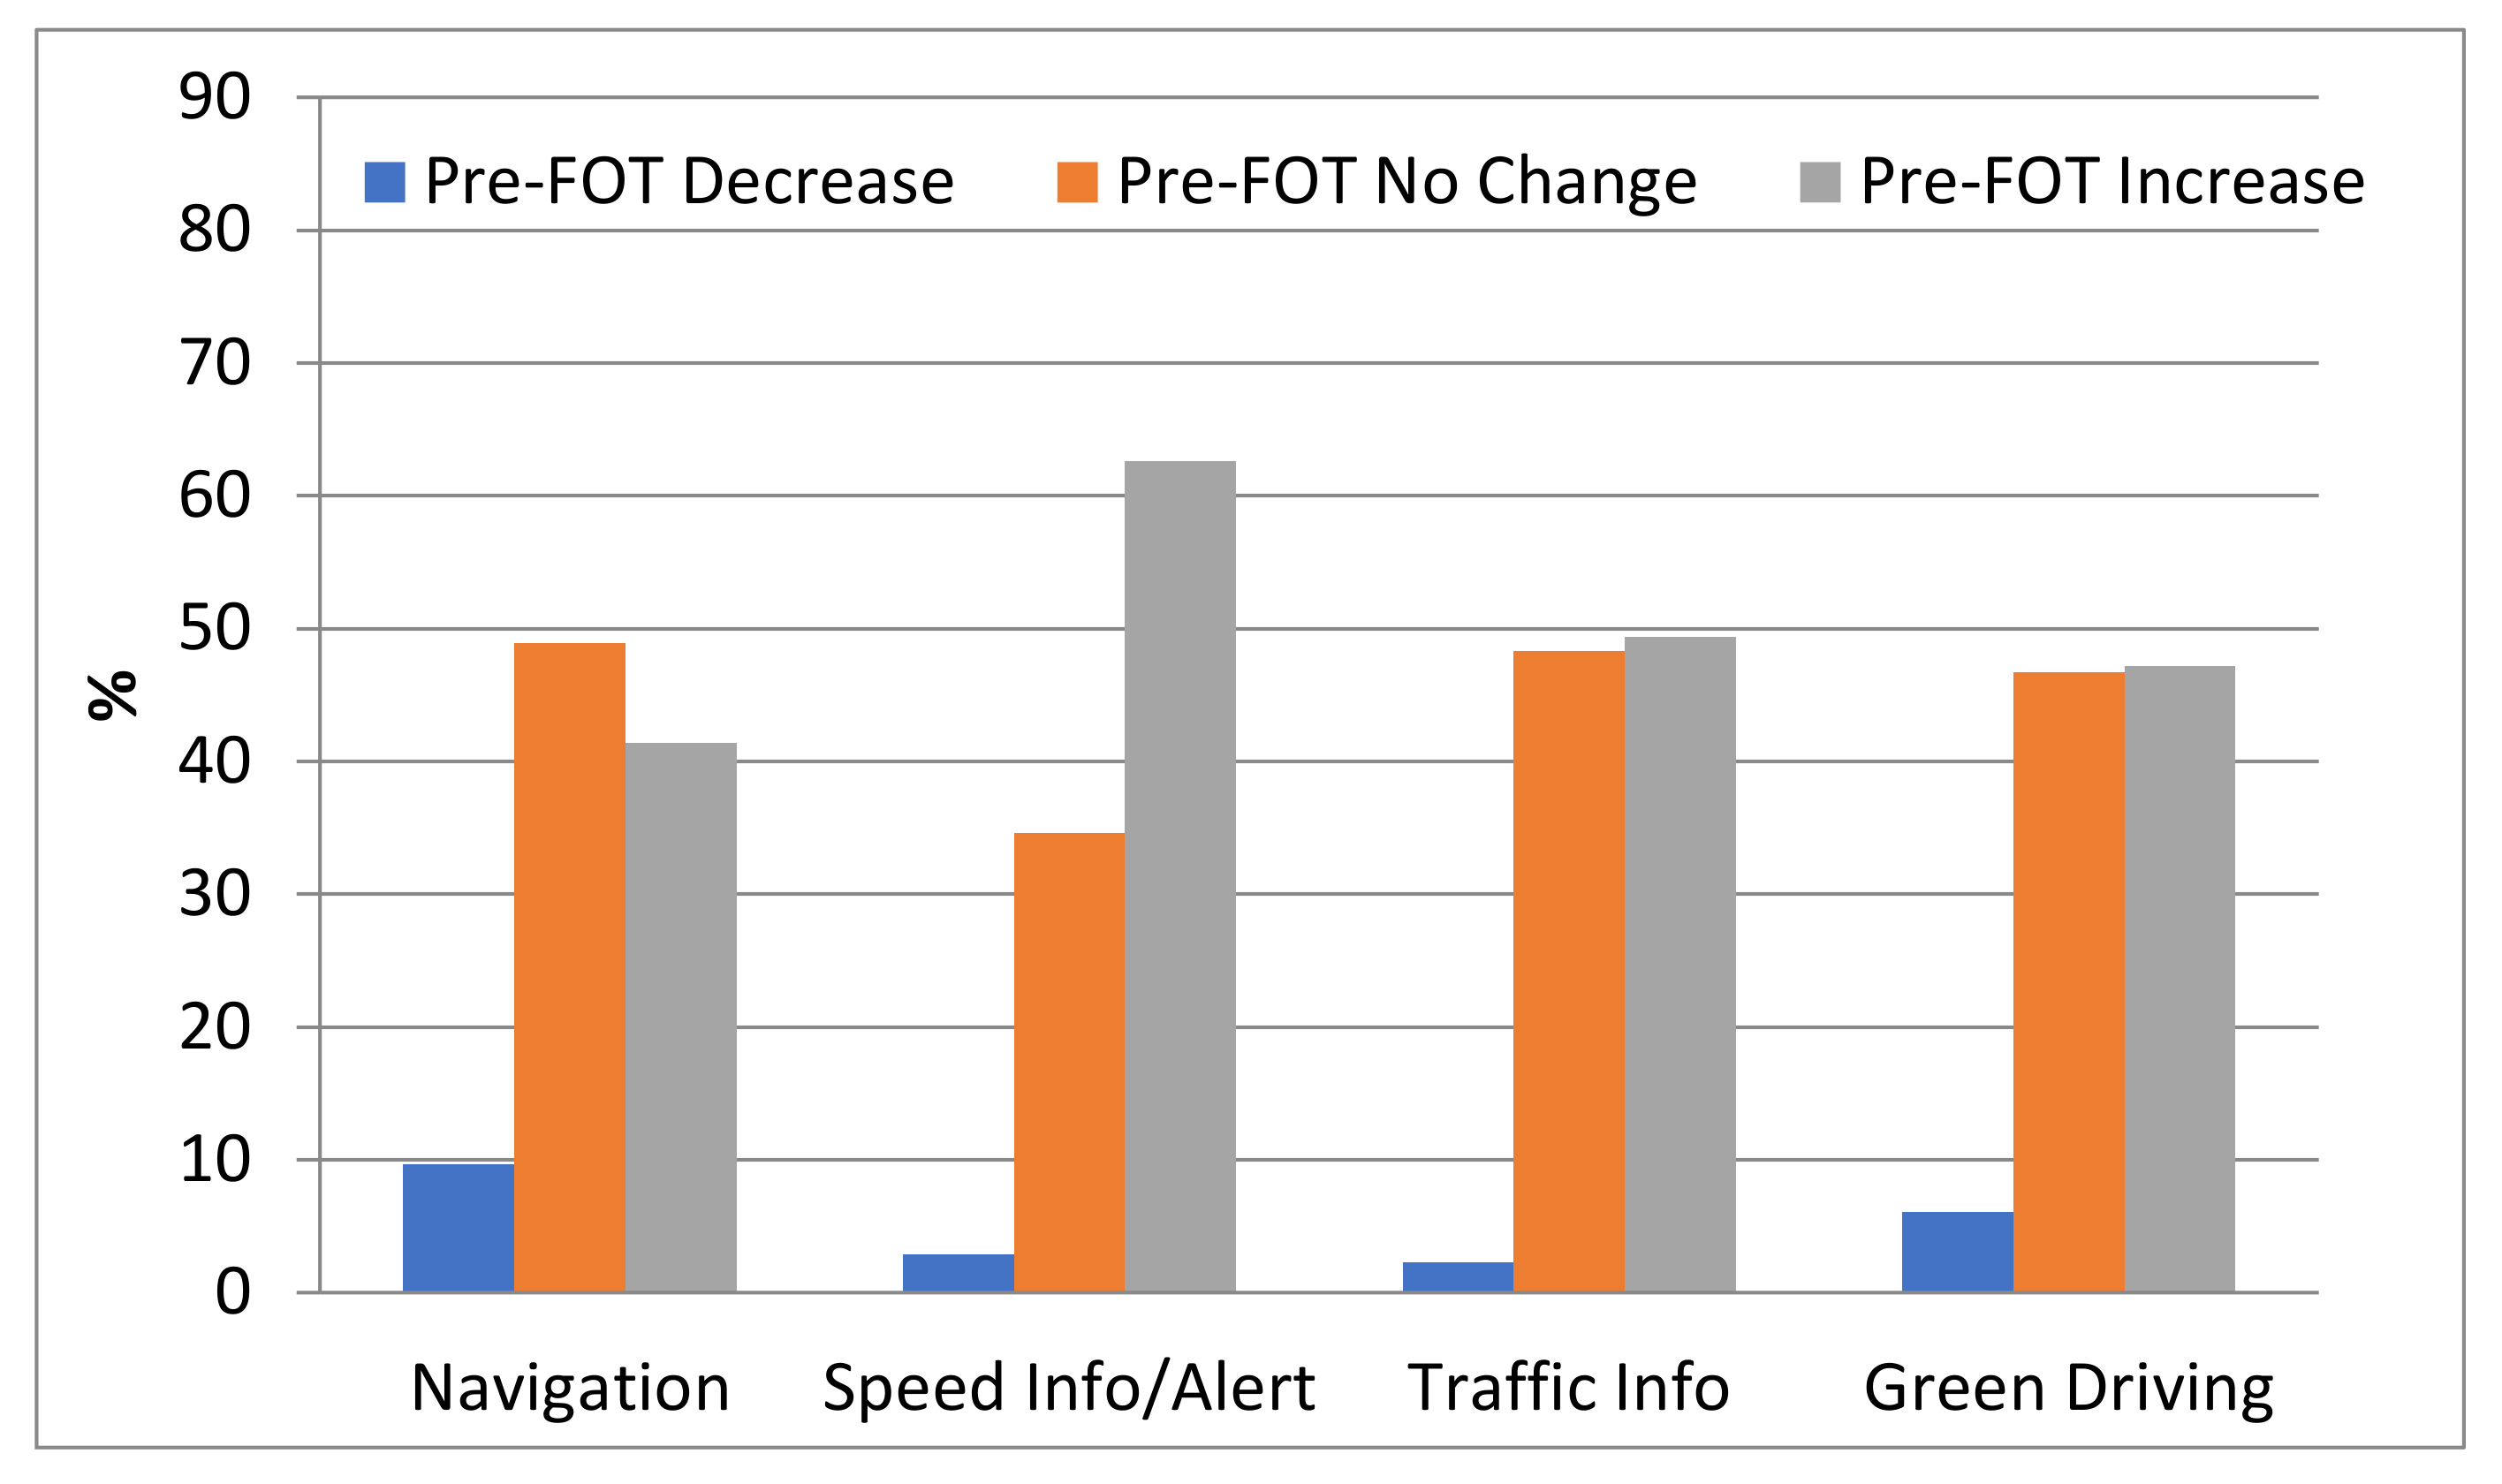
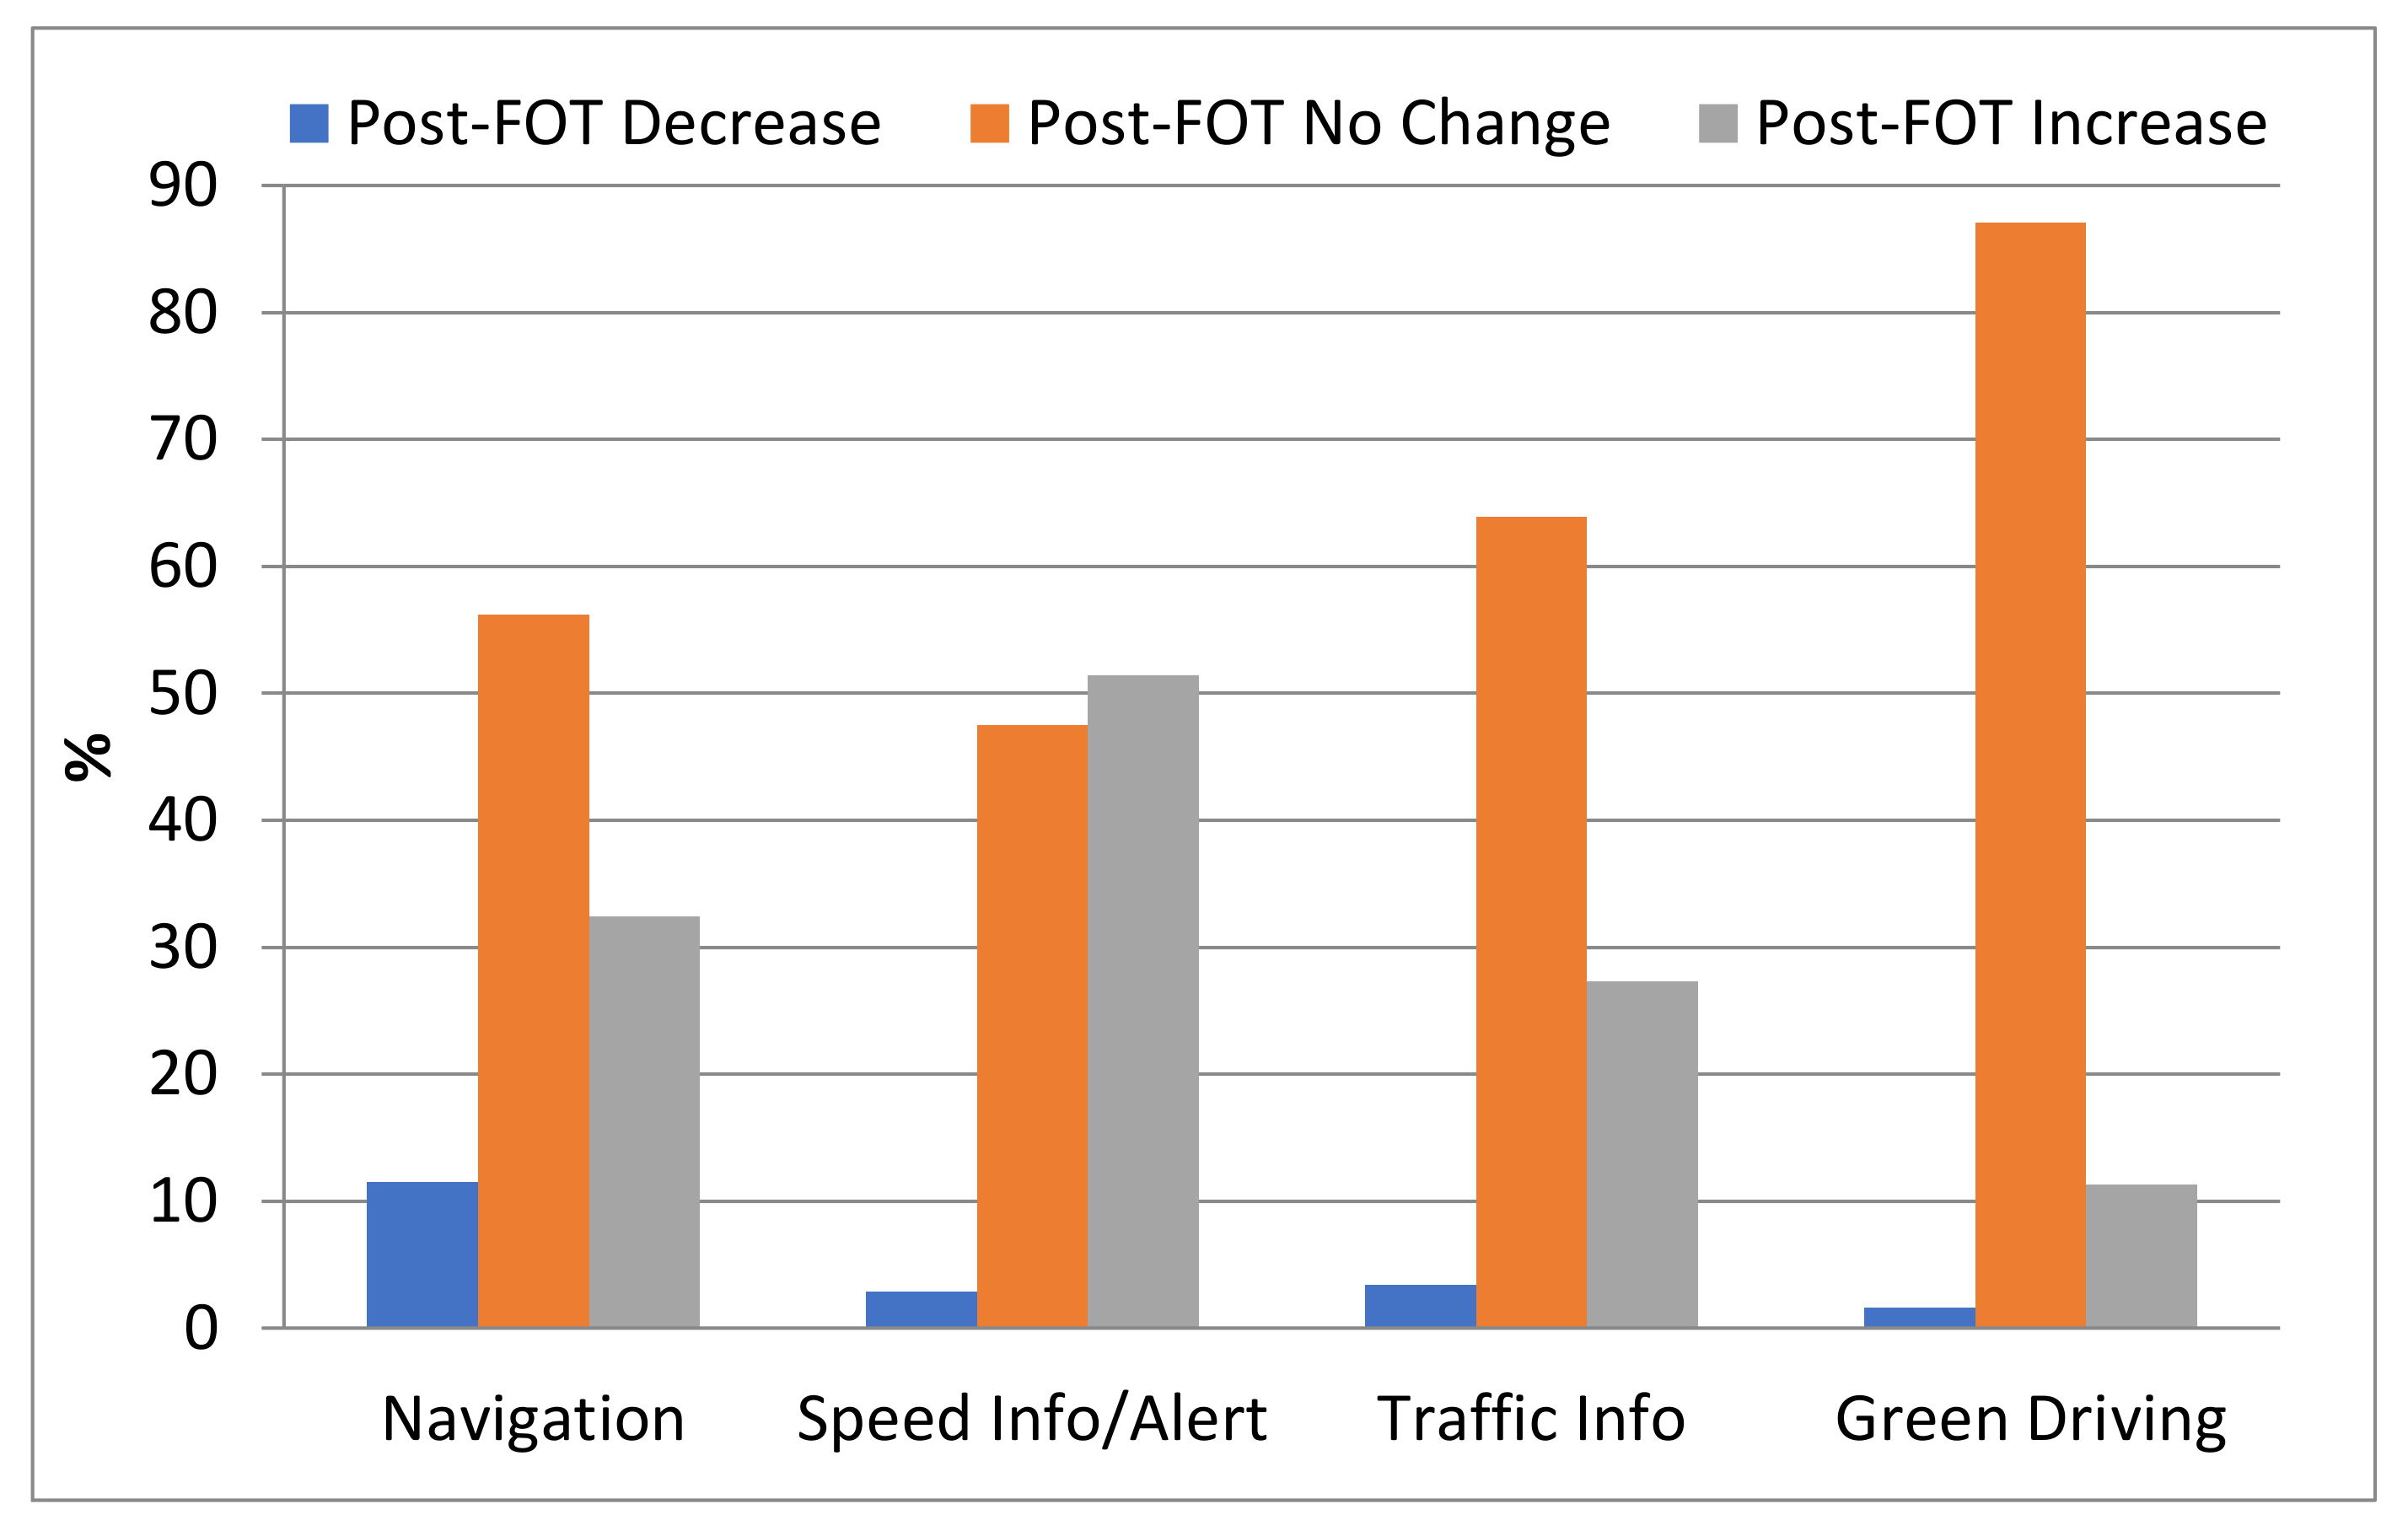
Figure 5 and
Figure 6 show the percentage of ratings according to ‘Decrease’, ‘No Change’, and ‘Increase’ according to function for the pre-FOT and post-FOT evaluation, respectively.
Pre-FOT, Speed Information/Alert had the highest proportion of participants anticipating a benefit upon safety whilst Navigation had the lowest proportion. At the end of the FOTs, a higher proportion of participants still perceived Speed Information/Alert functions to have a greater safety benefit than the other functions; however, the proportion had fallen by 10% from the pre-FOT evaluation. The greatest fall in rating was for Green Driving, where participants rated the perceived post-FOT benefit the lowest, with a 35% fall in the proportion feeling they drove safer whilst using the function.
4. Discussion
Overall, driving can be considered as one example of human–machine interaction (HMI) in which the human (in this case, the driver) interacts with a machine (in this case, the vehicle; Harvey et al.) [
15]. As well as interacting with the vehicle control functions, such as steering, accelerating, braking, and gears, the driver also performs secondary tasks within the vehicle, and more and more frequently this will involve interacting with an in-vehicle information system (IVIS). These functions are generally aimed at enhancing the driving experience. To successfully design and evaluate the performance of these systems, a thorough understanding of user acceptance and user experience is required.
Such feedback allows for the design of interfaces that are acceptable to the driver and positively enhance the overall experience (Hassenzahl and Tractinsky) [
16].
In this study, user experience was specifically defined in terms of ‘perceptions of safety’ and the FOT methodology was used to evaluate whether such perceptions changed as a result of increasing exposure through user experience in comparison to pre-conceived ideas about the IVISs, which may have been formulated without any prior user-experience.
Some interesting findings are evident. The perceptions of safety relating to Navigation were evaluated in Greece, Italy, Spain, Sweden, and the UK. Overall, 41% expected that the Navigation function would be of benefit in terms of safety prior to the commencement of the study. However, exposure to the Navigation function did nothing to improve the perception of safety in any of the participating countries, with the exception of Spain, where a marginal increase in perceived safety benefit was found. In the other participating countries, the participants most commonly reported that navigation would not alter their general perception of safety both before and after the FOT. In some cases, the perception of safety shifted towards being negative, although the reasons for this are unclear.
The perception of safety of the Speed Information/Alert feature was tested in the UK, Italy, and Spain. Across these three test sites, 62% anticipated an improvement in safety. However, in both Italy and the UK, the perceptions shifted towards a more neutral (no change) viewpoint, although in Spain, perceptions of safety increased slightly post-test. Again, the explanation is not immediately obvious but may indicate that pre-conceived ideas relating to this function could have been misplaced and that it failed to live up to expectations.
The Traffic Information system was only evaluated in Sweden and Greece and prior to commencement of the FOT most respondents showed a neutral or positive perception of safety. However, experience with this function showed that perceptions of safety did not improve in both countries and became more neutral. Some participants reported that this function led to a slightly negative perception of safety after exposure to the function, but this was not statistically significant. The Green Driving Support function was only assessed in Sweden. Just over 20% of the drivers anticipated an increase in safety prior to the FOT, with the majority anticipating no change. After experience with the function, more respondents reported that it would not change their perception of safety. However, the results for this function are also not statistically significant.
Overall, the results suggest that the perceptions of safety for the tested functions did not increase with exposure to them. Again, this may reflect ambiguous or unrealistic expectations of what such functions can deliver in terms of safety. On the other hand, participants may feel that the functions do not offer safety benefits because they are forced to look at them in order to gain necessary information, which in turn causes them to divert their visual attention from the road, thereby increasing crash risk. Objective analyses of data relating to distraction through Navigation use as part of the same study (Morris et al.) [
17] suggest that whilst participants do indeed change their visual behavior in response to the introduction of the function (so that they spend relatively more time looking at the function), individual glances are not detrimental to safety, since they are overwhelmingly short (mostly <1 s at a time.) Therefore, whilst participants may anticipate that an IVIS causes distraction, this is not widely supported in the literature.
Alternatively, the functions tested in the study may simply have not met with expectations and preconceived notions as to what they can deliver. For example, Smith [
18] identified different groups in terms of technology usage and the groups differed in terms of their expectations. Although the study was designed to ensure recruitment of a random sample of participants at each test site, the sampling did not discriminate in terms of views and experiences regarding technologies.
The study also represents a reasonably robust and positive experience with the FOT methodology. Overall, the methodology works well and gives convincing results given the longitudinal nature of the tests and the amount of detail that is collected during each test (both subjective and objective.) With that said, some issues are immediately obvious (e.g., participant drop-outs, reliability of data-logging, participant vigilance in completing questionnaires), but these issues did not present a special barrier to the results and we are confident that the study is reasonably repeatable and representative. It may, however, be the case that participants had more prior experience with the functions, particularly Navigation, than they were prepared to state upon recruitment, and this may have had an effect on the results for Navigation. As the vehicle industry progresses towards automation, it is likely that IVISs will become more and more prominent as the driver’s role switches from (essentially) ‘controller’ to ‘monitor’. The user experiences with such systems have to be fully evaluated before there can be general public confidence in, and acceptance of, the safety of autonomous vehicles. Studies such as this are relevant as they provide the evidence-base in this regard.
5. Conclusions
Driver information systems are becoming more prevalent in vehicles, although their full effect on driver performance and safety is still unclear.
The study described used FOT methodology to evaluate drivers’ perceptions of safety when using driver information systems (Navigation, Speed Information/Alert, Traffic Information, and Green Driving Support) and participants were tested over a period ranging from 8 to 16 months in five European countries.
When looking at results, 41% of participants expected the safety of their driving to improve when they used a Navigation system (Greece, Italy, Spain, Sweden, and the UK); 62% anticipated an improvement in safety with the use of a Speed Information/Alert system (UK, Italy, and Spain); 50% anticipated an improvement in safety with the use of Traffic Information (Sweden and Greece); and 20% of the drivers anticipated an improvement in safety whilst driving with Green Driving Support (Greece only).
For Navigation, upon comparing pre-test with post-test responses, no changes in responses were observed for Sweden, Italy, or Spain. However, in the UK and in Greece there was a shift towards perceived negative effects upon safety compared to original expectations.
For Speed Information/Alert, at the end of testing, there were significant differences in the perceived safety in the UK and Italy, with a move towards ‘No Change’—but there was no significant difference in the pre- and post-FOT responses in Spain.
For Traffic Information, there was a significant difference in the post-FOT response for Sweden, with a distinct move towards perceiving no change in safety. There was a similar pattern in the data from Greece; however, this was not a statistically significant change.
For Green Driving Support in Greece, the numbers of drivers reporting ‘No Change’ in perception of safety increased post-FOT to 88%, although this was not statistically significant.
The results suggest that perceptions of safety for the tested functions do not necessarily increase with exposure to them, as might be expected.


