Abstract
It has recently been demonstrated that 50 mm thick industrial grade thermal insulation may serve as passive fire protection of jet fire exposed thick walled steel distillation columns. The present study investigates the performance of thermal insulation in conjunction to 3 mm, 6 mm, 12 mm and 16 mm steel walls, i.e., where the wall represents less heat sink, when exposed to 350 kW/m2 heat load. Regardless of the tested steel plate thicknesses, about 10 min passed before a nearly linear steel temperature increase versus time was observed. Thereafter, the thinnest plates systematically showed a faster temperature increase than the thickest plates confirming the wall heat sink effect. To study thermal insulation sintering, 50 mm thermal insulation cubes were heat treated (30 min holding time) at temperatures up to 1100 °C. No clear sign of melting was observed, but sintering resulted in 25% shrinkage at 1100 °C. Thermogravimetric analysis to 1300 °C revealed mass loss peaks due to anti-dusting material at 250 °C and Bakelite binder at 460 °C. No significant mass change occurred above 1000 °C. Differential scanning calorimetry to 1300 °C revealed endothermic processes related to the anti-dusting material and Bakelite mass losses, as well as a conspicuous endothermic peak at 1220 °C. This peak is most likely due to melting. The endothermic processes involved when heating the thermal insulation may to a large part explain the 10 min delay in steel plate temperature increase during fire testing. Overall, the tested thermal insulation performed surprisingly well also for protecting the thin steel plates.
1. Introduction
Petroleum products are an essential source of energy and thereby an important part of the modern world. The hydrocarbon process industry involves complex mechanical interventions with extraction of oil and gas from wells as well as processing to produce the products called for in the market. For many decades, this industry has been, and still is, an essential part of the world economy. In several locations, the oil and gas industry is a mature industry. The lifetime of equipment and process plants must therefore steadily be extended by maintenance, upgrades and modifications. Processes at elevated pressure, combined with highly flammable materials make this an industry with high accident potential. A release of the pressurized and highly flammable material could be disastrous, as evidenced by many major accidents during the last decades [1,2,3]. Prevention and mitigation of fires and explosions are therefore very important.
If a hydrocarbon leak is ignited, the heat loads to exposed objects may be quite severe, i.e., flame temperatures in the range 1100 °C to 1200 °C and heat loads in the range 250 kW/m2 to 350 kW/m2 [4]. Heat exposed steel objects lose strength with temperature. Especially at temperatures above 500 °C, the loss of tensile strength is significant [5]. Fire exposed pipes and vessels containing pressurized hydrocarbons may, if weakened by overheating, rupture violently and release the combustible contents giving rise to major escalation of the fire scenario. This may result in a domino effect leading to loss of major parts of offshore platforms and land based production plants. Much effort is therefore put into designing and maintaining protective escalation barriers, e.g., passive fire protection [1,6].
In several hydrocarbon processes, thermal insulation is required to maintain the proper production temperatures. Distillation columns may serve as an example of process equipment where the temperature profiles are carefully designed to obtain good production efficiency and the right quality for the distilled products. Such process units, which may release huge quantities of flammable materials if rupturing in a fire, are normally also protected by mineral based passive fire protection. Previously, the thermal insulation was placed in direct contact with the process equipment metal corrosion protective paint. Externally, the thermal insulation was protected from the natural elements by a 0.7 mm layer of stainless steel cladding. Due to temperature differences in e.g., a distillation column, humid air may be entrained at lower levels. When heated, this humid air travels upwards and is pushed further upwards by new air entrained at lower levels, to locations where the column wall is below its dew point temperature. This results in liquid water draining down through the insulation. Soaked thermal insulation may finally destroy the corrosion protective paint exposing the column steel to liquid water. Severe corrosion may be the consequence of this process and may result in large maintenance costs or, in the worst case, severe hydrocarbons leaks.
To prevent soaked insulation in contact with the column walls, an improved insulation technique introduces a 25 mm air gap between the column walls and the thermal insulation. This has in some cases resulted in too limited available space for adding both 50 mm thick thermal insulation and 50 mm thick passive fire protection as well as the 0.7 mm surface cladding. In a previous study, using small scale testing [7] rather than full scale testing [8], it was demonstrated that 50 mm thermal insulation (ProRox PSM 971, 50 mm, Rockwool), without any passive fire protection (PFP), was sufficient to withstand 30 min jet fire exposure for 16 mm thick steel walls. It was revealed that during the most severe testing, the thermal insulation partly melted. Small scale testing was also performed by Landucci, et al. [9] when investigating composite materials based on basalt fibers as components of the PFP systems.
The present study aims at investigating the passive fire protection performance of the industrial thermal insulation protecting steel walls of 3 mm, 6 mm, 12 mm and 16 mm thickness during 350 kW/m2 jet fire exposure. Steel wall temperature versus time was recorded, and it was assumed that the thinner steel walls would obtain higher temperatures early, which could severely influence the thermal insulation degradation processes. In order to study the breakdown of the thermal insulation with temperature, 50 mm cubes of the thermal insulation were heat treated, i.e., 30 min holding time, at varying temperatures up to 1100 °C in a muffle furnace. To further shed light on the thermal insulation behavior at elevated temperatures, thermogravimetric analysis was performed at temperatures up to 1300 °C to reveal mass loss at elevated temperatures. Differential scanning calorimetry to 1300 °C was performed to investigate the high temperature performance of the thermal insulation with respect to identify any potential melting below 1300 °C.
The materials and methods used are explained in Section 2, including some comments on the fire testing criteria. Section 3 presents the results for jet fire testing at 350 kW/m2 heat load including the total heal flux to the plates. Shrinking tests at different holding temperatures, and the findings from the thermal gravimetric and differential scanning calorimetric analyses, are also presented in this section. Section 4 presents the discussions and conclusions.
2. Materials and Methods
2.1. The Thermal Insulation Studied
The thermal insulation studied was the industrial grade Pipe section mat (PSM) (ProRox PSM 971, thickness 50 mm) delivered by Rockwool Inc. (Copenhagen, Denmark). The technical data for this thermal insulation may be found in Appendix A, Table A1. According to the manufacturer data, the maximum service temperature for this thermal insulation is 700 °C. The thermal conductivity at elevated temperatures is presented in Appendix A, Table A2.
Chemically, the bulk phase of the thermal insulation consists of inorganic oxides. The major components are silica, alumina, magnesia, calcium oxide and iron(III) oxide. Additionally, it also contains minor amounts of sodium oxide, potassium oxide, titanium oxide and phosphorous pentoxide. The detailed chemical composition is given in Appendix A, Table A3.
The thermal insulation is produced by spinning the molten metal oxides at 1500 °C in thin threads, which are subsequently cooled and spun to insulation mats. A Bakelite binder is used to hold the loose spun threads in place during the 10+ year thermal insulation field operation. A mineral based oil is also added in order to act as a dust binder when handling the thermal insulation, e.g., when cutting and fitting the insulation mats for the field application.
During heating, the mineral oil will gradually evaporate/pyrolyze. Bakelite, i.e., polyoxybenzylmethylenglycolanhydride, {C6H6O · CH2O}x, may exhibit complicated degradation processes, which are known to be dependent upon chemicals mixed into the Bakelite [10]. The degradation processes are also dependent on the number of molecular cross links and may be expected to react along several reaction paths. A non-balanced degradation reaction may be represented by:
{C6H6O · CH2O}x → CO2 + CO + H2O + Csoot + other products
The degradation temperatures are highly influenced by the number of cross links as well as the other chemicals mixed into the Bakelite [10].
For materials where the thermal conductivity is limited by the pores, it may be shown theoretically [11] that the thermal conductivity will be proportional to the absolute temperature to the third power. The thermal conductivity of the thermal insulation as a function of the absolute temperature to the third power is presented in Figure 1. The linear trend indicates that the thermal conductivity of the thermal insulation is limited by pore radiation, at least until there is a significant thermal degradation of the insulation.
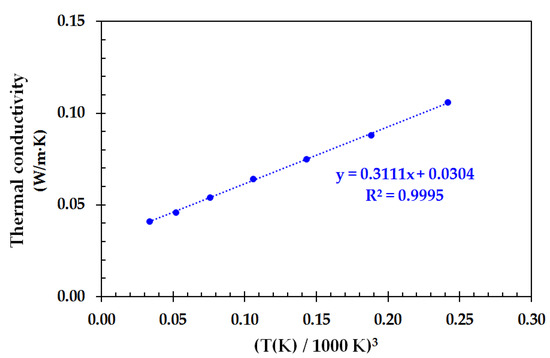
Figure 1.
Thermal conductivity of the thermal insulation (ProRox PSM 971, 50 mm) as a function of the absolute temperature to the third power. Data from Appendix A, Table A2.
Sintering is a physical process that may take place in inorganic (ceramic) materials at elevated temperatures. The sintering process is entropy driven [12] and leads to a lower free energy, . The atoms in the different materials diffuse across the grain boundaries, in this case across the thread boundaries, to form a better mixed material with fewer sharp edges. The atoms diffuse across the boundaries, fusing the threads together such that the materials, at least theoretically, approaches one solid piece.
This atomic diffusion will drive thread surface elimination in different stages, starting from the formation of necks between threads to potential final elimination of the small pores at the end of the sintering process. The linear trend in Figure 1 is a clear indication of the thermal conductivity of the thermal insulation being limited by the pore radiation. Closing the pores by sintering will therefore increase the thermal conductivity of the thermal insulation. This process is indeed applied to create ceramic materials of very high thermal conductivity [13].
For ceramic materials, the sintering process typically starts at a temperature of about 2/3 of the absolute melting temperature [14]. It may therefore be expected that a thermal insulation consisting of porous ceramic materials, such as the thermal insulation studied in the present work, may start to sinter at temperatures several hundred degrees below an associated melting point. Sintering is, however, generally a slow process, which may therefore not make too much problems during a limited time of fire exposure unless the sintering is very fast at the highest temperatures involved in the present testing, i.e., at 1200 °C.
2.2. Fire Test Criterion
An object engulfed in flames receives heat by both convection and radiation. The net heat flux received is given by:
where (W/m K) is the heat convection coefficient, (K) is the temperature of the flame, (K) is the temperature of the exposed surface, is the flame emissivity, is the emissivity of the solid and (5.67 × 10⁻⁸ W/m2 K4) is the Stefan-Boltzmann constant. The emissivity of the flame is given by:
where (m) is the optical flame thickness and (1/m) is the extinction coefficient. Fires in the oil and gas industry may become quite large. Conservatively, it is therefore common to assume that the flames in industrial fires are sufficiently large to be considered optically thick, i.e., .
Regarding hydrocarbon fires, it is common to principally distinguish the fire to either pool fires caused by liquid spills retained on a surface or jet fires caused by release of ignited pressurized gas. Both these fires are recognized as fuel-controlled fires [4].
For rupture calculations, the actual fire scenarios and heat flux level must be defined. Relevant descriptions for a fire scenario typically include the type of fire, fire duration and size and heat flux levels (both global and peak loads). In heat exposure calculations, the NORSOK S-001 and the Scandpower guidelines [4,15] state that the total heat flux for pool fires and jet fires should be set to 250 kW/m2 and 350 kW/m2, respectively. This is also in accordance with observed heat flux levels obtained from numerous experiments as well as CFD modeling. The oil and gas processing and transport companies have therefore recently specified similar fires loads, e.g., the Equinor requirements for new installations, TR2237 [16]. Given the expected emissivity of a fire exposed object to be about 0.85, flame temperatures of 1050 °C and 1200 °C, respectively corresponds to 250 kW/m2 and 350 kW/m2 to an object at 20 °C [7].
The ISO 22899 Jet Fire Test [17] is generally used for standardized jet fire testing. This full scale test utilizes a horizontally aligned 0.3 kg/s propane jet, i.e., corresponding to about 14 MW heat release rate, aimed at the object to be tested. In the present small scale test, achieving a fire intensity that brings the 0.7 mm thick cladding, protecting the thermal insulation, up to 1200 °C, was considered sufficient to claim a 350 kW/m2 heat load. Plate thermometers were introduced to verify that this was achieved. The fire load criterion for the testing in the present work was therefore defined as a plate thermometer temperature of 1200 °C [7].
2.3. The Fire Exposure Test Procedure
The 0.7 mm thick cladding, the 50 mm thick thermal insulation, the required 25 mm air gap and the respective steel plates were aligned horizontally with an axisymmetric vertical propane flame as the fire source. An illustration is given in Figure 2 and the details of the experimental mockup used are presented in [7]. Ten thermocouples (Type K, 1.6 mm diameter, stainless steel mantle, Pentronic AB) were used for temperature recordings during the experiment. These thermocouples are illustrated by the blue lines in Figure 2. Additionally, two 100 mm by 100 mm by 20 mm thick type K plate thermometers (100 mm PT (Plate Thermometer), article number 5928050-001, Pentronic AB, Västervik, Sweden), were used to record an equivalent cladding temperature [7], verifying the test criteria described in Section 2.2. These are illustrated by blue boxes and marked PT in Figure 2. The function of such plate thermometers is explained in depth in [18,19,20,21].
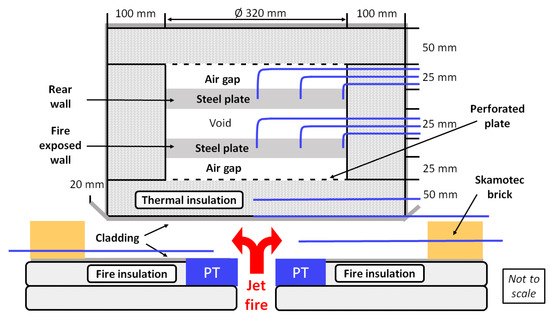
Figure 2.
Sketch of mockup including flame zone, type K mantle thermocouples (blue lines), flush mounted plate thermometers (marked PT) and Skamotec bricks.
Aligning the PTs horizontally, facing upwards and flush with the fire insulation representing the lower part of the combustion chamber, they directly viewed the exposed cladding. This orientation gives robust information about the system’s heat flux levels. And, aligned flush, the plate thermometers had minimal influence on the flame zone heat transfer. The temperatures of the thermocouples and the plate thermometers were recorded by a data logger (type 34970A Data Acquisition/Data Logger Switch Unit, Keysight, CA, USA).
A 60 mm titan burner (Sievert 346051, Titan, 60 mm diameter) was used as the fire source. The burner was set to burn at full air access, arranged vertically and aligned axisymmetric in the center of the experimental setup. By trial and error, it was found that a 0.6 g/s rate of propane gas was sufficient to reach the required heat load levels. A gas flow control unit (C3H8 225 L/min, build 2612, Brooks Instr. Inc., Hatfield, PA, USA) was used to keep the propane supply constant throughout the test period. The fire tests were generally terminated after 40 min, or earlier if the temperature of the exposed steel plate reached about 600 °C.
Light weight high temperature concrete bricks (Skamotec 225, Skamol A/S, 100 mm × 100 mm × 50 mm), were placed around the mockup, 1 cm from the exposed cladding edge, to limit air access and prevent heat radiation losses from the flame zone, as indicated in Figure 2. The test mockup during fire exposure is shown in Figure 3.
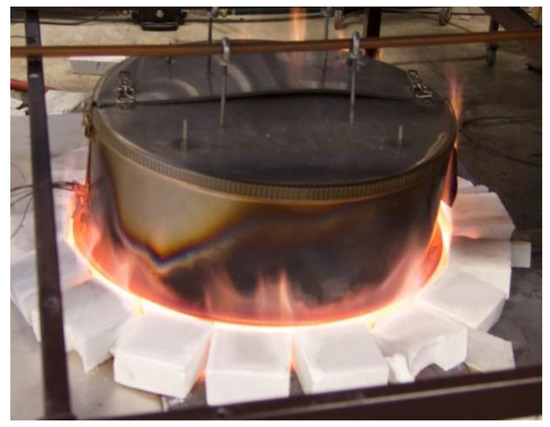
Figure 3.
Fire testing with a propane mass flow rate of 0.6 g/s.
It should be noted that the air access to the flame zone had to be optimized by trial and error. Too restricted air flow along the burner resulted in lower temperatures. This was also the case for excess air entrainment. When finding the optimum, it was quite easy to reproduce fire testing giving 1200 °C plate thermometer temperatures. Fire tests were undertaken for 3 mm, 6 mm, 12 mm and 16 mm steel plate thickness. At least 3 tests were completed for each of the selected steel plate thicknesses.
2.4. Thermal Insulation Heat Treatment Testing
2.4.1. Thermal Insulation Heat Treatment in a Muffle Furnace to 1100 °C
To investigate how the thermal insulation behaved when exposed to elevated temperatures, it was decided to do heat treatment in a muffle furnace. Thermal insulation test specimens (5 cm cubes) where pre-cut 2 days prior to the heat treatment to eliminate any elasticity issues. The heat treatment was done in a muffle furnace (Nabertherm L5/11, Program Controller S17). The furnace had a maximum temperature of 1100 °C, which therefore became the maximum temperature for this heat exposure testing.
One type K thermocouple (1.5 mm diameter) was placed in the center of the test specimen to record the internal test specimen temperature. One similar thermocouple was placed in the upper part of the furnace to record the furnace temperature. The temperature at the furnace display was also recorded.
The heat treatment was done for temperatures in the range 700 °C to 1100 °C, as shown in Table 1. The heating rate was 15 K/min and the holding time at the respective temperatures was 30 min.

Table 1.
Holding temperature and number of exposure tests.
After heat treatment, and cooling to below 300 °C, the height of the tested thermal insulation cubes was recorded at the center of the four vertical sides. The average height was reported for each test specimen.
2.4.2. Thermogravimetric Analysis (TGA) and Differential Scanning Calorimetry (DSC)
Due to the 1100 °C limitation of the available muffle furnace, it was decided to investigate the thermal insulation in more detail and to a temperature of at least 1200 °C. Samples of the thermal insulation were therefore tested in a simultaneous thermogravimetric analysis—differential scanning calorimetry apparatus (NETZSCH STA 449 F1). Test samples (6–8 mg) were taken 10 mm, 25 mm and 40 mm from the thermal insulation surface. The tests were run at a heating rate of 5 K/min, 10 K/min and 20 K/min from room temperature and up to 1300 °C. Tests were conducted in air atmosphere as well as in N2-atmosphere (to prevent any air oxidation processes).
3. Results
3.1. Results Obtained by Jet Fire Testing
During jet fire testing, the temperatures were recorded at three locations in the exposed steel plate and at three locations in the steel backing plate, i.e., in the steel plate centers (r = 0 mm), at half the plate radius (r = 80 mm) and close to the full plate radius (r = 160 mm). This was done to verify that the system displayed one-dimensional heat flow. A typical temperature recording of a 6 mm thick plate is shown in Figure 4.
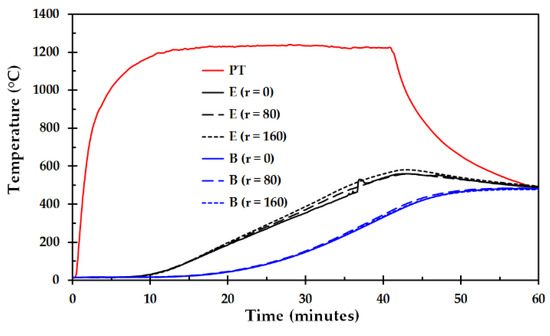
Figure 4.
Temperature as a function of time for a representative test (6 mm thick steel plate thickness). Temperatures of the exposed and backing steel plates are marked E and B, respectively. The numbers indicate the radial thermocouple position (in mm). PT represents the plate thermometer.
In some tests, problems with thermocouple and steel plate mechanical contact appeared, as evidenced in Figure 4 for the thermocouple in the center of the exposed steel plate. This may be due to some tension in the system generated by thermal expansion during the transient heating. In these cases, this temperature recording was not used for further data analysis.
The temperatures versus time recorded for steel plate thickness 3 mm, 6 mm, 12 mm and 16 mm are shown in Figure 5, Figure 6, Figure 7 and Figure 8, respectively. It should be noted that the temperatures recorded in the flame zone were typically 50–100 °C above the temperature recorded by the plate thermocouples.
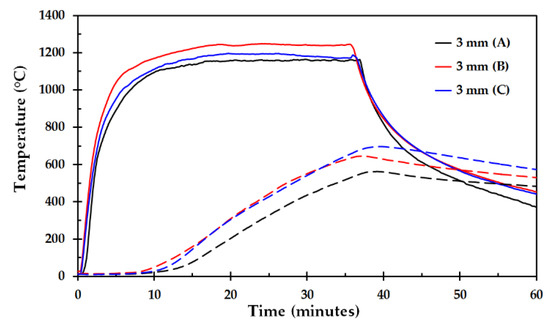
Figure 5.
Temperature as a function of time for 3 mm thick steel plate, test A, B and C. Solid lines represent the plate thermometer temperature while the dashed lines represent the temperature of the exposed steel plates.
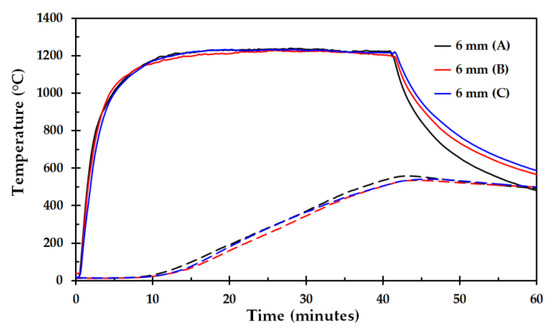
Figure 6.
Temperature as a function of time for 6 mm thick steel plate, test A, B and C. Solid lines represent the plate thermometer temperature while the dashed lines represent the temperature of the exposed steel plates.
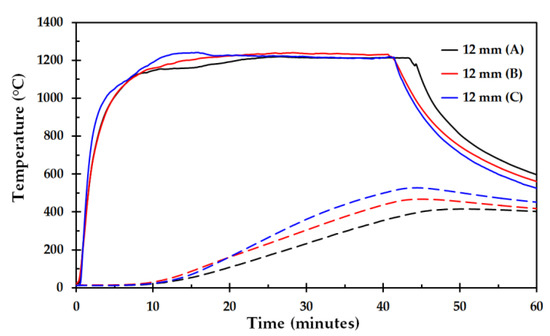
Figure 7.
Temperature as a function of time for 12 mm thick steel plate, test A, B and C. Solid lines represent the plate thermometer temperature while the dashed lines represent the temperature of the exposed steel plates.
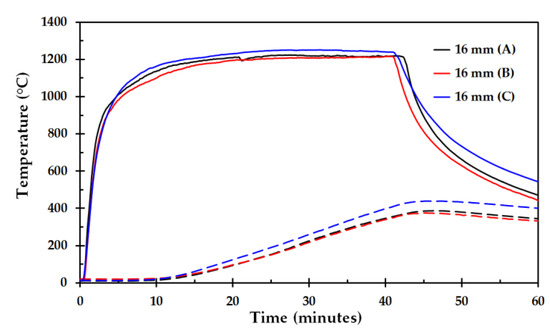
Figure 8.
Temperature as a function of time for 16 mm thick steel plate, test A, B and C. Solid lines represent the plate thermometer temperature while the dashed lines represent the temperature of the exposed steel plates.
The average temperatures as a function of time for the different steel plate thicknesses are presented in Figure 9, where each curve represents an average of three separate fire tests. It is clearly seen that the temperature increase is slower for the thicker steel plates as a result of higher steel plate thermal capacity.
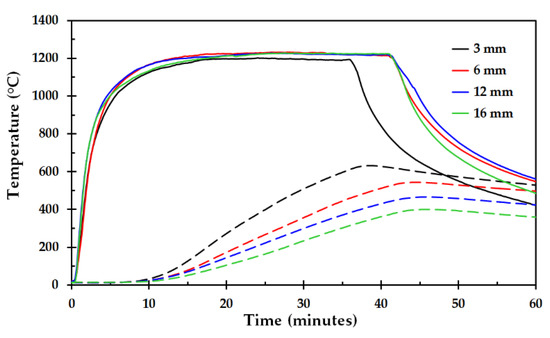
Figure 9.
Comparison of 3, 6, 12 and 16 mm steel plate. Every plate thickness represents an average of 3 fire tests.
It is also evident from the Figure 4 through Figure 8 that during the first 10 min very low temperature increase was recorded for any of the steel plate thicknesses. This may partly be explained by the thermal insulation heat capacity, which is about 7 kJ/m2 K. Especially for the thinner steel plates, e.g., the 3 mm plates with a heat capacity 12 kJ/m2 K, the heat capacity of the thermal insulation plays an important part in limiting the temperature increase. The 10 min delay in steel plate temperature increase may, however, also be due to thermal degradation of the components of the thermal insulation. The dust binder will require heat when decomposing. The same holds for the Bakelite. The thermal insulation was also experienced to partly break down during the fire testing. Sintering was always observed, and in some cases, the thermal insulation had partly melted during the fire tests. It is therefore quite likely that endothermic degradation processes initially give some protection of the exposed steel plates, but may finally result in thermal insulation breakdown.
It should be noted that for all the tests, volatiles released from the thermal insulation during the fire testing exited through connections and small openings in the mockup. In some cases these small jets of volatiles ignited and burned when exposed to the ambient air. The fact that the combustion took place outside the mockup may be taken as a sign of too little oxygen available for combustion within the mockup.
During the fire tests, both the exposed steel plate and the back plate, as presented in Figure 2, may experience a temperature increase during testing. Therefore, the temperatures were recorded for both these steel plates, as shown in Figure 4. Ignoring any heat loss to, or heat gain from, the thermal insulation surrounding the steel plates, the total heat flux to the exposed steel plate may be calculated by:
where (kg) is the steel plate mass, (J/kgK) is the specific heat of the steel plate at temperature, (K), (K/s) is the temperature versus time slope at time (s) and (m2) is the steel plate exposure area. The subscripts and represent the exposed and backing steel plates, respectively. The values for the steel plate heat capacity as a function of temperature were taken from [22].
Based on the temperature recordings of the exposed steel plate as well as the back plate, as seen in the sketch of Figure 2, the heat flux as a function of time was calculated by Equation (4). Calculated total heat flux to the steel plates for representative tests are shown in Figure 10. Despite some noise, it is seen that the heat flux development follows the same pattern, at least up to 25 min. The reason for the thinner steel plate to level off may simply be due to the lower temperature difference for this plate as well as a more significant back plate temperature resulting in increased heat loss to the upper insulation. Nevertheless, it is evident that the heat flux to the steel plates are significantly lower than the heat flux of the system, i.e., which was close to 350 kW/m2. This indicates that the thermal insulation system, though gradually losing its protective capacity, provides a significant heat protection. It is also evident that the heat protection for the 3 mm steel plate, even after 30 min heat exposure, is comparable to the heat protection of the thicker steel plates. This is important knowledge regarding potential use of the industrial thermal insulation as passive fire protection of thin walled pipes, etc.
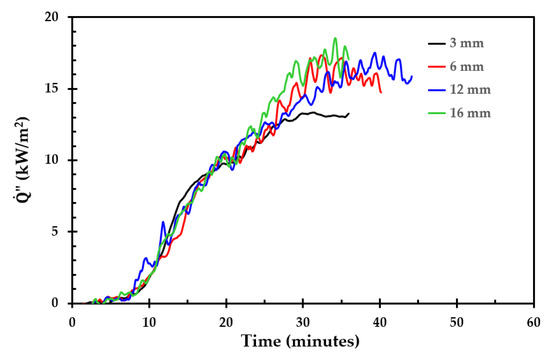
Figure 10.
Total heat flux to the steel plates as a function of time. The steel plate thickness is indicated in the figure label.
3.2. Results Obtained by Thermal Insulation Heat Treatment
Due to the thermal degradation of the thermal insulation observed during fire testing, it was decided to do controlled heat treatment tests. This involved heat treatment to 1100 °C in a Muffle furnace, thermogravimetric analysis and differential scanning calorimetry. The results of this testing are presented in the following sub-sections.
3.2.1. Results Obtained by Muffle Furnace Heat Treatment to 1100 °C
The 50 mm cubic test specimens were arranged horizontally according to the heat protection in fires, i.e., the fibers ran horizontally while in the muffle furnace. Testing was done according to Table 1. The temperature development during heating to 1100 °C, 30 min holding time at this temperature, and the subsiding muffle furnace cooling is shown in Figure 11. Two distinct temperature peaks for the thermocouple located within the thermal insulation are observed. The first peak started at about 250 °C and terminated at about 520 °C. The second peak started at about 860 °C and terminated at about 960 °C. The first exothermic process is likely due to dust binder (heavy oil) and Bakelite combustion since the atmosphere in the furnace was ambient air. Due to the thermal insulation porosity, oxygen was available also in the center of the 50 mm thermal insulation cubes. This temperature peak was observed for all the test specimens heated in the muffle furnace.
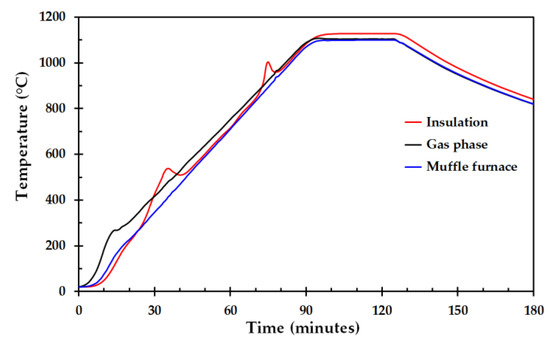
Figure 11.
Temperatures recorded in the center of the 50 mm thermal insulation cubes, the gas phase and values displayed at the Muffle furnace (heating rate 15 K/min and 30 min holding time at 1100 °C).
It may be more challenging to explain the second exothermic reaction. It may be a result of exothermic processes due to oxidation of soot particles from the degradation of the dust binder and/or the Bakelite. Physical (sintering) and/or chemical reactions in the inorganic salts comprising the bulk part of the thermal insulation may also be the source of heat production, e.g., recrystallization, etc. It should be noted that after the heat treatment to 900 °C, 1000 °C and 1100 °C, i.e., at temperatures associated with, or above, the second peak, small soot like particles were observed inside the muffle furnace. Such soot like particles were not observed after the heat treatment to 700 °C, 750 °C or 800 °C. It was, however, outside the scope of the present work to pursue this issue any further.
The height of the originally 50 mm cubic thermal insulation test specimens after 30 min holding time as a function of holding temperature is shown in Figure 12. It appears that there is a change in height between 700 °C and 800 °C, where after there is no major shrinkage until temperatures above 1000 °C. After 30 min at 1100 °C, the shrinkage was still less than 25%. This may indicate that this particular thermal insulation still provides quite significant heat protection up to 1100 °C. Unfortunately, this was the temperature limit of the available muffle furnace, thereby limiting testing at higher temperatures. The two test specimens held 30 min at 1100 °C are shown in Figure 13.
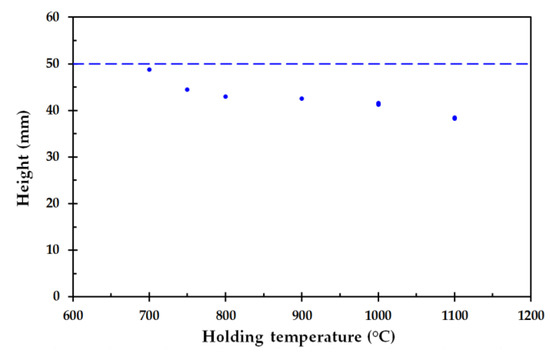
Figure 12.
The height of the 50 mm cubic insulation test specimens after 30 min holding time as a function of the holding temperature. The dashed line represents the 50 mm initial height.
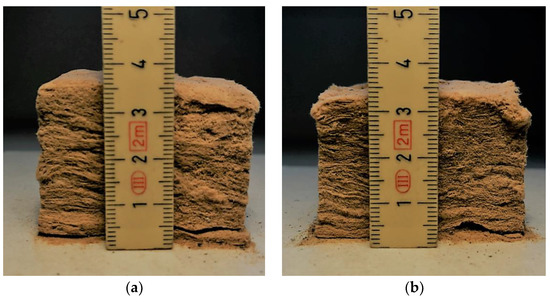
Figure 13.
Test specimens (50 mm cubes) after 30 min heat exposure at 1100 °C for (a) test a and (b) test b.
3.2.2. Results Obtained by Thermogravimetric Analysis (TGA) to 1300 °C
Thermogravimetric analysis (TGA) was performed from ambient temperature up to 1300 °C at 5 K/min, 10 K/min and 20 K/min. The TGA results for a sample taken from the middle section of one of the insulation mats used to cut test specimens for fire testing and muffle furnace testing is shown in Figure 14. The results were quite representative for test specimens cut at 10 mm depth and 40 mm depth. The derivative of these curves, i.e., differential thermogravimetric (DTG) analysis, is shown in Figure 15.
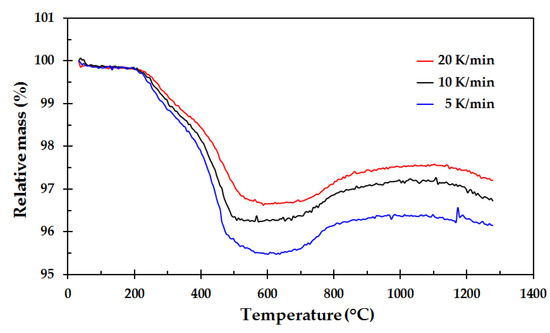
Figure 14.
Thermogravimetric analysis of a test specimen from the center of the thermal insulation.
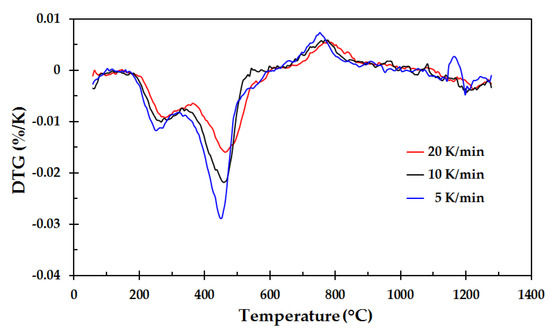
Figure 15.
Differential thermogravimetric (DTG) analysis of the results shown in Figure 14.
As seen in Figure 15, the mass loss starts at about 200 °C, with a local minimum in the temperature range 240 °C to 260 °C. This is most likely due to the dust binder mineral oil decomposition/evaporation. The next minimum, with maximum mass loss rates in the range 450 °C to 480 °C, may be a result of Bakelite decomposition. When mixed with other chemicals, the Bakelite may decompose at different temperatures than pure Bakelite, as experienced by Solyman, et al. [10]. The second minimum is therefore most likely due to decomposition of the Bakelite binder, or parts of the Bakelite binder.
From about 700 °C, there seems to be a mass gain, peaking at about 760 °C to 770 °C. The current study has no explanation of this observation. From about 860 °C, there is only some minor mass loss throughout for the remaining heating to 1300 °C.
For some of the tests, the gas emissions were analyzed by fourier transformed infrared spectroscopy (FTIR). The FTIR recordings revealed traces of H2O, CO2 and CO during the entire heating period, though the concentration of these gas species were most profound at the start of the heating process and at the end of the heating process. The higher production of these species early in the heating process is probably due to dust binder and Bakelite decomposition. The higher concentration at the end of the heating process may indicate some chemical reactions related to the minerals comprising the thermal insulation fibers, including traces of other minerals than presented in Appendix A, Table A3.
3.2.3. Results Obtained by Differential Scanning Calorimetry to 1300 °C
The differential scanning calorimetry from ambient temperature to 1300 °C was performed simultaneously with the TGA measurements, i.e., for the same samples heated at a rate of 5 K/min, 10 K/min and 20 K/min. The results are shown in Figure 16.
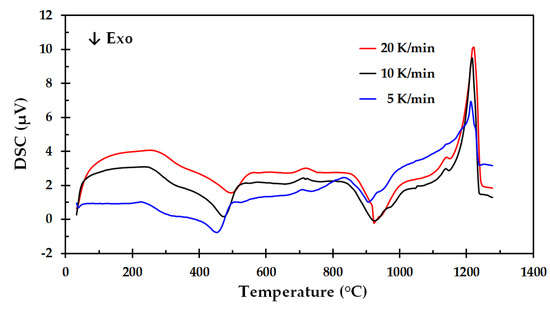
Figure 16.
Differential scanning calorimetry (DSC) analysis of the thermal insulation.
At temperatures around 100 °C, there is virtually no heat production or heat consumption by the test run at 5 K/min. Since these tests were conducted in a normal 21% oxygen atmosphere, the heat required for dust binder oil evaporation/pyrolysis may, however, be partly compensated by heat release during oxidation of the released species. Especially for the lower heating rate, i.e., less production of gaseous products, the leakage of oxygen into the covered crucible may allow for relatively more internal combustion than when the pyrolysis rate is higher. The slightly exothermic peaks at 910 °C to 920 °C confirm the findings from the testing in the muffle furnace, i.e., the second temperature peak identified for the 50 mm cube test specimens.
The small endothermic peak at about 710 °C to 720 °C was found on all the DSC tests. This may be due to e.g., crystallization. The exothermic peak at 910 °C to 920 °C may also be a result of crystallization. Simultaneously degradation of the Bakelite and possible Bakelite residues reacting at higher temperatures make the picture quite complicated. In depth treatment of these issues was, however, outside the scope of the present work.
The most conspicuous peaks obtained by the DSC analysis are the highly endothermic physical or chemical reaction peaking at 1212 °C, 1217 °C and 1222 °C, for heating rate 5 K/min, 10 K/min and 20 K/min, respectively. The DSC measurements were too few to consider establishing kinetic parameters for this degradation reaction.
Inspection of the platinum crucibles after TGA/DSC analysis to 1300 °C revealed that the samples had melted completely during the testing. In a multi component inorganic oxide system, as indicated in Appendix A, Table A3, the melting point will not be a defined temperature. It is more likely that there will be gradual melting above the systems eutectic temperature where the composition follows the liquidus lines of the system. It should also be noted that the fast cooling of the spun threads during production of the thermal insulation very likely have resulted in super cooling that did not follow the systems equilibrium phase diagram. It may therefore be quite difficult to interpret the melting process.
The 10 K difference in peak temperature, when increasing the heating rate from 5 K/min to 20 K/min, does, however, indicate that it may be possible to get some information about the kinetics of the observed melting process. An in-depth study of this phenomenon could reveal important information for future modeling of the thermal insulation passive fire protection performance.
3.3. The Thermal Insulation Performance and Break Down
The reason for the delay in temperature increase also for the thinner steel plates may be explained by the characteristics of the thermal insulation including the dust binder and the Bakelite binder. When the exposed thermal insulation surface is heated to e.g., 1000 °C, the exposed part starts to sinter and shrink. This entropy driven process requires some enthalpy, reducing the heat available for further radiation (and conduction) inwards. The heat flux transferred into the thermal insulation is then partly consumed by increasing the temperature of the colder thermal insulation, i.e., the thermal insulation heat capacity needs to be overcome. When the temperature of the next thermal insulation layer starts to increase, heat is also needed to evaporate/pyrolyze the dust binder oil. When the temperature is even higher, heat is needed to decompose/pyrolyze the Bakelite binder. These processes will limit the heat flow to the unexposed parts of the thermal insulation, which early in this process holds a low temperature and displays a very low thermal conductivity. Therefore, there will only be an insignificant heat flow to the metal plates during the first minutes.
As the exposed part of the thermal insulation during fire testing reaches temperatures close to 1200 °C, the degradation (melting) of the thermal insulation requires much heat. However, during this process, the thermal insulation degrades and there will be less thermal insulation thickness to protect the inner parts of the thermal insulation. As the inner parts of the thermal insulation reach higher temperatures, and have lost its dust binder oil and Bakelite binder, it sinters more rapidly as the temperature increases. From about 10 min, this resulted in a nearly linear increase in heat flux to the steel plates, as seen in Figure 10.
The testing confirms that the thermal insulation has a significant effect as passive fire protection. It does, however, also show that the thermal insulation breaks down during this process and becomes less and less protective with time. This is in clear contrast to fire protecting fibers, which typically display 30% to 50% higher thermal conductivity, but retain their protective performance for extended periods even at temperatures above 1200 °C.
3.4. Suggestions for Future Studies
It would be very beneficial if muffle furnace testing of the thermal insulation could be done at holding temperatures at, or even higher than, 1200 °C. This would cover the range of interest for jet fire testing and could give valuable information about break down temperatures and possible break down mechanisms. With more knowledge it may be possible to adjust the thermal insulation mineral composition to gain even better high temperature heat protection.
Differential scanning calorimetry measurements revealing absolute values, e.g., W/g, would be very beneficial for potential future modeling of the fire protection performance of the thermal insulation. When the other information about an oil and gas process area is known, such as fire detection time delays, blowdown times, etc. one may consider whether the thermal insulation could be sufficient for fire protection of the involved pipes and equipment. This could potentially reduce cost when designing new, or refurbishing older, plants and oil platforms.
The fire testing in the present work was done in a way representative for fire exposure. That was worthwhile for demonstrating the performance of the thermal insulation. For future testing, some sort of guarded hot plate setup [23,24], for heat exposure of the thermal insulation, may be considered. At lower temperatures this was done for developing pipeline thermal insulation by Li, et al. [25], who also investigated their new low temperature thermal insulation properties by DSC. A guarded hot plate approach simulating the fire exposure may allow for more controlled heat exposure and more detailed analysis of the thermal insulation behavior during the heat exposure.
Passive fire protection material mats, i.e., quite similar to the thermal insulation, but made of high temperature resistant materials, generally show some higher thermal conductivity than the thermal insulation. They do, however, not break down at 1200 °C. Placing a rather thin layer of fire insulation mat at the fire exposed side of the thermal insulation may therefore be considered. The thickness of this layer could then be designed such that the temperatures of the thermal insulation for a prolonged period could be kept below 1100 °C, ensuring that the thermal insulation would not sinter too severely or break down/melt as fast as in the present study. The system could then potentially protect the steel for a very long period of fire exposure. It would be very interesting to test this concept in a future study.
4. Discussion and Conclusions
The objective of the present study was to investigate the performance of an industrial thermal insulation as passive fire protection of 3 mm, 6 mm, 12 mm and 16 mm steel walls in the configuration currently used in the oil and gas industry for insulating distillation columns. It was also decided to evaluate the mechanisms for thermal insulation degradation during heat treatment at temperatures relevant for 350 kW/m2 heat exposure, i.e., up to 1200 °C cladding temperatures.
When doing fire testing, several parameters may vary. An extreme fire would lead to early thermal insulation break down [7] while a too modest fire load would not be valid testing according to the 350 kW/m2 test criterion. In the present work, emphasis was put on achieving consistent conditions during fire testing by optimizing the air access into the fire zone versus the propane gas supply. Several tests had to be discarded before this was properly optimized.
Fire testing in the mockup resembling the industrial insulation system and recording the fire exposed wall temperatures showed that the fire protection performance was better for the thicker steel plates. This confirms the importance of the higher thermal capacity of the thicker steel plates. A 10 min delay in temperature increase was, however, revealed for all the plate thicknesses. After this time delay, the temperature increased systematically faster for the thinner plates due to their lower thermal capacity. The heat flux to the plates as a function of time turned out to be almost similar regardless of the steel plate thickness. This result may be interpreted as better passive fire protection of the thinner steel plates than previously anticipated, and represented a positive surprise in the present study.
Testing 5 cm cubic thermal insulation test specimens showed that there was about 25% thickness shrinkage after holding the thermal insulation 30 min at 1100 °C, thereby indicating that the thermal insulation did not melt at this temperature. Thermogravimetric analysis (TGA) and differential thermogravimetric (DTG) analysis showed mass loss consistent with degradation of the dust binder (oil) and Bakelite binder at temperatures below 700 °C, but indicated no mass loss above 1100 °C. Differential scanning calorimetry (DSC) revealed a major endothermic reaction peaking at just above 1200 °C. It was evident that the sample had melted in the platinum crucible after TGA/DSC to 1300 °C. The endothermic peak at about 1200 °C is therefore most likely due to melting of the mineral based thermal insulation.
The industrial grade thermal insulation studied in the present work may pose some variations in e.g., binder material concentration and bulk phase density. During the fire tests, the thermal insulation did, however, show quite consistent performance. This may be due to the size of the steel plates in the fire tests, i.e., 320 mm diameter. The 10 min delay in temperature increase may therefore be taken as a valid result deserving some explanations. During the fire testing, it was observed that pyrolysis products were released through openings in the mockup. In some tests, these small jets of pyrolysis products burned in contact with the ambient air. This was taken as an indication of ventilation controlled combustion, i.e., there was too little air available in the mockup for any major internal combustion.
The heat requirements for pyrolysing the dust binder oil and the Bakelite, as well as the heat requirements for the melting process at 1200 °C, may to a large extent explain the observed delay in heat flux to the steel plates. But when the thermal insulation gradually increased in temperature, and partly melted, the heat flux to the steel plates increased nearly linearly with time. But still, even when used to protect the thinnest steel plates, i.e., 3 mm thickness, it took more than 20 min to reach a plate temperature of 400 °C.
Due to the many metal oxides comprising the bulk phase of the thermal insulation, the eutectic system may be very hard to analyze. Due to some local variations between batches of the thermal insulation, the eutectic temperature and the melting behavior may also vary.
Realizing that the thermal insulation sintering did not reduce the thermal insulation thickness more than 25% after 30 min at 1100 °C, a design including a thin layer of regular mineral based passive fire protection may be worthwhile a study. If such a layer is added at the exposed side of the thermal insulation, it may help keeping the exposed surface of the thermal insulation at temperatures below 1100 °C for a long time period. This would significantly improve the passive fire protection performance of the combined system.
It is also recommended to do more thermal analysis studies of the thermal insulation to further investigate thermal break down processes. DSC testing at heating rates below 5 K/min and above 20 K/min may possibly allow for revealing information about the kinetics involved in the thermal insulation degradation. Wood pyrolysis may be represented by a set of complex thermal decomposition reactions. Several researchers have, however, concluded that the model should be kept simple unless further research makes it possible to justify added complexity [26,27,28]. The same approach may be valid also for future research on the degradation of the thermal insulation studied in the present work.
It is also recommended to study heat transfer through the thermal insulation in a setup where other means of heating than a jet fire is considered for more controlled and consistent testing. Such an approach may make it easier to develop a numerical model for utilizing the thermal insulation as passive fire protection, including the thermal insulation breakdown at elevated temperatures. It may also be safer for the experimenters, and require less rigid test safety precautions, since it would not require a propane jet fire exposure.
Author Contributions
T.L. conceived the project idea. J.S.B. and A.G. mounted the mockup for each small scale jet fire test and performed the experiments. A.G. performed the muffle oven experiments, J.S.B, T.L, M.-M.M. and A.G. analyzed the results. J.S.B, M.-M.M. and T.L. wrote the paper.
Funding
J.S.B. was supported by the Norwegian Research Council, Grant No. 257901, Gassco Inc., Norway, Grant No. PO 4500024195 and Equinor, Norway, Grant No. PO 4590081885.
Acknowledgments
The authors would like to acknowledge technical support from G. Kleppe. The support of Leif Inge Larsen and Ingvald Olai Heskja for supplying test materials and producing the mockup is very much appreciated. Equinor Rotvoll performed the TGA and DSC experiments. The data for the thermal insulation supplied by Søren Nyborg Rasmussen, Rockwool, is also much appreciated.
Conflicts of Interest
T.L. has an advisor position at the funding sponsor Equinor. None of the participants in the study have any connections to specific equipment or materials being mentioned in the paper.
Appendix A
The Technical data for the thermal insulation is given in Table A1. The chemical composition of the thermal insulation is given in Table A3.

Table A1.
Technical data for the Rockwool Pipe section mat thermal insulation.
Table A1.
Technical data for the Rockwool Pipe section mat thermal insulation.
| Name | Description | |
| Material | Stone wool | |
| Operating range | −40 to 700 °C | |
| Name | Performance | Norms |
| Maximum service temperature | 700 °C | EN 14706 |
| Reaction to fire | Euroclass A1 | EN 13501-1 |
| Nominal density | 140 kg/m3 | EN 1602 |
| Water absorption | ≤1 kg/m2 | EN 1609 |
| ≤20 kg/m3 | BP 172 | |
| Water vapor diffusion resistance | Sd > 200 m | EN 12086 |
| Air flow resistivity | >60 kPa·s/m2 | |
| Designation code | MW EN 14303-T4-ST(+)700-WS1-MV2 | EN 14303 |

Table A2.
Thermal conductivity of the thermal insulation studied (Rockwool ProRox PSM 971, 50 mm) [29].
Table A2.
Thermal conductivity of the thermal insulation studied (Rockwool ProRox PSM 971, 50 mm) [29].
| Temperature (°C) | Thermal Conductivity (W/m∙K) |
|---|---|
| 50 | 0.041 |
| 100 | 0.046 |
| 150 | 0.054 |
| 200 | 0.064 |
| 250 | 0.075 |
| 300 | 0.088 |
| 350 | 0.106 |

Table A3.
Data for the thermal insulation studied (Rockwool ProRox PSM 971, 50 mm) [30].
Table A3.
Data for the thermal insulation studied (Rockwool ProRox PSM 971, 50 mm) [30].
| Name | Product | Percentage |
|---|---|---|
| Dust binder 1 | Oil product | <0.5% |
| Binder 1 | (C6H6O·CH2O)N | 2.5% (±0.4%) |
| Bulk oxide | SiO2 | 40.6–44.6% |
| Bulk oxide | Al2O3 | 17.4–20.4% |
| Bulk oxide | MgO + CaO | 23.9–27.9% |
| Bulk oxide | Fe2O3 | 5.5–8.5% |
| Bulk oxide | Na2O + K2O | 1.3–4.3% |
| Bulk oxide | TiO2 | 0.6–2.6% |
| Bulk oxide | P2O5 | Max. 1.2% |
1 The binder calorific value is 27 MJ/kg according to ISO 1716.
References
- Kletz, T. What Went Wrong? Case Histories of Process Plant Disasters and How They Could Have Been Avoided, 5th ed.; Institution of Chemical Engineers: London, UK, 2009; ISBN 13 978-1-85617-531-9. [Google Scholar]
- U.S. Chemical Safety and Hazard Investigation Board. Investigation Report Executive Summary; Drilling Rig Explosion and Fire at the Macondo Well, Report No. 2010-10-I-OS; U.S. Chemical Safety and Hazard Investigation Board: Washington, DC, USA, 2010.
- Murray, J.A.; Sander, L.C.; Wise, S.A.; Reddy, C.M. Gulf of Mexico Research Initiative 2014/2015 Hydrocarbon Intercalibration Experiment: Description and Results for SRM 2779, Gulf of Mexico Crude Oil and Candidate SRM 2777 Weathered Gulf of Mexico Crude Oil; NISTIR 8123; National Institute of Standards and Technology: Gaithersburg, MD, USA, 2016. [CrossRef]
- Scandpower. Guidelines for the Protection of Pressurised Systems Exposed to Fire; Report No. 27.207.291/R1; Version 2; Scandpower: Kjeller, Norway, 2004. [Google Scholar]
- Sintef Byggforsk. Brannbeskyttelse av Stålkonstruksjoner; 520.315; Sintef Byggforsk: Trondheim, Norway, 2004. [Google Scholar]
- Roberts, T.A.; Shirvill, L.C.; Waterton, K.; Buckland, I. Fire resistance of passive fire protection coatings after long term weathering. Process Saf. Environ. Prot. 2010, 88, 1–19. [Google Scholar] [CrossRef]
- Bjørge, J.S.; Metallinou, M.-M.; Kraaijeveld, A.; Log, T. Small Scale Hydrocarbon Fire Test Concept. Technologies 2017, 5, 72. [Google Scholar] [CrossRef]
- Jet Fire Test Working Group. The Jet-Fire Resistance of Passive Fire Protection Materials; HSE Report OTI 95 634; Health & Safety Executive—Offshore Technology Report: Sheffield, UK, 1995; ISBN 0 7176 1166 3.
- Landucci, G.; Rossi, F.; Nicolella, C.; Zanelli, S. Designing and testing of innovative materials for passive fire protection. Fire Saf. J. 2009, 44, 1103–1109. [Google Scholar] [CrossRef]
- Solyman, W.S.E.; Nagiub, H.M.; Alian, N.A.; Nihal, O.; Shaker, N.O.; Kandil, U.F. Synthesis and characterization of phenol/formaldehyde nanocomposites: Studying the effect of incorporating reactive rubber nanoparticles or Cloisite-30B nanoclay on the mechanical properties, morphology and thermal stability. J. Radiat. Res. Appl. Sci. 2017, 10, 72–79. [Google Scholar] [CrossRef]
- Kingery, W.D. Thermal conductivity: XII, Temperature Dependence of Conductivity for Single-Phase Ceramics. J. Am. Ceram. Soc. 1955, 38, 251–255. [Google Scholar] [CrossRef]
- Pozzoli, V.A.; Ruiz, M.S.; Kingston, D.; Razzitte, A.C. Entropy Production during the Process of Sintering. Proc. Mater. Sci. 2015, 8, 1073–1078. [Google Scholar] [CrossRef]
- Log, T.; Jackson, T.B. Simple and Inexpensive Flash Technique for Determining Thermal Diffusivity of Ceramics. J. Am. Ceram. Soc. 1991, 74, 941–944. [Google Scholar] [CrossRef]
- Log, T.; Cutler, R.A.; Jue, J.F.; Virkar, A.V. Polycrystalline t′-ZrO2(Ln2O3) Formed by Displacive Transformations. J. Am. Ceram. Soc. 1993, 28, 4503–4509. [Google Scholar] [CrossRef]
- Norwegian Technology Standards Institution. Norsk Standard, Technical Safety, NORSOK Standard, 4th ed.; Standard No S-001; Norwegian Technology Standards Institution: Lysaker, Norway, 2008; p. 62. [Google Scholar]
- Statoil. Performance Standards for Safety Systems and Barriers—Onshore; TR2237; Statoil: Tysværvåg, Norway, 2015; Volume 3, p. 105. [Google Scholar]
- International Organization for Standardization. Determination of the Resistance to Jet Fires of Passive Fire Protection Materials—Part 1: General Requirements; ISO 22899-1; International Organization for Standardization: Geneva, Switzerland, 2007; 40p. [Google Scholar]
- Wickström, U. The plate thermometer—A simple instrument for reaching harmonized fire resistance tests. Fire Technol. 1994, 30, 195–208. [Google Scholar] [CrossRef]
- Ingason, H.; Wickström, U. Measuring incident radiant heat flux using the plate thermometer. Fire Saf. J. 2007, 42, 161–166. [Google Scholar] [CrossRef]
- Häggkvist, A.; Sjöström, J.; Wickström, U. Using plate thermometer measurements to calculate incident heat radiation. J. Fire Sci. 2013, 31, 166–177. [Google Scholar] [CrossRef]
- Sjöström, J.; Amon, F.; Appel, G.; Persson, H. Thermal exposure from large scale ethanol fuel pool fires. Fire Saf. J. 2015, 78, 229–237. [Google Scholar] [CrossRef]
- Brux, G. Fire Design of Steel Structures; Franssen, J.-M., Real, P.V., Eds.; Steel Construction: Berkshire, MA, USA, 2010; Volume 3, pp. 264–264. [Google Scholar]
- Jeong, Y.-W.; Koh, T.-H.; Youm, K.-S.; Moon, J. Experimental Evaluation of Thermal Performance and Durability of Thermally-Enhanced Concretes. Appl. Sci. 2017, 7, 811. [Google Scholar] [CrossRef]
- American Society for Testing and Materials. ASTM C177: Standard Test Method for Steady-State Heat Flux Measurements and Thermal Transmission Properties by Means of the Guarded-Hot-Plate Apparatus, Annual Book of ASTM Standards; ASTM International: West Conshohocken, PA, USA, 2004. [Google Scholar]
- Li, T.-T.; Zhang, X.; Peng, H.; Jiang, Q.; Dai, W.; Lou, C.-W.; Lin, J.-H. Thermally Bonded PET–Basalt Sandwich Composites for Heat Pipeline Protection: Preparation, Stab Resisting, and Thermal-Insulating Properties. Appl. Sci. 2018, 8, 510. [Google Scholar] [CrossRef]
- Hostikka, S.; Matala, A. Pyrolysis Model for Predicting the Heat Release Rate of Birch Wood. Combust. Sci. Technol. 2017, 189, 1373–1393. [Google Scholar] [CrossRef]
- Bal, N.; Rein, G. Relevant model complexity for non-charring polymer pyrolysis. Fire Saf. J. 2013, 61, 36–44. [Google Scholar] [CrossRef]
- Bal, N.; Rein, G. On the effect of inverse modelling and compensation effects in computational pyrolysis for fire scenarios. Fire Saf. J. 2015, 72, 68–76. [Google Scholar] [CrossRef]
- Rockwool Inc Homepage. Available online: https://static.rockwool.com/globalassets/rockwool-uk/downloads/datasheets/hvac/pipe-section-mat-psm.pdf (accessed on 11 October 2017).
- Rasmussen, S.N.; ROCKWOOL Inc., Hedehusene, Denmark. Personal communication, 20 February 2018.
© 2018 by the authors. Licensee MDPI, Basel, Switzerland. This article is an open access article distributed under the terms and conditions of the Creative Commons Attribution (CC BY) license (http://creativecommons.org/licenses/by/4.0/).