Abstract
This paper highlights a risk-based decision-making framework on a basis of probabilistic risk assessment (PRA). Its aim is to enable stakeholders of transport infrastructures to systematically and effectively allocate their limited resources and consequently improve resilience when facing the potential risk of a terrorist attack. The potential risk of a terrorist attack affects the inter-operation of transportation infrastructures including airports and rail stations, the regional economy, and imposes additional costs of security or any countermeasures. This novel framework is thus established in order to model the security system, to consider a multitude of threat scenarios, and to assess the decisions and choices taken by the aggressors during various stages of their attack. The framework has capability to identify the state of partial neutralization, which reveals the losses incurred when the terrorist could not reach the primary target. In this study, an underground railway station interconnected to an international airport has been used as a case study to demonstrate the effectiveness of this novel framework. By the rigorous assessment of potential losses during a variety of threat scenarios, four countermeasures that could minimise losses are proposed: screening of passengers by observation techniques (SPOT), a surveillance system, increase of the cargo screening rate, and blast-resistant cargo containers. The cost and efficiency assessment is employed to determine the most suitable countermeasures when the value of the security measures equal their cost. Note that ongoing research is still needed to establish better countermeasures since there is no end to the creativity of terrorists. The new technology, such as wireless sensors, will play an important role in the security system in the future. In particular, this study will help insurance and rail industries to model and manage risk profiles at critical infrastructure.
1. Introduction
The terrorist attacks on 11 September 2001 in the United States inflicted heavy economic losses and numerous casualties. The unprecedented effects that followed these attacks have prompted policy makers and the public to make considerable efforts towards the development of countermeasure tools and approaches. These have helped stakeholders to quantify the risk of terrorism and aid the implementation of security policies to mitigate the risk. In addition, many potential terrorist scenarios have recenty been identified, and a large number of countermeasure responses have been employed [1]. In general, a better comprehension of the terrorist actions and the way terrorists select their targets can aid in making decisions and help security designers to allocate resources in the fight against terrorism [2]. To face the challenge of terrorism, new analytical methods and new institutional arrangements should be further elaborated, as per ‘Making the Nation Safer’, a report by the National Research Council [3].
In order to enhance the security of international and local utilities and infrastructures, stakeholders and decision makers must take into account all the subtle and different ways a malicious attacker can cause human injury, fatalities and structural damage. The main difficulty in the risk analysis of terrorism is the fact that terrorists, unlike nature or engineered systems, pose intellectual challenges and can also adjust their defensive countermeasures [4]. Therefore, the authorities should allocate their limited resources accordingly across a variety of improvements that can mitigate the risk of an attack.
Reid and Reid [5] revealed that the terrorist principles and priorities for selecting targets generally include some of the following:
- High fatality possibility (crowd, confinement);
- General vulnerability (interconnected consequence, lack of security);
- High local visibility and media impact;
- Accessibility and high traffic population areas;
- Poorly designed for repelling or mitigating attack, dealing with perpetrator infiltration;
- Ability to damage or destroy the place that provides emergency care to victims;
- Difficulty evacuating victims and potential victims.
Therefore, a guide for security system designers and legislators in improving the infrastructure responses during an emergency is critically needed [6].
The strategy of the attackers is to cause more fatalities of passengers and that will have a negative effect on the economy and public transport industries. This in turn will have a media impact and affect public confidence, as evidenced by an immediate drop in revenue: for instance, in 2004, after the Madrid attack bombings on commuter trains (13 bombs and ten explosions, 175 fatalities, and 626 injured) [7]. Such irreversible losses have inspired this research. The scope of this study will focus on the high cost of losses in human lives, and of security and safety. Likewise, we will emphasise on asset criticality to highlight the interconnected risk of high cost that possibly will arise from failure of that specific asset. The issue of publicity and brand equity damage is excluded at this stage.
Infrastructure is not an independent system but rather is interconnected non-linearly with other interdependent systems. A failure of the electrical power grid, for example, may affect not only the energy sector, but also, in a cascading effect, result in the collapse or severe disruption of transportation, telecommunications, public health, and banking and financial systems of the country. More seriously, due to interdependence amidst distinct infrastructures, what happens in one infrastructure will possibly influence another, directly or indirectly. After the terrorist attacks on 11 September 2001 in the United States, it has been shown that the communications services were extensively damaged [8,9]. This is evidence of the flow-on effect due to terrorism.
As infrastructures are typically and naturally complex and many interconnected issues can arise simultaneously during the decision-making process, a better risk management framework is required to acknowledge all the exposed parameters and arisen uncertainties. In practice, a local manager at a specific infrastructure is naturally responsible for risk management during a crisis; however, in an extreme event, risk mitigation and monitoring may not be effective, causing irreversible severe consequences. Modeling risk and decision frameworks is thus appropriate for risk managers to derive the most suitable and game-changing risk management measures [10]. Hence, it is necessary to establish a guide for designers and legislators in advancing the infrastructure’s responses during a crisis [11].
A decision analysis recognizes three main features associated with all decisions including risks, benefits, and costs [9]. The cost-benefit analytical method has a wide range of applications (e.g., economics, finance, probability, reliability etc.). The effect of all these fields on a decision-making process is well defined in literature e.g., [11,12,13]. Many methods have been devised in an attempt to model and assess the efficiency of counter-terrorism (CT) procedures. Some of these methods involve game-theory approaches, which are used to model how intelligent attackers and defenders interact. Sandler et al. [14] suggested a way to model the negotiation of hostages between the attackers and the authorities. Major [15] proposed a game-theory model that optimizes the selection of a defensive strategy using the zero-sum game. Paté-Cornell and Guikema [1] developed a model that links probabilistic risk assessment, game theory and decision analysis in order to prioritize threats and choose appropriate countermeasures. In addition, Azaiez and Bier [16] suggested a game-theory method to allocate resources for the protection of complicated system structures. Their method also aimed at optimizing the allocation of resources in a way that would maximize damage to the system of the attacker.
In addition, a two-player hierarchical holographic modeling (HHM) game has been introduced. Its method has been described as a repeatable, adaptive, and systemic process for a pursuit of terrorism scenarios’ approach and arranges the team to implement a risk analysis that addresses three questions:
- What can go wrong?
- What are the consequences?
- What is the likelihood [17,18]?
The game-theory methods are very effective for risk assessment scenarios that involve intelligent attackers, but they rely on fundamental presumptions of the situations and the rationality of the parties involved. These presumptions and their validity depend a great deal on the scenario of interest. Another set of methods is based on probabilistic risk assessment (PRA). The PRA method has been used to evaluate the risks associated with complex engineered entities and it was recently used to assess terrorism risks. Moreover, PRA aids analysis and assists the decision-maker to understand and describe the risks, which predict the probable consequences [19]. Regarding the estimation of the probability of attack, two major types of approach were extensively explored in literature. Most researchers aimed to supply support for modeling risk management: (i) probabilistic risk assessment (PRA); (ii) intelligent adversary methods. Many applications of probabilistic risk analysis are presented in several former studies, aimed at the quantitative assessment of the terrorism risks [4,20]. One of the main approaches to this method, highlighted by John Garrick et al. [8], identifies and ranks the weaknesses of systems to a terrorist threat and supports the use of PRA for assessing terrorism risk particularly for assessing the probabilities of terrorist threats [9]. PRA has been a minor tool for assessing risks and informing risk management decisions by government and industry in several areas such as medical decision making, transport, environmental protection, safety, the military and security [4]. Probabilistic risk assessment (PRA) is also called probabilistic safety analysis (PSA) or quantitative risk analysis (QRA) [21].
McGill et al. [22], proposed a quantitative risk assessment and management framework that supports decision making when allocating resources for assets of critical infrastructure and protects these resources from human threat. Ayyub et al. [23] augmented this framework to evaluate portfolio risk and critical assets, considering both natural and human-caused hazards such as explosive, chemical or nuclear hazards. Dillon et al. [24,25] described a decision-making framework based on risk analysis values for allocating anti-terrorism resources using risk scores.
This paper will adopt the approaches based on PRA as a goal for the development of a risk management framework that will aid stakeholders of critical assets with the optimal allocation of limited resources for the improvement of security against terrorist threats. Previous studies such as the research conducted by McGill et al. [22] only took into account the losses caused by a successful attack and neglected the losses that can be incurred when the attacker fails to deliver a successful attack on their main target. A good example of this situation is the hijack attempt of a plane at Baltimore-Washington International Airport on 22 February 1974 [26] when the attacker failed to crash the plane into the White House but ended up injuring one and killing the other pilot in the process. This attack illustrated the fact that an attacker can still inflict losses when they are partially neutralized, i.e., prevented from taking their plan to the final stage.
We have also adopted a framework initiated primarily by Shafieezadeh et al. [27] for managing risks using the risk analysis of critical situations, which occur when the critical infrastructure faces a human threat (terrorist attack). Considering the state of partial neutralization of an attacker means that the likely loss incurred in two scenarios can be estimated. In the first scenario, the attacker would be successful in the attack on the primary target; while in the second, in spite of failing to reach his primary target, s/he would still cause significant damage to the infrastructure, threaten human life, and affect the financial market. By breaking down a security system into individual layers, each with their own probabilities of an attacker being detected, engaged and neutralized, an accurate model can be obtained. In addition, it is also assumed that the terrorists are rational and would try to maximize their chances of succeeding with the attack. In this paper, the security and safety improvements of an airport rail station will be used to illustrate the effectiveness of the novel framework; it then deals with the cost assessment for mitigating the total risk and cost-effectiveness of the measures. The emphasis of this study will be placed on irreversible and critical consequences from the assumed human threat scenarios targeting critical infrastructure, such airports or the railway station interconnected with the airports.
2. Security Risk Analysis
The proposed framework breaks down the risk analysis into five main process components as shown in Figure 1 below. A separation of these main components describes and quantifies the risk provided by the terrorist attack and the critical parameters that add to the uncertainty, and forms a framework for the critical asset and the processes for risk analysis [23].
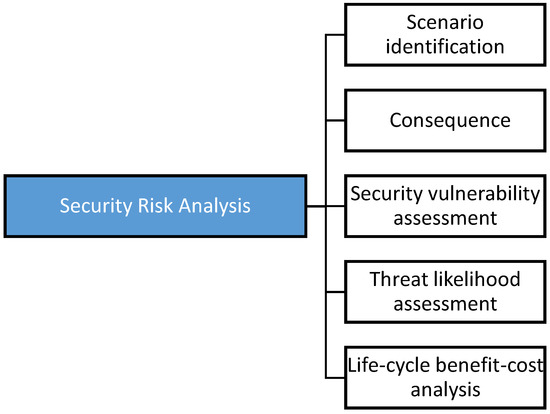
Figure 1.
Five main components of security risk analysis.
2.1. Scenario Identification
During the first step of the risk analysis, possible threat scenarios are determined. Since the 1990s, transportation systems worldwide have been predominantly targeted by terrorist attacks. This form of terrorist threat encompasses a wide range of potential attacks and more likely scenarios such as:
- Suicide attackers (the case in London, July 2005);
- Explosive devices (the Madrid bombings, 2004);
- A release of chemical, biological, radiological or nuclear material (the sarin gas attack in Tokyo in several subway stations, March 1995) [7].
The main factors contributing to the plausibility of a threat scenario are the availability of resources for the terrorists, their ability to execute a particular type of attack, the asset’s susceptibility to a threat, and possible outcomes of an attack. By taking these factors into account, the array of threats can be reduced to a number of plausible and predominant threat scenarios with lesser consequences. It has been shown that by reducing the number of scenarios to a manageable level, it will possibly avoid any additional bias and uncertainty in the risk analysis and will provide more accuracy [27]. Outlining the main scenarios has to be done with care, because eliminating possible threat scenarios can introduce uncertainty and bias into the outcome of the risk analysis.
2.2. Consequence and Criticality Assessment
This assessment provides the estimated losses of a successful attack. In the area of CT, the term loss has various meanings; such as damage to the environment, human casualties, impact on society, as well as economic losses either directly or indirectly due to physical damage, interruptions of business and financial market insecurity. These different types of losses can be estimated using game-theory methods and modeling approaches such as event trees, fault trees and decision trees. In order to assess the efficiency of the various countermeasures, all these losses are converted to a single value, which reflects the financial loss by pricing casualties with insurance data. Therefore, the total loss associated with a certain scenario, s, is measured by Ls.
2.3. Security Vulnerability Assessment
Security is only one part of the risk, and the relationships among risk management, risk assessment, and vulnerability assessment are shown in Figure 2. To understand and measure the impact of threats such as terrorism, the risk analysis and evaluation of threats and vulnerabilities are an essential process and, thus, the output is precious information for decision makers to adopt the optimal countermeasures for managing threats or proposing effective improvements to the system. The vulnerability assessment is a system in which quantitative or qualitative methods are applied to predict its (such as a security system) components’ effectiveness and overall performance by identifying its exploitable weaknesses for a defined threat. Then, after finding the gaps, it is used for improvement [28].
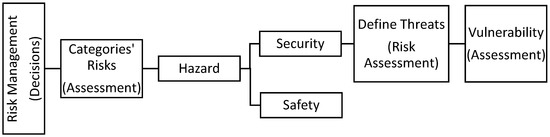
Figure 2.
The relationships between risk management and vulnerability assessment.
The vulnerability assessment process is part of a more significant risk assessment process. It is vital to differentiate security from safety when discussing any vulnerability assessment. Safety is defined as the measures (people, procedures, or equipment) used to prevent or detect an abnormal condition that can endanger people, property, or the enterprise. Security, on the other hand, includes the measures used to protect people, property, or the enterprise from malicious human threats. A proper security vulnerability assessment will consider safety controls because some safety measures aid in detection and response to security events [28].
The third step of this risk analysis reveals the probability that a terrorist is successful in attacking their target with the condition that they initiated the attack. By combining this probability with the estimates of possible losses of key assets conditioned on the success of the attack, the main conditional expected loss associated with a scenario can be revealed. The successful attack is based on the terrorist’s ability to defeat the security system. The defensive system comprises a number of sequential steps: detection of the attacker; engagement upon detection; and neutralization upon engagement (see Figure 3). Each security zone is represented by specific components used for detection, engagement and neutralization. Therefore, in security zone i, the probability that the defenders engage the attacker upon detection would be ; the probability that the defenders engage the attacker in security zone i upon detection in security zone j is represented by ; and the probability that the attacker is neutralized in security zone i, after engagement in security zone j, is expressed by .
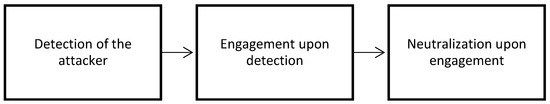
Figure 3.
The assumed defensive system process steps in the security zone.
In the case in which the terrorists are prevented from advancing to their main target, they may attempt to take other actions to maximize the losses of key assets, such as civilians, defense forces, and infrastructure. The likely loss associated with security zones that are away from the main target of the attacker might be significant. These situations include zones where the civilians might stand in groups such as during metal detector scanning and identity checks.
If a terrorist attack is foiled by defenders (or a security system), then this is viewed as a processing system (detected, engaged, and neutralized). The losses from an unsuccessful attack can be estimated by defining two states of neutralization. In the first state, the attacker is completely neutralized and is not able to inflict any damage to his surroundings. This state is labeled as neutralization of type 1 or full neutralization and is denoted by for the security zone i with a probability of . The second state of partial neutralization is used for the situations in which the terrorist is denied access to the following security zone but is not completely neutralized and, therefore, is still able to cause damage to the surroundings. The state of partial neutralization is labeled as type 2, denoted by , with a probability of . However, if the defenders fail to neutralize the attacker, then the attacker can proceed to the next security zone. In this situation, the probability is equal to
Taking into account that all the means of detection are interconnected in all security zones, the attacker would only need to be detected in one security zone for full detection across all security zones. It is then safe to assume that either the engagement or the neutralization of the attacker failed in zone i if they are able to pass to the next security zone i + 1, where they will be subsequently engaged. The probability associated with this situation would be and an illustration is provided in Figure 4 and Table 1. Figure 4 shows the hypothetical asset with two security zones in series, where the arrows present the attacker–scenario movement, and the circles show the scenario events by the defenders against the attacker.
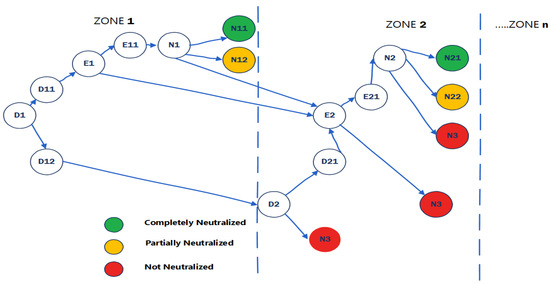
Figure 4.
Hypothetical assets with two security zone.

Table 1.
The assumed defensive system’s process symbols.
Therefore, the probability that the attacker is completely neutralized, i.e., interdiction of type 1 (m = 1), or partially neutralized, i.e., interdiction of type 2 (m = 2), is shown in Equation (1) [27]:
The probability of a successful attack is achieved by:
where is the probability that the defenders fail to stop the attacker; and is the probability conditioned by a successful attack, providing that the defenders fail to stop the attacker. A successful attack incurs the following expected loss:
where is the expected loss conditioned by a successful attack.
In the scenario when the attacker is not completely neutralized, they can still cause damage to surrounding assets in zone i and the loss incurred is dependent on the value of the vulnerable assets denoted by . This loss can be estimated with:
where is the probability of a successful attack in the event of a type 2 partial neutralization. Furthermore, it should be mentioned that even if the attacker is not able to cause damage to surrounding assets, the notion of secondary losses needs to be taken into account because the news of a terrorist attack can be detrimental to an airport as a business due to the feeling of insecurity raised. The secondary losses can be determined with:
where represents the expected loss when the terrorist fails in their attack due to being completely neutralized; is the expected loss in the case when the terrorist is prevented from executing their attack by a partial neutralization; and is the expected loss incurred when the terrorist is detected during the attempt and is not successful in executing the attack. Finally, the total expected loss of a certain attack profile is calculated with:
2.4. Threat Likelihood Assessment
One of the main steps in security risk analysis is creating a model of the decision-making process during which the attackers pick their best options and alternatives to execute the attack. The utility theory can be used to factor risk aversion into the decision process, and this section will infer utility functions that represent attacker profiles in a threat likelihood assessment [27].
Their preferences can be illustrated by utility functions that order the alternative choices of the attackers by preference in a certain stage of the attack [1]. Terrorists maximize the expected utility by choosing the appropriate attack profile, threat scenario and asset to attack. The attacker’s utility function focuses on the maximum loss brought to the defenders, reducing their loss in the case of an unsuccessful attack and minimizing the cost of execution.
With the assumption that the attackers and the defenders share the same knowledge about the security system and the asset value, as well as meeting the cost of the delivery system following no expectation of survival, the utility function for an attack profile i can be determined with:
where denotes the conditional total expected loss associated with an attack profile i.
Here the conditional probabilities are appropriate as part of the risk assessments method and other decision support modeling [28]. Together with the attacker’s self-evaluated expected utility, the visibility of an option is also important to the overall attractiveness of the said option. The perceived utility function for an attack profile i is:
where denotes the probability that the attack profile i is visible to the attacker.
The attacker has a perceived utility function for every threat scenario having as a target a certain main element of an asset. This is obtained with the product of the visibility probability of that main element () and the maximum of all perceived utilities from corresponding attack profile alternatives:
In addition, the total perceived utility for an asset is represented by the maximum of all perceived utilities for threat scenarios linked with that asset while taking into account the visibility probability of that asset, :
Assuming that a rational attacker would choose the most favorable option out of all the alternatives, their decision making can be modeled using the relative attractiveness of a choice. This is the ratio of the expected utility of that choice to the sum of all utilities of the alternative options. There are three ratios of relative attractiveness for attack profile, threat scenario and asset:
The annual rate of occurrence of an attack profile can be determined using:
where is the annual rate of occurrence for a threat scenario. The annual expected loss corresponding to an attack profile is calculated by multiplying the annual rate of occurrence and the total expected loss of an attack [27]:
There is no doubt that terrorism impacts on people’s lives, on the economy of the country and on transportation industries such as aviation and railways. However, some effects are indirect, which might be difficult to measure. For example, an increase in people spending money on security could affect housing prices. Also, it is difficult to quantify the precise impact on the economic growth, tourism, psychological implications, and public panic, media exposure, etc.
Moreover, terrorism can affect political systems and their relevance to societies, culture and religion. From a rationality perspective, the terrorism attackers have a target and they maximise their utility within some constraints and the available resources. Terrorism’s complexity and the difficulties in measuring some aspects such as political and economic implications are reflected in the utility model applied. In fact, utility theory does not explain the motives of the terrorists. Also, it is expected that the utility of the terrorist and the defenders does not always align. Additionally, it is possible that the model of the terrorist’s decision making does not cover all vulnerabilities in the system. We will investigate this important aspect to identify an approach that aids the decision makers and explains the mechanisms and strategies of the attackers [29,30,31,32].
2.5. Life Cycle Cost Assessment
For the decision makers, it is essential to have analytical tools for comparing and assessing the risk against the costs. If the loss feature is in units other than cost (such as fatalities), an insurance-based conversion will be used when assessing the costs and benefits of CT, which denote protective measures for infrastructures. Then, the incremental cost-effectiveness ratio (CER) can be used to define cost-effectiveness as explained [13]:
A security risk assessment aims to identify the most efficient risk reduction options while taking into account a limited budget. Generally, these options include the reduction of the probability of attacks and the potential losses following an attack. Efficiency is obtained by observing the reduction in total loss upon the application of the mitigation method, while taking into account the cost of implementation.
3. Risk Assessment of an Airport’s Rail Station
The rail and aviation infrastructures are crucial to society in modern-day lifetyles due to their importance to global commerce, tourism and transit. As a result of this, they have become a main target of terrorist threats. In Europe specifically, mass transits are facing a major risk from international terrorism [3,7].
Any threats to the aviation system must be addressed, including concerns that terrorists might attack the aircraft in the air or on the ground, or also the airport facilities. Not only are passengers, personnel, and airline infrastructure menaced, but also the country’s economy and the airline industry are at significant risk [33,34]. To assess the risks from the reduction of aviation security, a simple system model of existing aviation security countermeasures is necessary. Figure 5 shows the security process layers used to mitigate threats to defeat the system by deterring or disrupting a terrorist hijacking an aircraft [35].
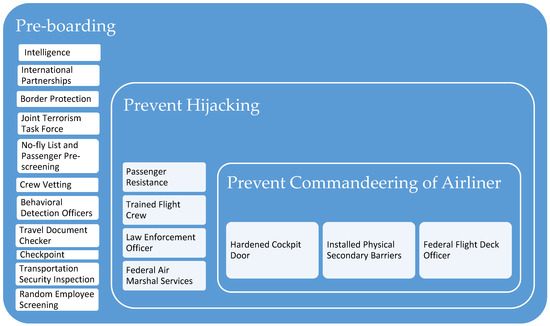
Figure 5.
Layers diagram for aviation security measures (US security layers).
To enable the optimization of cost-effective countermeasures and decide future solutions that can be applied to both manage a reduction in risk to acceptable levels and raise the resilience, the first step is to perform a risk assessment (of an airport’s rail station). The assessment will identify the level of the risks most related to an explicit location or scenario. The risk assessment is a powerful method to assess diverse risks and vulnerabilities in an analytical way, which will promote the security of the systems [7]. Commonly, threat attacks are defined as the probability of attack accrues , and the consequences (C), which are the losses that might take place (fatalities, injuries, direct and indirect economic effects, etc.). The risk can be quantified as shown below:
Quantifying the probability P(A) demands: expertise, data, or modeling of the hostile agents; intent and capabilities of possible attackers; as well as knowledge about historical attacks and their relevance to the existing risk [4]. The represents the probability that the attack succeeds given that it occurs (vulnerability) [36].
Over the next section, the proposed risk assessment framework will be implemented, and it will reveal the cost-effectiveness of measures used to combat terrorist threats to the critical infrastructure. The hypothetical railway station and its corresponding airport analyzed in this example will have their security system divided into nine security zones (S1–S9), each having a specific set of countermeasures.
3.1. Scenario Identification
Possible scenarios of terrorist attacks include the use of bombs, arson, various methods of disruption, shooting, and hijacking. In this case study, it will be assumed that the terrorist uses the railway system as a means of transit towards the airport to achieve their primary goal, namely the destruction of an aircraft in flight. If the terrorist is detected and fails in their attack on the primary target, they may attempt to cause damage to other key assets revealing three possible threat scenarios: explosion in the rail station or a platform, explosion in the airport, and explosive attack in an aircraft.
3.2. Consequence and Criticality Assessment
If the terrorist successfully attacks the aircraft in flight, two loss scenarios are revealed: L1—a fatal crash; and L2—the aircraft manages to land safely after the occurrence of an explosion in flight. Two more threat scenarios are considered if the attacker fails to detonate the bomb according to the plan: L3—explosion in the aircraft on the ground; and L4—no detonation. For the fourth scenario, even though the physical damage does not occur, the event generates public fear and a reluctance to use the transport system. Furthermore, if the attacker is detected and prevented from causing damage to their primary target, they may damage other important assets. Three more threat scenarios are considered for this situation: L5—explosion in the rail station using the bomb that was intended to be placed in the aircraft; or L6—explosion in the airport with the same bomb (see Table 2).
Table 2.
The consequences and losses’ scenarios of a terrorist attack using bombs. The color represents the risk level (red: high; yellow: medium; and green: low).
For all these scenarios, three types of consequences are considered: the loss of lives, the loss in property damage, and the loss in revenue in the aftermath of the attack due to public fear. In this example, the data is based on the historical data regarding bomb attacks between 1993 and 2009. Bombing accounted for 67% of terrorism events from 482 total incidents between 1980 and 2001 (see Figure 6) [37]. Seventy years of recorded incidents show the dangers of explosives on commercial aviation. It considers the total airline bombings and a total of 88 criminal incidents from 1933 to 2014, which destroyed 50 aircraft and damaged 32. Terrorism remains a severe risk to air travel as a result of hijackings and the suicide attacks of 11 September 2001 [38].
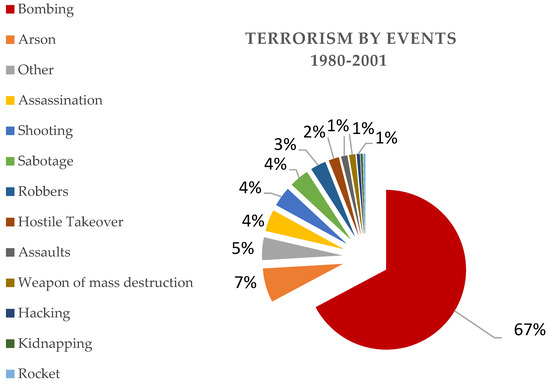
Figure 6.
Terrorist incidents by event 1980–2001-Source US-FBI.
Historical averages are used to reflect the fatalities for each scenario [38,39] and the percentage losses are based on data from open literature (shown in Table 3).
Table 3.
Percentage loss for every attack scenario.
3.3. Security Vulnerability Assessment
The security vulnerability analysis must consider security measures since some security controls aid in detection and response to security events such as terrorist attacks (sprinklers will fight fires regardless of the cause). However, some attacks require advanced detection and response capability. Security includes the measures used to protect people, assets, or businesses from malevolent human threats and to prevent a significant loss of revenue [28].
It is shown that vulnerability can be reflected by the effect of different attack modes from one target to another and how likely attacks are on the target area. The severity is estimated from the integrated modeling of weapon effects and the design of the structural and system features of targets, population densities, human activity patterns, business activities, and values of buildings and their contents [40].
The vulnerability of key assets is assessed by analyzing the combinations of attack delivery systems and intrusion ways (which consist of combinations of security zones):
- A1—suicide bombing platform (S1), concourse (S2), station building (S3), terminal (S4), and screening checkpoints (S5).
- A2—hand-placed bomb: perimeter fence and runway (S6), baggage loading (S7).
- A3—air cargo bomb: main gate (S8), air cargo screening (S9).
For every intrusion path, the vulnerability is obtained from the defense system containing the means of detection, engagement and neutralization. It is also assumed that the defenders will attempt to neutralize the attackers upon detection, or . The probabilities of detection, partial neutralization and complete neutralization are listed in Table 4 for every security zone. Expert opinion was used to estimate the probabilities of detection and neutralization [27,34,41,42,43,44,45].
Table 4.
Security zones and countermeasures.
Using the aforementioned probabilities and Equation (1), the probability - that the attackers are partially or completely neutralized by the defenders is determined.
The conditional risk for every attack profile is calculated using Equations (2)–(6). Using historical data regarding bombing incidents [34,38,39], the corresponding conditional probability for each attack profile is estimated along with the probabilities of the loss scenarios L1–L6. These apply to the state of partial neutralization of the attacker and are listed in Table 5 and Table 6. In Table 5, reported data [38,39] was used for the conditional probabilities for L1 and L2 scenarios as well as in Table 6 for the value for attack profiles A1, A2, A3. Expert opinion [25] was used for the probabilities of L2–L6 scenarios.
Table 5.
Conditional probabilities of loss scenarios for every attack profile.
Table 6.
Conditional risk for every attack profile (US Dollar equals 0.72 British Pound).
3.4. Threat Likelihood Assessment
By using Equation (11), the attractiveness of each intrusion way can be calculated. Under the assumption that the utility correlated with loss can be translated into a monetary value and the monetary assessment is not altered, the utility function will be equal to , similar to Equation (7). It is considered that the attacker will have two different cases of intrusion with different visibilities. In the first, all the intrusion ways will be visible for the attacker; while in the second, the visibility will be impaired, which will alter the timing and position for the attacker profiles A2 and A3.
For each intrusion way, the attack’s rate of occurrence per year will be determined from Equation (12). The will be assumed to be 0.25 per year and the relative attractiveness of the asset will be considered 1/6800; both values being based on historical data [38,39]. is equal to 1, assuming that crashing an aircraft is the only threatened target. The values for the utility function, the attacker’s perceived utility function, the relative attractiveness of the attack profile, the relative attractiveness of the threat scenario, the relative attractiveness of the asset, the attack’s rate of occurrence per year, and the total annual expected loss are all listed in Table 7. By observing the values of , it is determined that the attractiveness of a certain intrusion way depends on its visibility [27].
Table 7.
Relative attractiveness and total annual risk.
3.5. Cost and Efficiency Assessment of Countermeasures
For the mitigation of the total risk of a bombing attack, four countermeasures can be advised:
C1—The implementation of a Screening of Passengers by Observation Techniques (SPOT) [41] program. This program analyses the behavior of people concentrating on actions indicative of high levels of stress, terror, or deception, in order to identify possible suicide bombers. Homeland Security has reported a study where it reported that SPOT is found to be more effective than random screening [46,47]. The behavior detection officers (BDO) try to detect suspicious actions by briefly engaging passengers in casual conversation. The cost of this program would be roughly 0.018 million pounds per year per aircraft [48]. Since this program does not use any devices or instrumentation, the cost of installation is neglected. It is assumed that the implementation of this program will increase the probability of detection from 0.1 to 0.3 [25]. However, SPOT officials reported that it is not known if the SPOT technique has brought about the arrests of passengers who are terrorists [46,49].
C2—The installation of an elaborate video surveillance system that would detect perimeter breaches. The total installation cost of such a system would be roughly 0.715 million pounds per airport; while the operating costs which include power consumption, false alarms, and maintenance which would be around 0.0008 million pounds per year per aircraft [47]. The probability of detection after the installation would meet the security expectations, being raised up to 0.7. The value for the probability of the detection gained by the video surveillance method is treated as confidential in existing reports [27,46].
C3—Increasing the current screening rate from the existing level of 50% to 100% [46] by implementing the Act of 9/11, the Commission recommendations suggested raising screening of all air cargo to 100% [45]. The cost was estimated to be roughly 193 million pounds, and the 10-year approximation of the improved operating cost was 2.75 billion pounds for the air transport industry, with 0.028 million pounds for installation and 0.048 million pounds for operational costs per year [41,49,50,51]. This countermeasure would lead to an assumed probability of detection of up to 0.8 [47].
C4—The installation of blast-resistant cargo containers. The deployment of cargo containers for suspicious items could mitigate the threat of an explosion or arson attack and the annual cost of operation would be 0.014 million pounds per passenger flight, as calculated by National Research Council. The annual operation and support cost was estimated to be 0.0014 million pounds per aircraft [48,52]. The containers option could mitigate the terrorist risk from a threat such as placing a bomb in air cargo and, moreover, mitigating cargo crimes such as theft and smuggling. Furthermore, it is a low-cost solution compared with more advanced solutions. In the case of a successful attack with a hand-placed bomb (A2) or air cargo bomb (A3), the probability associated with fatalities is assumed to be decreased by 66% [25,28,39,51,52,53,54].
Obviously, the likely risk reduction and the raising of the probability of detection is provided by these assumed security measures. However, even with these assumptions in place, it appears that increasing the current screening rate (C3) stands as a costly choice, but with an acceptable detection rate. Moreover, insofar as SPOT does not reduce risk much, it is recommended that a cost-benefit analysis of the SPOT program be implemented, and a comparison of the SPOT with other security methods [43] could potentially achieve a less expensive mix of security measures such as the installation of an elaborate video surveillance system (C2) and the installation of blast-resistant cargo containers (C4). We believe that quick technological improvements will aid the security systems, making use of effective and low-cost countermeasures such as smart and wireless sensors [55].
4. Conclusions
It is clear that a terrorist attack on one part of any complex infrastructure such as a railway station interconnected with an airport could cause a serious loss of lives and deterioration of the economy and the infrastructure as a whole. Thus, risk management of vital infrastructure is crucial for prosperity in our modern society. Terrorist attacks have been determined as a major source of risk and stakeholders and decision makers have made considerable efforts to develop tools that aid risk mitigation. The difference between a natural risk and a terrorism risk is that the latter is planned by an intelligent aggressor and, therefore, cannot be modeled using a random approach. To manage this risk, one must consider human behavior in identifying possible terrorist threats and their consequences. This paper presents a novel risk assessment framework inspired by Shafieezadeh et al. [27], which can be used to alleviate the risk of terrorist attacks on transport infrastructure. It highlights the possibility of partial neutralization of the attacker. The most important research concerns the probability of the threat execution of attackers on transportation infrastructure, and the cost effects of suggested countermeasures to terrorist motivations, which would significantly reduce the probability of an attack. A probabilistic risk analysis approach has been adapted to analyse security systems with two assumed zones and a two-state neutralization defence. The conducted model is applicable for other comparable systems with more than two security zone areas. Haimes [56] proposed the use of multiple techniques for estimating terrorist actions as probabilities, and this study is in very good agreement. A PRA has been found to be a useful method for assessing terrorism risks, particularly for forming a baseline comparison of these risks. However, the PRA has limitations and it is not a complete solution alone [57,58,59,60,61].
The state of partial neutralization affects the decisions of the attacker and yields different loss scenarios. The purpose of this framework is to illustrate plausible examples of terrorist attacks while not suggesting that the countermeasures presented are the best, or the only ones that need to be considered. Furthermore, it highlights that the possibility of attacks on foreign airlines that have not installed countermeasures would rise. Political and market decisions as well as the development of new technology will change the effectiveness of this framework. It is suggested that the framework be updated when more information becomes accessible. To make the nation safer, it has been proposed that existing knowledge and technology for utility coherence, layered security systems, data fusion, and improvement innovation for better technologies (e.g., wireless sensors) should be used. Moreover, given the adaptive nature of this process, future studies will be required in order to assess the decision making of the attacker and the defender in subsequent terrorist scenarios. The conditional probabilities of threats with a model of PRAs will create a useful insight concerning terrorist decision making, enhancing further knowledge for those interested in applying analytical tools to terrorism risks. The insight witll assist decision analysts and will benefit security planning for public transportation. In addition, the analysis shows that one can come to reasonable conclusions with a wide range of probabilities of an attack. In sum, it is expected that the security framework will aid the decision makers in maintaining more secure transportation infrastructures such as airports and railway stations. The framework implementation will guarantee a certain level of security. It is important to note that modeling techniques should be constantly improved and should evolve in parallel with the increasing complexity of the systems and the intelligence of attackers. In future, smart technology will play an essential role in security improvements and will aid decision makers in managing risks to critical infrastructure systems.
Author Contributions
S.K. and S.C. conceived and designed the analyses and critical review criteria; S.K. and S.C. analyzed the data; H.A. contributed materials/analysis advice and tools; S.K., H.A. and S.C. wrote the paper.
Acknowledgments
S.K. wishes to thank the Australian Academy of Science and the Japan Society for the Promotion of Sciences for his Invitation Research Fellowship (Long-term), Grant No. JSPS-L15701 at the Railway Technical Research Institute and the University of Tokyo, Japan. The authors are also sincerely grateful to the European Commission for the financial sponsorship of the H2020-RISE Project No. 691135 “RISEN: Rail Infrastructure Systems Engineering Network”, which enables a global research network that tackles the grand challenge of railway infrastructure resilience and advanced sensing in extreme environments (www.risen2rail.eu) [62].
Conflicts of Interest
The authors declare no conflict of interest. The founding sponsors had no role in the design of the study; in the collection, analyses, or interpretation of data; in the writing of the manuscript, and in the decision to publish the results.
References
- Paté-Cornell, E.; Seth, G. Probabilistic modeling of terrorist threats: A systems analysis approach to setting priorities among countermeasures. Mil. Oper. Res. 2002, 7, 5–23. [Google Scholar] [CrossRef]
- Keeney, G.L.; Detlof, V. Identifying and structuring the objectives of terrorists. Risk Anal. 2010, 30, 1803–1816. [Google Scholar] [CrossRef] [PubMed]
- National Research Council. Making the Nation Safer: The Role of Science and Technology in Countering Terrorism; National Academies Press: Washington, DC, USA, 2002; ISBN1 0309182727. ISBN2 9780309182720. [Google Scholar]
- Ezell, B.C.; Bennett, S.P.; Detlof, V.; Sokolowski, J.; Collins, A.J. Probabilistic risk analysis and terrorism risk. Risk Anal. 2010, 30, 575–589. [Google Scholar] [CrossRef] [PubMed]
- Reid, D.J.; Reid, W.H. Managing facility risk: External threats and health care organizations. Behav. Sci. Law 2014, 32, 366–376. [Google Scholar] [CrossRef] [PubMed]
- Cimellaro, G.P.; Mahin, S.; Domaneschi, M. Integrating a Human Behavior Model within an Agent-Based Approach for Blasting Evacuation. Computer-Aided Civil and Infrastructure Engineering. Comput.-Aided Civ. Infrastruct. Eng. 2018, 1–18. [Google Scholar] [CrossRef]
- Sánchez, M.M. Security risk assessments in public transport networks. Proc. Inst. Mech. Eng. Part F J. Rail Rapid Transit 2011, 225, 417–424. [Google Scholar] [CrossRef]
- Garrick, B.J.; Hall, J.E.; Kilger, M.; McDonald, J.C.; O’Toole, T.; Probst, P.S.; Parker, E.R.; Rosenthal, R.; Trivelpiece, A.W.; Van Arsdale, L.A.; et al. confronting the risks of terrorism: Making the right decisions. Reliab. Eng. Syst. Saf. 2004, 86, 129–176. [Google Scholar] [CrossRef]
- United States General Accounting Office. Potential Terrorist Attacks: Additional Actions Needed to Better Prepare Critical Financial Market Participants: Highlights of GAO-03-251: A Report to Congressional Requesters; DIANE Publishing: Philadelphia, PA, USA, 2003; pp. 4–89. ISBN1 1428942815. ISBN2 9781428942813.
- Aven, T.; Renn, O. The role of quantitative risk assessments for characterizing risk and uncertainty and delineating appropriate risk management options, with special emphasis on terrorism risk. Risk Anal. 2009, 29, 587–600. [Google Scholar] [CrossRef] [PubMed]
- Jordaan, I. Decisions under Uncertainty: Probabilistic Analysis for Engineering Decisions; Cambridge University Press: New York, NY, USA, 2005. [Google Scholar]
- Bammer, G.; Smithson, M. (Eds.) Uncertainty and Risk: Multidisciplinary Perspectives; Routledge: Oxford, UK, 2012; ISBN1 1136549854. ISBN2 9781136549854. [Google Scholar]
- Stewart, M.G. Risk-informed decision support for assessing the costs and benefits of counter-terrorism protective measures for infrastructure. Int. J. Crit. Infrastruct. Prot. 2010, 3, 29–40. [Google Scholar] [CrossRef]
- Sandler, T.; Tschirhart, J.T.; Cauley, J. A theoretical analysis of transnational terrorism. Am. Political Sci. Rev. 1983, 77, 36–54. [Google Scholar] [CrossRef]
- Major, J.A. Advanced techniques for modeling terrorism risk. J. Risk Financ. 2002, 4, 15–24. [Google Scholar] [CrossRef]
- Azaiez, M.N.; Bier, V.M. Optimal resource allocation for security in reliability systems. Eur. J. Oper. Res. 2007, 181, 773–786. [Google Scholar] [CrossRef] [Green Version]
- Haimes, Y.Y.; Horowitz, B.M. Adaptive two-player hierarchical holographic modeling game for counterterrorism intelligence analysis. J. Homel. Secur. Emerg. Manag. 2004. [Google Scholar] [CrossRef]
- Haimes, Y.Y. Hierarchical holographic modeling. IEEE Trans. Syst. Man Cybernet. 1981, 11, 606–617. [Google Scholar] [CrossRef]
- Bier, V.M. Risk in Extreme Environments: Preparing, Avoiding, Mitigating, and Managing; Routledge: Oxford, UK, 2017; ISBN1 1317029941. ISBN2 9781317029946. [Google Scholar]
- Landucci, G.; Argenti, F.; Cozzani, V.; Reniers, G. Assessment of attack likelihood to support security risk assessment studies for chemical facilities. Process Saf. Environ. Prot. 2017, 110, 102–114. [Google Scholar] [CrossRef]
- Jensen, U. Probabilistic risk analysis: Foundations and methods. J. Am. Stat. Assoc. 2002, 97, 925. [Google Scholar] [CrossRef]
- McGill, W.L.; Ayyub, B.M.; Kaminskiy, M. Risk analysis for critical asset protection. Risk Anal. 2007, 27, 1265–1281. [Google Scholar] [CrossRef] [PubMed]
- Ayyub, B.M.; McGill, W.L.; Kaminskiy, M. Critical Asset and Portfolio Risk Analysis: An All-Hazards Framework. Risk Anal. 2007, 27, 789–801. [Google Scholar] [CrossRef] [PubMed]
- Dillon, R.L.; Liebe, R.M.; Bestafka, T. Risk-based decision making for terrorism applications. Risk Anal. 2009, 29, 321–335. [Google Scholar] [CrossRef] [PubMed]
- Rios, J.; Insua, D.R. Adversarial risk analysis for counterterrorism modeling. Risk Anal. 2012, 32, 894–915. [Google Scholar] [CrossRef] [PubMed]
- Price, J.; Forrest, J. Practical Aviation Security: Predicting and Preventing Future Threats, 3rd ed.; Butterworth-Heinemann: Oxford, UK, 2016; ISBN1 0128043598. ISBN2 9780128043592. [Google Scholar]
- Shafieezadeh, A.; Cha, E.J.; Ellingwood, B.R. A decision framework for managing risk to airports from terrorist attack. Risk Anal. 2014, 35, 292–306. [Google Scholar] [CrossRef] [PubMed]
- Garcia, M.L. Vulnerability Assessment of Physical Protection Systems; Elsevier: New York, NY, USA, 2005; pp. 2–5. ISBN1 0080481671. ISBN2 9780080481678. [Google Scholar]
- Stewart, M.G.; Mueller, J. Aviation security, risk assessment, and risk aversion for public decision making. J. Policy Anal. Manag. 2013, 32, 615–633. [Google Scholar] [CrossRef]
- Levine, E.S. Estimating conditional probabilities of terrorist attacks: Modeling adversaries with uncertain value tradeoffs. Risk Anal. 2012, 32, 294–303. [Google Scholar] [CrossRef] [PubMed]
- Sandler, T.; Enders, W. An economic perspective on transnational terrorism. European J. Political Econ. 2004, 20, 301–316. [Google Scholar] [CrossRef] [Green Version]
- Sandler, T.; Arce, D.G. Terrorism & game theory. Simul. Gaming 2003, 34, 319–337. [Google Scholar] [CrossRef]
- Wenzlaff, K. Terrorism: Game Theory and Other Explanations. Bachelor’s Thesis, Universitat Bayreuth, Bayreuth, Germany, May 2004. [Google Scholar]
- Von Winterfeldt, D.; O’Sullivan, T.M. Should we protect commercial airplanes against surface-to-air missile attacks by terrorists? Decis. Anal. 2006, 3, 63–75. [Google Scholar] [CrossRef]
- Stewart, M.G.; Mueller, J. Terrorism risks and cost-benefit analysis of aviation security. Risk Anal. 2013, 33, 893–908. [Google Scholar] [CrossRef] [PubMed]
- Baybutt, P. Issues for security risk assessment in the process industries. J. Loss Prev. Process Ind. 2017, 49, 509–518. [Google Scholar] [CrossRef]
- Federal Bureau of Investigation Counterterrorism Division. TERRORISM 2000/2001; Federal Bureau of Investigation: Washington, DC, USA, 2000.
- Commercial Airline Bombing History. Available online: http://www.aerospaceweb.org (accessed on 8 March 2018).
- National Transportation Safety Board (NTSB) Aviation Accident Database. Available online: https://www.ntsb.gov (accessed on 3 July 2018).
- Willis, H.H.; LaTourrette, T.; Kelly, T.K.; Hickey, S.; Neill, S. Terrorism Risk Modeling for Intelligence Analysis and Infrastructure Protection; RAND Corporation: Santa Monica, CA, USA, 2007; ISBN1 0833039741. ISBN2 9780833039743. [Google Scholar]
- Elias, Bart, Air Cargo Security. 2007. Available online: https://fas.org/sgp/crs/homesec/RL32022.pdf (accessed on 3 August 2018).
- Hsgac.Senate.Gov, United States General Accounting Office. November 2003. Available online: https://www.hsgac.senate.gov/imo/media/doc/MsCathyBerrickStatement.pdf (accessed on 3 August 2018).
- Testimony of Gerald, L. Dillingham before Committee on Commerce, Science, and Transportation Subcommittee on Aviation, United States Senate, United States General Accounting Office. 6 April 2000. Available online: https://www.gao.gov/assets/110/108370.pdf (accessed on 14 March 2018).
- Report to Congressional Requesters, United States General Accounting Office. June 2004. Available online: https://www.gao.gov/assets/250/242812.pdf (accessed on 14 March 2018).
- Testimony of Gregory D. Kutz and John W. Cooney before Committee on Oversight and Government Reform, House of Representatives, United States General Accounting Office. 15 November 2007. Available online: https://www.gao.gov/assets/120/118618.pdf (accessed on 14 March 2018).
- Airport Perimeter Security, Hearing before the Subcommittee on National Security, Homeland Defense and Foreign Operations of the Committee on Oversight and Government Reform House of Representatives. 13 July 2011. Available online: http://oversight.house.gov/wp-content/uploads/2012/04/7-13-11-Subcommittee-on-National-Security-Homeland-Defense-and-Foreign-Operations-Hearing-Transcript.pdf (accessed on 15 March 2018).
- United States Government Accountability Office. Efforts to Validate TSA’s Passenger Screening Behavior Detection Program Underway, but Opportunities Exist to Strengthen Validation and Address Operational Challenges. May 2010. Available online: https://www.gao.gov/assets/310/304510.pdf (accessed on 10 March 2018).
- Department of Homeland Security. Privacy Impact Assessment for the Screening of Passengers by Observation Techniques (SPOT) Program. 5 August 2008. Available online: https://www.dhs.gov/xlibrary/assets/privacy/privacy_pia_tsa_spot.pdf (accessed on 8 March 2018).
- United States Government Accountability Office. TSA Has Made Progress, but Additional Efforts Are Needed to Improve Security. September 2011. Available online: https://www.gao.gov/assets/130/126981.pdf (accessed on 10 March 2018).
- United States House of Representatives. Implementing Recommendations of the 9/11 Commission Act of 2007. Conference Report to Accompany H.R. 1. 2007. Available online: https://www.congress.gov/110/plaws/publ53/PLAW-110publ53.pdf (accessed on 1 February 2018).
- Yglesias, M. $1.27 Trillion: The price is wrong. Am. Prospect 2006, 17, 28–32. Available online: https://search-proquest-com.ezproxye.bham.ac.uk/docview/201127028?accountid=8630 (accessed on 1 February 2018).
- National Research Council. Assessment of Technologies Deployed to Improve Aviation Security: First Report; National Academies Press: Washington, DC, USA, 1999. [Google Scholar]
- Airplanes, Boeing Commercial. 747-400 Airplane Characteristics for Airport Planning; Airplanes, Boeing Commercial: Seattle, WA, USA, 2002. [Google Scholar]
- Kaewunruen, S. Underpinning systems thinking in railway engineering education. Australas. J. Eng. Educ. 2017, 22, 107–116. [Google Scholar] [CrossRef]
- Alawad, H.; Kaewunruen, S. Wireless Sensor Networks: Toward Smarter Railway Stations. Infrastructures 2018, 3, 24. [Google Scholar] [CrossRef]
- Haimes, Y.Y. Risk Modeling, Assessment, and Management, 4th ed.; John Wiley & Sons: Hoboken, NJ, USA, 2015; pp. 69–114. ISBN1 111901798X. ISBN2 9781119017981. [Google Scholar]
- Alawad, H.A.H.; Codru, S.; Kaewunruen, S. Complex-system decision framework for managing risks to rail stations at airports from terrorist threats. In Proceedings of the 5th International Conference on Road and Rail Infrastructure, Croatia, Zadar, 17–19 May 2018. [Google Scholar]
- Binti Sa’adin, S.L.; Kaewunruen, S.; Jaroszweski, D. Risks of Climate Change with Respect to the Singapore-Malaysia High Speed Rail System. Climate 2016, 4, 65. [Google Scholar] [CrossRef]
- Saadin, L.; Kaewunruen, S.; Jaroszweski, D. Operational readiness for climate change of Singapore-Malaysia HSR. Proc. Inst. Civ. Eng. Transp. 2016. [Google Scholar] [CrossRef]
- Kaewunruen, S.; Sussman, J.M.; Einstein, H.H. Strategic framework to achieve carbon-efficient construction and maintenance of railway infrastructure systems. Front. Environ. Sci. 2015, 3, 6. [Google Scholar] [CrossRef]
- Rennie, J.; Kaewunruen, S.; Baniotopoulos, C. Blast effects on spatial glass shells for a long-span roof structure. In Proceedings of the IASS Symposium 2018, Cambridge, MA, USA, 16–20 July 2018; Mueller, C., Adriaenssens, S., Eds.; MIT: Boston, MA, USA, 2018. [Google Scholar]
- Kaewunruen, S.; Joseph, M.; Sussman, A.M. Grand challenges in transportation and transit systems. Front. Built Environ. 2016, 2, 4. [Google Scholar] [CrossRef]
© 2018 by the authors. Licensee MDPI, Basel, Switzerland. This article is an open access article distributed under the terms and conditions of the Creative Commons Attribution (CC BY) license (http://creativecommons.org/licenses/by/4.0/).