1. Introduction
Personal mobility (PM) devices refer to small electrically powered mobility devices, including electric kick scooters, self-balancing two-wheeled devices, and electrically powered bicycles capable of moving using motor power alone. These devices have expanded rapidly as practical options for short-distance travel and first- and last-mile access to public transport. Shared e-scooter services have become particularly common around commercial districts, university areas, public transport nodes, and residential neighborhoods, integrating PM devices into urban transport systems previously organized primarily around walking, cycling, public transport, and private motor vehicles. Although this diffusion has expanded short-distance mobility options, it has also introduced new traffic-safety concerns. Pedestrians remain directly exposed to impact forces in PM–pedestrian collisions, while PM devices may present risk characteristics that differ from those of conventional bicycles because of electric propulsion, small wheels, short wheelbases, limited riding stability, and substantial variation in rider experience.
In Korea, PM-related regulations have been repeatedly revised, primarily through amendments to the Road Traffic Act [
1]. The Act defines PM devices as a subset of motorized bicycles meeting specified speed and weight criteria and regulates them within the broader framework applied to bicycle-like road users. Where bicycle roads are available, PM users are generally expected to use them; where such facilities are unavailable, they are expected to travel along the right edge of the roadway. Regulatory changes implemented in December 2020 expanded PM access to bicycle roads and reduced some barriers to use. Growing safety concerns subsequently led to further amendments that took effect on 13 May 2021, strengthening driver-licensing requirements, helmet-use requirements, passenger-riding restrictions, and penalties for unlicensed riding. These changes represented an attempt to integrate PM devices into the urban transport system while strengthening user-oriented safety regulation. However, it remains unclear how the composition and monthly trajectory of police-reported PM crashes changed around this regulatory strengthening. Because the amendment focused on user eligibility, protective equipment, and passenger restrictions, its implications should be examined not only through total crash counts but also through crash type, collision counterpart, injury severity, time of day, and, where the data permit, the behaviors directly targeted by the amendment.
A central issue in PM safety is the relationship between traffic regulation and travel space. PM devices have been incorporated into the bicycle-facility operating framework, but urban bicycle infrastructure is not limited to physically separated bicycle-only facilities. Under the Act on the Promotion of Bicycle Use [
2], bicycle roads include bicycle-only roads, shared bicycle–pedestrian paths, bicycle lanes, and bicycle-priority roads. Domestic policy studies have similarly emphasized that PM safety depends not only on user-oriented rules but also on the compatibility of operating regulations, bicycle-road types, speed standards, and the travel space available to PM users [
3,
4]. In dense urban areas, a substantial portion of bicycle infrastructure consists of shared bicycle–pedestrian space or facilities located directly adjacent to pedestrian space. Consequently, allowing or requiring PM devices to use bicycle roads does not necessarily create continuous physical separation between PM users and pedestrians. This study could not directly test this mechanism because precise crash coordinates and geographic information on bicycle-facility type were unavailable. Nevertheless, changes in the relative share of PM–pedestrian crashes provide an important basis for considering possible mismatches between the regulatory framework and the spatial organization of PM travel.
Previous PM and e-scooter safety research can be broadly grouped into three streams. First, hospital- and emergency-department-based studies have examined injury characteristics, including head and facial injuries, alcohol involvement, helmet use, hospitalization, and other clinical outcomes [
5,
6,
7]. Second, studies using police-reported crash data have analyzed associations between crash severity or crash type and collision counterpart, road environment, time of day, rider characteristics, and intersection conditions [
8,
9]. Third, studies combining crash records with urban spatial data have examined spatial concentration, built-environment characteristics, bicycle and pedestrian facilities, street-network configuration, intersections, and commercial or entertainment activity [
10]. Recent international research has also applied random-parameter models, latent-class models, explainable machine learning, clustering methods, and Bayesian spatial models to address observed and unobserved heterogeneity in PM and e-scooter crashes [
8,
9,
10,
11].
Despite this growing literature, relatively few studies have examined long-term changes in PM crash composition around the strengthening of safety regulations in Korea using police-reported crash data. In particular, limited evidence is available on whether the relative shares of PM–pedestrian, severe-or-fatal, and late-night crashes changed after the amendment of 13 May 2021 or whether helmet-use and license-type records indicate corresponding behavioral changes. Simple before-and-after comparisons of absolute crash counts are insufficient because PM adoption, shared-service deployment, COVID-19-related travel disruption, seasonality, and other temporal processes evolved substantially during the study period. Moreover, extrapolating a steep early-adoption trend across the full post-regulation period may produce an implausible counterfactual and cannot distinguish a regulatory discontinuity from the natural deceleration or saturation of PM diffusion. Accordingly, the present study treats grouped crash-composition models as the primary analysis and monthly count trajectories as secondary, descriptive, and exploratory evidence.
This study examines changes in police-reported PM crash composition and monthly crash-count trajectories in Seoul around the strengthening of PM safety regulations on 13 May 2021. Three research questions are addressed. First, how did the relative shares of PM–pedestrian, PM–other-vehicle, PM single-vehicle, severe-or-fatal, and late-night crashes change after the regulation. Second, what temporal changes were observed in monthly PM crash counts, and to what extent were the results affected by extrapolation of the pre-regulation growth trend. Third, what do the available helmet-use and license-type records indicate regarding the behaviors directly targeted by the amendment.
This study makes four contributions. First, it reconstructs police-reported PM records from Seoul for 2017–2024 into crash-level data and evaluates long-term changes in crash composition. Second, it combines grouped crash-composition models with segmented count models while explicitly examining alternative study windows, residual autocorrelation, overdispersion, and the plausibility of the extrapolated counterfactual. Third, it directly evaluates the availability and pre/post distributions of helmet-use and license-type records. Fourth, it broadens the policy discussion from user-oriented regulation alone to pedestrian-conflict management, continuity and separation of PM travel space, and late-night single-vehicle crash prevention. Because exposure data on PM trips, travel distance, service coverage, and fleet size were unavailable, this study does not estimate changes in crash risk or the causal effect of the regulation.
2. Review and Differentiation of Previous Studies
2.1. International Trends in PM and E-Scooter Safety Research
Micromobility has expanded rapidly as a transport option for short-distance travel and first- and last-mile access to public transport. Among micromobility modes, e-scooters and other PM devices have been incorporated quickly into urban transport systems because of their accessibility, relatively low cost, and app-based rental systems. However, infrastructure provision, regulatory frameworks, and data-collection systems have often developed more slowly than PM diffusion. International studies have reported increases in emergency-department visits, head and facial injuries, alcohol involvement, low helmet use, and nighttime or weekend injury patterns following the expansion of e-scooter use [
5,
6,
7].
Early studies relied primarily on hospital and emergency-department records. The Austin Public Health and Centers for Disease Control and Prevention investigation of dockless e-scooter injuries reported frequent head injuries, traumatic brain injuries, alcohol involvement, and low helmet use [
5]. Trivedi et al. examined injuries associated with standing electric scooter use and emphasized risks related to head injuries, fractures, protective equipment, and riding environments [
6]. Namiri et al. used a national emergency-department sample in the United States and reported increases in e-scooter injuries and hospital admissions from 2014 to 2018 [
7]. These studies established that PM safety is influenced by rider behavior, protective equipment, travel space, and urban infrastructure. However, hospital-based data generally provide limited information on collision counterpart, road environment, intersection involvement, time of day, and changes in crash composition around policy interventions. Subsequent research has therefore expanded toward police-reported crash data, riding and telematics data, geographic information systems, and crowdsourced safety information.
2.2. E-Scooter Safety Regulations and Policy Evaluation
The literature most directly related to the present study includes before-and-after evaluations of e-scooter safety restrictions. Dibaj et al. examined e-scooter-related emergency injuries in Helsinki in 2021 and 2022 after the introduction of shared e-scooter restrictions, including weekend nighttime bans from 00:00 to 05:00, time-dependent speed limits, and beginner-mode restrictions [
12]. Using ordered logit, temporal, and spatial analyses, the study reported reductions in injury counts after the restrictions, whereas changes in injury severity were limited. These findings indicate that policy interventions may affect crash or injury occurrence and injury severity differently and that observed outcomes may depend on the type of restriction, local infrastructure, and operating environment. The Korean amendments implemented on 13 May 2021 differed from the Helsinki restrictions. Rather than directly limiting operating hours or imposing platform-level speed restrictions, the Korean amendments focused primarily on user-oriented requirements, including driver licensing, helmet use, passenger-riding restrictions, and penalties for unlicensed riding. Accordingly, the present study examines not only changes in reported crash counts and composition but also the availability and pre/post distributions of helmet-use and license-type records. This distinction is important because behavioral compliance cannot be inferred reliably from aggregate crash counts alone.
2.3. Crash Severity and Crash Composition Modeling
International studies using police-reported e-scooter crash data have increasingly examined heterogeneity in crash severity and crash patterns. Gao and Zhang distinguished single-vehicle and two-vehicle e-scooter crashes in the UK STATS19 database and applied random-parameter logit models with heterogeneity in means and variances [
8]. Their findings showed that nighttime conditions, weekdays, rider age and sex, roadway characteristics, intersection conditions, speed limits, and counterpart vehicles were associated with injury severity, with effects varying across crash types. Agheli et al. compared explainable machine learning based on XGBoost and SHAP with random-parameter logit models using UK e-scooter crash data [
9]. Their results identified associations between injury severity and rider age, nighttime lighting conditions, and junction type and demonstrated the complementary value of machine-learning-based importance measures and conventional statistical models. Fountas et al. separated single-vehicle and multiple-vehicle e-scooter crashes and applied latent-class binary logit models, showing that the direction and magnitude of risk factors may vary across unobserved crash classes [
11].
These studies indicate that PM crashes do not follow a single risk mechanism. Their characteristics differ according to crash type, collision counterpart, time of day, rider characteristics, and road environment. The present study does not primarily estimate determinants of individual crash severity. Instead, it examines changes in the relative shares of PM–pedestrian, PM–other-vehicle, PM single-vehicle, severe-or-fatal, and late-night crashes among all reported PM crashes. Grouped crash-composition models are treated as the primary analysis, while monthly count models are retained as secondary, descriptive, and exploratory evidence.
2.4. Built Environment, Road Network, and Spatial Risk Studies
Abdi and O’Hern combined UK e-scooter crash records with OpenStreetMap-based built-environment variables and used K-means++ clustering to identify crash-location typologies, followed by cluster-specific random-parameter binary logit models [
10]. The identified typologies included car-oriented mixed-use areas, commercial and industrial areas, intersection-dense areas, and residential and central areas. The effects of collision counterpart, speed limit, rider age, and time of day varied across these environments. Sohaee et al. developed a Bayesian hierarchical spatial model for e-scooter collision risk in urban Texas using crash data from 2018 to 2024 [
13]. Their model combined a severity-weighted crash-risk index with land-use, transport, demographic, socioeconomic, entertainment, car-free-household, and intersection-density variables and incorporated spatial and metropolitan-level random effects. Jiao et al. analyzed e-scooter incident patterns from a street-network perspective using incident, usage, land-use, traffic-crash, and street-network data from Travis County, Texas [
14]. Their findings indicated that e-scooter incidents exhibited spatial patterns distinct from general traffic crashes and were associated with downtown and university areas, proximity to traffic signals, and primary roads. Zhao et al. applied a Bayesian spatial field model to e-scooter rider injury severity in England using crashes involving e-scooters and motor vehicles from 2020 to 2023 [
15]. Their results identified associations between severe or fatal injury and rider characteristics, darkness, higher speed limits, heavy vehicles, nighttime or early-morning occurrence, skidding or overturning, frontal impacts, and spatially structured unobserved heterogeneity. The present study does not apply spatial models because precise crash coordinates and geographic information on bicycle-facility type were unavailable. Nevertheless, international evidence indicates that PM crash patterns are sensitive to the spatial organization of transport facilities and the surrounding built environment. The observed change in PM–pedestrian crash composition in Seoul should therefore be interpreted in the context of Korea’s bicycle-facility operating framework and the continued coexistence of PM users and pedestrians in shared or adjacent travel spaces.
2.5. Riding Data, Naturalistic Data, and Crowdsourced Safety Information
Recent PM safety research increasingly uses mobile sensing, naturalistic riding, telematics, and crowdsourced data to measure exposure, riding behavior, near-misses, and actual travel-space use that cannot be observed from police-reported crash records alone. Ma et al. [
16] used mobile sensing data to assess e-scooter riding risk by capturing speed, acceleration, vibration, roadway-surface conditions, and surrounding environmental characteristics. Their findings demonstrated that sensor-based riding data can identify hazardous riding conditions and localized risk factors that are not available in conventional crash databases. White et al. [
17] conducted a naturalistic e-scooter riding study using instrumented vehicles and rider-level observations to identify behavioral, infrastructural, and environmental factors contributing to crashes and safety-critical events. The study showed that naturalistic data can capture actual rider behavior, interactions with surrounding road users, surface transitions, and other pre-crash conditions that are difficult to reconstruct from police or hospital records alone.
These emerging data sources can capture indicators such as rapid acceleration, hard braking, footpath riding, evasive maneuvers, surface vibration, transitions between facility types, and repeated use of hazardous locations. They can also support direct measurement of trip volume, distance traveled, service coverage, and behavioral compliance. Because private platform data, trip records, naturalistic riding data, and near-miss information were unavailable, these factors could not be incorporated into the present analysis. The study instead uses reconstructed police-reported crash records to examine long-term changes in crash composition and monthly crash-count trajectories. Riding and exposure data remain priorities for future research because they are necessary for estimating crash risk and distinguishing regulatory effects from changes in PM diffusion and use.
2.6. Synthesis of Previous Studies and Contribution of the Present Study
International PM and e-scooter safety research has progressed from hospital-based injury description to police-reported crash modeling, built-environment integration, spatial analysis, naturalistic riding analysis, and policy evaluation. In Korea, previous studies have examined PM-related institutional and operational conditions, major safety concerns, and policy directions [
3,
4,
18]. Other domestic studies have analyzed PM crash characteristics and fatality factors, PM–pedestrian crash severity, neighborhood environmental correlates, and injury-severity factors [
19,
20,
21,
22]. Three research gaps remain. First, limited evidence is available on changes in crash composition after strengthened user-oriented regulations. Second, previous studies have often focused on individual crash severity, while changes in the relative shares of major crash types also matter for policy. Third, the Korean context requires attention to travel space because PM devices operate within a bicycle-facility framework that includes shared or adjacent pedestrian space. Accordingly, this study treats grouped crash-composition models as the primary analysis and retains segmented count models as secondary, descriptive, and exploratory analyses. Because exposure and diffusion data were unavailable, the analysis does not estimate crash risk or a causal regulatory effect.
3. Materials and Methods
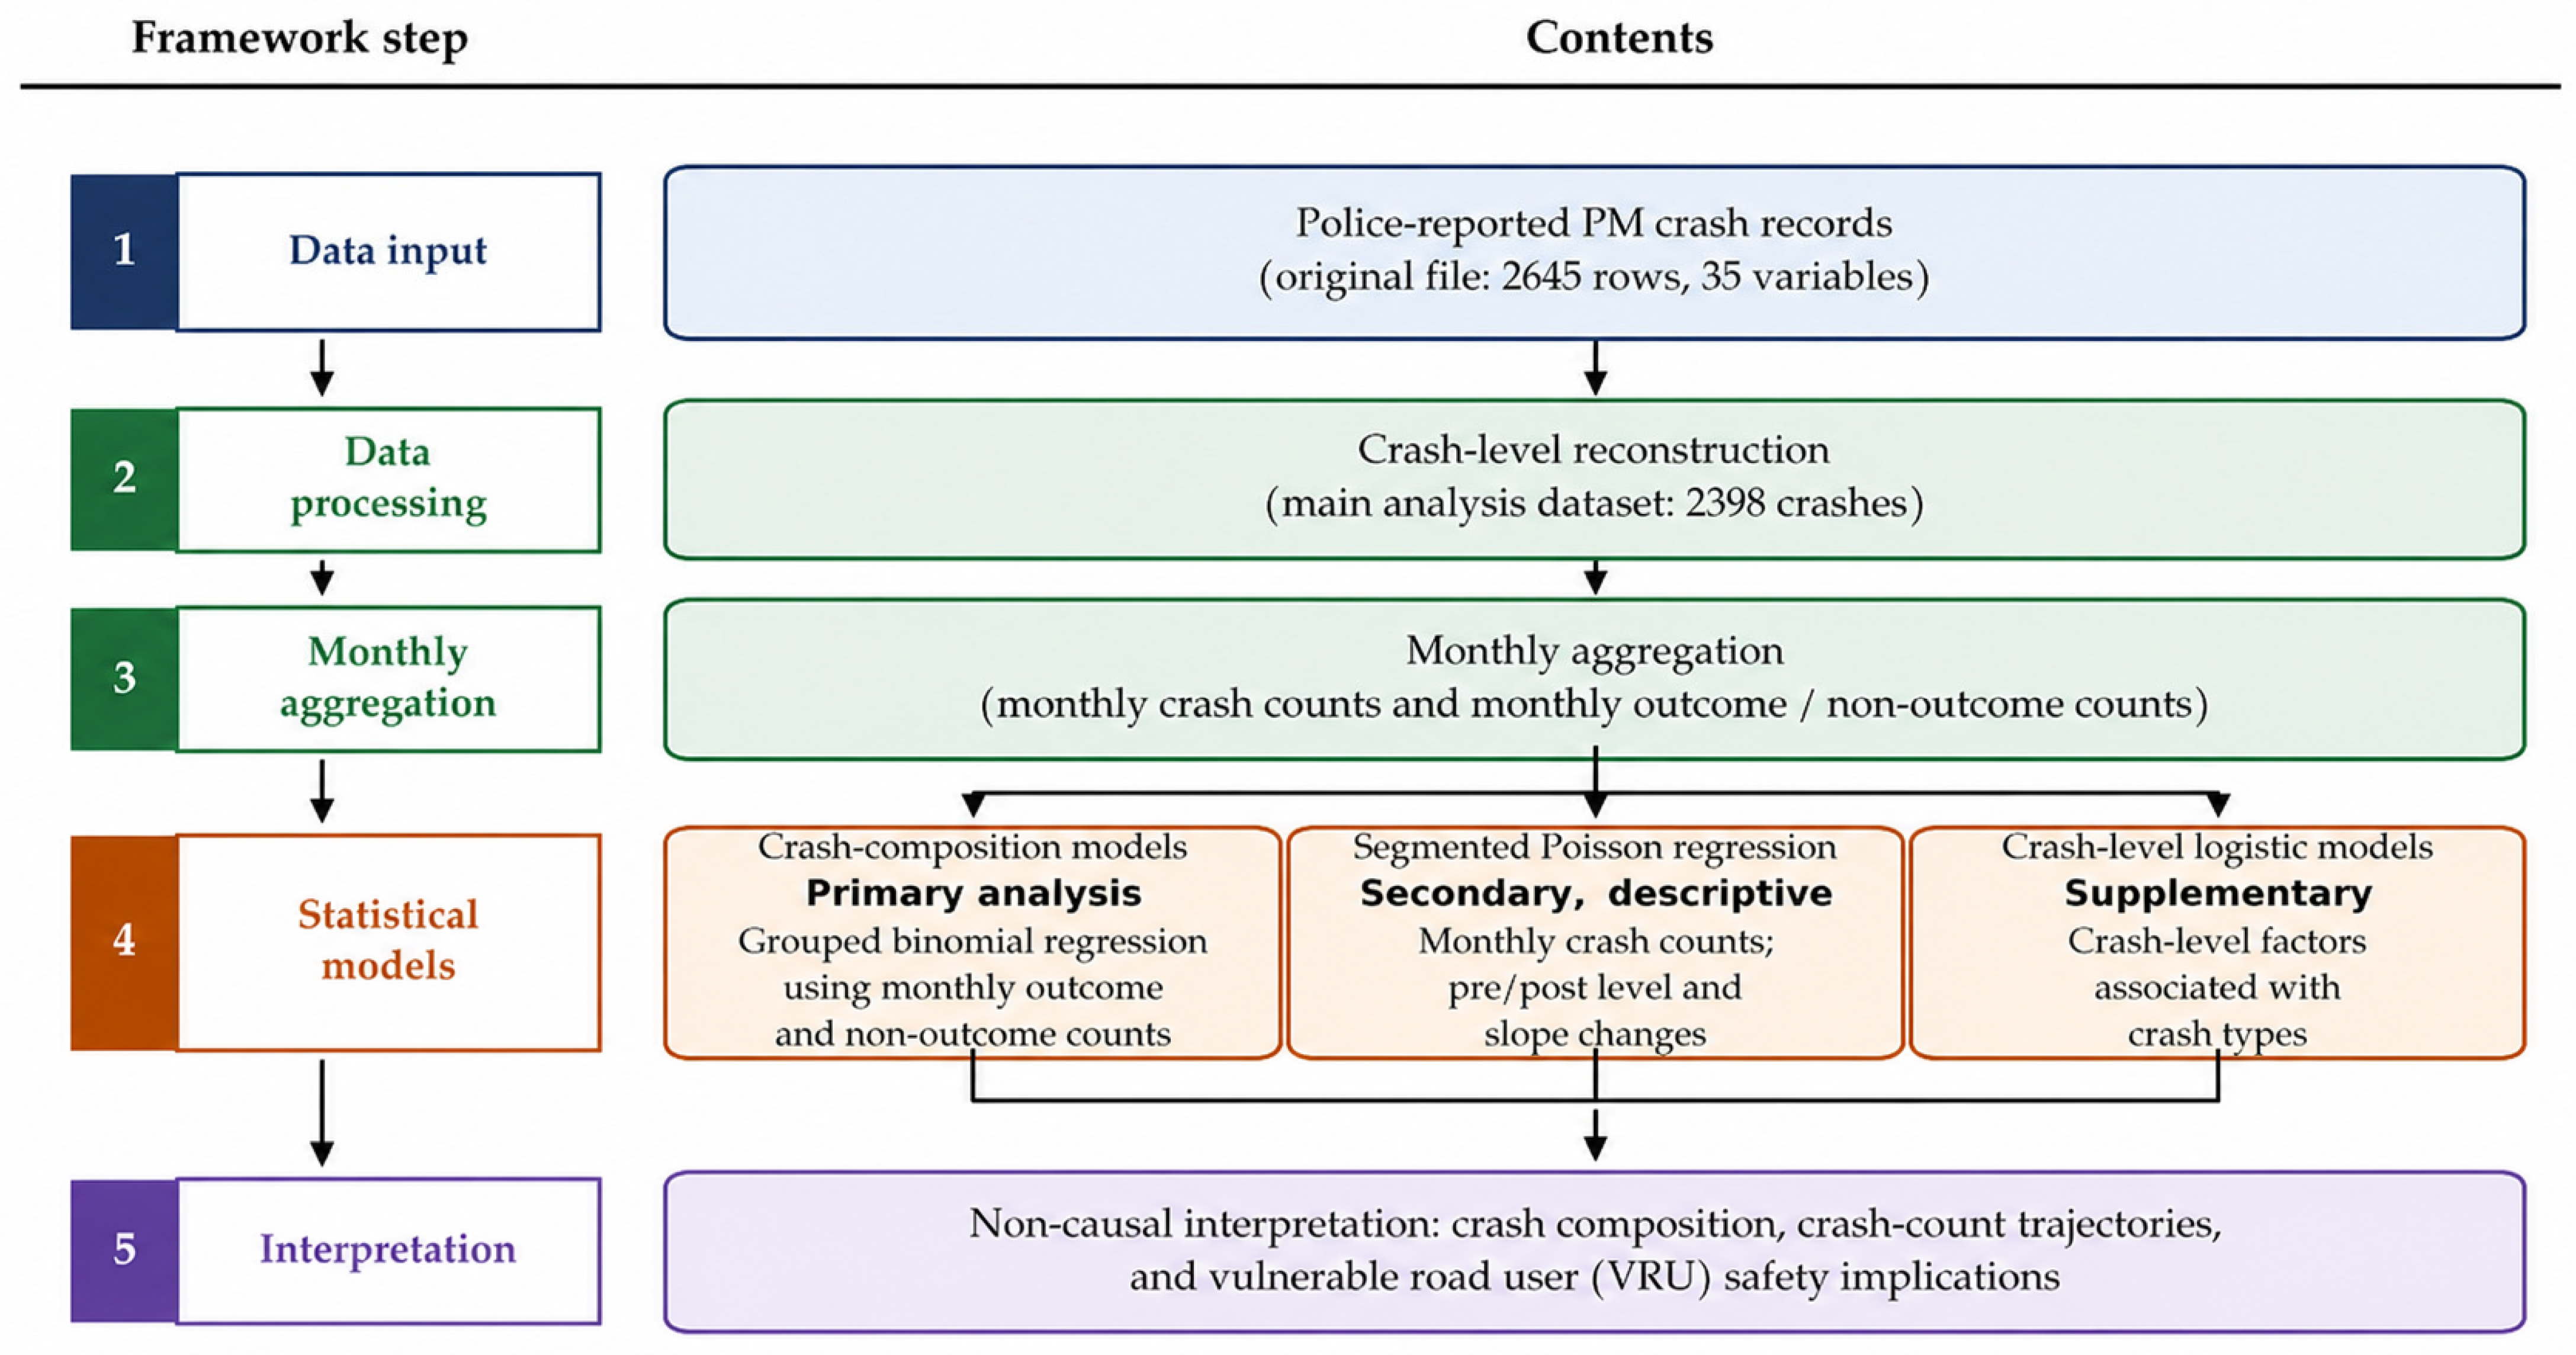
Figure 1 summarizes the analytical framework of this study, beginning with the reconstruction of police-reported PM crash records into crash-level data and monthly aggregates. Grouped crash-composition models constitute the primary analysis, segmented Poisson models are used as secondary, descriptive, and exploratory analyses of monthly crash-count trajectories, and crash-level logistic models are presented as supplementary analyses. The results are interpreted in relation to PM crash composition, temporal crash patterns, vulnerable road user safety, and the limitations of the available exposure and behavioral data.
3.1. Study Area and Policy Context
This study examines police-reported personal mobility (PM) crashes that occurred in Seoul between 2017 and 2024. The study period includes the December 2020 regulatory changes and the strengthening of PM safety regulations that took effect on 13 May 2021, which is the principal policy date examined in this study.
Seoul is a high-density metropolitan area with extensive subway and bus networks, widespread shared-bicycle and shared-PM services, and an urban transport environment in which walking, cycling, and PM use frequently occur within shared or adjacent street spaces. These characteristics make Seoul a policy-relevant setting for examining changes in PM crash composition and monthly crash-count trajectories around regulatory strengthening, particularly in relation to pedestrian conflicts and mixed-traffic environments. However, the findings may not be directly generalizable to lower-density cities, areas with lower PM use, or jurisdictions with different infrastructure and regulatory conditions.
3.2. Data Source and Original Data Structure
The dataset consists of police-reported PM traffic crash records from Seoul for 2017–2024. The original file contained 2645 rows and 35 variables. The principal variables included crash date, crash time, crash location, district, crash type, road configuration, numbers of fatalities and injured persons by severity, helmet use, and license type. The restricted individual crash records cannot be made publicly available. To support transparency and reproducibility, this study reports the data-reconstruction procedure, variable definitions, aggregated descriptive statistics, model specifications, and analytical results. The Data Availability Statement describes the restrictions on public sharing of the original police-reported records. The dataset was provided for research use under a data-sharing agreement with the Seoul Metropolitan Police Agency and contained no personally identifiable information.
3.3. Reconstruction of Crash-Level Records
The original dataset contained repeated rows for some crashes because information on multiple casualties or participants was recorded in separate records. Although each original row had a unique serial number, potential duplicate crash records were identified using combinations of crash date, crash time, crash location, detailed crash location, district, and crash type. Crash-level reconstruction was therefore conducted before monthly aggregation and supplementary crash-level modeling. The main analysis dataset was constructed by merging records with the same values for the following identifiers:
crash date;
crash time;
crash location;
detailed crash location;
district;
crash type.
Table 1 summarizes the reconstruction procedure and the datasets used in the analysis. Application of the primary merging criteria reduced the dataset from 2645 original rows to 2398 reconstructed crash events. Multiple casualty rows belonging to one crash repeated crash-level fatality and injury totals; these totals were therefore retained using the within-crash maximum rather than summed. This correction yielded 13 fatalities, 576 serious injuries, 1571 minor injuries, and 483 possible injuries, while leaving all crash-count outcomes used in the models unchanged. A more conservative reconstruction procedure produced 2625 crash events and was used for sensitivity analysis.
Table 1 also reports the numbers of PM–pedestrian, severe-or-fatal, and fatal crashes under each reconstruction criterion.
A more conservative sensitivity dataset was also constructed using additional road-user characteristics to assess potential over-aggregation. Crash-level reconstruction was necessary because use of the original row-level data could count crashes involving multiple casualties more than once, thereby distorting monthly crash counts and crash-type proportions. Accordingly, the monthly aggregation and supplementary crash-level models were based on the reconstructed crash-level dataset.
3.4. Outcome Definitions
This study used two types of outcome variables. The following count variables were modeled with segmented Poisson regression as a secondary, exploratory analysis (
Section 3.6):
total PM crashes;
PM-pedestrian crashes;
PM–other-vehicle crashes;
PM single-vehicle crashes;
severe-or-fatal PM crashes;
late-night PM crashes.
The following monthly composition outcomes were analyzed using grouped binomial regression as the primary analysis (
Section 3.7):
whether a crash was a PM-pedestrian crash among all PM crashes;
whether a crash was severe or fatal among all PM crashes;
whether a crash occurred late at night among all PM crashes.
PM–pedestrian crashes were defined as PM crashes classified as vehicle-to-pedestrian crashes. PM–other-vehicle crashes were defined as PM crashes classified as vehicle-to-vehicle crashes. Depending on the vehicle classification in the original data, this category may include counterpart road users other than conventional motor vehicles, such as bicycles. It should therefore be interpreted as a non-pedestrian counterpart category rather than as a motor-vehicle-only category. Severe-or-fatal crashes were defined as crashes involving at least one fatality or serious injury. Late-night crashes were defined as crashes occurring from 00:00 to 05:59. The broader night_period variable was defined as crashes occurring from 20:00 to 05:59. Both variables were based solely on clock time and did not incorporate seasonal sunrise or sunset information.
Table 2 summarizes the coding, category levels, and operational definitions of the variables used in the monthly and crash-level analyses.
3.5. Policy Timing Variables
The policy intervention point was defined as 13 May 2021. In the supplementary crash-level models, crashes occurring on or after this date were coded as post-regulation crashes. For the monthly analyses, May 2021 was treated as a transition month because it could not be classified entirely as either pre- or post-regulation. The transition month was excluded from the main segmented models and retained with a separate indicator in the sensitivity analysis. The monthly models included a continuous time trend, a post-regulation level-change indicator, a post-regulation slope-change variable, and month-of-year fixed effects to account for seasonality.
3.6. Monthly Segmented Poisson Regression Models (Secondary, Descriptive, and Exploratory Analysis)
Segmented Poisson regression models were estimated for the monthly crash-count outcomes using the same specification as in the original analysis:
where
denotes the monthly crash count,
is the continuous time trend over the study period,
is the post-regulation level-change indicator,
is the post-regulation slope-change variable, and
represents month-of-year fixed effects. The coefficient
represents the level change in monthly crash counts after the regulation, conditional on the pre-regulation time trend and seasonality. The coefficient
represents the change in the post-regulation monthly slope. The model coefficients were reported as incidence rate ratios (IRRs). HC3 robust standard errors were used in the principal Poisson specification and all alternative start-date specifications. Potential overdispersion was assessed using Pearson dispersion statistics and by comparing Poisson and negative binomial models based on the Akaike information criterion (AIC). Pearson dispersion values of 1.36 for total PM crashes and 1.52 for late-night crashes indicated modest overdispersion, while the negative binomial models improved AIC by only approximately 0.4–2.0 points. These differences were not treated as decisive evidence that either model family was uniquely preferable. The Poisson specification was retained for continuity with the original analysis, while the negative binomial models were treated as alternative model-family checks. The segmented count models describe changes in police-reported crash-count trajectories and do not estimate crash risk because exposure data on PM trips, travel distance, service coverage, and fleet size were unavailable. The pre-regulation period also coincided with the rapid early diffusion of PM devices in Seoul. Consequently, the estimated pre-regulation growth trend may not represent a stable long-term counterfactual. Extrapolating this log-linear trend over the full post-regulation period yields implausibly large counterfactual estimates within two to three years. The model therefore cannot distinguish a regulatory discontinuity from the natural deceleration or saturation of PM diffusion or from other concurrent temporal changes. For these reasons, the segmented count models are treated as secondary, descriptive, and exploratory analyses rather than as estimates of a causal regulatory effect.
3.7. Monthly Crash-Composition Models (Primary Analysis)
Grouped binomial regression models were estimated to examine changes in the relative composition of reported PM crashes. The three outcomes were:
the share of PM-pedestrian crashes among all PM crashes;
the share of severe-or-fatal crashes among all PM crashes;
the share of late-night crashes among all PM crashes.
For each month, the model was fitted directly as a grouped-binomial generalized linear model with a logit link using cbind (monthly outcome count, monthly non-outcome count). The monthly total was thus entered as the number of binomial trials, so months with larger crash totals contributed proportionally more information than months with sparse denominators. The models included the continuous time trend, post-regulation level-change indicator, post-regulation slope-change variable, and month-of-year fixed effects. Odds ratios and conventional grouped-binomial 95% confidence intervals are reported. A month-level HC3 covariance estimate was also examined as a conservative sensitivity check. These models estimate changes in crash composition conditional on a reported PM crash and do not estimate crash occurrence risk. They remain observational and may be affected by time-varying changes in PM use, user characteristics, infrastructure, enforcement, and reporting.
3.8. Crash-Level Supplementary Logistic Regression Models
Supplementary crash-level logistic regression models were estimated for three outcomes: whether the crash was a PM–pedestrian crash, whether the crash was severe or fatal, and whether the crash occurred late at night. Depending on the outcome specification, the explanatory variables included the continuous time trend, post-regulation indicator, transition-month indicator, late-night indicator, weekend indicator, crash type, and intersection-related indicator. Cluster-robust standard errors were calculated using the 25 autonomous districts of Seoul as clustering units to account for shared traffic and pedestrian environments within districts. These models are conditional on the occurrence and reporting of a PM crash and therefore do not estimate crash occurrence risk. They are presented as supplementary analyses in
Appendix A and are not used as the principal basis for the study’s conclusions.
3.9. Sensitivity Analyses
Five groups of sensitivity analyses were conducted. First, May 2021 was excluded from the principal monthly models and then retained with a separate transition-month indicator. Second, the models were estimated with and without a COVID-19-period control. Third, the segmented count models were re-estimated using study windows beginning in March 2017, January 2018, and January 2019. January 2019 was selected as the most restrictive alternative because it excludes the sparse 2017–2018 observations while retaining approximately 28 months of pre-regulation data; a January 2020 start would leave only about 16 pre-regulation observations and insufficient information for stable trend and seasonal estimation. Fourth, residual autocorrelation was assessed with Ljung–Box tests at lags of 1, 2, 3, 6, 12, 18, and 24 months, and count models were re-estimated with Newey–West standard errors using a maximum lag of six months. Fifth, all three grouped-binomial composition models were re-estimated from January 2019, with both conventional grouped-binomial inference and a conservative month-level HC3 covariance check.
3.10. Descriptive Check of Regulation-Targeted Behavioral Variables
Because the 2021 amendment directly targeted helmet use and driver licensing, the availability and pre/post distributions of these variables were examined separately in the crash-level dataset. Helmet use was compared using a chi-square test among crashes with known helmet-use status. License type was summarized descriptively because it was not recorded during the pre-regulation period.
Neither variable was included as a primary model covariate. Helmet-use status contained substantial and differential missingness across the two periods, while license type was completely unavailable before the regulation. These analyses are therefore presented as descriptive assessments in
Section 4.8 rather than as causal evaluations of behavioral compliance.
4. Results
4.1. Crash-Level Dataset Construction
Reconstruction of the original 2645 records produced a principal crash-level dataset containing 2398 PM crashes. Of these, 1141 were PM–pedestrian crashes, 1138 were PM–other-vehicle crashes, and 119 were PM single-vehicle crashes. A total of 574 crashes were classified as severe or fatal, including 12 fatal crashes. Using 13 May 2021 as the regulatory intervention date, 748 crashes occurred during the pre-regulation period and 1650 during the post-regulation period. These raw counts should not be interpreted as evidence of a regulatory effect because the post-regulation period was longer and PM use, service availability, travel behavior, and the broader operating environment continued to change over time. The reconstructed dataset nevertheless provides the basis for the subsequent analyses of crash composition and monthly crash-count trajectories.
4.2. Descriptive Comparison of Crash Composition Before and After the Regulation
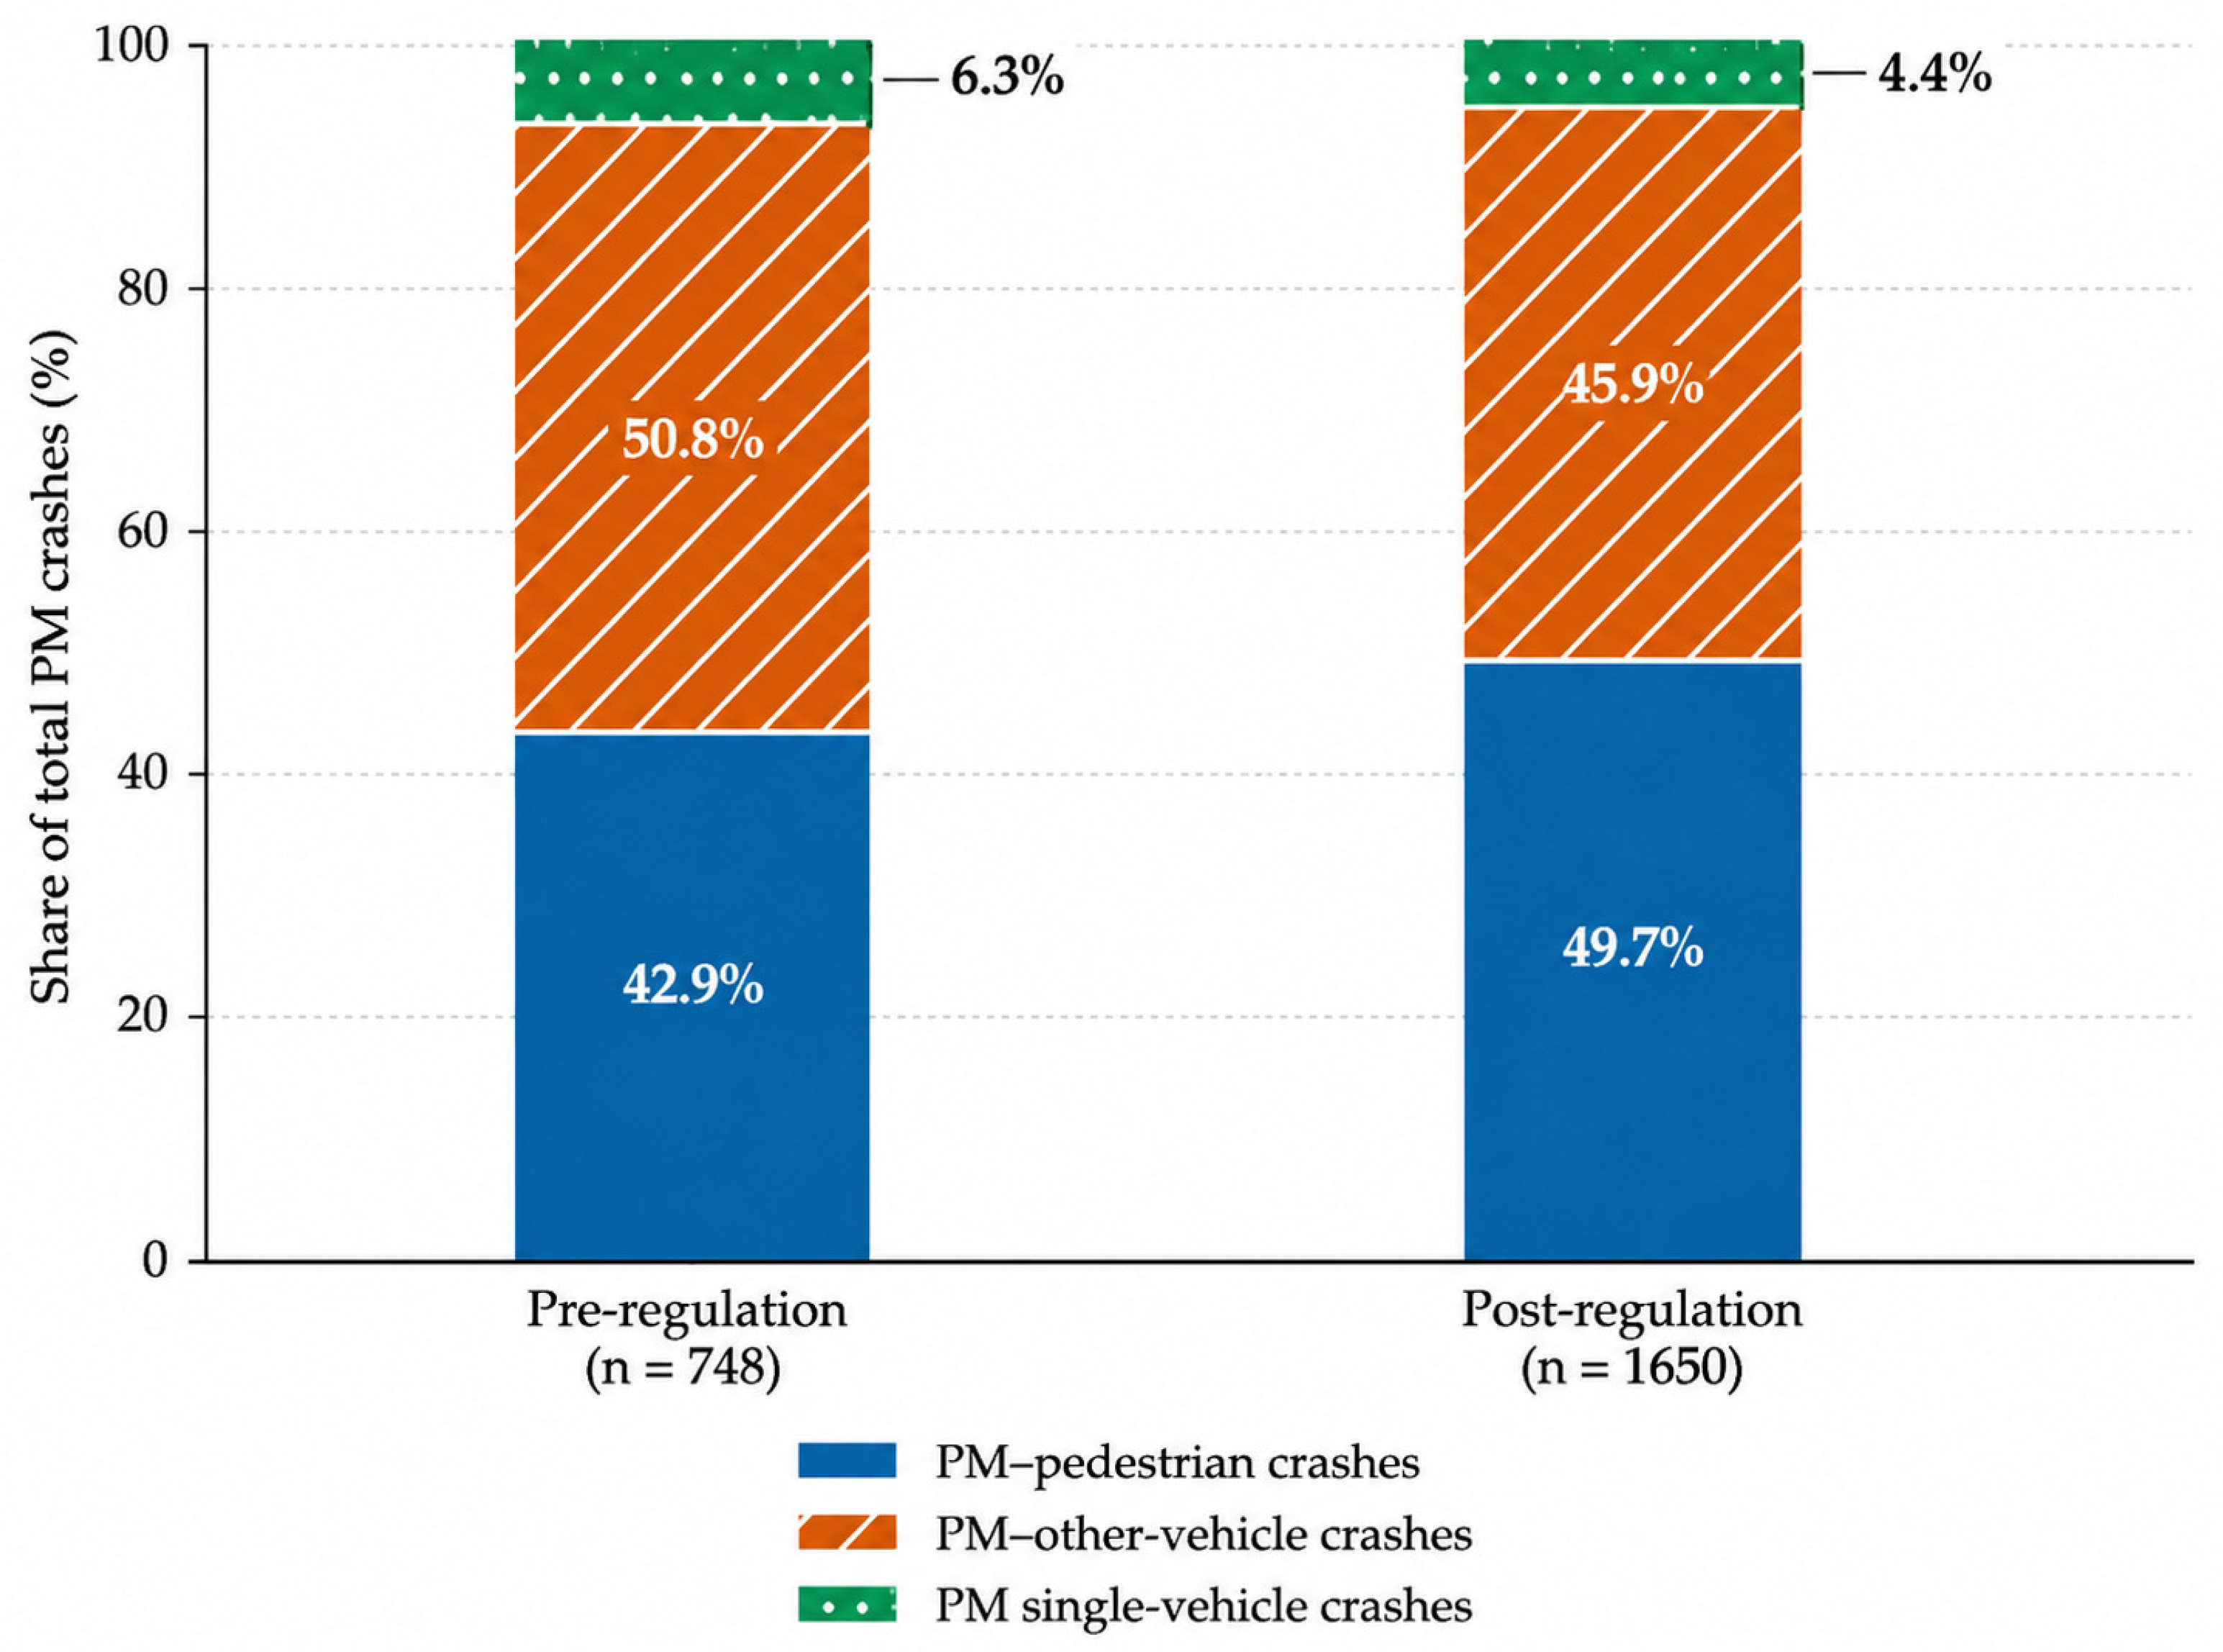
The number of reported PM crashes increased from 748 before the regulation to 1650 after the regulation. PM–pedestrian crashes increased from 321 to 820, PM–other-vehicle crashes from 380 to 758, and PM single-vehicle crashes from 47 to 72. Severe-or-fatal crashes increased from 177 to 397, while late-night crashes increased from 84 to 196. In proportional terms, the share of PM–pedestrian crashes increased from 42.9% to 49.7%, whereas the share of PM–other-vehicle crashes decreased from 50.8% to 45.9%. The proportion of PM single-vehicle crashes decreased from 6.3% to 4.4%. Severe-or-fatal crashes accounted for 23.7% of pre-regulation crashes and 24.1% of post-regulation crashes, while the late-night share increased slightly from 11.2% to 11.9%.
Table 3 summarizes the distribution of the principal crash characteristics in the pre- and post-regulation periods. These descriptive comparisons indicate that the post-regulation changes were not uniform across crash categories. However, they do not account for temporal trends, seasonality, differences in period length, changes in PM exposure, or other concurrent factors and should therefore not be interpreted as causal effects.
In terms of crash composition, the share of PM–pedestrian crashes increased from 42.9% before the regulation to 49.7% after the regulation, whereas the share of PM–other-vehicle crashes decreased from 50.8% to 45.9%. The share of severe-or-fatal crashes changed only marginally, from 23.7% to 24.1%. These descriptive results indicate that the internal composition of reported PM crashes shifted toward a greater relative prominence of PM–pedestrian crashes during the post-regulation period. However, this pattern should not be interpreted as a causal effect of the regulation because the comparison does not account for changes in PM exposure, user composition, infrastructure, enforcement, or other concurrent temporal factors. The finding nevertheless suggests that PM safety policy should extend beyond user compliance and protective-equipment requirements to include pedestrian-conflict management and the spatial and operational conditions under which PM users and pedestrians interact.
4.3. Monthly Crash Count Trends
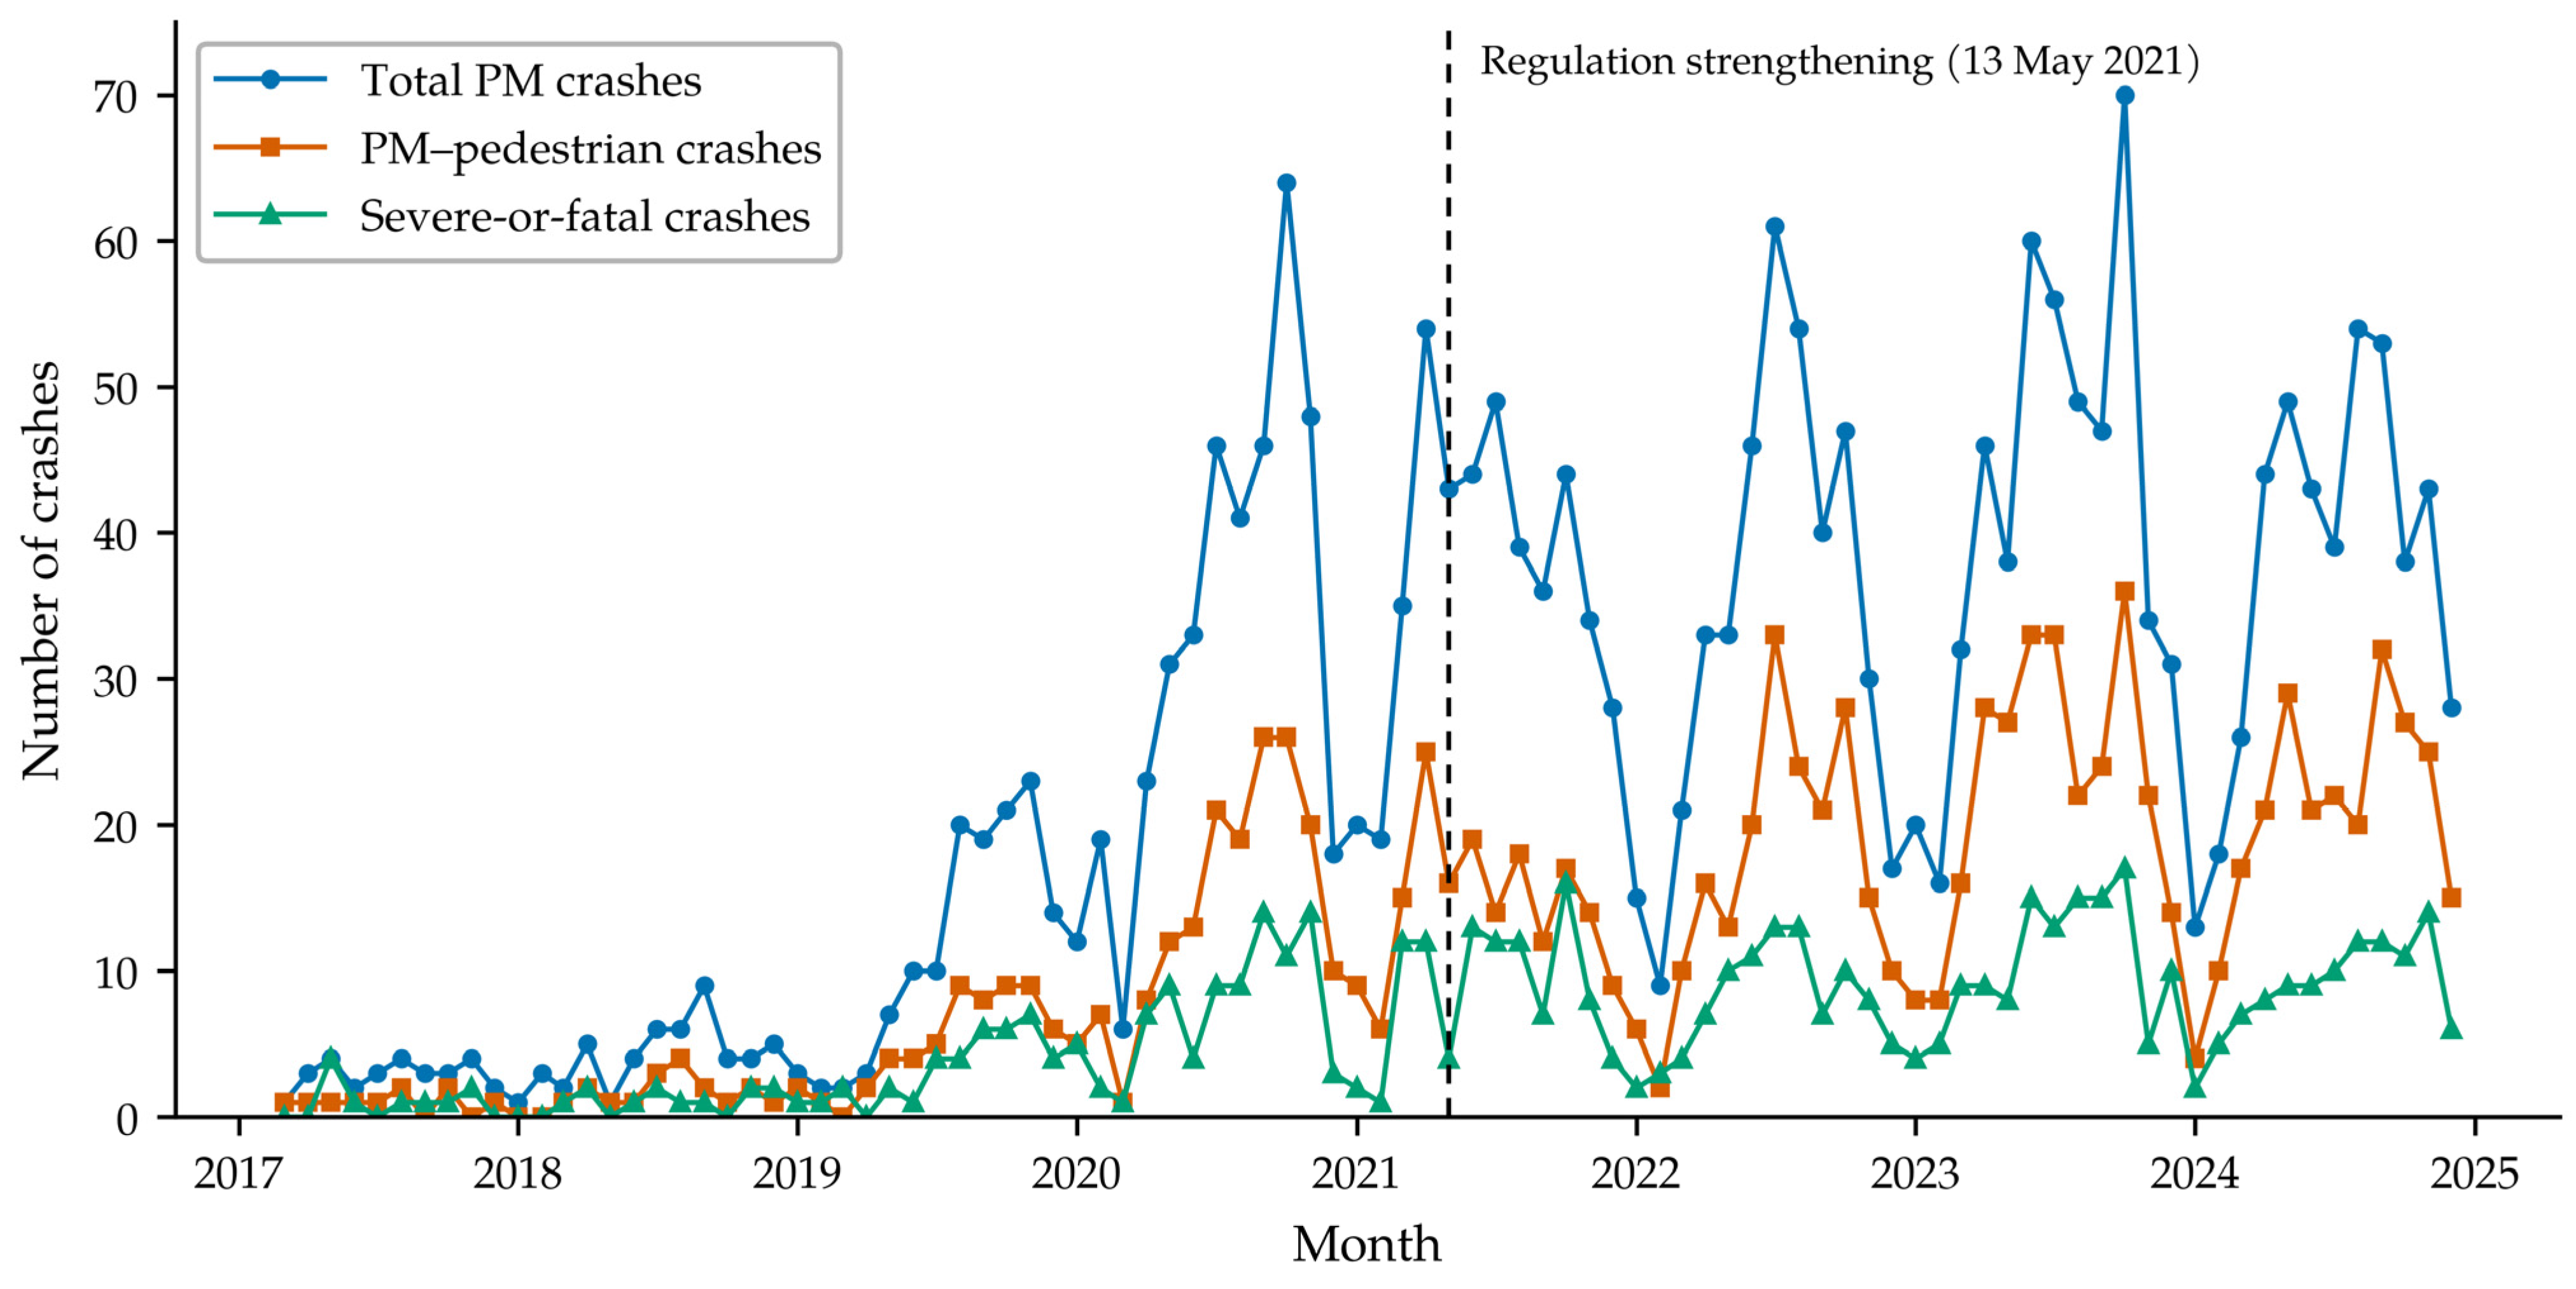
Figure 2 presents the monthly trajectories of total PM crashes, PM–pedestrian crashes, and severe-or-fatal crashes from 2017 to 2024. Reported crash counts were initially low but increased sharply during the early diffusion of PM devices, with substantial month-to-month variation and recurring seasonal fluctuations. After the regulatory strengthening of 13 May 2021, monthly counts continued to fluctuate at comparatively high levels, and no simple visual discontinuity can be separated from the preceding growth pattern and subsequent temporal variation. The figure therefore provides descriptive context for the segmented count models rather than direct evidence of a regulatory effect.
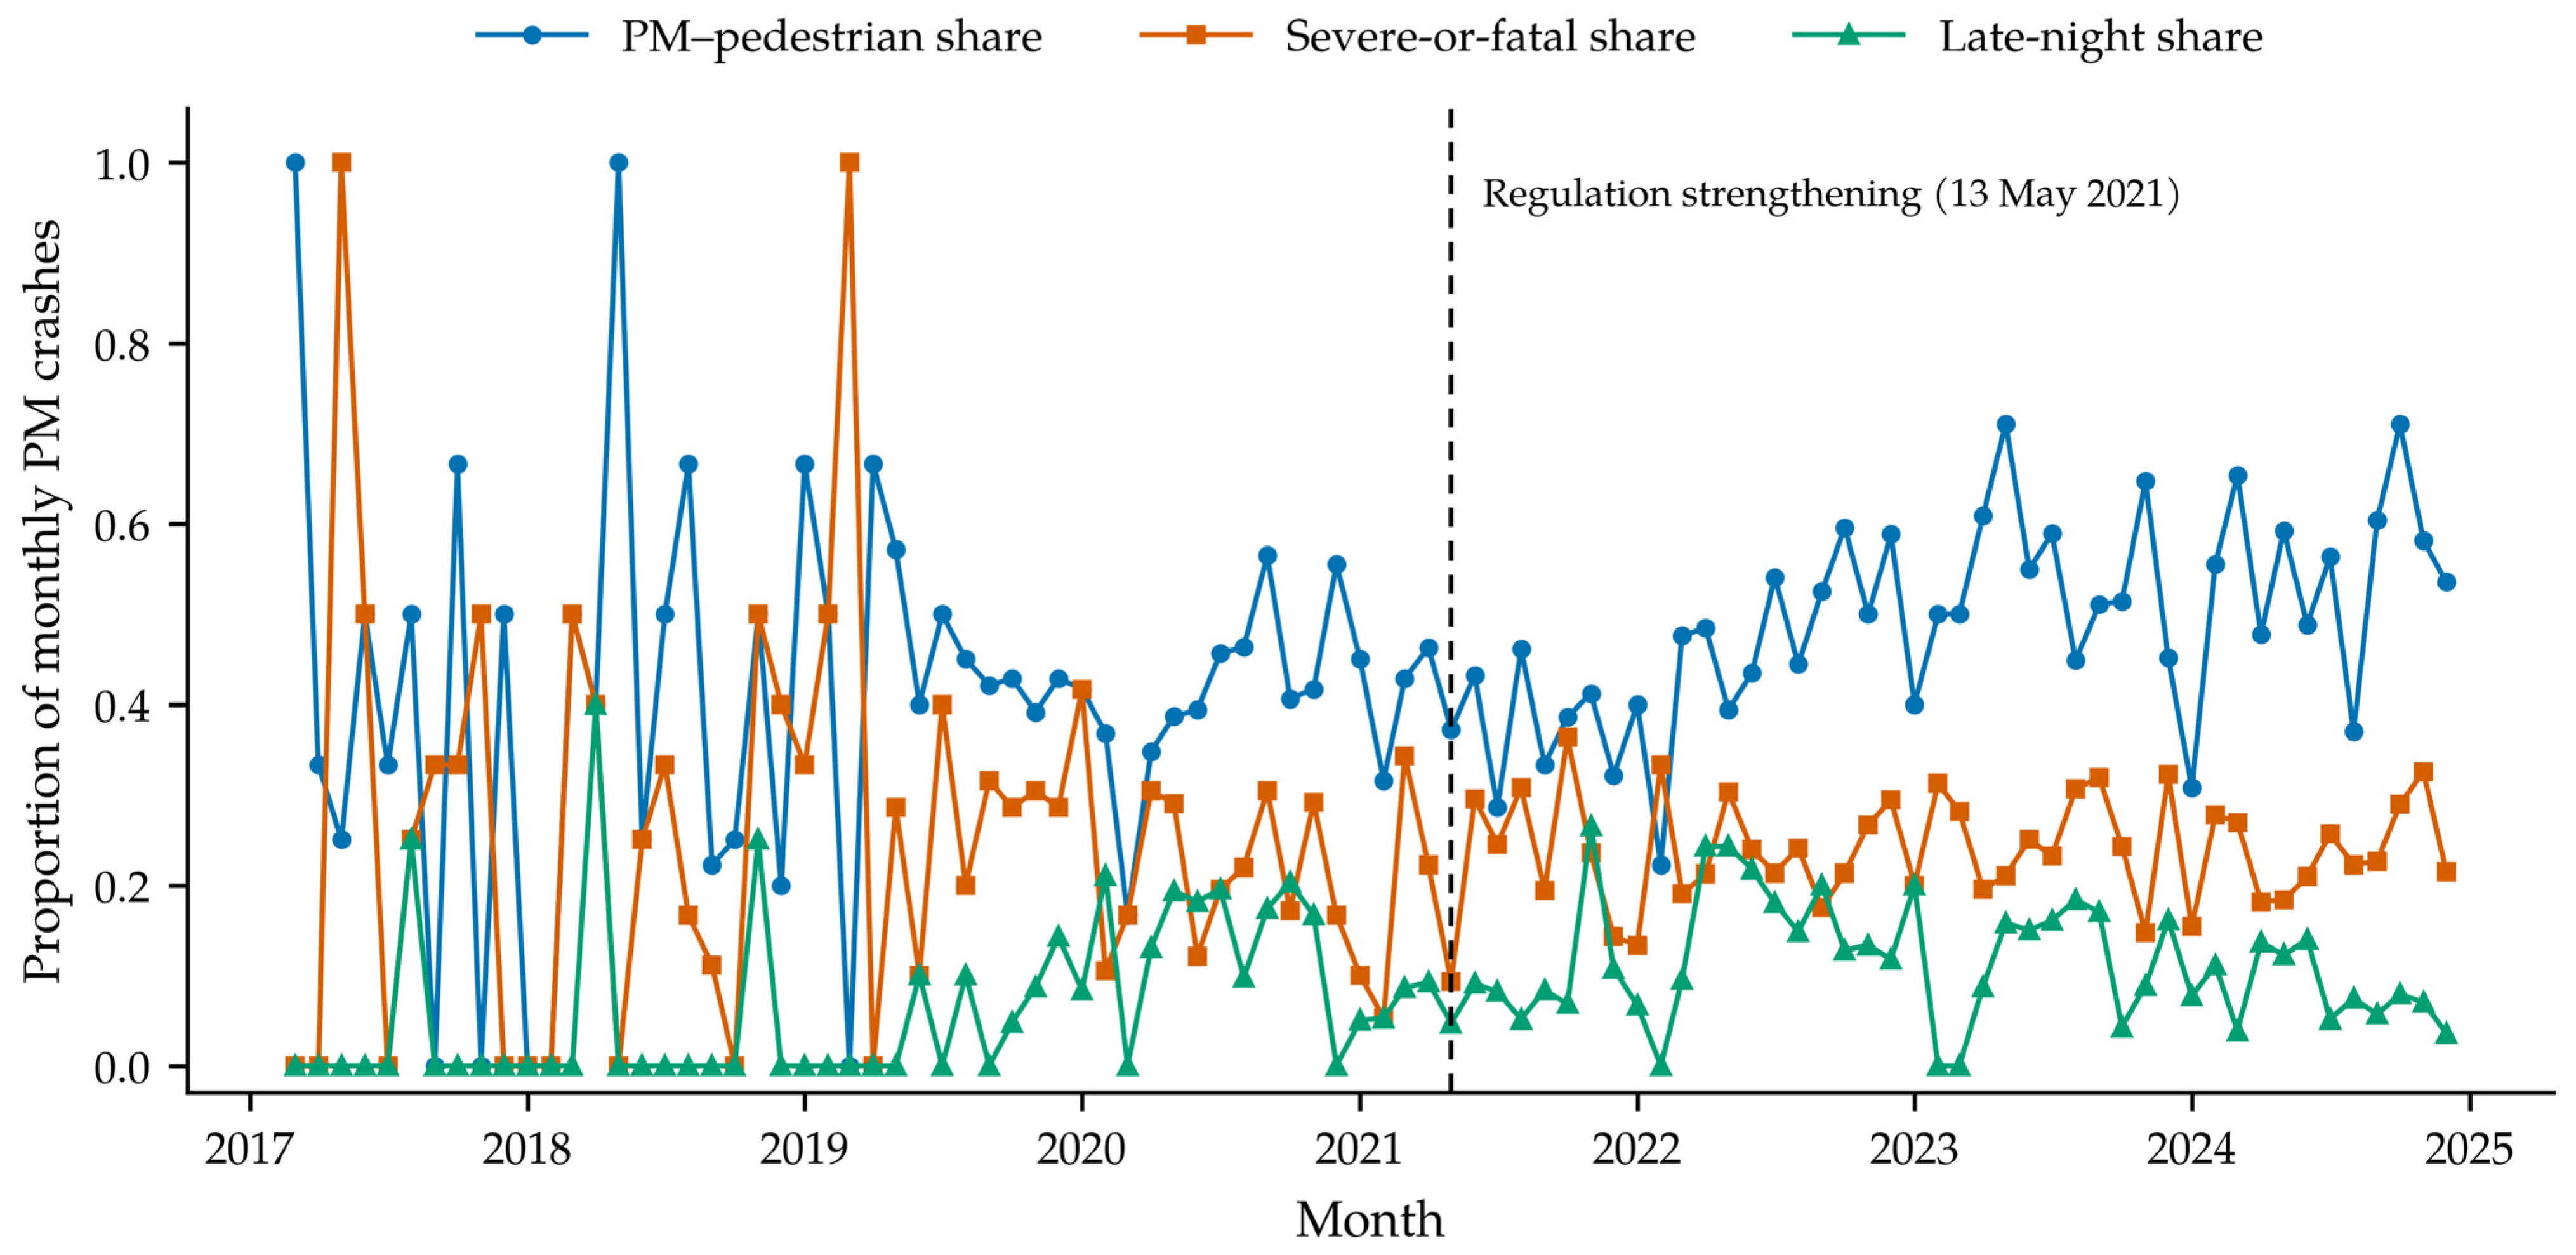
Figure 3 presents the observed monthly composition of reported PM crashes. The PM–pedestrian, severe-or-fatal, and late-night proportions fluctuated substantially during the early study period because several months contained very few crashes. As monthly crash totals increased, the proportions became more stable. The PM–pedestrian share generally became more prominent during the later study period, whereas the severe-or-fatal and late-night shares followed different temporal patterns. These descriptive trajectories indicate that changes in total crash counts were accompanied by changes in the internal composition of reported PM crashes.
Figure 4 compares the descriptive distribution of crash types before and after the regulatory strengthening. These figures provide context for the grouped crash-composition models but do not establish a causal regulatory effect. The formal models therefore evaluated post-regulation level and slope changes while controlling for the underlying time trend and calendar-month seasonality.
Monthly PM crash counts generally increased over the study period, particularly during the rapid expansion of shared PM services. PM–pedestrian crashes followed a similar upward pattern, and their relative share among all reported PM crashes became greater during the later study period. Severe-or-fatal and late-night crash counts also increased in absolute terms, although their proportional trajectories differed from that of PM–pedestrian crashes. These temporal patterns may reflect seasonality, weather, PM diffusion, changes in service coverage and travel behavior, pandemic-related disruption, enforcement, and other concurrent factors. The graphical trends therefore provide descriptive context but cannot identify a regulatory effect. They should be interpreted together with the grouped crash-composition models and the limitations of the segmented count analysis.
4.4. Monthly Segmented Poisson Regression Results (Secondary, Descriptive, and Exploratory Results)
The segmented Poisson regression results are presented in
Table 4. For total PM crashes, the estimated post-regulation level-change IRR was 0.518 (95% CI: 0.428–0.628), and the slope-change IRR was 0.930 (95% CI: 0.921–0.939). Similar directional deviations from the extrapolated pre-regulation trajectory were observed for PM–pedestrian, PM–other-vehicle, PM single-vehicle, severe-or-fatal, and late-night crashes. The late-night level change was not statistically significant at the 0.05 level (IRR = 0.424, 95% CI: 0.176–1.025,
p = 0.057), although its slope change was significant. These coefficients should not be interpreted as reductions caused by the regulation. As illustrated in
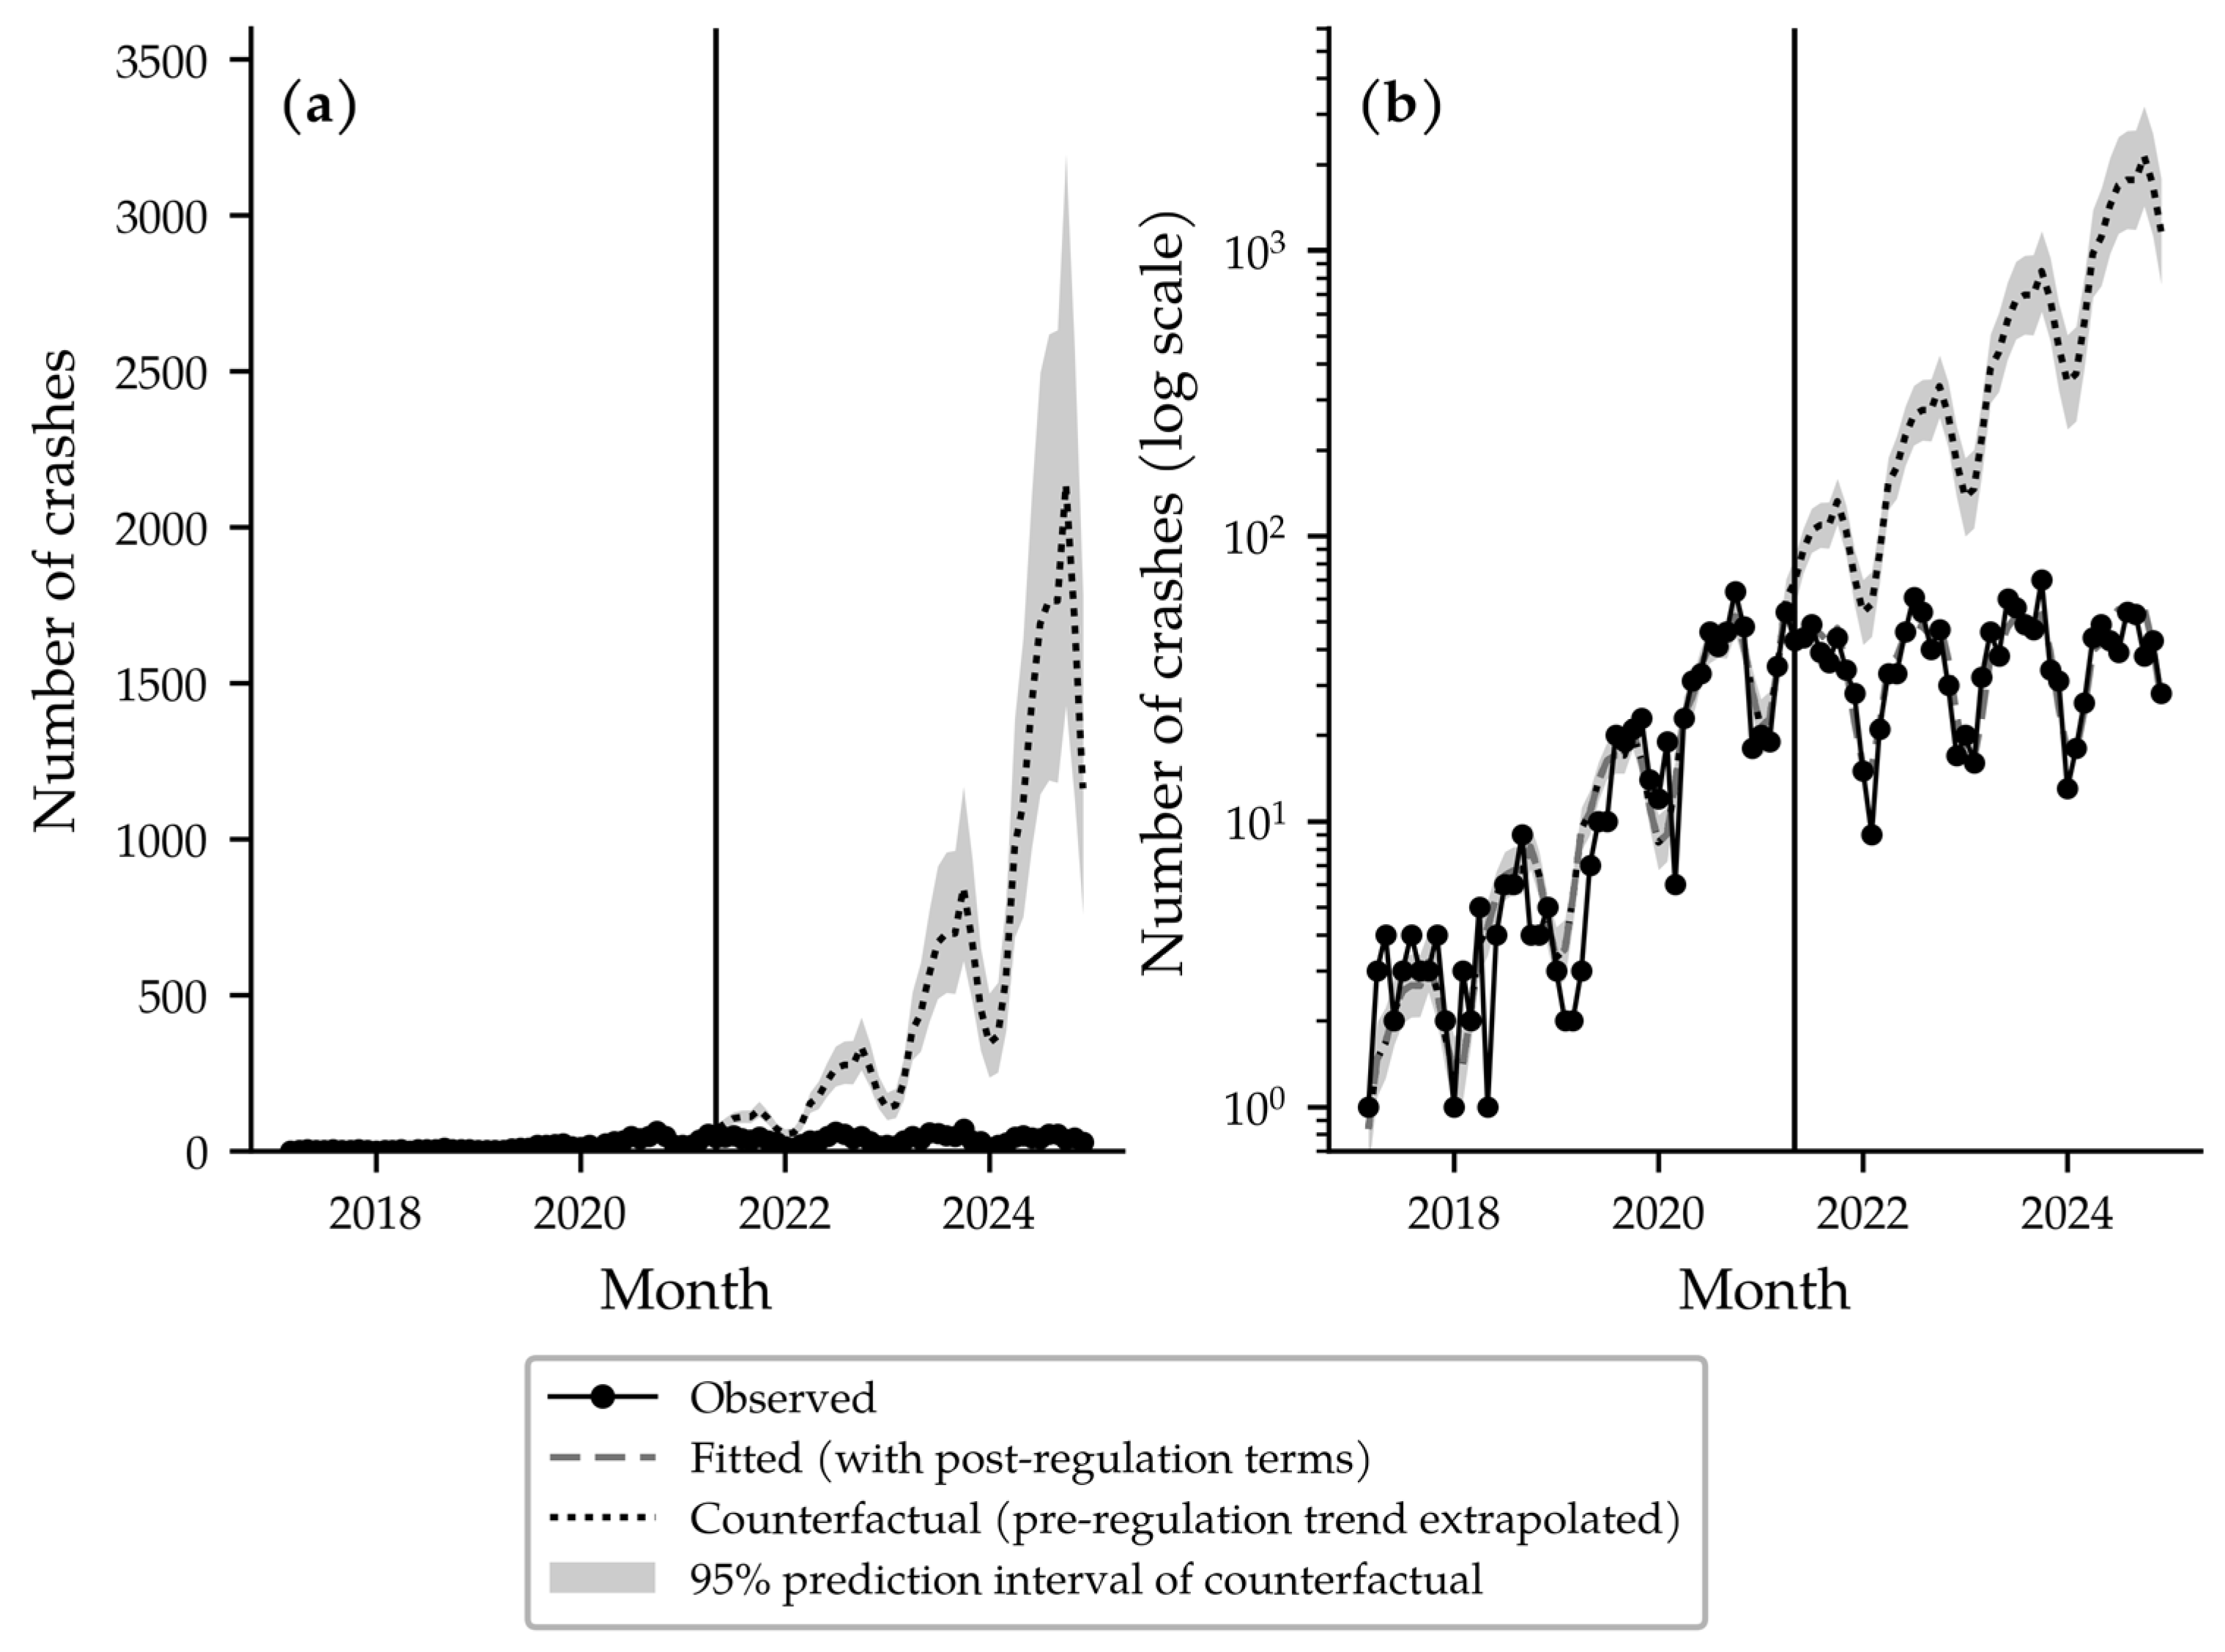
Figure 5, extrapolation of the rapid pre-regulation growth trend produces an increasingly implausible counterfactual, preventing the model from separating regulation from diffusion dynamics and concurrent temporal changes.
These results should not be interpreted as evidence that the regulation reduced PM crash risk. The pre-regulation trend primarily reflects rapid early PM diffusion, corresponding to an estimated increase of approximately 8% per month.
Figure 5 compares observed total PM crash counts with the counterfactual mean obtained by setting the post-regulation level- and slope-change terms to zero, together with model-based 95% prediction intervals for the counterfactual trajectory. The counterfactual reached approximately 104 crashes one month after the regulation, 224 at 12 months, 566 at 24 months, and 1433 at 36 months, whereas observed counts generally remained between approximately 30 and 70. The widening gap shows that the benchmark is dominated by extrapolation of early-adoption growth rather than a credible long-term trajectory. The count-model results are therefore retained only as secondary, descriptive, and exploratory analyses.
4.5. Monthly Crash Composition Model Results (Primary Analysis)
Table 5 presents the grouped-binomial estimates based on monthly outcome and non-outcome counts. For the PM–pedestrian proportion, neither the post-regulation level change (OR = 0.799, 95% CI: 0.582–1.099,
p = 0.168) nor the slope change (OR = 1.009, 95% CI: 0.993–1.026,
p = 0.272) was statistically significant. The descriptive increase from 42.9% to 49.7% should therefore not be interpreted as an interrupted-time-series finding.
The severe-or-fatal proportion likewise showed no statistically significant level change (OR = 1.252, 95% CI: 0.867–1.809, p = 0.230) or slope change (OR = 1.010, 95% CI: 0.992–1.029, p = 0.266). For the late-night proportion, the level change was not significant (OR = 0.832, 95% CI: 0.507–1.365, p = 0.467), whereas the post-regulation slope change was negative (OR = 0.954, 95% CI: 0.926–0.983, p = 0.002). This late-night slope term was the only statistically significant post-regulation composition term in the full-period models.
These models concern the composition of police-reported crashes, not crash occurrence risk. The late-night result also warrants caution: it remained significant in the January 2019 model under conventional grouped-binomial inference but was not significant under the conservative month-level HC3 covariance estimate. Accordingly, the composition analysis provides limited evidence of a changing late-night share and no confirmatory evidence of a PM–pedestrian or severe-or-fatal discontinuity.
4.6. Crash-Level Supplementary Model Results
Full results from the supplementary crash-level logistic regression models are presented in
Appendix A,
Table A1. The main text summarizes only the strongest policy-relevant association: PM single-vehicle crashes had substantially higher odds of late-night occurrence than crashes involving pedestrians or other vehicles (OR = 6.55, 95% CI: 4.28–10.02,
p < 0.001). This is a conditional association among reported crashes, not evidence of a causal mechanism or of a general post-regulation reduction in crash severity.
4.7. Sensitivity Analysis Results
Sensitivity analyses covered transition-month handling, COVID-19 adjustment, alternative start dates, count-model family, residual autocorrelation, and composition-model inference. Negative binomial and six-lag HAC estimates preserved the directions of the count-model terms. These checks establish numerical stability of the descriptive count trajectories, not a causal policy effect.
Table 6 presents the segmented Poisson estimates for study windows beginning in March 2017, January 2018, and January 2019. The March 2017 specification corresponds to the main analysis, whereas the January 2018 and January 2019 specifications progressively shorten the pre-regulation period. Restricting the analysis to January 2019 onward, thereby excluding the sparse 2017–2018 observations while retaining approximately 28 pre-regulation months, produced a level-change IRR of 0.495 (95% CI: 0.390–0.628) for total PM crashes and 0.461 (95% CI: 0.346–0.613) for PM–pedestrian crashes. The corresponding slope-change IRRs were 0.926 (95% CI: 0.910–0.942) and 0.932 (95% CI: 0.915–0.950), respectively. These estimates were similar in direction and approximate magnitude to those obtained from the main analysis. A January 2020 start date was not examined because it would leave only approximately 16 pre-regulation observations, providing insufficient information for stable estimation of the underlying trend and calendar-month seasonality while placing most of the pre-regulation period within the COVID-19 disruption.
Table 7 presents Ljung–Box tests of Pearson residuals and the six-lag Newey–West sensitivity results. Significant long-lag residual autocorrelation remained for several outcomes, including total PM, PM–pedestrian, severe-or-fatal, and late-night crashes. The directions of the post-regulation count-model terms were unchanged under HAC inference, but this check does not resolve the implausible long-term counterfactual or the absence of exposure data. The count-model results therefore remain secondary, descriptive, and exploratory.
Table 8 reports the composition-model sensitivity analysis restricted to January 2019 onward, excluding 2017–2018. Neither the level nor slope change was statistically significant for the PM–pedestrian or severe-or-fatal proportions. The late-night slope-change OR was 0.954 (95% CI: 0.914–0.995,
p = 0.029) under conventional grouped-binomial inference but was not statistically significant with month-level HC3 covariance (
p = 0.155). The restricted-window results therefore reinforce the non-significant PM–pedestrian and severe-or-fatal findings and show that the late-night result is covariance-sensitive.
4.8. Descriptive Check of Regulation-Targeted Behaviors (Helmet Use and License Type)
Because the amendment of 13 May 2021 directly addressed helmet use and driver licensing, the pre/post distributions of these variables were examined separately in the reconstructed crash-level dataset (). Among crashes with known helmet-use status, helmet use was recorded in 25.8% of pre-regulation crashes (125/485) and 28.3% of post-regulation crashes (341/1206). The difference was not statistically significant (, ). The proportion of crashes with unknown helmet-use status decreased from 35.2% before the regulation to 26.9% after the regulation. Helmet use was associated with a lower conditional likelihood of a reported crash being classified as a PM–pedestrian crash (), but it was not significantly associated with severe-or-fatal outcomes (). These associations should be interpreted cautiously because helmet-use status was missing for a substantial and unequal proportion of crashes in the two periods. License type was not recorded for any of the 748 pre-regulation crashes. Among the 1650 post-regulation crashes, 824 operators were recorded as licensed, 496 as unlicensed, 33 as indeterminate, and 297 as missing. Because the variable was completely unavailable before the regulation, longitudinal change in licensing status could not be evaluated. Accordingly, the available data provide no statistically detectable evidence of a pre/post change in helmet use among crashes with known status and do not permit a corresponding evaluation of licensing behavior. These findings should be interpreted as limitations of the recorded behavioral variables rather than as evidence that the regulation did or did not improve compliance.
5. Discussion
5.1. Overall Interpretation of the Main Findings
This study examined changes in police-reported PM crash composition and monthly crash-count trajectories around 13 May 2021. The observed count trajectories fell below the extrapolated pre-regulation benchmark, but
Figure 5 shows that the benchmark became implausibly large and cannot identify a regulatory effect. The count models are therefore descriptive and exploratory. In the grouped-binomial models, PM–pedestrian and severe-or-fatal level and slope changes were not statistically significant. Although the PM–pedestrian share increased descriptively from 42.9% to 49.7%, the model did not identify this contrast as a policy discontinuity. The only significant post-regulation composition term in the full-period model was a declining late-night slope, and that result was not robust to the month-level HC3 covariance check in the January 2019 window. Helmet use did not change significantly among records with known status, and licensing change could not be evaluated. The results therefore support cautious, multi-indicator monitoring rather than a claim that the regulation either succeeded or failed.
5.2. Implications of the Descriptive PM–Pedestrian Pattern
The descriptive increase in the PM–pedestrian share remains policy-relevant because it concerns conflicts with vulnerable road users, but it is not a statistically confirmed policy discontinuity. The pattern may reflect changes in PM use, service availability, trip distribution, user composition, enforcement, reporting, or activity in pedestrian-intensive environments. It should therefore motivate continued monitoring and location-based research rather than be treated as evidence that the 2021 regulation succeeded or failed. Pedestrian-conflict management remains justified as a precautionary safety priority.
5.3. Regulatory-Infrastructural Mismatch as a Contextual Explanation
A plausible contextual interpretation of the descriptive PM–pedestrian pattern is a mismatch between the regulatory framework and available infrastructure. Korea’s bicycle-facility system includes shared bicycle–pedestrian paths, bicycle lanes adjacent to pedestrian space, and discontinuous segments, so directing PM users toward bicycle facilities does not necessarily provide continuous physical separation from pedestrians. This mechanism was not directly tested because the dataset lacked crash-coordinate-level facility information. Regulatory–infrastructural mismatch is therefore retained only as a contextual hypothesis for future spatial and exposure-based research.
5.4. Policy Meaning of Late-Night Crashes and PM Single-Vehicle Crashes
The supplementary crash-level models identified a strong association between late-night occurrence and PM single-vehicle crashes. Single-vehicle crashes had 6.55 times the odds of occurring during the late-night period compared with crashes involving pedestrians or other vehicles (95% CI: 4.28–10.02, p < 0.001). This pattern suggests that late-night PM safety may involve mechanisms distinct from those underlying daytime pedestrian conflicts, including falls, overturning, fixed-object collisions, reduced visibility, impaired riding, excessive speed, and adverse pavement-surface conditions. These results indicate the need to distinguish at least two safety domains. During pedestrian-active periods, policy should prioritize the management of PM–pedestrian interactions, particularly in shared or adjacent travel spaces. During late-night periods, countermeasures should focus more directly on single-vehicle crash prevention through speed management, impaired-riding enforcement, improved lighting, pavement and surface maintenance, hazard warnings, and targeted operational restrictions at high-risk locations or times. This distinction is consistent with a Safe System approach, under which safety cannot depend exclusively on error-free rider behavior. Travel-space design, operating speed, visibility, surface condition, and conflict-point treatment influence whether ordinary user errors result in crashes or serious injuries. The findings therefore support shared responsibility among riders, public authorities, infrastructure planners, and PM service operators.
5.5. Implications for Traffic Safety Policy
The results support an integrated PM safety strategy that combines user-oriented regulation with spatial, infrastructural, and operational measures. Licensing requirements, helmet-use rules, passenger restrictions, and impaired-riding enforcement remain important, but they do not directly resolve conflicts arising when PM users and pedestrians occupy the same or adjacent spaces. First, locations with frequent PM–pedestrian interaction should be prioritized. These include crosswalks, subway entrances, bus stops, commercial frontages, school and park areas, local streets, and shared bicycle–pedestrian facilities. Appropriate measures may include low-speed zones, restricted-riding zones, geofenced speed control, pavement markings, signs, improved visibility, designated parking areas, and physical or operational separation where feasible. Second, the continuity and legibility of PM travel space should be improved. Discontinuous routes may force users to shift unpredictably among roadways, bicycle facilities, sidewalks, and local streets. Network planning should therefore consider not only total facility length but also continuity, separation from pedestrian space, intersection treatment, transition design, and the consistency of operating rules across connected segments. Third, late-night single-vehicle crashes require a distinct set of interventions. Potential measures include improved lighting, maintenance of uneven or slippery surfaces, speed restrictions during high-risk periods, warnings at hazardous locations, enforcement against impaired riding, and platform-level operational controls where appropriate. Fourth, PM safety performance should not be evaluated using total crash counts alone. Count trajectories may be strongly affected by changes in PM diffusion and exposure, particularly during the early expansion of a new transport mode. Evaluation should therefore combine crash counts, exposure-based crash rates where available, crash-type composition, vulnerable-road-user involvement, injury severity, and time-of-day patterns. In the present study, the grouped composition models provided more interpretable evidence than the long-term extrapolation of the pre-regulation count trend, although they remained observational and subject to time-varying confounding.
5.6. Implications for Crash Avoidance Research
This study demonstrates the importance of distinguishing aggregate crash counts from crash composition when evaluating policies for rapidly diffusing modes. Count models describe deviations from a fitted trajectory but may be highly sensitive to diffusion, exposure growth, and counterfactual specification. Composition models describe which crash types become relatively more or less prominent within the reported crash population, but they remain observational. The observed-versus-counterfactual comparison in
Figure 5 illustrates why counterfactual plausibility should be tested before an interrupted time-series coefficient is interpreted as a policy effect.
6. Limitations and Future Research
This study has several limitations. First, exposure data on PM trips, distance traveled, service coverage, and fleet size were unavailable, so exposure-based crash rates could not be estimated. The count-model counterfactual extrapolates an early-adoption trend and is unsuitable for causal attribution. The composition models avoid dependence on the overall count trajectory but do not eliminate time-varying changes in crash mix, reporting, user composition, or counterpart-specific exposure. PM–pedestrian and severe-or-fatal changes were not statistically significant under grouped-binomial inference, and the late-night slope result was sensitive to the covariance specification in the January 2019 window.
Second, the study relied on police-reported crashes. Minor incidents, unreported single-vehicle falls, and injuries recorded only in medical systems may therefore be underrepresented. Changes in reporting behavior, enforcement intensity, public awareness, and police recording practices may also have affected the observed temporal patterns.
Third, detailed spatial and infrastructure data were unavailable. The dataset did not include precise crash coordinates or information on bicycle-facility type, sidewalk width, physical separation, network discontinuity, crossing design, lighting, pavement condition, or surrounding land use. The regulatory–infrastructural mismatch discussed in
Section 5.3 should therefore be regarded as a contextual interpretation rather than as a directly tested mechanism.
Fourth, the regulatory intervention coincided with other temporal changes, including the expansion of shared PM services, COVID-19-related disruption and recovery, changes in travel demand, and possible changes in enforcement and operator practices. Although alternative study windows, transition-month handling, and COVID-19-period controls were examined, unobserved time-varying confounding could not be eliminated. Significant long-lag residual dependence also remained for several count outcomes. The Newey–West analysis should therefore be interpreted as a limited sensitivity check rather than as a complete correction for temporal dependence.
Fifth, modest overdispersion was present in some monthly count outcomes. Negative binomial models produced only small AIC improvements, and the Poisson specification was retained for continuity. Nevertheless, model-family uncertainty remains and further supports cautious interpretation of the count-model results.
Sixth, uncertainty remains in the reconstruction of crash-level observations. The primary dataset was generated by merging records with identical crash date, time, location, detailed location, district, and crash type, and a more conservative reconstruction was used for sensitivity analysis. However, separate crashes with highly similar identifiers may have been merged, while some repeated records may have remained unmerged.
Seventh, the behavioral variables were incomplete. Helmet-use status had substantial and differential missingness across periods, and license type was not recorded before the regulation. The analysis could therefore not provide a comprehensive longitudinal assessment of compliance with the helmet and licensing requirements.
Future research should combine police records with PM trip volumes, travel distance, fleet size, and service-area information to estimate exposure-based crash rates. Linking precise crash locations with bicycle and pedestrian infrastructure data would allow direct evaluation of shared facilities, physical separation, network continuity, intersection design, lighting, and pavement condition. Naturalistic riding, telematics, near-miss, emergency-department, and platform-operation data could further clarify pre-crash mechanisms and unreported incidents. Where data permit, future policy evaluations should use controlled comparative designs, nonlinear diffusion models, flexible time-series specifications, and spatial models to distinguish regulatory effects from adoption dynamics, concurrent policy changes, and local infrastructure conditions.
7. Conclusions
This study examined changes in police-reported PM crash composition in Seoul around the strengthening of safety regulations on 13 May 2021, with monthly crash-count trajectories analyzed as secondary, descriptive, and exploratory evidence.
Observed post-regulation crash counts remained below the trajectory obtained by extrapolating the pre-regulation log-linear trend, but the counterfactual became implausibly large within two to three years. The count models therefore could not separate a regulatory discontinuity from PM diffusion dynamics and other concurrent changes. Grouped-binomial estimation did not identify significant PM–pedestrian or severe-or-fatal level or slope changes. The PM–pedestrian share increased descriptively from 42.9% to 49.7%. The only significant post-regulation composition term in the full-period model was a declining late-night slope, which was not significant under the conservative month-level HC3 covariance check in the January 2019 window. Helmet use did not differ significantly among records with known status, and licensing change was not assessable. The evidence therefore does not establish either a beneficial or adverse causal effect of the regulation.
A defensible policy implication is to maintain user-oriented enforcement while strengthening multi-indicator monitoring of exposure, crash types, vulnerable-road-user involvement, and late-night single-vehicle crashes. Pedestrian-conflict management and assessment of continuous, clearly separated PM travel space remain justified as precautionary priorities, not as mechanisms proven by this analysis. Future evaluations should integrate exposure, operational, spatial, and infrastructure data and test counterfactual plausibility.
Author Contributions
Conceptualization, D.-y.L. and H.-j.Y.; methodology, D.-y.L. and H.-j.Y.; investigation, D.-y.L.; data curation, D.-y.L. and H.-j.Y.; writing—original draft preparation, H.-j.Y.; writing—review and editing, D.-y.L.; visualization, H.-j.Y.; supervision, D.-y.L.; funding acquisition, D.-y.L. All authors have read and agreed to the published version of the manuscript.
Funding
This work was conducted as part of an independent research project by the Korea Transport Institute (KOTI). The task number was not assigned separately because it was a task performed internally. This research received no external funding.
Institutional Review Board Statement
Ethical review and approval were waived for this study because it used secondary police-reported traffic crash data and did not involve human-subject experiments, interventions, surveys, or interviews. The dataset did not include direct personal identifiers such as names, resident registration numbers, telephone numbers, or personal contact information.
Informed Consent Statement
Informed consent was not applicable because this study used de-identified secondary police-reported traffic crash data and did not involve direct interaction with individual participants.
Data Availability Statement
The data used in this study are not publicly available because they were provided by the police authority for research purposes and are subject to data-sharing restrictions. The original crash records were de-identified before analysis but include police-reported crash information, location-related attributes, and injury-related variables that may be sensitive. Therefore, the raw data cannot be shared publicly. Aggregated results and model outputs supporting the findings are presented in the article where applicable. Access to the original data may be granted by the data provider upon reasonable request and subject to the provider’s approval and applicable data protection regulations.
Acknowledgments
The authors would like to thank the members of the research team for their guidance and support throughout this project.
Conflicts of Interest
Author Ho-jun Yoo was employed by RoadKorea Inc. The remaining author declares that the research was conducted in the absence of any commercial or financial relationships that could be construed as a potential conflict of interest.
Abbreviations
The following abbreviations are used in this manuscript:
| AIC | Akaike information criterion |
| CI | Confidence interval |
| COVID-19 | Coronavirus disease 2019 |
| GIS | Geographic information system |
| HAC | Heteroskedasticity- and autocorrelation-consistent (Newey-West) standard error |
| HC3 | Heteroskedasticity-consistent type 3 standard error |
| IRR | Incidence rate ratio |
| ITS | Interrupted time series |
| NB | Negative binomial |
| OR | Odds ratio |
| PM | Personal mobility |
| VRU | Vulnerable road user |
Appendix A
Table A1.
Crash-level supplementary logistic regression results.
Table A1.
Crash-level supplementary logistic regression results.
| Model | Variable | OR (95% CI) | p-Value |
|---|
| PM-pedestrian crash | Time trend | 1.017 (1.011–1.022) | <0.001 |
| PM-pedestrian crash | Post-regulation indicator | 0.758 (0.587–0.979) | 0.034 |
| PM-pedestrian crash | Transition month | 0.720 (0.361–1.438) | 0.352 |
| PM-pedestrian crash | Late-night period | 0.324 (0.239–0.438) | <0.001 |
| PM-pedestrian crash | Weekend | 0.901 (0.728–1.115) | 0.339 |
| PM-pedestrian crash | Intersection-related | 0.206 (0.152–0.280) | <0.001 |
| Severe-or-fatal crash | Time trend | 0.995 (0.986–1.005) | 0.331 |
| Severe-or-fatal crash | Post-regulation indicator | 1.207 (0.835–1.745) | 0.316 |
| Severe-or-fatal crash | Transition month | 0.311 (0.104–0.931) | 0.037 |
| Severe-or-fatal crash | PM-pedestrian crash | 1.129 (0.916–1.391) | 0.256 |
| Severe-or-fatal crash | PM single-vehicle crash | 1.429 (0.947–2.157) | 0.089 |
| Severe-or-fatal crash | Late-night period | 1.218 (0.859–1.728) | 0.269 |
| Severe-or-fatal crash | Weekend | 0.779 (0.627–0.968) | 0.025 |
| Severe-or-fatal crash | Intersection-related | 0.925 (0.723–1.183) | 0.533 |
| Late-night crash | Time trend | 1.000 (0.988–1.012) | 0.994 |
| Late-night crash | Post-regulation indicator | 1.151 (0.693–1.912) | 0.586 |
| Late-night crash | Transition month | 0.414 (0.141–1.214) | 0.108 |
| Late-night crash | PM-pedestrian crash | 0.499 (0.369–0.675) | <0.001 |
| Late-night crash | PM single-vehicle crash | 6.550 (4.282–10.018) | <0.001 |
| Late-night crash | Weekend | 2.062 (1.734–2.452) | <0.001 |
References
- Republic of Korea. Road Traffic Act. Korean Law Translation Center, Korea Legislation Research Institute. Available online: https://elaw.klri.re.kr/eng_service/lawView.do?hseq=68880&lang=ENG (accessed on 4 August 2026).
- Republic of Korea. Promotion of the Use of Bicycles Act. Korean Law Translation Center, Korea Legislation Research Institute. Available online: https://elaw.klri.re.kr/eng_service/lawView.do?hseq=42713&lang=ENG (accessed on 4 August 2026).
- Jung, K.B.; Kim, T.; Kim, Y.; Kim, S. A study on the countermeasures according to the review of personal (shared) mobility system and operating conditions. J. Korean Soc. Transp. 2022, 40, 1–10. (In Korean) [Google Scholar] [CrossRef] [Scilit]
- Jeong, M.K.; Kim, J.; Kim, J.; Lee, M. Study on policy directions for ensuring traffic safety for personal mobility devices. Traffic Saf. Res. 2024, 43, 29–48. (In Korean) [Google Scholar] [CrossRef]
- Austin Public Health. Dockless Electric Scooter-Related Injuries Study: Austin, Texas, September–November 2018; Austin Public Health: Austin, TX, USA, 2019.
- Trivedi, T.K.; Liu, C.; Antonio, A.L.M.; Wheaton, N.; Kreger, V.; Yap, A.; Schriger, D.; Elmore, J.G. Injuries associated with standing electric scooter use. JAMA Netw. Open 2019, 2, e187381. [Google Scholar] [CrossRef] [Scilit] [PubMed]
- Namiri, N.K.; Lui, H.; Tangney, T.; Allen, I.E.; Cohen, A.J.; Breyer, B.N. Electric scooter injuries and hospital admissions in the United States, 2014–2018. JAMA Surg. 2020, 155, 357–359. [Google Scholar] [CrossRef] [Scilit] [PubMed]
- Gao, D.; Zhang, X. Injury severity analysis of single-vehicle and two-vehicle crashes with electric scooters: A random parameters approach with heterogeneity in means and variances. Accid. Anal. Prev. 2024, 195, 107408. [Google Scholar] [CrossRef] [Scilit] [PubMed]
- Agheli, A.; Aghabayk, K.; Sadeghi, M.; Das, S. E-scooter crash severity in the United Kingdom: A comparative analysis using machine learning techniques and random parameters logit with heterogeneity in means and variances. IATSS Res. 2025, 49, 155–168. [Google Scholar] [CrossRef] [Scilit]
- Abdi, A.; O’Hern, S. Understanding e-scooter rider crash severity using a built environment typology: A two-stage clustering and random parameter model analysis. Accid. Anal. Prev. 2025, 215, 108018. [Google Scholar] [CrossRef] [Scilit] [PubMed]
- Fountas, G.; Fonzone, A.; Demiris, A.; Sheykhfard, A.; Basbas, S. Unveiling the determinants of crash injury severities in e-scooter crashes: A latent class binary logit analysis of single and multiple-vehicle crashes. J. Cycl. Micromobil. Res. 2026, 8, 100116. [Google Scholar] [CrossRef] [Scilit]
- Dibaj, S.; Vosough, S.; Kazemzadeh, K.; O’Hern, S.; Mladenović, M.N. An exploration of e-scooter injuries and severity: Impact of restriction policies in Helsinki, Finland. J. Saf. Res. 2024, 91, 271–282. [Google Scholar] [CrossRef] [Scilit] [PubMed]
- Sohaee, N.; Azadjoo Tabari, A.; Sardari, R. A multilevel spatial framework for e-scooter collision risk assessment in urban Texas. Safety 2025, 11, 67. [Google Scholar] [CrossRef] [Scilit]
- Jiao, J.; Bai, S.; Choi, S.J. Understanding e-scooter incident patterns from a street-network perspective: A case study of Travis County, Texas. Sustainability 2021, 13, 10583. [Google Scholar] [CrossRef] [Scilit]
- Zhao, J.; Konstantinoudis, G.; Heydari, S. England-wide injury-severity analysis of e-scooter riders using a Bayesian spatial field model. Accid. Anal. Prev. 2026, 232, 108517. [Google Scholar] [CrossRef] [Scilit] [PubMed]
- Ma, Q.; Yang, H.; Mayhue, A.; Sun, Y.; Huang, Z.; Ma, Y. E-scooter safety: The riding risk analysis based on mobile sensing data. Accid. Anal. Prev. 2021, 151, 105954. [Google Scholar] [CrossRef] [Scilit] [PubMed]
- White, E.; Guo, F.; Han, S.; Mollenhauer, M.; Broaddus, A.; Sweeney, T.; Robinson, S.; Novotny, A.; Buehler, R. What factors contribute to e-scooter crashes: A first look using a naturalistic riding approach. J. Saf. Res. 2023, 85, 182–191. [Google Scholar] [CrossRef] [Scilit] [PubMed]
- Kang, S.S.; Kang, S.K. A study on major safety problems and improvement measures of personal mobility. J. Soc. Disaster Inf. 2022, 18, 202–217. (In Korean) [Google Scholar] [CrossRef]
- Han, S.; Lee, C.K.; Yun, I.; Yun, Y.; Na, J. Analysis of PM (personal mobility) traffic accident characteristics and causes of fatalities. J. Korean Soc. Intell. Transp. Syst. 2021, 20, 100–118. (In Korean) [Google Scholar] [CrossRef] [Scilit]
- Shin, S.H.; Choo, S.; Lim, D. Influence of urban built environment on severity of PM–pedestrian accidents in Seoul. J. Korean Soc. Intell. Transp. Syst. 2023, 22, 114–131. (In Korean) [Google Scholar] [CrossRef] [Scilit]
- Kim, H.; Lee, H.; Lee, C.; So, J. Analysis of neighbourhood environmental factors affecting personal mobility accidents. J. Korean Soc. Transp. 2022, 40, 205–217. (In Korean) [Google Scholar] [CrossRef] [Scilit]
- Han, D.; Kim, E.C.; Ji, M. Analysis of severity factors in personal mobility (PM) traffic accidents. J. Korean Soc. Transp. 2020, 38, 232–247. (In Korean) [Google Scholar] [CrossRef] [Scilit]
Figure 1.
Analytical framework of the study. Grouped crash-composition models are treated as the primary analysis, segmented Poisson models as secondary, descriptive, and exploratory analyses, and crash-level logistic models as supplementary analyses.
Figure 1.
Analytical framework of the study. Grouped crash-composition models are treated as the primary analysis, segmented Poisson models as secondary, descriptive, and exploratory analyses, and crash-level logistic models as supplementary analyses.
Figure 2.
Monthly trends in PM crash counts. Note: The dashed vertical line indicates the strengthening of PM safety regulations on 13 May 2021. The plotted series show monthly police-reported crash counts and are not adjusted for PM use, travel distance, fleet size, seasonality, or other concurrent temporal changes.
Figure 2.
Monthly trends in PM crash counts. Note: The dashed vertical line indicates the strengthening of PM safety regulations on 13 May 2021. The plotted series show monthly police-reported crash counts and are not adjusted for PM use, travel distance, fleet size, seasonality, or other concurrent temporal changes.
Figure 3.
Monthly proportions of PM–pedestrian, severe-or-fatal, and late-night crashes among all reported PM crashes in Seoul, 2017–2024.
Note: Each point represents the observed monthly proportion calculated using the total number of PM crashes in that month as the denominator. Extreme values in 2017–2018 largely reflect months with very small crash totals. In the grouped binomial models described in
Section 3.7, monthly total PM crashes were entered as the number of binomial trials, so months with larger denominators contributed more information to the estimated composition trends. The dashed vertical line indicates the strengthening of PM safety regulations on 13 May 2021.
Figure 3.
Monthly proportions of PM–pedestrian, severe-or-fatal, and late-night crashes among all reported PM crashes in Seoul, 2017–2024.
Note: Each point represents the observed monthly proportion calculated using the total number of PM crashes in that month as the denominator. Extreme values in 2017–2018 largely reflect months with very small crash totals. In the grouped binomial models described in
Section 3.7, monthly total PM crashes were entered as the number of binomial trials, so months with larger denominators contributed more information to the estimated composition trends. The dashed vertical line indicates the strengthening of PM safety regulations on 13 May 2021.
Figure 4.
Distribution of PM crash types before and after the regulatory strengthening.
Figure 4.
Distribution of PM crash types before and after the regulatory strengthening.
Figure 5.
Observed monthly total PM crashes and the extrapolated counterfactual based on the pre-regulation trend: (a) linear scale and (b) logarithmic scale. The shaded bands represent model-based 95% prediction intervals for the counterfactual trajectory obtained by setting the post-regulation level- and slope-change terms to zero. Note: The counterfactual extends the estimated pre-regulation log-linear trend, corresponding to approximately 8% monthly growth during the early PM diffusion period, across the full post-regulation observation window. This extrapolation produces increasingly implausible monthly crash counts. The observed-to-counterfactual ratio declined from approximately 0.47 one month after the regulation to 0.21 at 12 months, 0.11 at 24 months, and 0.03 at 36 months.
Figure 5.
Observed monthly total PM crashes and the extrapolated counterfactual based on the pre-regulation trend: (a) linear scale and (b) logarithmic scale. The shaded bands represent model-based 95% prediction intervals for the counterfactual trajectory obtained by setting the post-regulation level- and slope-change terms to zero. Note: The counterfactual extends the estimated pre-regulation log-linear trend, corresponding to approximately 8% monthly growth during the early PM diffusion period, across the full post-regulation observation window. This extrapolation produces increasingly implausible monthly crash counts. The observed-to-counterfactual ratio declined from approximately 0.47 one month after the regulation to 0.21 at 12 months, 0.11 at 24 months, and 0.03 at 36 months.
Table 1.
Data construction criteria and crash-level reconstruction results.
Table 1.
Data construction criteria and crash-level reconstruction results.
| Dataset | Construction Criterion | Original Rows | Constructed Observations | Merged Rows | PM-Pedestrian Crashes | Severe-or-Fatal Crashes | Fatal Crashes |
|---|
| Original row-level data | Original serial number | 2645 | 2645 | 0 | 1205 | 670 | 17 |
| Main crash-level dataset | Merging by crash date, time, location, detailed location, district, and crash type | 2645 | 2398 | 247 | 1141 | 574 | 12 |
| Sensitivity crash-level dataset | Conservative criterion additionally using road user age, sex, and status | 2645 | 2625 | 20 | 1198 | 662 | 16 |
Table 2.
Coding, categories, and operational definitions of the analysis variables.
Table 2.
Coding, categories, and operational definitions of the analysis variables.
| Variable Group | Variable | Coding or Categories | Operational Definition |
|---|
| Policy variable | post_regulation_month | Binary: 0 = pre-regulation months; 1 = post-regulation months | Indicator for the post-regulation period in the monthly analysis. May 2021 was treated as the transition month and excluded from the main model. |
| Policy variable | time_after_regulation | Integer: 0 before the regulation; 1, 2, … after the regulation | Post-regulation slope-change variable that remains 0 before the policy point and increases sequentially during the post-regulation period. |
| Policy variable | transition_month | Binary: 0 = all other months; 1 = May 2021 | Indicator for the transition month. May 2021 was excluded from the main model and included with this indicator in the sensitivity analysis. |
| Time variable | time_index | Continuous monthly index: 1–93 | Sequential month-level time index based on crash date over the main analysis period. |
| Time variable | month_of_year | Categorical: January–December; January as the reference category | Calendar-month variable represented by 11 indicator variables to control for seasonality in the segmented count and crash-composition models. |
| Time variable | late_night | Binary: 0 = 06:00–23:59; 1 = 00:00–05:59 | Indicator for crashes occurring during the late-night period, defined solely by clock time. |
| Time variable | night_period | Binary: 0 = 06:00–19:59; 1 = 20:00–05:59 | Indicator for crashes occurring during the broader nighttime period. No seasonal sunrise or sunset adjustment was applied. |
| Crash composition variable | pm_ped_crash | Binary: 0 = other PM crash; 1 = PM–pedestrian crash | Indicator for PM crashes classified as vehicle-to-pedestrian crashes. |
| Crash composition variable | pm_vehicle_crash | Binary: 0 = other PM crash; 1 = PM–other-vehicle crash | Indicator for PM crashes classified as vehicle-to-vehicle crashes. This category may include non-pedestrian counterparts such as bicycles and should not be interpreted as a motor-vehicle-only category. |
| Crash composition variable | single_vehicle_crash | Binary: 0 = collision crash; 1 = PM single-vehicle crash | Indicator for crashes involving a single PM device without a pedestrian or other-vehicle counterpart. |
| Severity variable | severe_or_fatal | Binary: 0 = no fatality or serious injury; 1 = at least one fatality or serious injury | Indicator for crashes involving at least one fatality or seriously injured person. |
| Severity variable | fatal_crash | Binary: 0 = no fatality; 1 = at least one fatality | Indicator for crashes involving at least one fatality. |
| Road environment variable | intersection_related | Binary: 0 = non-intersection location; 1 = intersection-related location | Indicator for crashes occurring at or near an intersection. |
| Spatial variable | district | Categorical: 25 autonomous districts of Seoul | District-level categorical variable used as the clustering unit for robust standard errors in the supplementary crash-level models. |
| Behavioral variable (descriptive only) | helmet_use | Categorical: worn; not worn; unknown | Recorded helmet-use status at the time of the crash. Used only for the descriptive pre/post comparison and not as a model covariate because of substantial and differential missingness. |
| Behavioral variable (descriptive only) | license_type | Categorical: licensed; unlicensed; indeterminate; missing | Recorded driver-license status of the PM operator. The variable was not recorded during the pre-regulation period and was therefore used only for the descriptive post-regulation assessment. |
Table 3.
Descriptive comparison of key crash characteristics before and after the regulation.
Table 3.
Descriptive comparison of key crash characteristics before and after the regulation.
| Characteristic | Before Regulation | After Regulation | Difference |
|---|
| Total PM crashes | 748 | 1650 | +902 crashes |
| PM-pedestrian crashes | 321 (42.9%) | 820 (49.7%) | +6.8 percentage points |
| PM–other-vehicle crashes | 380 (50.8%) | 758 (45.9%) | −4.9 percentage points |
| PM single-vehicle crashes | 47 (6.3%) | 72 (4.4%) | −1.9 percentage points |
| Severe-or-fatal crashes | 177 (23.7%) | 397 (24.1%) | +0.4 percentage points |
| Fatal crashes | 3 (0.4%) | 9 (0.5%) | +0.1 percentage points |
| Late-night crashes | 84 (11.2%) | 196 (11.9%) | +0.6 percentage points |
| Nighttime crashes | 171 (22.9%) | 373 (22.6%) | −0.3 percentage points |
| Intersection-related crashes | 252 (33.7%) | 532 (32.2%) | −1.4 percentage points |
Table 4.
Key results from the monthly segmented Poisson regression models.
Table 4.
Key results from the monthly segmented Poisson regression models.
| Outcome | Variable | IRR (95% CI) | p-Value |
|---|
| Total PM crashes | Time trend | 1.080 (1.072–1.089) | <0.001 |
| Total PM crashes | Post-regulation level change | 0.518 (0.428–0.628) | <0.001 |
| Total PM crashes | Post-regulation slope change | 0.930 (0.921–0.939) | <0.001 |
| PM-pedestrian crashes | Time trend | 1.086 (1.076–1.097) | <0.001 |
| PM-pedestrian crashes | Post-regulation level change | 0.465 (0.361–0.599) | <0.001 |
| PM-pedestrian crashes | Post-regulation slope change | 0.933 (0.921–0.944) | <0.001 |
| PM–other-vehicle crashes | Time trend | 1.074 (1.063–1.086) | <0.001 |
| PM–other-vehicle crashes | Post-regulation level change | 0.604 (0.454–0.804) | <0.001 |
| PM–other-vehicle crashes | Post-regulation slope change | 0.928 (0.915–0.940) | <0.001 |
| PM single-vehicle crashes | Time trend | 1.097 (1.061–1.136) | <0.001 |
| PM single-vehicle crashes | Post-regulation level change | 0.339 (0.173–0.665) | 0.002 |
| PM single-vehicle crashes | Post-regulation slope change | 0.904 (0.870–0.940) | <0.001 |
| Severe-or-fatal crashes | Time trend | 1.071 (1.053–1.088) | <0.001 |
| Severe-or-fatal crashes | Post-regulation level change | 0.610 (0.429–0.869) | 0.006 |
| Severe-or-fatal crashes | Post-regulation slope change | 0.937 (0.921–0.954) | <0.001 |
| Late-night crashes | Time trend | 1.116 (1.068–1.166) | <0.001 |
| Late-night crashes | Post-regulation level change | 0.424 (0.176–1.025) | 0.057 |
| Late-night crashes | Post-regulation slope change | 0.891 (0.850–0.934) | <0.001 |
Table 5.
Key results from the monthly crash composition models.
Table 5.
Key results from the monthly crash composition models.
| Model | Variable | OR (95% CI) | p-Value |
|---|
| PM-pedestrian crash proportion | Time trend | 1.009 (0.995–1.023) | 0.225 |
| PM-pedestrian crash proportion | Post-regulation level change | 0.799 (0.582–1.099) | 0.168 |
| PM-pedestrian crash proportion | Post-regulation slope change | 1.009 (0.993–1.026) | 0.272 |
| Severe-or-fatal crash proportion | Time trend | 0.988 (0.973–1.003) | 0.116 |
| Severe-or-fatal crash proportion | Post-regulation level change | 1.252 (0.867–1.809) | 0.230 |
| Severe-or-fatal crash proportion | Post-regulation slope change | 1.010 (0.992–1.029) | 0.266 |
| Late-night crash proportion | Time trend | 1.036 (1.008–1.065) | 0.011 |
| Late-night crash proportion | Post-regulation level change | 0.832 (0.507–1.365) | 0.467 |
| Late-night crash proportion | Post-regulation slope change | 0.954 (0.926–0.983) | 0.002 |
Table 6.
Sensitivity of level-change and trend-change IRRs to the choice of pre-regulation start date.
Table 6.
Sensitivity of level-change and trend-change IRRs to the choice of pre-regulation start date.
| Start Date | Outcome | Level-Change IRR (95% CI) | Trend-Change IRR (95% CI) |
|---|
| March 2017 (main analysis, Table 4) | Total PM crashes | 0.518 (0.428–0.628) | 0.930 (0.921–0.939) |
| March 2017 (main analysis, Table 4) | PM-pedestrian crashes | 0.465 (0.361–0.599) | 0.933 (0.921–0.944) |
| January 2018 (sensitivity) | Total PM crashes | 0.495 (0.401–0.610) | 0.926 (0.915–0.937) |
| January 2018 (sensitivity) | PM-pedestrian crashes | 0.448 (0.343–0.586) | 0.929 (0.916–0.942) |
| January 2019 (sensitivity, excludes 2017–2018) | Total PM crashes | 0.495 (0.390–0.628) | 0.926 (0.910–0.942) |
| January 2019 (sensitivity, excludes 2017–2018) | PM-pedestrian crashes | 0.461 (0.346–0.613) | 0.932 (0.915–0.950) |
Table 7.
Ljung-Box test p-values for residual autocorrelation (lags 1–24 months) and p-values for post-regulation coefficients under HAC (Newey-West, maximum lag 6) robust standard errors.
Table 7.
Ljung-Box test p-values for residual autocorrelation (lags 1–24 months) and p-values for post-regulation coefficients under HAC (Newey-West, maximum lag 6) robust standard errors.
| Outcome | Lag 1 | Lag 2 | Lag 3 | Lag 6 | Lag 12 | Lag 18 | Lag 24 | HAC p (Level) | HAC p (Trend) |
|---|
| Total PM crashes | 0.235 | 0.442 | 0.251 | 0.612 | 0.416 | 0.051 | 0.044 | <0.001 | <0.001 |
| PM-pedestrian crashes | 0.044 | 0.051 | 0.090 | 0.327 | 0.764 | 0.065 | 0.010 | <0.001 | <0.001 |
| PM-other-vehicle crashes | 0.322 | 0.572 | 0.229 | 0.518 | 0.541 | 0.632 | 0.874 | <0.001 | <0.001 |
| Severe-or-fatal crashes | 0.891 | 0.984 | 0.889 | 0.535 | 0.505 | 0.250 | 0.040 | <0.001 | <0.001 |
| Late-night crashes | 0.130 | 0.234 | 0.361 | 0.614 | 0.025 | 0.014 | 0.006 | 0.004 | <0.001 |
Table 8.
January 2019 start sensitivity of the grouped-binomial crash-composition models.
Table 8.
January 2019 start sensitivity of the grouped-binomial crash-composition models.
| Model | Variable | OR (95% CI) | p-Value |
|---|
| PM-pedestrian crash proportion | Post-regulation level change | 0.852 (0.589–1.233) | 0.396 |
| PM-pedestrian crash proportion | Post-regulation slope change | 1.016 (0.990–1.043) | 0.241 |
| Severe-or-fatal crash proportion | Post-regulation level change | 1.338 (0.868–2.062) | 0.188 |
| Severe-or-fatal crash proportion | Post-regulation slope change | 1.018 (0.988–1.049) | 0.238 |
| Late-night crash proportion | Post-regulation level change | 0.817 (0.465–1.435) | 0.482 |
| Late-night crash proportion | Post-regulation slope change | 0.954 (0.914–0.995) | 0.029 |
| Disclaimer/Publisher’s Note: The statements, opinions and data contained in all publications are solely those of the individual author(s) and contributor(s) and not of MDPI and/or the editor(s). MDPI and/or the editor(s) disclaim responsibility for any injury to people or property resulting from any ideas, methods, instructions or products referred to in the content. |