Abstract
Ship repair is hazardous, often presenting unsuitable working areas and risks due to the ship’s configuration. Welding tasks are particularly dangerous due to the high temperatures generated, high enough to melt the metal in structural elements, bulkheads, linings, and tanks. This study investigates the consequences of temperature distribution during the welding of naval plates and proposes some accident prevention measures. Industry working conditions were reproduced, including the materials, procedures, and tools used, as well as the certified personnel employed. DH 36-grade naval steel, with a composition of C max. 0.18%, Mn 0.90–1.60%, P 0.035%, S 0.04%, Si 0.10–0.50%, Ni max 0.4%, Cr max 0.25%, Mo 0.08%, Cu max 0.35%, Cb (Nb) 0.05%, and V 0.1%, was welded via FCAW-G (Gas-Shielded Flux-Cored Arc Welding), selected for this study because it is one of the most widely practiced in the naval industry. The main sensor used in the experiments was an FLIR model E50 thermographic camera, and thermal waxes were employed. The results for each thickness case are presented in both graphical and tabular form to provide accurate and actionable guidelines, prioritizing safety. After studying the butt jointing of naval plates of various thicknesses (8, 10, and 15 mm), safe distances to maintain were proposed to avoid risks in the most unfavorable cases: 350 mm from the welding seam to avoid burn injuries to unprotected areas of the body and 250 mm from the welding seam to avoid producing flammable gases. These numbers are less accurate but easier to remember, which prevents errors in the face of hazards throughout a long working day.
1. Introduction
Repairing a ship involves working in hazardous conditions, entering confined spaces, working with high temperature, and conducting repairs in spaces designed for function rather than safety.
Most ship repair tasks are dangerous [1], and ships are often not designed with ease of maintenance in mind [2]. This contrasts shipbuilding, which involves intensive control and planning [3,4,5]. While there are evaluation techniques for shipboard spare-part requirements grounded in a whole-part repair strategy, designed to improve the availability and combat efficacy of naval equipment [6], most support systems may be out of service (either due to disconnection of the auxiliary engines, electrical repairs, or ongoing maintenance). Additionally, time is the nemesis of ship repair due to the enormous costs associated with maintaining an out-of-operation ship (e.g., port, dry-docking, personnel, and opportunity costs).
The ship repair process is complex due to various factors, including material, organizational, and human elements. The ship owner, flag, class, insurance company, ship yard, subcontractors, port authorities, and others all play roles in the repair process. This complexity is further complicated by the diversity of languages, cultures, and management styles in the international sector.
To minimize interferences and ensure the successful completion of a repair, prevention measures and plans must be conceived. Workers at all levels must be trained in risk awareness and reduction, especially in the context of risks they are likely to encounter. The provision of protective equipment and training in its use is also essential.
As welding is a dangerous ship repair task [7], characterized by the rapid generation of high temperatures in a metallic structure [8], and the quality of welds and strategies for extending the service life of welded components in ship structures composed of high-strength steels are crucial for addressing the fatigue properties associated with these materials [9], welding has been well-studied and delimited from a technological perspective. Joint quality, possible defects, temperature ranges, voltages, and subsequent heat treatments have all been studied in detail [10,11,12].
However, from a safety perspective, the repair (or maintenance) of a ship is not so well defined. For all involved in ship repair, from the managing engineer to the occupational safety professional to the last operator to use the ship, a crucial question needs to be considered: how far does the heat disperse?
As is known, the working environment in ship repair and shipbuilding is characterized by limited spaces, mostly designed for hydrodynamic and commercial efficiency or the governability of the ship.
If the ubiquitous presence of metals in the structural elements, bulkheads, and linings is added to this environment, one has to face the disturbing possibility of heat dispersion in a structure composed, for the most part, of one of the best heat conductors [13].
As ships contain tanks full of combustibles, flammable linings in adjacent or nearby areas, and other unknown potential hazards and other teams sometimes work close by (so close that it is possible to hear them moving), it is necessary to know whether welding work at one point causes burns to nearby workers at other points. Additionally, it is important to determine whether welding can cause a fire in a cabin on other decks (lower and upper), and finally, if it can cause an explosion when the heat reaches a fuel tank via a bulkhead. To address these specific concerns, we must study the process experimentally under conditions mimicking real situations as closely as possible.
The aim of this work is to carry out an analysis based on reliable data derived from real-time experiments to facilitate decision-making regarding distances, times, and complementary occupational safety measures that enable planning for controlled, efficient, and safe welding processes.
2. Materials and Methods
In this study, we mimicked the standardized materials, technical work, and personnel training of the naval sector.
2.1. Naval Steel
Due to its critical importance in the structure and hull of ships, naval steel has its own characteristics and regulations. In this work, we have followed the standards used by the American Society for Testing and Materials (ASTM) [14]. The manufacturing of naval steel is controlled by the Classification Societies as they are used in all areas of the ship, different areas of which can require very different mechanical properties, with weldability being an essential requirement. The steel grade used in ships is DH 36 [14], indicating Higher Strength, which the standards describe as “a material with a higher yield strength than that graded with only a D, [as] DH36 has a minimum of 355 MPa while the ordinary D classification have a minimum of 235 MPa” [14,15,16]; see Table 1.

Table 1.
Mechanical properties of DH36-grade steel (according to the ASTM A131 Grade DH36 datasheet, [14].).
The code number “36” indicates a tensile strength of at least 490–620 MPa and a minimum elongation of 22%. For the Charpy impact test, on DH 36 steel in this case, −20 degrees Celsius must be employed, as this temperature is usually the temperature of ships sailing through cold areas of the globe (as is the case of oil rigs in the North Sea).
The chemical composition of the steel is presented in Table 2.
Table 2.
Chemical requirements according to ASTM A 131 [14].
Three thicknesses of steel samples with different numbers of welding passes were analyzed and are presented in Table 3.
Table 3.
Sample thickness and number of welding passes.
The sample comprised two elements, each one 500 × 500 mm, which were joined by welding: a measuring grid was drawn on them, and bridges (U-fasteners) were placed between them, connecting the two elements and enabling the sample to be welded during a first pass. There is a gap between the elements due to the bevel and backing ceramics for welding, and arrows on the grid show the 50 mm separation between the studied points.
2.2. FCAW-G Welding
FCAW-G (Flux-Cored Arc Welding-Gas Shielded) is a welding process protected by a gas atmosphere supplied externally to the electrode, which uses a flux-cored electrode [10,17,18]. This procedure is one of the most widely used in the industry because it improves the melting properties thanks to the composition of the fluxing elements contained in the tubular electrode [19,20]; it reduces some of the collateral effects of active CO2 release into the atmosphere thanks to the composition of the core mixture; it generates a protective slag layer [21,22] that protects the bead from the atmosphere during cooling (outside the scope of protection of the gas “shield”); and the slag protective layer contributes to the correct geometrical conformation and position of the bead (see Figure 1).
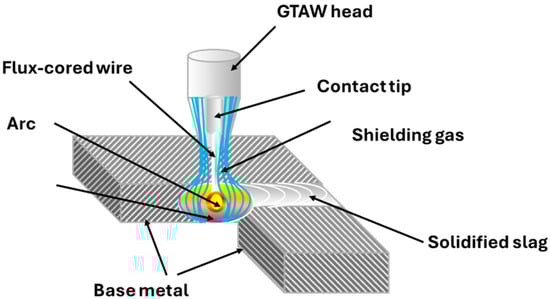
Figure 1.
Flux-cored arc welding-gas shielded (FCAW-G) process (author’s own elaboration).
In addition, this method generates slag that must be removed, especially in root passes. Although its removal is relatively simple, it requires the use of gas cylinders, which increases the cost, requires more complex equipment, and complicates work in difficult-to-access places.
2.3. Thermal Camera and Thermal Waxes
The main sensor used in the experiments was an FLIR model E50 thermographic camera in combination with the software of the same company for the analysis of the data obtained (FLIR Tools version 5.1.15036.1001). This device allows for thermography in different modes (Figure 2) and its simultaneous consultation and execution, in addition to specific software studies of different points of the thermal image in greater detail.
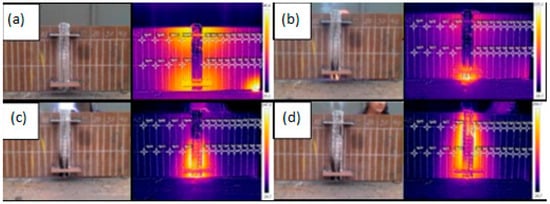
Figure 2.
Thermal images, 1st welding pass for 8 mm thickness plate: (a) starting condition of the plates before the first welding pass; (b) starting point of the welding pass; (c) medium point of the welding pass; (d) welding pass finished.
In addition to the use of thermography, thermal waxes were used (see Figure 3) as a backup method to measure the heat dispersion in the test specimens, in such a way that they were placed parallel to the vertical stripes, indicating distance. According to the manufacturer’s specifications, the measuring accuracy of these waxes on the centigrade scale is +/− 3%. Since the waxes melt upon reaching a set temperature, they allow for a quick visual analysis.
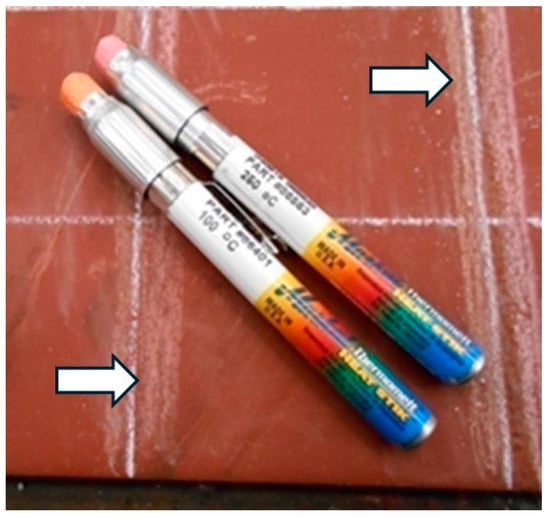
Figure 3.
Markal Thermomelt heat sticks, used as a backup method, allow for broader use but are less defined, the arrows show the thermal wax lines parallel to the more defined chalk ones.
3. Results and Discussion
Figure 4 shows the sample formed by two elements, each 500 × 500 mm, and joined by welding.
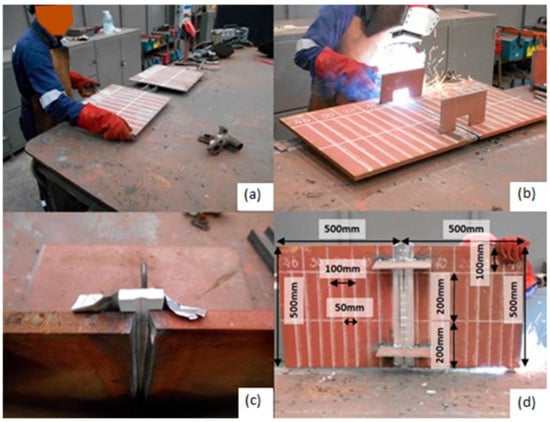
Figure 4.
(a) The two elements of the sample, each 500 × 500 mm; (b) placement of bridges, which allow us to weld the sample; (c) gap between the elements due to the bevel and backing ceramics for welding; (d) sample ready for welding, and the grid dimensions.
For controlled welding, grids were drawn on the sample with temperature-resistant white wax. Inside this grid, a series of points were selected and their temperatures were determined to study the heat dispersion.
To verify that the behavior of the material is isotropic and, therefore, it is possible to study only one of the plates, the mean temperatures (together with their standard deviations) are compared in Figure 5 by selecting points from both the green and orange zones. The same points were on both plates within the main divisions (marked with circles in the image; 100 mm, 200 mm, etc.; comparing points along the light blue line with those along the red and points along the navy blue line with those along the yellow ones), thus obtaining (with the thermographic data) a mirror image of the behavior of heat in both plates.
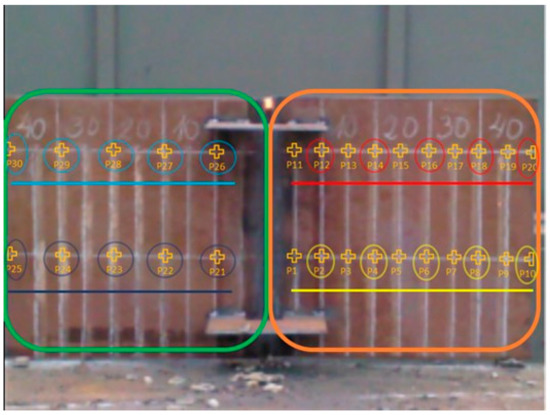
Figure 5.
Welded sample and studied points to verify the isotropic behavior: the orange and green areas were compared, points along the light blue with those along the red one, and points along the navy blue line with those along the yellow ones.
After determining that the behavior is isotropic, this study continued only with the right half of the welded plate, comparing two lines of dots with fixed distances of 50 mm from each other for a more detailed study, as can be seen in Figure 6, with green and orange rectangles marking the areas of interest.
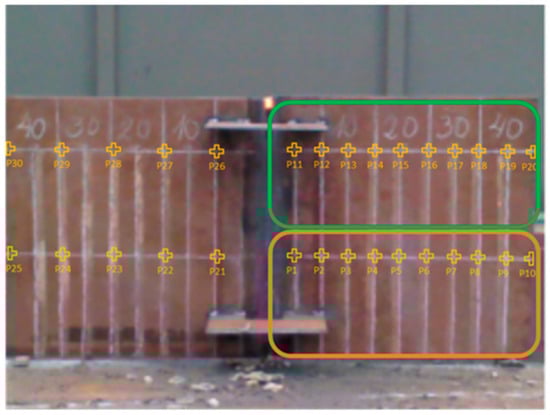
Figure 6.
Area of study after determining the isotropic properties of the material: the points of study are the ones marked with crosses. New areas are numbered from P1 to P10 in the orange area and from P11 to P20 in the green area.
As proposed, the data show that in spite of being from different castings and manufacturers, the final material is practically the same, and its behavior, which can be considered isotropic, responds to the line marked in the standards. Based on this isotropic behavior, this study focused on points 1–10/11–20, which are representative of the heat transmission in the specimen as a whole. The time taken to perform each stage of the procedure should also be taken into account: the average time needed to conduct the tests; to performed the welding, an average of 3.5 min; and to clean and prepare the beads, an average of 3 min.
The total average times to complete each of the welding seams (does not include preparation, placement, and removal of materials) were determined to be as follows: (a) for the 8 mm thick plate, 10 min; (b) for the 10 mm thick plate, 16.5 min; and (c) for the 15 mm thick plate, 23 min.
In order to draw comparisons from the contents of Figure 6, the most unfavorable case must be considered; in the tests, this means that the maximum standard deviation (values above the mean) is taken as the reference value within this study, with the most unfavorable values accepted as the most unfavorable case, which results in further distances to the safe zones.
However, due to the presence of standard deviations in the measurements, in some cases, thinner plates may present unexpected behaviors. Due to the focus of this study, occupational safety, even in such as cases, standard deviations affect the selection of values since; thus, as already indicated, the worst case (with a preferences for greater values, implying improved safety) is the guiding principle of this study.
The data used in the figures were recorded at the end of each welding pass, when the highest temperature was reached, which was also the most unfavorable case.
For the three plate thicknesses (Figure 7), the behavior observed is similar (after 3.5 min of welding), with the 8 mm thickness showing a significantly higher temperature increase, which is maintained in the first zone of the figure.
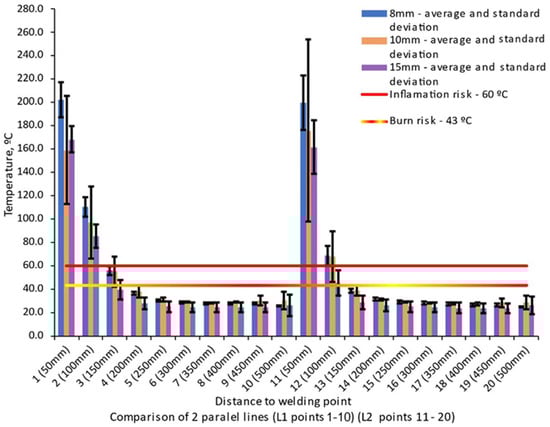
Figure 7.
Comparison of 2 parallel lines, L1 (points 1–10) and L2 (points 11–20), for each thickness during their first welding pass, showing the average temperature and standard deviation of each one for comparison. Burn and inflammation risk lines are shown too.
All the graphs show that at the 200 mm point, the temperature is lower than 60 °C (which usually occurs at the 150 mm point for a 15 mm thick plate), so the inflammation limit was not reached. Regarding the risk of burns, from 250 mm onwards, the risk falls below the limit for all sheets.
As observed in the first pass, different effects occur on the three thicknesses in identical conditions: thinner plates disperse heat faster.
During the second pass (see Figure 8), after 10 min of welding (with an intermediate stage of cleaning and preparation), a similar behavior to the previous pass is observed; however, the new heat input, together with any heat that has yet to disperse during the short bead cleaning and preparation stages, increases the overall temperature of the specimens, especially in the first half.
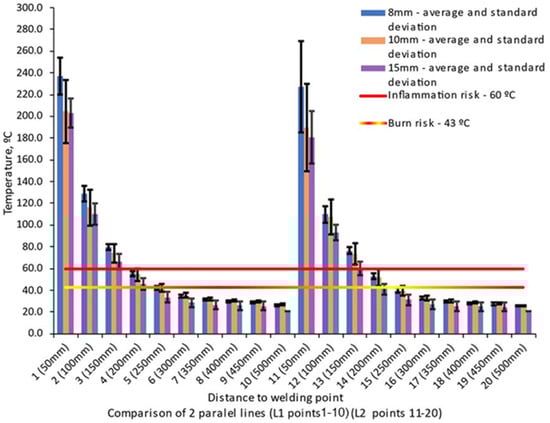
Figure 8.
Comparison of 2 parallel lines, L1 (points 1–10) and L2 (points 11–20), for each thickness during their second welding pass, showing the average temperature and standard deviation of each one for comparison. Burn and inflammation risk lines are shown too.
There is a zone where 60 °C is exceeded, which indicates the beginning of gas production, which can result in ignition, but this has shifted due to heat dispersion and is now at a safe distance of 250 mm. Regarding the risk of burns, the same phenomenon is observed when the safety distance is 300 mm.
After two passes, the weld bead on the 8 mm plate was completed; however, after 16.5 min of welding and a third pass, the new heat input to the thicker plates reaches a maximum temperature similar to that reached by its thinner counterpart.
Once again, the heat input shifts the distance of the safe zone from the flash point, this time to 250 mm (however, it should be noted that the 15 mm sheet continues to show the same trend of dispersing heat more slowly).
Regarding the risk of burns, the distance of the safe zone was found to be at 350 mm (it should be noted, however, that the 15 mm plate once again showed the same trend of dispersing heat more slowly), as can be seen in Figure 9.
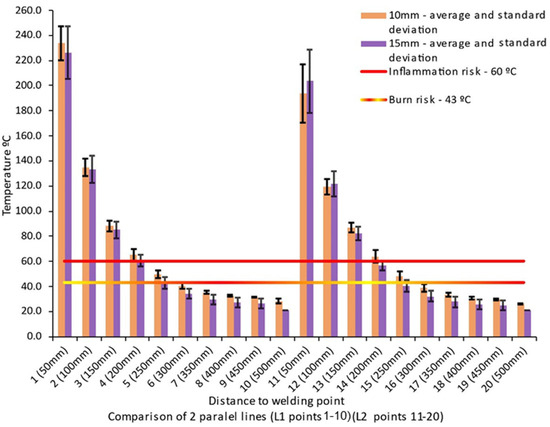
Figure 9.
Comparison of 2 parallel lines, L1 (points 1–10) and L2 (points 11–20), for the 10 and 15 mm thicknesses during the third welding pass (the 8 mm thickness is not shown as it only needed 2 welding passes), showing the average temperature and standard deviation of each one for comparison. Burn and inflammation risk lines are shown too.
Only the 15 mm plate, due to its thickness, required a fourth pass. After 23 min of welding, the effect of the heat input leads to a general rise in temperatures in line with that observed in the curve.
As far as fire or explosion risks are concerned, the safe zone on a 15 mm plate clearly reaches a distance of 250 mm due to the general rise in temperature (see Figure 10).
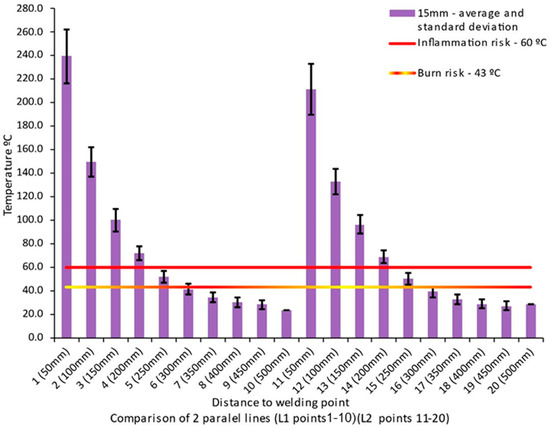
Figure 10.
Comparison of 2 parallel lines, L1 (points 1–10) and L2 (points 11–20), only for the 15 mm thickness during the fourth welding pass (the 8 mm and 10 mm thicknesses are not shown because they needed fewer than 4 welding passes), showing the average temperature and standard deviation. Burn and inflammation risk lines are shown too.
Therefore, the safe distance against burns also increased to 350 mm due to the previously explained phenomena.
Based on the obtained results, the following figures (see Figure 11a–c) were created to show the safe distances for each of the thicknesses in the two cases analyzed: risk of burns and risk of inflammation.
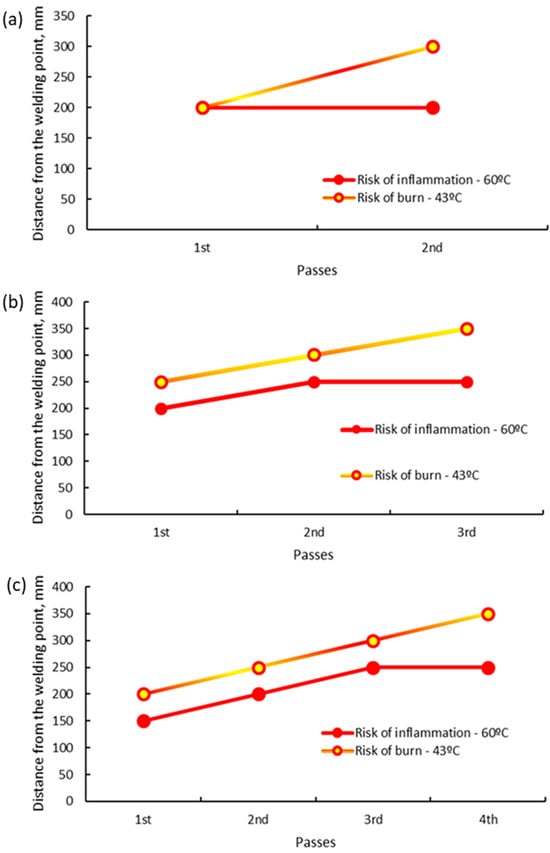
Figure 11.
Safety distances for each of the thicknesses in relation to the number of welding passes: (a) for a thickness of 8 mm and 2 welding passes; (b) for a thickness of 10 mm and 3 welding passes; (c) for a thickness of 15 mm and 4 welding passes.
Figure 11a–c present the minimum safe distances for each of the cases (for 8 mm, 10 mm, and 15 mm thicknesses) and their welding passes (which are different because thicker plates requires more welding passes), so that decisions can be made for each specific case; however, it is part of our objective to arrive at a general guidelines, one figure that “sums up” all three figures together, with quick reference tables that can be easily remembered by technicians and operators, thus allowing them to always stay safe in the field (this figure will not be as accurate as the previous three but takes into account the worst possible case and is easier to remember after a long working day, when accidents are more likely to occur).
Therefore, quick look-up tables of the minimum safe distance can be presented for the most unfavorable situation based on the number of passes, up to the fourth pass (though there are not always four passes); a technician or operator can thus carry these quick reference tables (the one presented below or, if they have more time, the specific tables presented above) in the form of a card to easily double check the maximum values.
Figure 12 and Table 4 were developed by taking all the previous points of discussion into account and using the plate thickness that required the greatest distance to maintain as a reference for each welding pass.
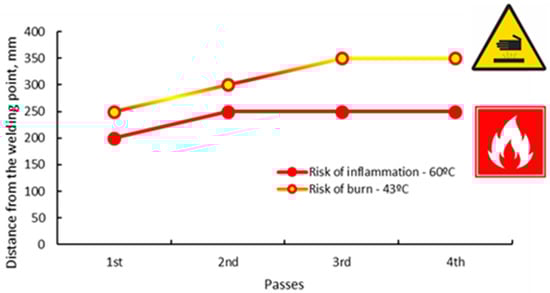
Figure 12.
Safe distances for each welding pass, taking the worst (highest) value of the three thicknesses as a quick reference for the minimum distance to maintain in the worst possible case.
Table 4.
Risk of inflammation and burns; minimum safe distance for each welding pass possible. Usable as a quick reference in the worst possible case.
We can further extend the concept of “safety first” (again, sacrificing accuracy in favor of memory) by reducing all this data to general guidelines representing the most unfavorable conditions. In conclusion, maintaining the minimum safe distance obtained in this study helps avoid the production of flammable gases within an acceptable margin of safety. Specifically, in this case, to prevent naval fuel from igniting due to contact with heat from the plate being worked on, that distance is 250 mm.
Similarly, the distance to maintain to prevent burns to workers on unprotected areas of their body is 350 mm from the weld seam.
These two distances can be relayed to the workforce to remember as a “rule of thumb” minimum safe distance to maintain to reduce the risks associated with their challenging work conditions at a shipyard or at sea.
4. Conclusions
The main objective of this study was to investigate heat dispersion in welding operations on naval plates to establish parameters that increase safety in practice.
Three naval plate thicknesses were studied because, although one might assume that the lower the thickness, the more heat, due to the number of required passes increasing with thickness, a different result can be obtained: heat actually increases with thickness.
Of note, the most unfavorable case was always taken into account (always within the framework of sound professional practice using the most common materials and thicknesses), so our results inevitably err on the side of caution.
To take the most unfavorable scenario into account, the welds were performed under the most unfavorable conditions. A vertical welding position, starting from the bottom and welding against gravity, is slow, has limited pass length, and thus generates greater amounts of heat. The material preparation phase was limited to the duration required to set up auxiliary materials, which are essential for welding but did not allow for complete cooling. The time between passes was limited to just the time needed to remove the slag and to perform essential technical tasks to continue welding, again, not allowing for complete cooling. All of these factors can occur in different situations in real working conditions under time constraints; therefore, we decided to combine them all to generate the worst-case scenario.
Graphs of the minimum safe distance to maintain were presented in the previous section for each case, so workers and technicians can make informed decisions for each case.
In addition to these specific tables for each thickness and number of passes, quick reference tables were presented for the most unfavorable cases in each number of passes, regardless of thickness, in a way that is easier to remember. Having a table or similar resource at hand is less precise but allows for a smaller amount of documentation to be carried around.
Finally, taking this criterion to the extreme, two unique distances that take into account the most unfavorable conditions were provided in a way that is easily memorized, even by a lone worker or technician, thus ensuring greater safety, even at the end of a long, fatiguing working day.
Author Contributions
Conceptualization, R.J.H.d.l.I.; methodology, R.J.H.d.l.I.; software, R.J.H.d.l.I.; validation, J.C.M.-R., J.L.C.-R., and H.Q.-P.; formal analysis, J.C.M.-R.; investigation, R.J.H.d.l.I.; resources, R.J.H.d.l.I.; data curation, R.J.H.d.l.I.; writing—original draft preparation, R.J.H.d.l.I.; writing—review and editing, J.C.M.-R.; visualization, J.L.C.-R. and H.Q.-P.; supervision, J.L.C.-R. and H.Q.-P.; project administration, J.L.C.-R. and H.Q.-P.; funding acquisition, R.J.H.d.l.I. All authors have read and agreed to the published version of the manuscript.
Funding
This research received no external funding.
Institutional Review Board Statement
Not applicable.
Informed Consent Statement
Not applicable.
Data Availability Statement
The raw data supporting the conclusions of this article will be made available by the authors on request.
Conflicts of Interest
The authors declare no conflicts of interest.
References
- Ghasemi, F.; Doosti-Irani, A.; Aghaei, H. Applications, Shortcomings, and New Advances of Job Safety Analysis (JSA): Findings from a Systematic Review. Saf. Health Work 2023, 14, 153–162. [Google Scholar] [CrossRef] [PubMed]
- Feng, X.; Tian, W.; Wei, R.; Pan, B.; Chen, Y.; Chen, S. Application of a Wall-Climbing, Welding Robot in Ship Automatic Welding. J. Coast. Res. 2020, 106, 609. [Google Scholar] [CrossRef]
- Islam, R.; Khan, F.; Abbassi, R.; Garaniya, V. Human Error Probability Assessment During Maintenance Activities of Marine Systems. Saf. Health Work 2018, 9, 42–52. [Google Scholar] [CrossRef] [PubMed]
- Baek, S.-Y.; Nam, J.-H. Physical Welding Factors for Reclassified Welding Positions in Shipbuilding Assembly Process Based on Muscle Activity Measured by Surface Electromyography. J. Mar. Sci. Eng. 2021, 9, 1211. [Google Scholar] [CrossRef]
- Yuan, Y.; Yamazaki, K.; Suzuki, R. Relationship between Penetration and Porosity in Horizontal Fillet Welding by a New Process “Hybrid Tandem MAG Welding Process”. Weld. World 2016, 60, 515–524. [Google Scholar] [CrossRef]
- Wang, H.; Liu, H.; Shao, S.; Zhang, Z. Methodology of Shipboard Spare Parts Requirements Based on Whole Part Repair Strategy. Mathematics 2024, 12, 3053. [Google Scholar] [CrossRef]
- Hong, T.S.; Ghobakhloo, M. Safety and Security Conditions in Welding Processes. In Comprehensive Materials Processing; Elsevier: Amsterdam, The Netherlands, 2014; pp. 213–225. [Google Scholar]
- Ren, J.; Yue, Y.; Zhang, X.; Yang, Z.; Liu, Z.; Dong, Y.; Ma, J.; Liu, C.; Ma, J. Investigation of Welding-Induced Residual Stresses in a Herringbone Column Using the Blind Hole Technique: An Experimental and Numerical Study. Buildings 2025, 15, 398. [Google Scholar] [CrossRef]
- Ahola, A.; Lipiäinen, K.; Lindroos, J.; Koskimäki, M.; Laukia, K.; Björk, T. On the Fatigue Strength of Welded High-Strength Steel Joints in the As-Welded, Post-Weld-Treated and Repaired Conditions in a Typical Ship Structural Detail. J. Mar. Sci. Eng. 2023, 11, 644. [Google Scholar] [CrossRef]
- Yang, Q.; Dong, Y.; Zhang, R.; Fu, Q.; Chen, J.; Chen, J.; Zhang, X.; Fu, Y.; Chen, H. Effects of Spatial Welding Positions on Arc Bubble Behavior, Droplet Transfer Process, and Weld Microstructure and Properties in Underwater Wet Welding. J. Manuf. Process. 2025, 135, 46–68. [Google Scholar] [CrossRef]
- Al-Jumaili, S.A.K.; Al-Mukhtar, A.M.; Fahem, A. Effect of Heat Treatments on 302 Austenitic Stainless Steel Spot Weld. Adv. Eng. Forum. 2018, 29, 19–25. [Google Scholar] [CrossRef]
- Jo, W.; Woo, I.; Mikami, Y.; An, G. Residual Stress Characteristics in Spot Weld Joints of High-Strength Steel: Influence of Welding Parameters. Appl. Sci. 2024, 14, 11971. [Google Scholar] [CrossRef]
- Park, R.M. Risk Assessment for Metalworking Fluids and Respiratory Outcomes. Saf. Health Work 2019, 10, 428–436. [Google Scholar] [CrossRef] [PubMed]
- ASTM A131/A131M-19; Standard Specification for Structural Steel for Ships. ASTM International: West Conshohocken, PA, USA, 2019.
- Guo, W.-G.; Gao, X. On the Constitutive Modeling of a Structural Steel over a Range of Strain Rates and Temperatures. Mater. Sci. Eng. A 2013, 561, 468–476. [Google Scholar] [CrossRef]
- Burca, M.; Seculin, R.C.; Țunea, D. The Technological Comparative Analysis between the Vertical MAG Welding with Solid Wire and with Cored Wire. Adv. Mater. Res. 2015, 1128, 199–208. [Google Scholar] [CrossRef]
- Liu, D.; Wang, J.; Zhang, Y.; Kannan, R.; Long, W.; Wu, M.; Wang, Y.; Li, L. Effect of Mo on Microstructure and Wear Resistance of Slag-Free Self-Shielded Metal-Cored Welding Overlay. J. Mater. Process. Technol. 2019, 270, 82–91. [Google Scholar] [CrossRef]
- Bembenek, M.; Prysyazhnyuk, P.; Shihab, T.; Machnik, R.; Ivanov, O.; Ropyak, L. Microstructure and Wear Characterization of the Fe-Mo-B-C—Based Hardfacing Alloys Deposited by Flux-Cored Arc Welding. Materials 2022, 15, 5074. [Google Scholar] [CrossRef] [PubMed]
- O’Brien, A.; Guzman, C. Welding Handbook Volume 2—Part 1: Welding Processes, 9th ed.; American Welding Society: Miami, FL, USA, 2004; ISBN 978-0-87171-053-6. [Google Scholar]
- Jeffus, L. Flux Cored Arc Welding. Welding: Principles and Applications, 7th ed.; Cengage Learning: New York, NY, USA, 2012; ISBN 9781111039172. [Google Scholar]
- Ferreira, D.M.B.; Alves, A.d.N.S.; Cruz Neto, R.M.d.A.; Martins, T.F.; Brandi, S.D. A New Approach to Simulate HSLA Steel Multipass Welding through Distributed Point Heat Sources Model. Metals 2018, 8, 951. [Google Scholar] [CrossRef]
- Czupryński, A. Comparison of Properties of Hardfaced Layers Made by a Metal-Core-Covered Tubular Electrode with a Special Chemical Composition. Materials 2020, 13, 5445. [Google Scholar] [CrossRef] [PubMed]
Disclaimer/Publisher’s Note: The statements, opinions and data contained in all publications are solely those of the individual author(s) and contributor(s) and not of MDPI and/or the editor(s). MDPI and/or the editor(s) disclaim responsibility for any injury to people or property resulting from any ideas, methods, instructions or products referred to in the content. |
© 2025 by the authors. Licensee MDPI, Basel, Switzerland. This article is an open access article distributed under the terms and conditions of the Creative Commons Attribution (CC BY) license (https://creativecommons.org/licenses/by/4.0/).