1. Introduction
Side impact resistance is a complex problem due to the lack of space in the side areas of the car and the incredibly short time available to sense the impact and activate the side airbag system. Therefore, engineers and researchers in the automotive industry are tasked with finding effective methods and technologies for side impacts in cars. On the one hand, there are destructive impact simulators, where a crash is simulated under various circumstances in a controlled environment, which are developed by specialized organizations such as NCAP (New Car Assessment Program). These programs are responsible for determining the safety level that a new car offers to its occupants and pedestrians in the event of an impact. NCAP organizations are responsible for evaluating the bodywork, technologies, and systems that automotive manufacturers offer to avoid accidents (active safety) and when impacts are generated (passive safety). In this way, it is exposed how effective an active or passive safety system is, and the interest in continuous improvement arises. Impact tests are carried out using impact simulators in a controlled environment, and these involve frontal, lateral, and rear crashes and structural anti-rollover resistance (roof crush) [
1,
2].
Experimental and numerical simulation research work plays an essential role in proposing solutions, improvements, and alternatives to the devices and components that make up the airbag system [
3]. F. Bandak et al. developed an airbag testing system to study the interaction of airbags with occupants during repeatable deployments of these against targets at various separation distances. They found that the maximum deployment speed is 6.7 m/s (24.12 km/h) in a time of 40 ms [
4]. Stefan M. and collaborators created the airbag deployment system designed for experimental testing. It consists of a pressure vessel and a valve arrangement with pneumatic and electrical controls. The main advantage of this system is that it can vary internal pressure, avoiding the dangerous use of pyrotechnics, and they found deployment speeds of approximately 20 m/s (72 km/h), 40 m/s (144 km/h), and 60 m/s (216 km/h) [
5]. David Breed et al. developed a suction inflator system with a system configured to inflate a 50 L airbag in 30 ms with a supersonic pulse ejector as a suction inflator, and, using a high-speed camera, they found deployment times of 30, 35, and 40 ms [
6]. Hideo Omura and collaborators found that the pressure waveform of the airbag when it is inflated, determines the level of protection it offers to the occupants, and they analyzed that the inflation of the airbag occurs in 30 ms when the waveform reaches a second peak [
7]. Min Nie et al. designed a platform to generate multi-channel analog acceleration signals of airbag ignition. The developed platform can accurately simulate the acceleration waveforms collected in collision experiments [
8]. A. Haussian et al. carried out a Vehicle Accident Analysis for the airbag deployment decision of a simulated impact model and its algorithm to detect it, as well as its severity factor and airbag deployment management [
9]. The design of an airbag system test protocol by interpreting operating oscillograms was developed by Luis X. Orbea et al., who took data from the speed sensors, impact sensors, control module, system wiring, contactor coil, and connection harness using a multimeter, an automotive scanner, and an oscilloscope [
10].
Honglu Zhang et al. state that side impact detection systems typically detect impact conditions within 6–13 ms compared to 15–25 ms for frontal impact detection systems. The inflation time of curtain airbags is also shorter (20–30 ms) compared to the 45 ms required for frontal ones [
11]. Anand S. et al. studied the kinematics of deployment from the front side of a seat during the first 8 ms using a numerical simulation. Airbag expansion occurs at approximately 3.5 ms. The airbag fully exits the canopy at approximately 6 ms and is fully inflated at approximately 8 ms [
12]. Yong-Won Yun et al. described a curtain airbag design procedure using optimization methods to reduce occupant head injury levels and found a maximum HIC value of 117.40 and a deployment time of 44 ms [
13]. Jeong Keun Lee and collaborators standardized a CAE test setup to evaluate curtain airbag energy absorption and establish criteria for compliance with FMVSS 226 and NCAP, and they determined a deployment time of 30 ms [
14]. The simulation of an integrated CAE and test application methodology for the development of curtain airbags was performed by Nirmal N. et al., who proposed a numerical analysis methodology for curtain airbags using LS-Dyna
® software version R11.0., which reproduces parameters and conditions of the FMVSS201 standard [
15]. They used a freely moving test head, which represents the free movement of the occupant in an actual crash at an impact speed of 24–29 km/h [
16].
Furthermore, there are some numerical evaluation works related to the automotive area and the interest in quantifying the lesions under different situations inside a car cabin. A numerical dolly rollover evaluation using a Damping-Harmonic System with a Low Back Booster to reduce injuries in a six-year-old child was performed by Jaramillo Cruz et al. The study was conducted using the LS-Dyna
® version R11.0. during an interval of 1 s, and the boundary conditions were set by the FMVSS 213 and FMVSS 208 [
17]. Torres-SanMiguel, C.R. developed research to show the study of movement, forces, and interactions within the human body to enhance performance, prevent injuries, and create innovative solutions for various trades through three case studies in the context of biomechanics [
18]. A numerical simulation of mechanical coupling for the Low-Back Booster with a 6-year-old child during a crash test performed by Jaramillo Cruz et al. evaluates the behavior of the mechanism according to the FMVSS 213 standard [
19] and injuries generated in the head, neck, and thorax with a six-year-old Hybrid III dummy model [
20]. Islas Lara et al. assessed the retention system effects of level III armored vehicles. They analyzed the displacement suffered by the armored vehicle during an impact and made dynamic analyses to quantify the head injury criterion (HIC) and chest severity index (CSI) on a 50th percentile dummy [
21]. Similar studies for the same dummy size, but at low speeds up to 20 km/h, are presented in [
22]. Rueda et al. designed an articulated low-cost artificial neck with sensors to assess impact head-neck injuries [
23]. Mijail A. et al. developed research based on the nonlinear explicit dynamic simulation of a frontal impact of a bus to analyze the resistance of the structure configuration [
24]. Mexquititla et al. conducted intercity bus occupant safety research, which shows numerical simulations representing frontal and rear collisions and bus seats, and a 50-percentile Hybrid III dummy is evaluated with LS-Dyna software version R11.0. The results showed the Head Injury Criteria (HIC) and Chest Severity Index (CSI) [
25]. A numerical simulation of a 2D harmonic oscillator as a coupling system for child restraint systems was performed by Marinez Miranda et al. to reduce the deceleration rates for the body of a child during a frontal crash [
26]. López García et al. carried out a numerical assessment of a safety system to minimize Injuries during a cyclist run-over and determined the HIC and Combined Thoracic Index (CTI) using LS-Dyna
® version R11.0. [
27]. An Aortic Blunt Trauma Analysis during a Frontal Impact was performed by Grave Capistran et al., and based on the Abbreviated Injury Scale (AIS), the degree of injury to the aorta results in AIS 2 [
28]. Rueda Arreguín et al. developed an impact device for biomechanics of human head–neck injuries with sensors that can monitor force, acceleration, and angular displacement on small and large lateral impact and top impact events [
29,
30].
A series of devices were designed, numerically analyzed, and created to decrease the number of injuries in children and protect them from different vehicle collisions [
31,
32,
33,
34,
35]. For example, the simplified testbed was used to reproduce child facial damage during a frontal collision created by Cuatle Estrada et al. [
36]. A couple of studies into head impacts were developed in order to understand the brain and the brain–spinal system [
37,
38]. A HIC numerical comparison in run-over conditions at different speeds with a sedan vehicle type was carried out by Cortes et al. [
39], and Martinez L. created crash impact dummies adapted to people affected by osteogenesis imperfecta [
40].
Experimental testbeds for frontal airbags have been previously developed to emulate system operation and assess deployment functionality. However, most of these platforms lack the precision needed to replicate real-time sensing and accurate airbag activation parameters. For instance, R. García and S. Salazar [
41] implemented a simplified airbag system composed of three basic subsystems—a power unit, a control module, and an airbag deployment system—primarily for educational purposes. Similarly, C. Tisalema and V. Ramos [
42] proposed a frontal airbag simulator incorporating a control module and various electrical and electronic components. Their simulator operates using pre-programmed parameters such as vehicle speed, impact force, and angle of incidence. While these efforts contribute to understanding airbag mechanics, they are not intended for rigorous experimental evaluation or safety assessment.
In contrast, the Experimental Testbed proposed in this study is specifically designed to overcome these limitations by providing a nondestructive, flexible, and scalable methodology for evaluating curtain airbag systems under realistic conditions. The design process begins with the geometric and dimensional analysis of the side frame structures of multiple vehicle models. From this, an adjustable mechanical structure was engineered, capable of adapting to vehicle segments B, C, D, and E, thus covering a broad portion of the automotive market. Integrated with an advanced control and instrumentation system, the testbed enables repeated and precise testing of curtain airbag deployments. This platform facilitates a detailed analysis of deployment performance and occupant interaction, particularly for child passengers in side impact scenarios. By minimizing the need for destructive crash tests, this experimental system presents a valuable and cost-effective alternative for improving safety evaluations and supporting future design optimization of passive safety systems.
2. Materials and Methods
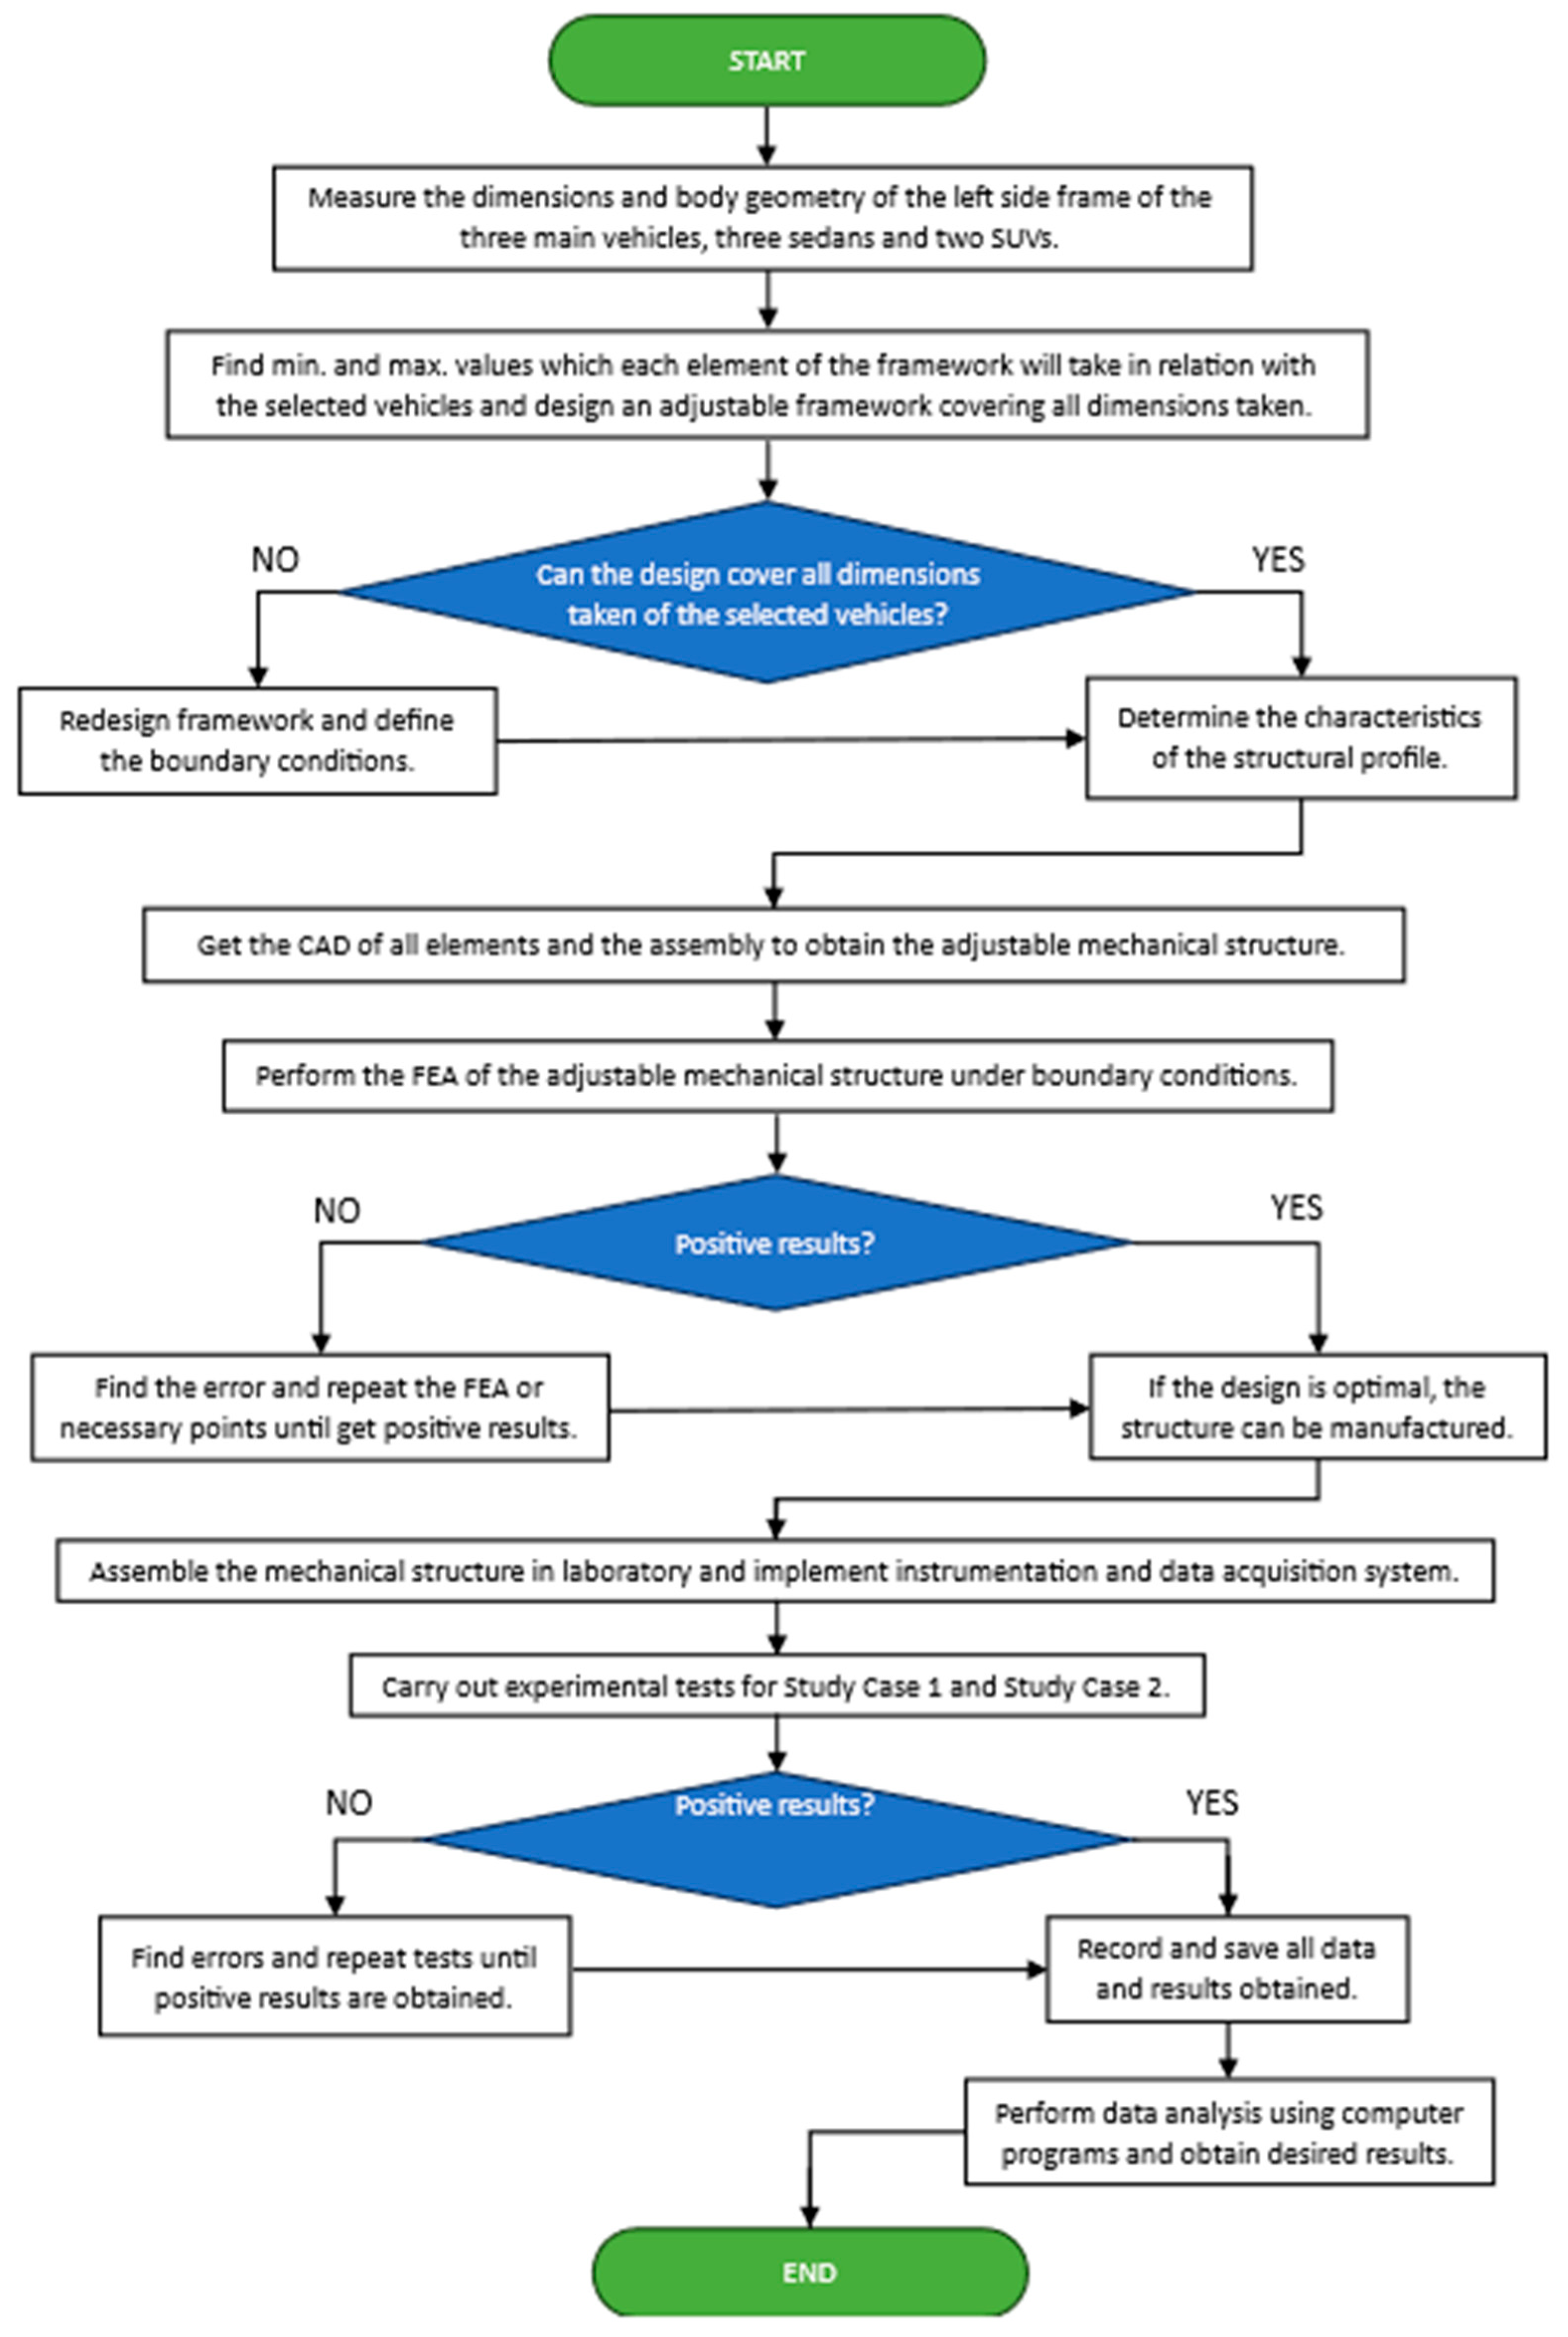
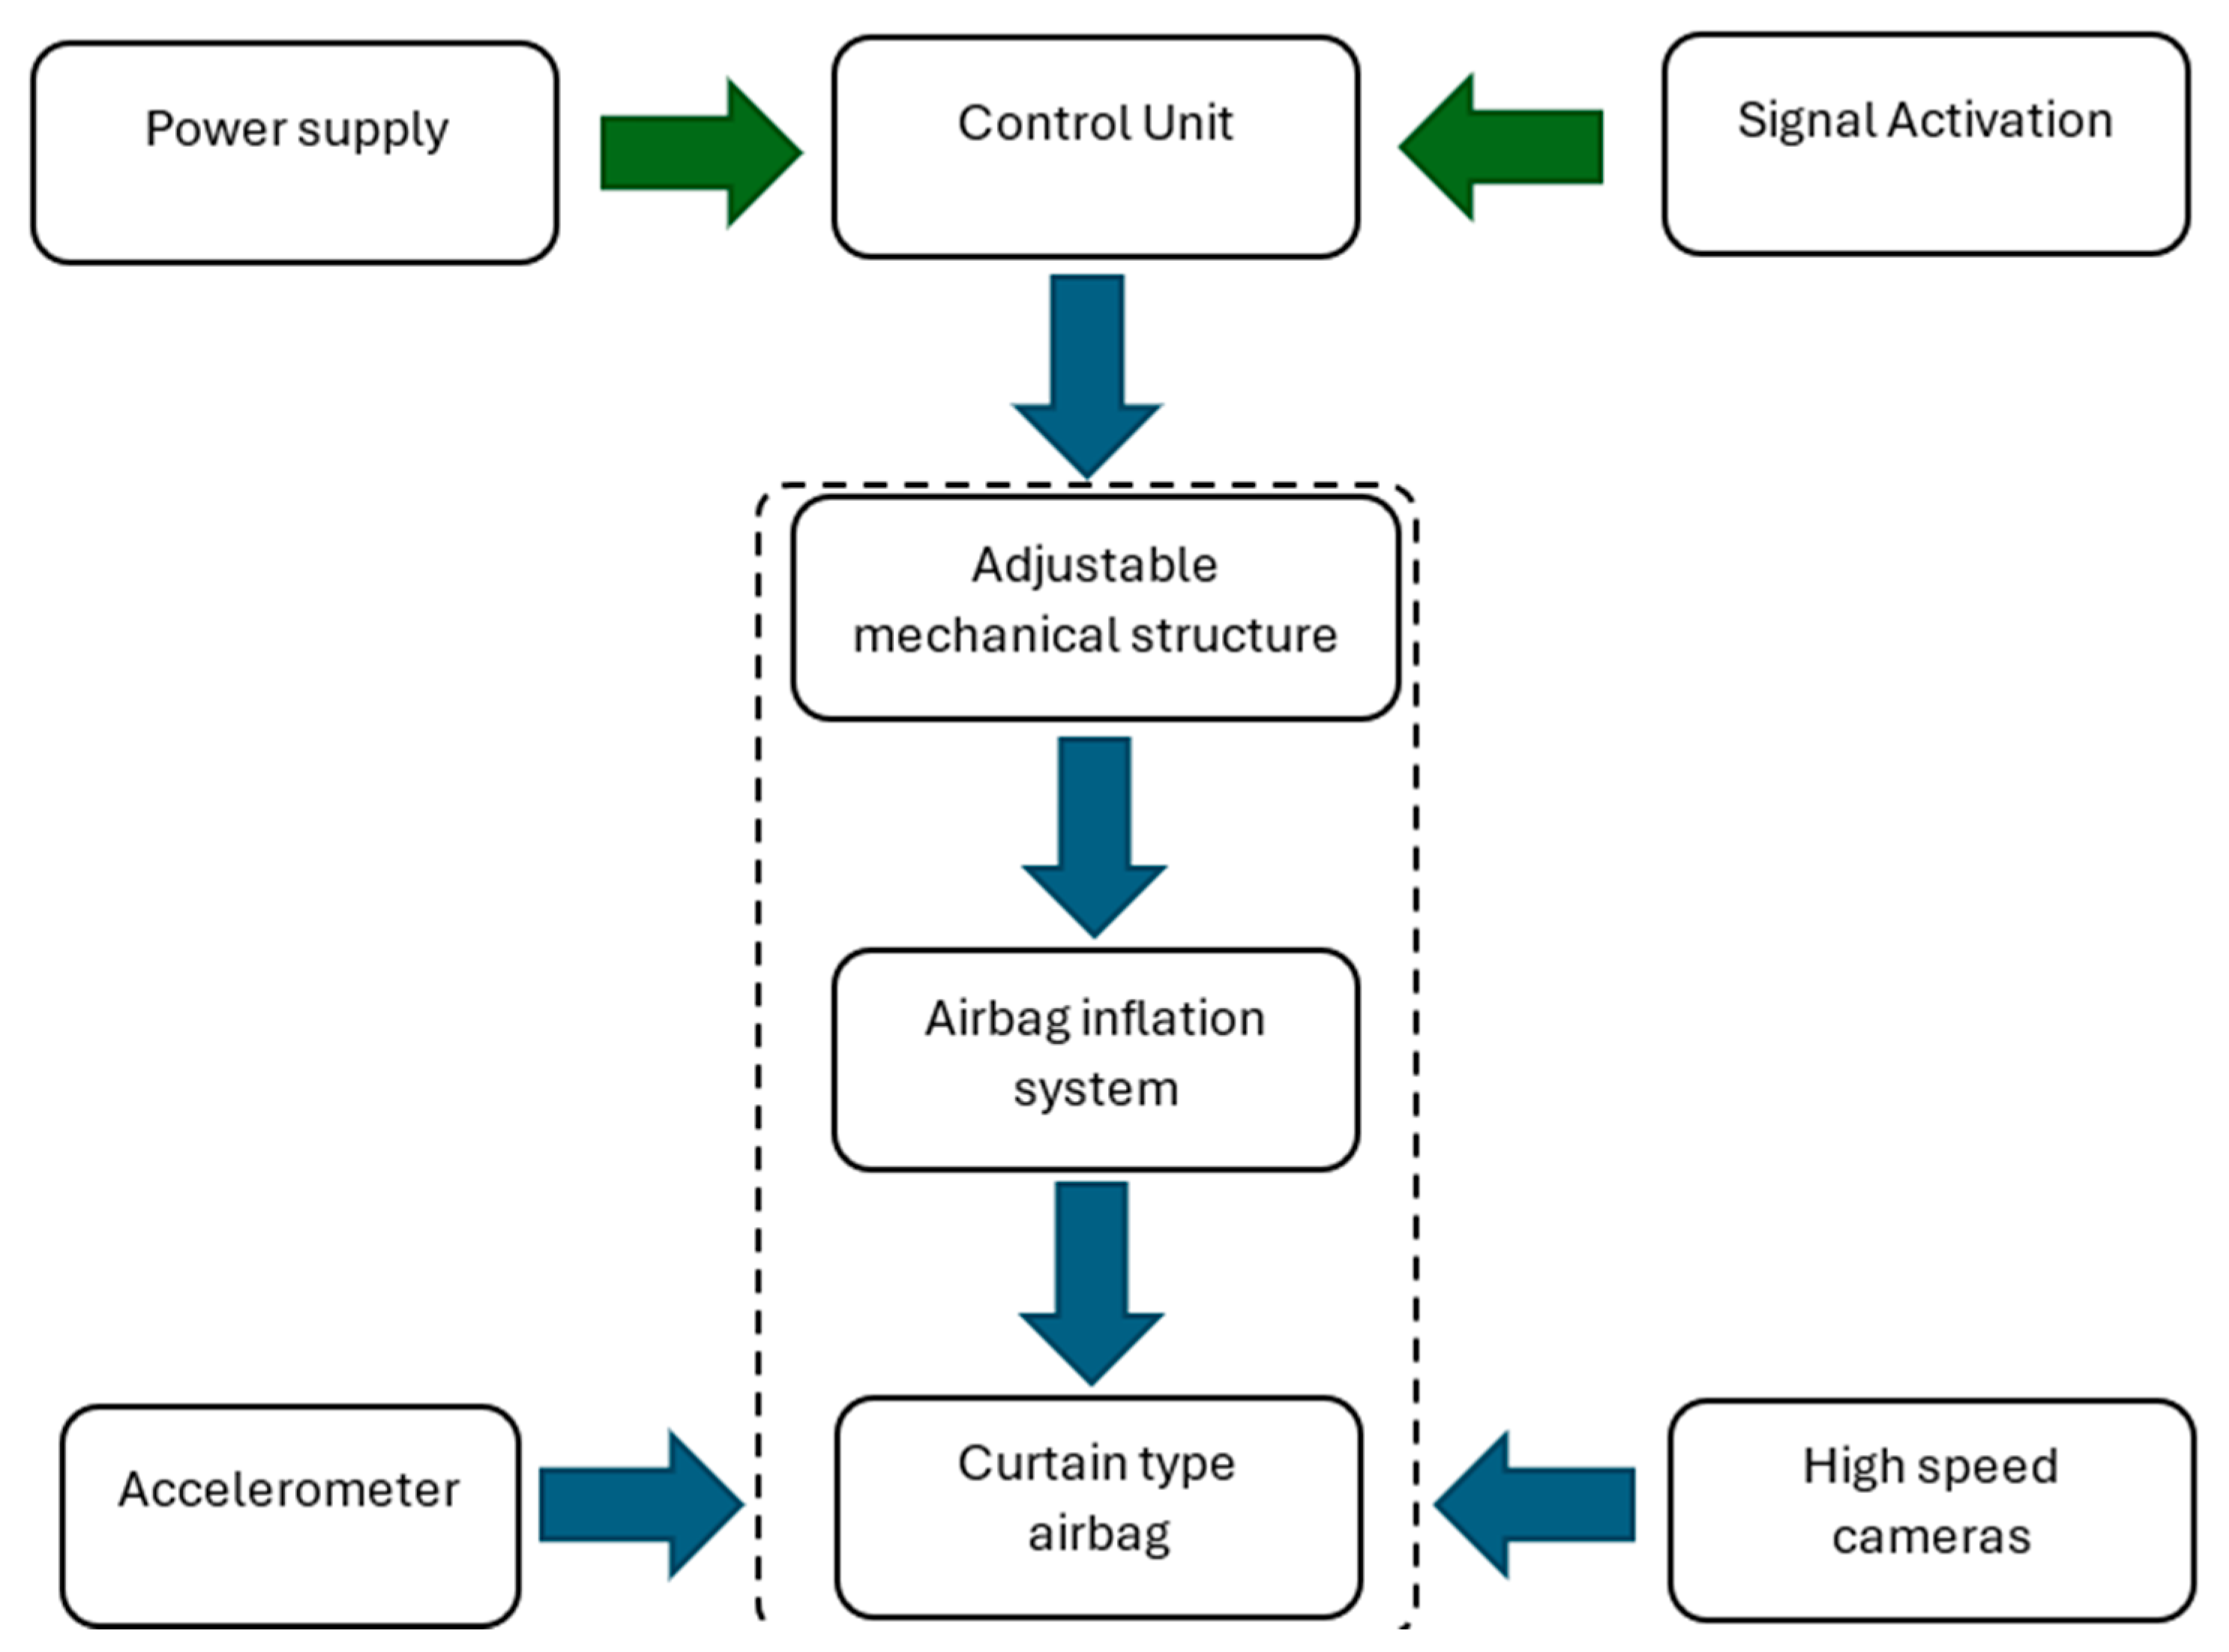
The experimental prototype for curtain airbags has been developed to simulate the side frame structure of a vehicle, with its design grounded in the dimensions and geometry of that structure. The primary objective of this design is to facilitate performance testing of curtain airbags while minimizing the reliance on destructive impact tests and installations within test vehicles. An adjustable mechanical structure was designed to enable the evaluation of a broader range of curtain airbags by allowing for their mounting on the structure. After finalizing the design of the adjustable mechanical structure, its components were fabricated, and by assembling these fabricated elements, the frame of the adjustable mechanical structure was constructed. This structure was then integrated with the necessary instrumentation and data acquisition system to form the complete experimental prototype for curtain airbags.
Figure 1 presents a flowchart illustrating the design proposed for the experimental testbed. It summarizes the sequential stages—from the determination of vehicle dimensions and geometries through CAD modeling and numerical evaluation to the fabrication and experimental testing—demonstrated with two case studies.
Upon finalizing the design of the adjustable mechanical structure, it was confirmed that the system could be adapted to the geometry and dimensions of vehicles within segments B, C, D, and E of the automotive industry. These segments represent a substantial portion of the market, including compact sedans, crossovers, and SUVs. For the initial implementation, the dimensions and geometries of three representative vehicles—Hyundai Creta 2019, Hyundai Creta 2022, and Toyota RAV4 2018—were used as references in the design of the experimental testbed for curtain airbags.
The Hyundai Creta (two generations to capture potential design evolution) and the Toyota RAV4 were likely chosen because they represent popular compact SUV segments with slightly different dimensions and interior geometries. This allows the experimental testbed to be more versatile and the results to be more broadly applicable to a significant portion of the vehicle market, enhancing the relevance of the curtain airbag research. By selecting these three vehicles, the testbed design can describe the following variables:
Overall Length, Width, and Height: These dimensions directly impact the interior cabin volume and the potential deployment space for the curtain airbag.
Roofline and Pillar Design (A, B, C pillars): The shape and angle of these structural elements are crucial for how the curtain airbag deploys and provides protection.
Window Size and Shape: The airbag needs to effectively cover the side windows to prevent occupant ejection and contact with external objects.
Interior Trim and Paneling: The design of the door panels, roof lining, and pillar trims can influence the airbag’s deployment path and effectiveness.
The dimensions of the three primary vehicles were directly obtained from their technical specifications and are presented in
Table 1.
Since the design of the experimental prototype for curtain airbags simulates the dimensions and geometry of the side frame of the vehicle body, a series of measurements were made in the Solidworks 2021
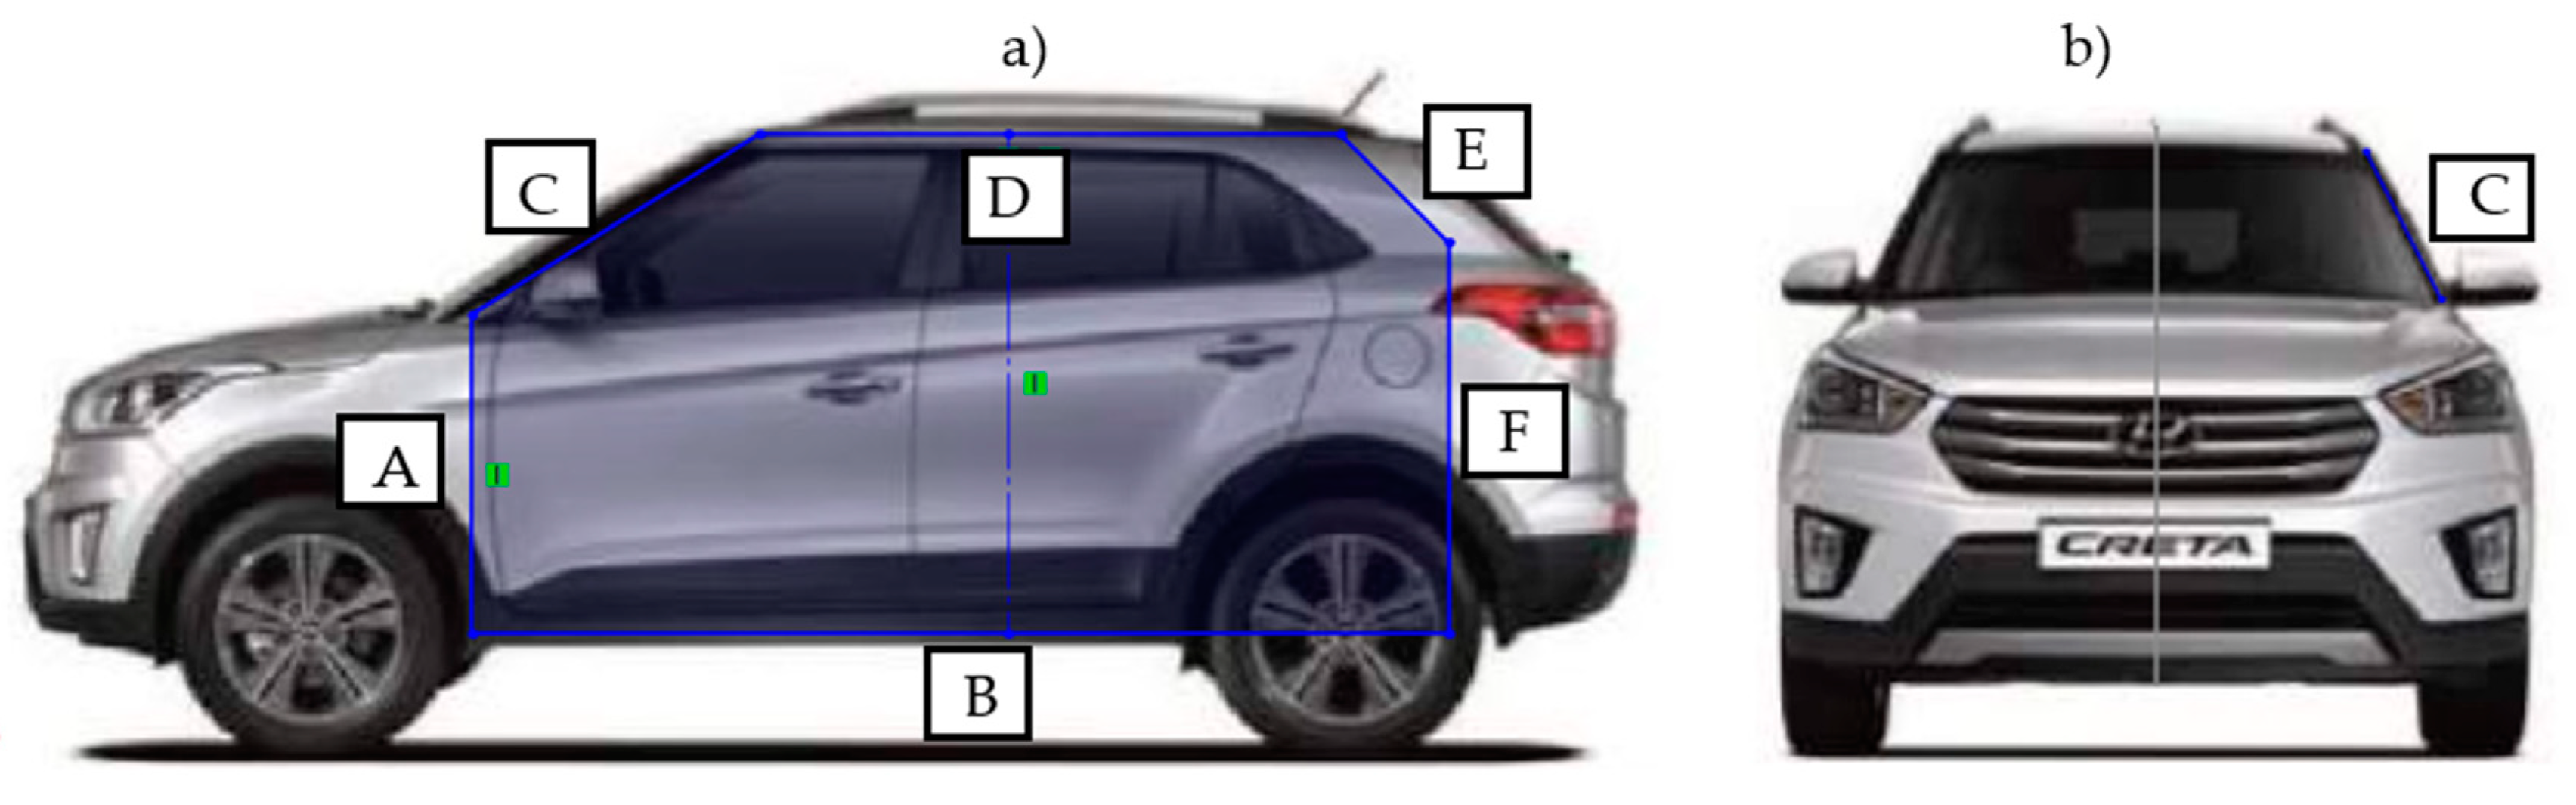
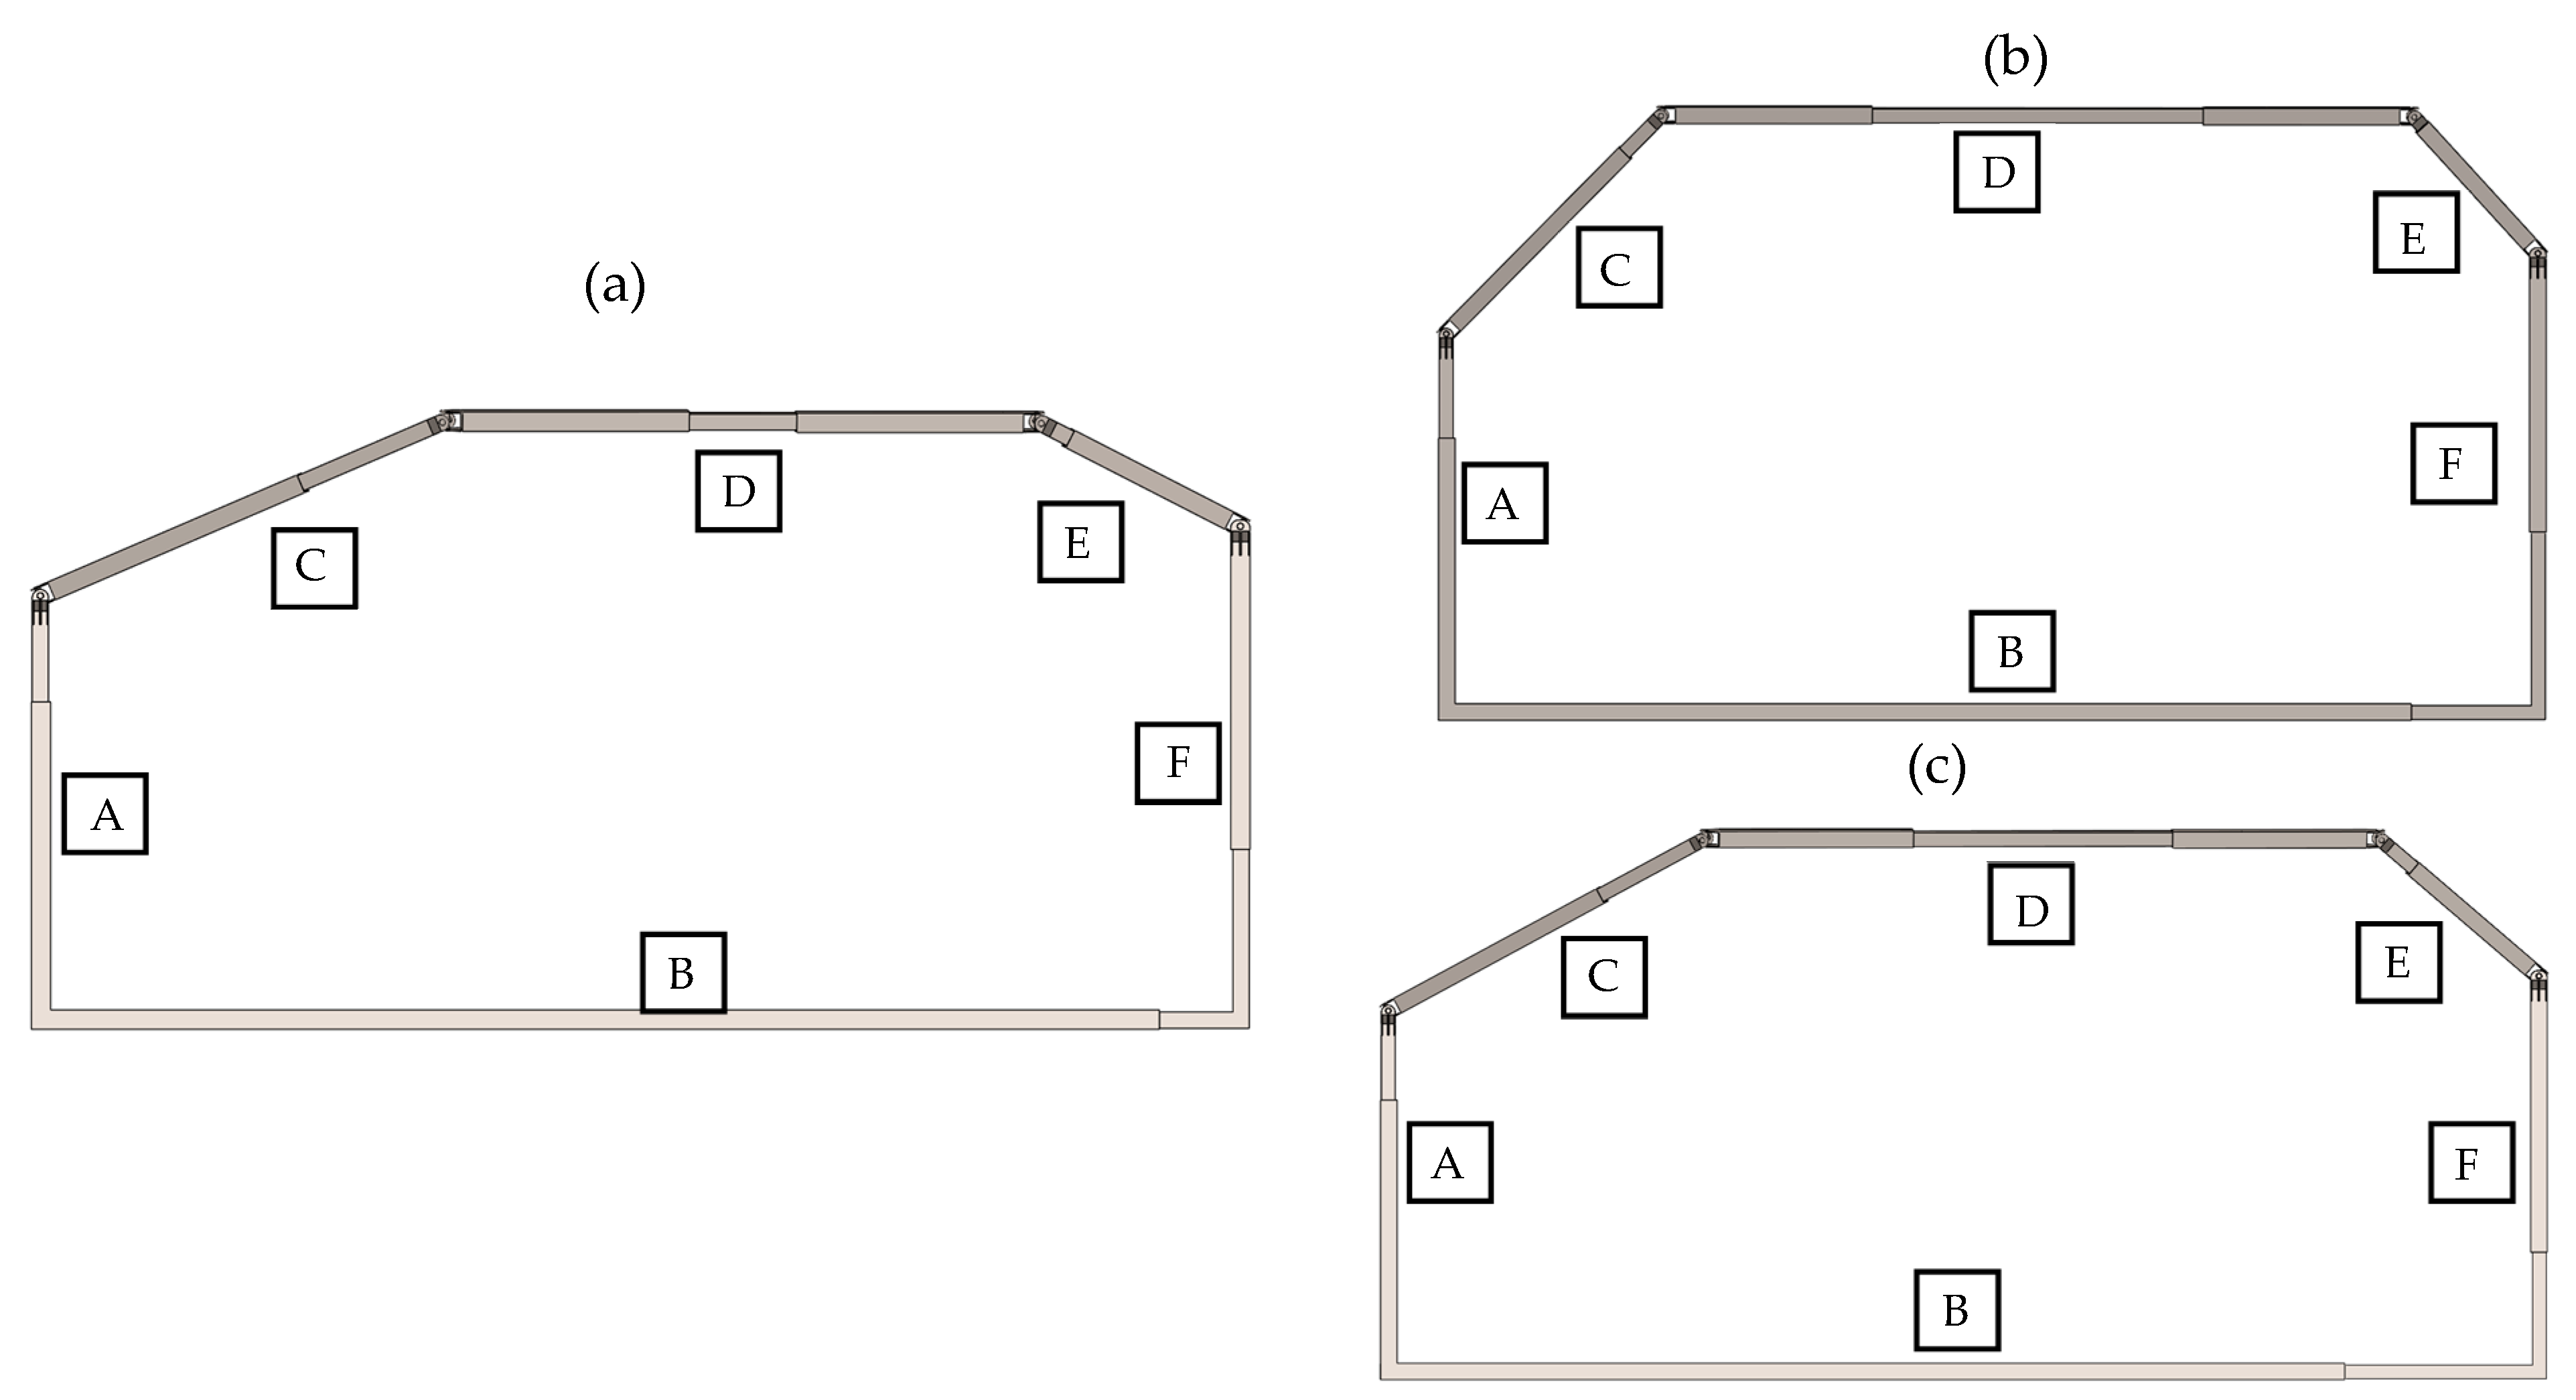
® SP5.0 software to meet the design objective. This process required utilizing the sketch image tool, where a pair of images for each selected vehicle model was extracted directly from their respective technical specifications. The chosen images corresponded to the left-side view and the front view, allowing for the accurate determination of the dimensions and geometry of the side body structure. Presented below are the silhouettes of the geometries that were followed to ascertain the specific measurements needed for implementation in the experimental prototype, which represents the side frame structure of each selected vehicle. The first vehicle, the Hyundai Creta 2019, is a compact SUV categorized as being in the Type B segment of the vehicle market [
46].
Figure 2a illustrates the silhouette traced from the side view of the vehicle, which was used to determine the geometry and dimensions for the design of the experimental testbed for curtain airbags.
Figure 2b shows the front view of the vehicle, along with the line segment incorporated into the sketch to determine the slope of the vehicle’s roofline, starting from the windshield and extending to the roof. This process was executed using the Solidworks
® 2021 SP5.0 sketching tool and scaling according to the vehicle’s total length (
Table 1).
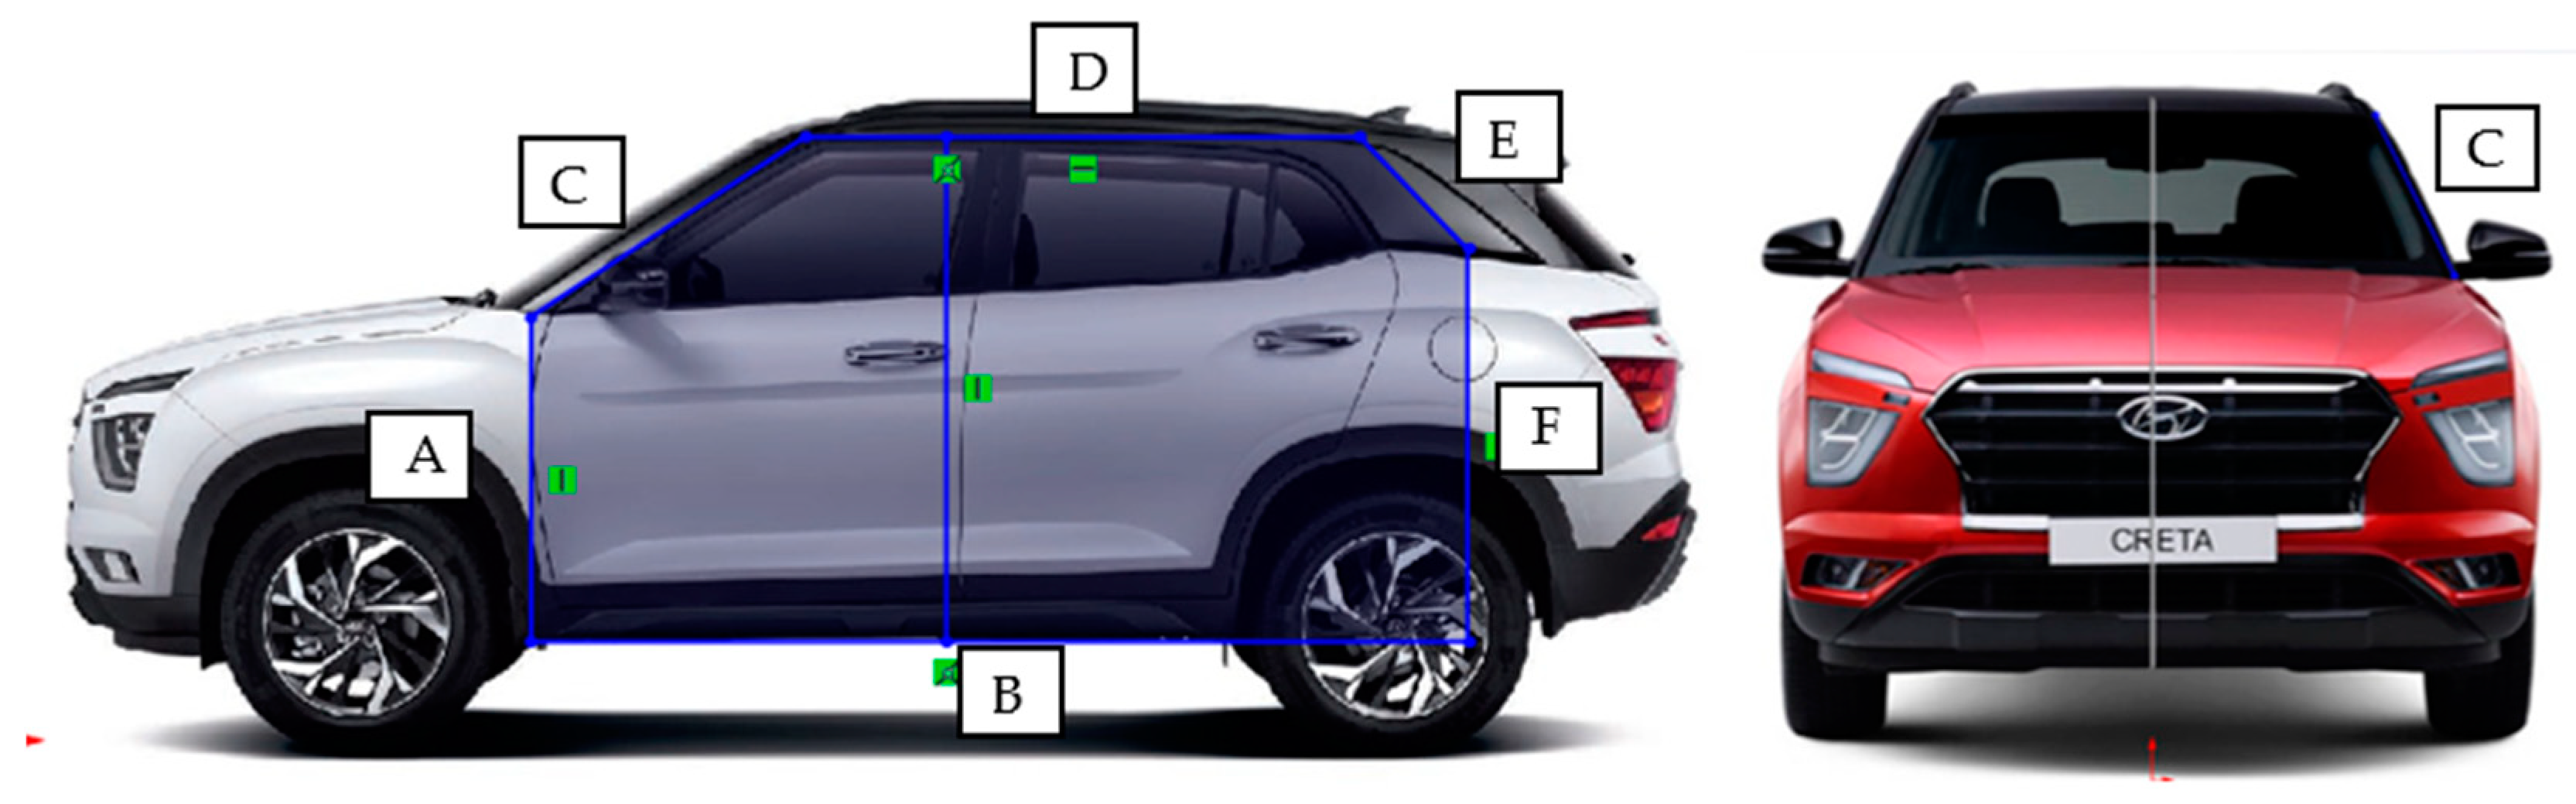
The second vehicle selected is the Hyundai Creta 2022, which belongs to the same segment as the 2019 model.
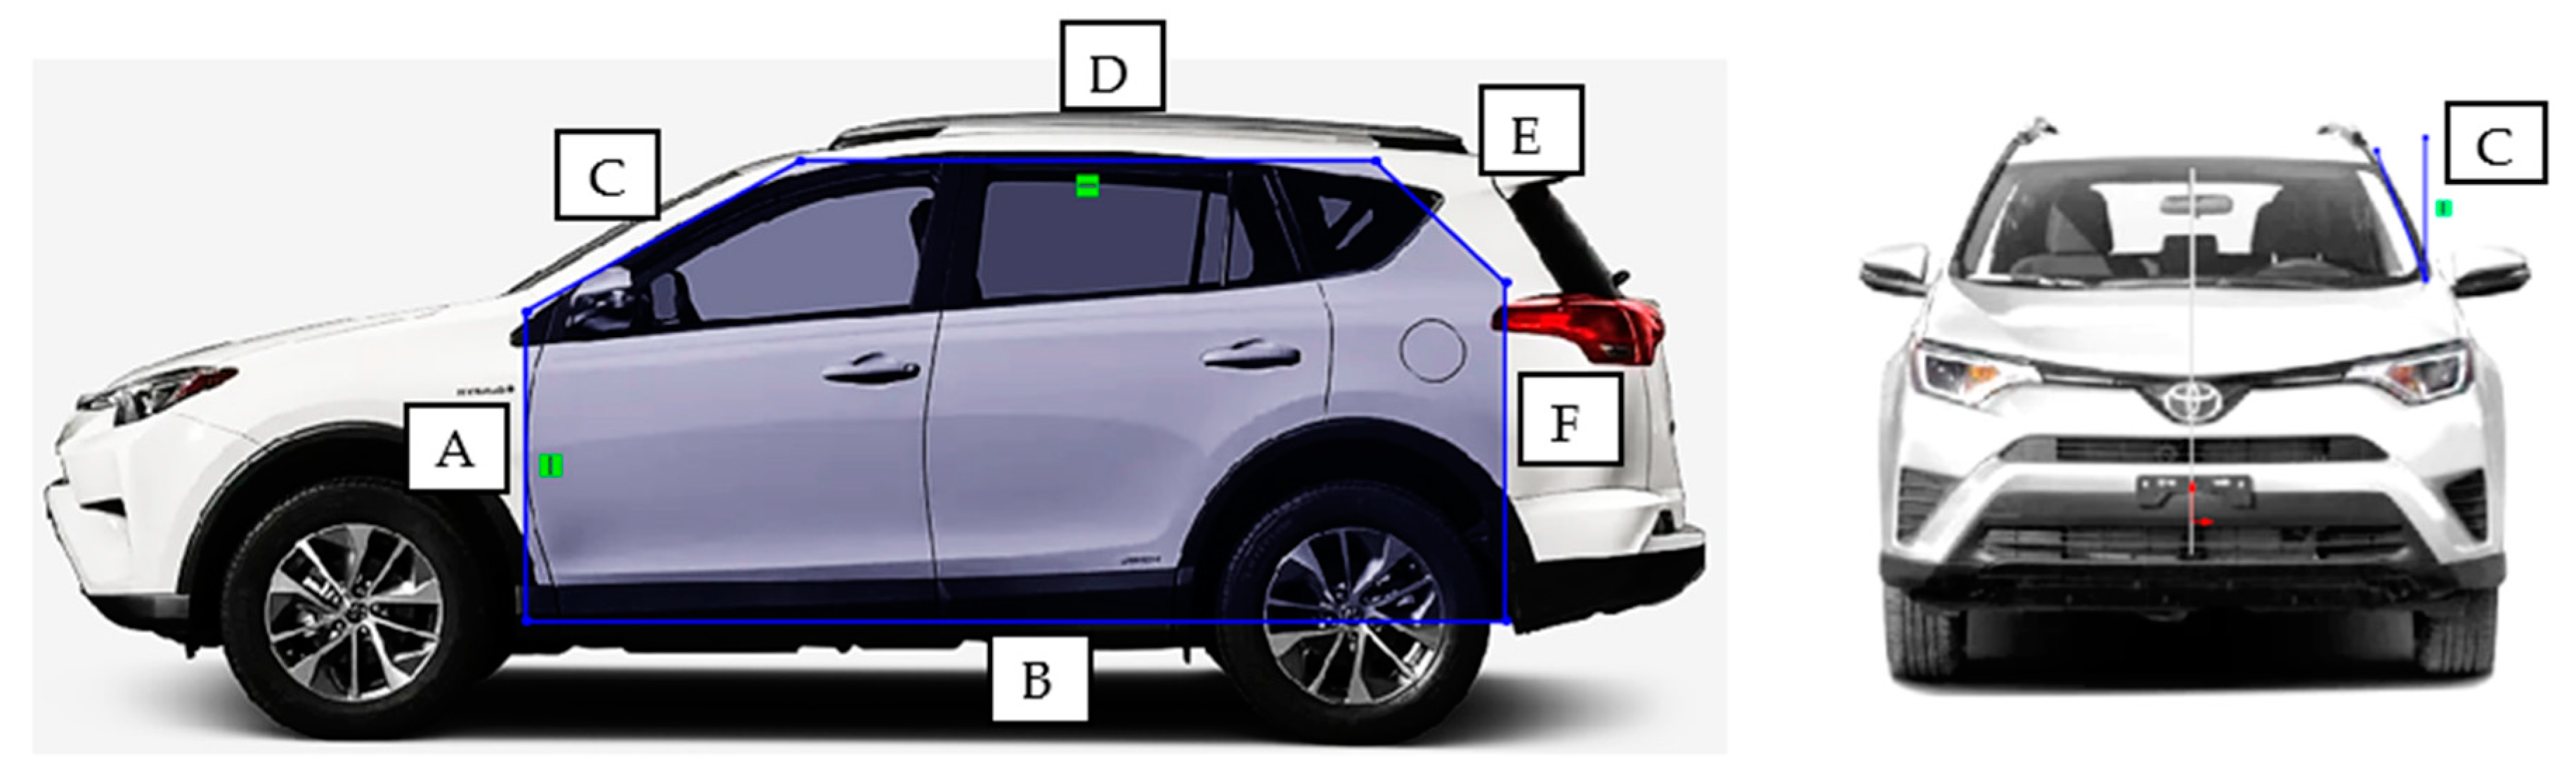
Figure 3 presents the silhouette traced from both the side and front views of the vehicle, which were used to determine the geometry and dimensions for the design of the experimental prototype. The third vehicle selected is the Toyota RAV4 2018, categorized as a Type C Segment SUV (commonly referred to as a C-SUV) in the automotive market [
45].
Figure 4 illustrates the silhouette obtained from both the side and front views of the vehicle, which were used to determine the geometry and dimensions that will be incorporated into the design.
Figure 2,
Figure 3 and
Figure 4 illustrate the silhouette that defines the geometry to be adopted by the experimental prototype for curtain airbags. Each line segment in the silhouettes, drawn from the front and side views of the vehicle, is annotated with a specific nomenclature.
Table 2 details the meaning of each letter in the nomenclature used in
Figure 2,
Figure 3 and
Figure 4, integrating the dimension and position values for the three main selected vehicles. This approach facilitates a comprehensive understanding and helps determine the dimensions of the adjustable mechanical structure proposed in the prototype design.
Where S. V. refers to Side View and F. V. refers to Front View, angles are measured with respect to the vertical. The modeling of the mechanical structure for the experimental prototype of curtain airbags was conducted using Solidworks 2021
® SP5.0. Each component of the mechanical structure was modeled based on the measurements obtained from sketches of the side and front views of the selected vehicles. However, these measurements serve only as a reference for determining the dimensions that the adjustable mechanical structure included.
Table 3 presents the minimum and maximum dimensions that the adjustable mechanical structure is designed to accommodate.
An analytical calculation was performed to determine the dimensions and gauge of the structural profile. This basic procedure involves a static analysis of one of the arms of the adjustable mechanical structure, selecting element E for evaluation. According to Hideo Omura et al. [
7], an airbag generates a deployment force of approximately 7000 Newtons. Upon completion of the static analysis, a design based on the NTC-Acero-2020 standard [
46] is proposed to establish the structural profile characteristics. The design of the adjustable mechanical structure suggests the use of a Rectangular Tubular Profile (RTP) made from ASTM A36 [
47] structural steel. For adjustability, two different profile sizes were selected: the outer profile measures 1 1/2″ with a 14-gauge thickness, and the inner profile measures 1 1/4″ with an 11-gauge thickness. This configuration achieves an assembly tolerance of 2.45 mm between each nested segment.
Figure 5 displays an exploded diagram of the components comprising the adjustable mechanical structure for the experimental testbed designed for curtain airbags.
Figure 6 presents images of the mechanical structure, modeled and adjusted to match the dimensions and positions corresponding to the body frames of each of the three selected vehicles.
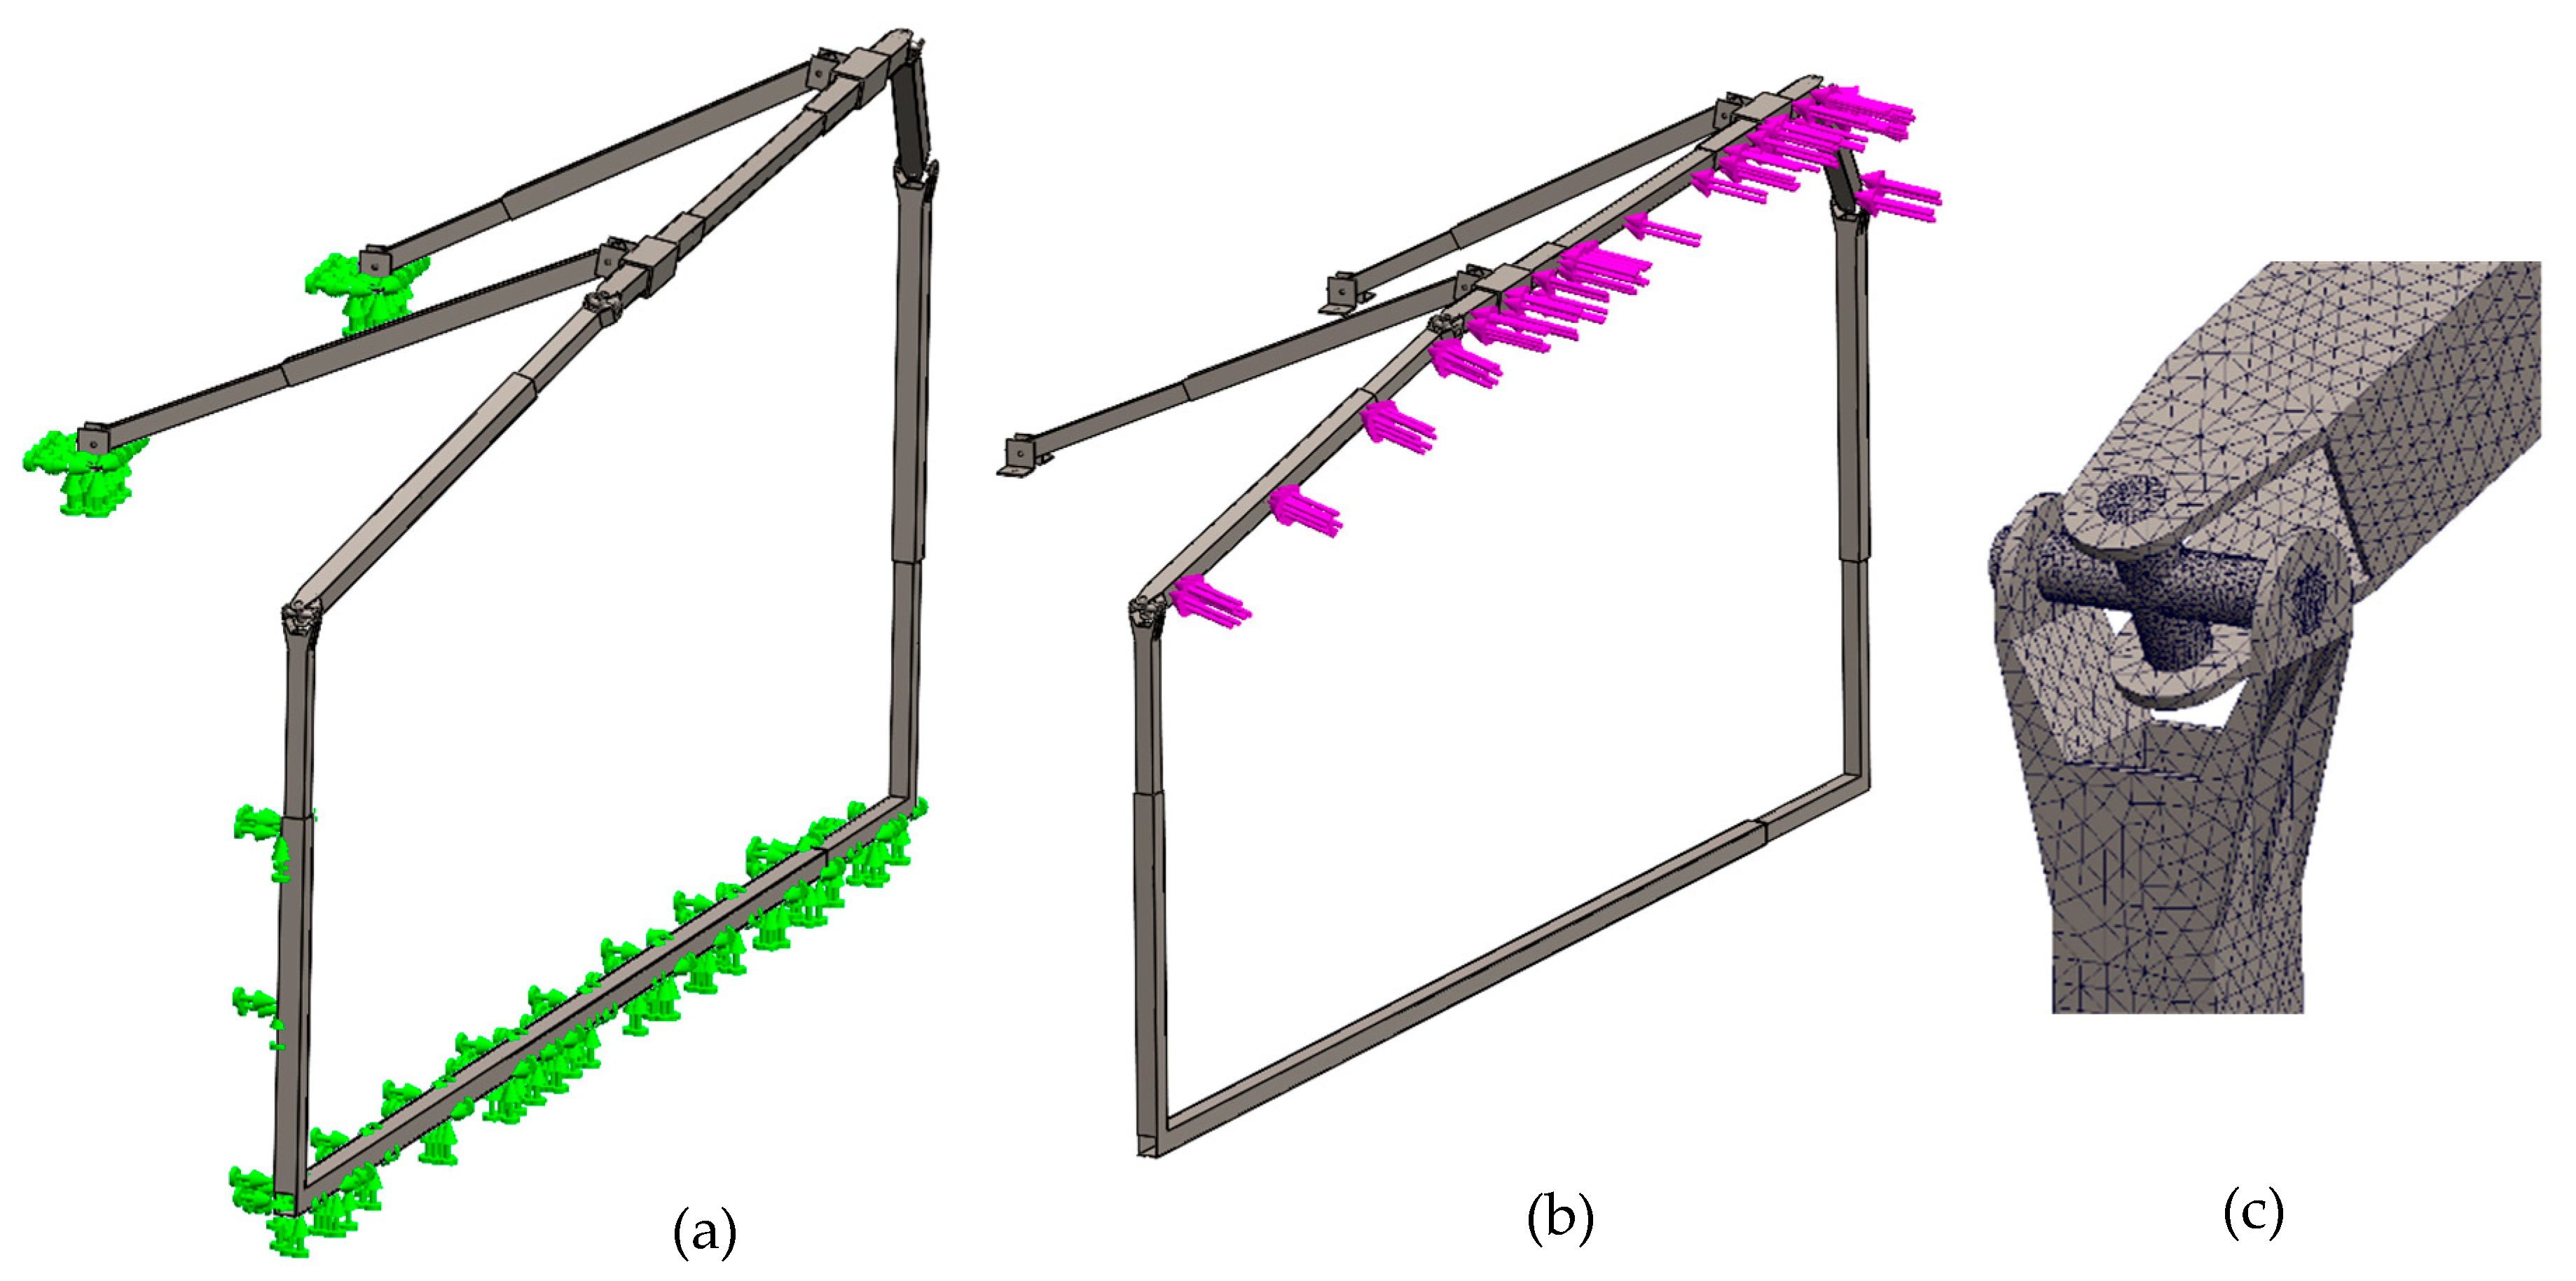
To ensure that the designed structure, consisting of external and internal RTP profiles, universal joints, and the union bolt, can withstand the applied load, a static numerical analysis was performed using Solidworks
® 2021 SP5.0. According to Hideo Omura et al. [
7], an airbag generates a deployment force of approximately 7000 N, and the structure must endure this load. In the FEA simulation, the lower part of the mechanical structure (elements A, B, and F) was considered as a fixed support. The 7 kN force of deployment was applied where the airbag was attached (elements C, D, and E). A geometry size mesh control was applied to create a fine mesh with an element size of 2–10 mm for FEM analysis.
Figure 7 represents the main boundary conditions of the numerical simulation.
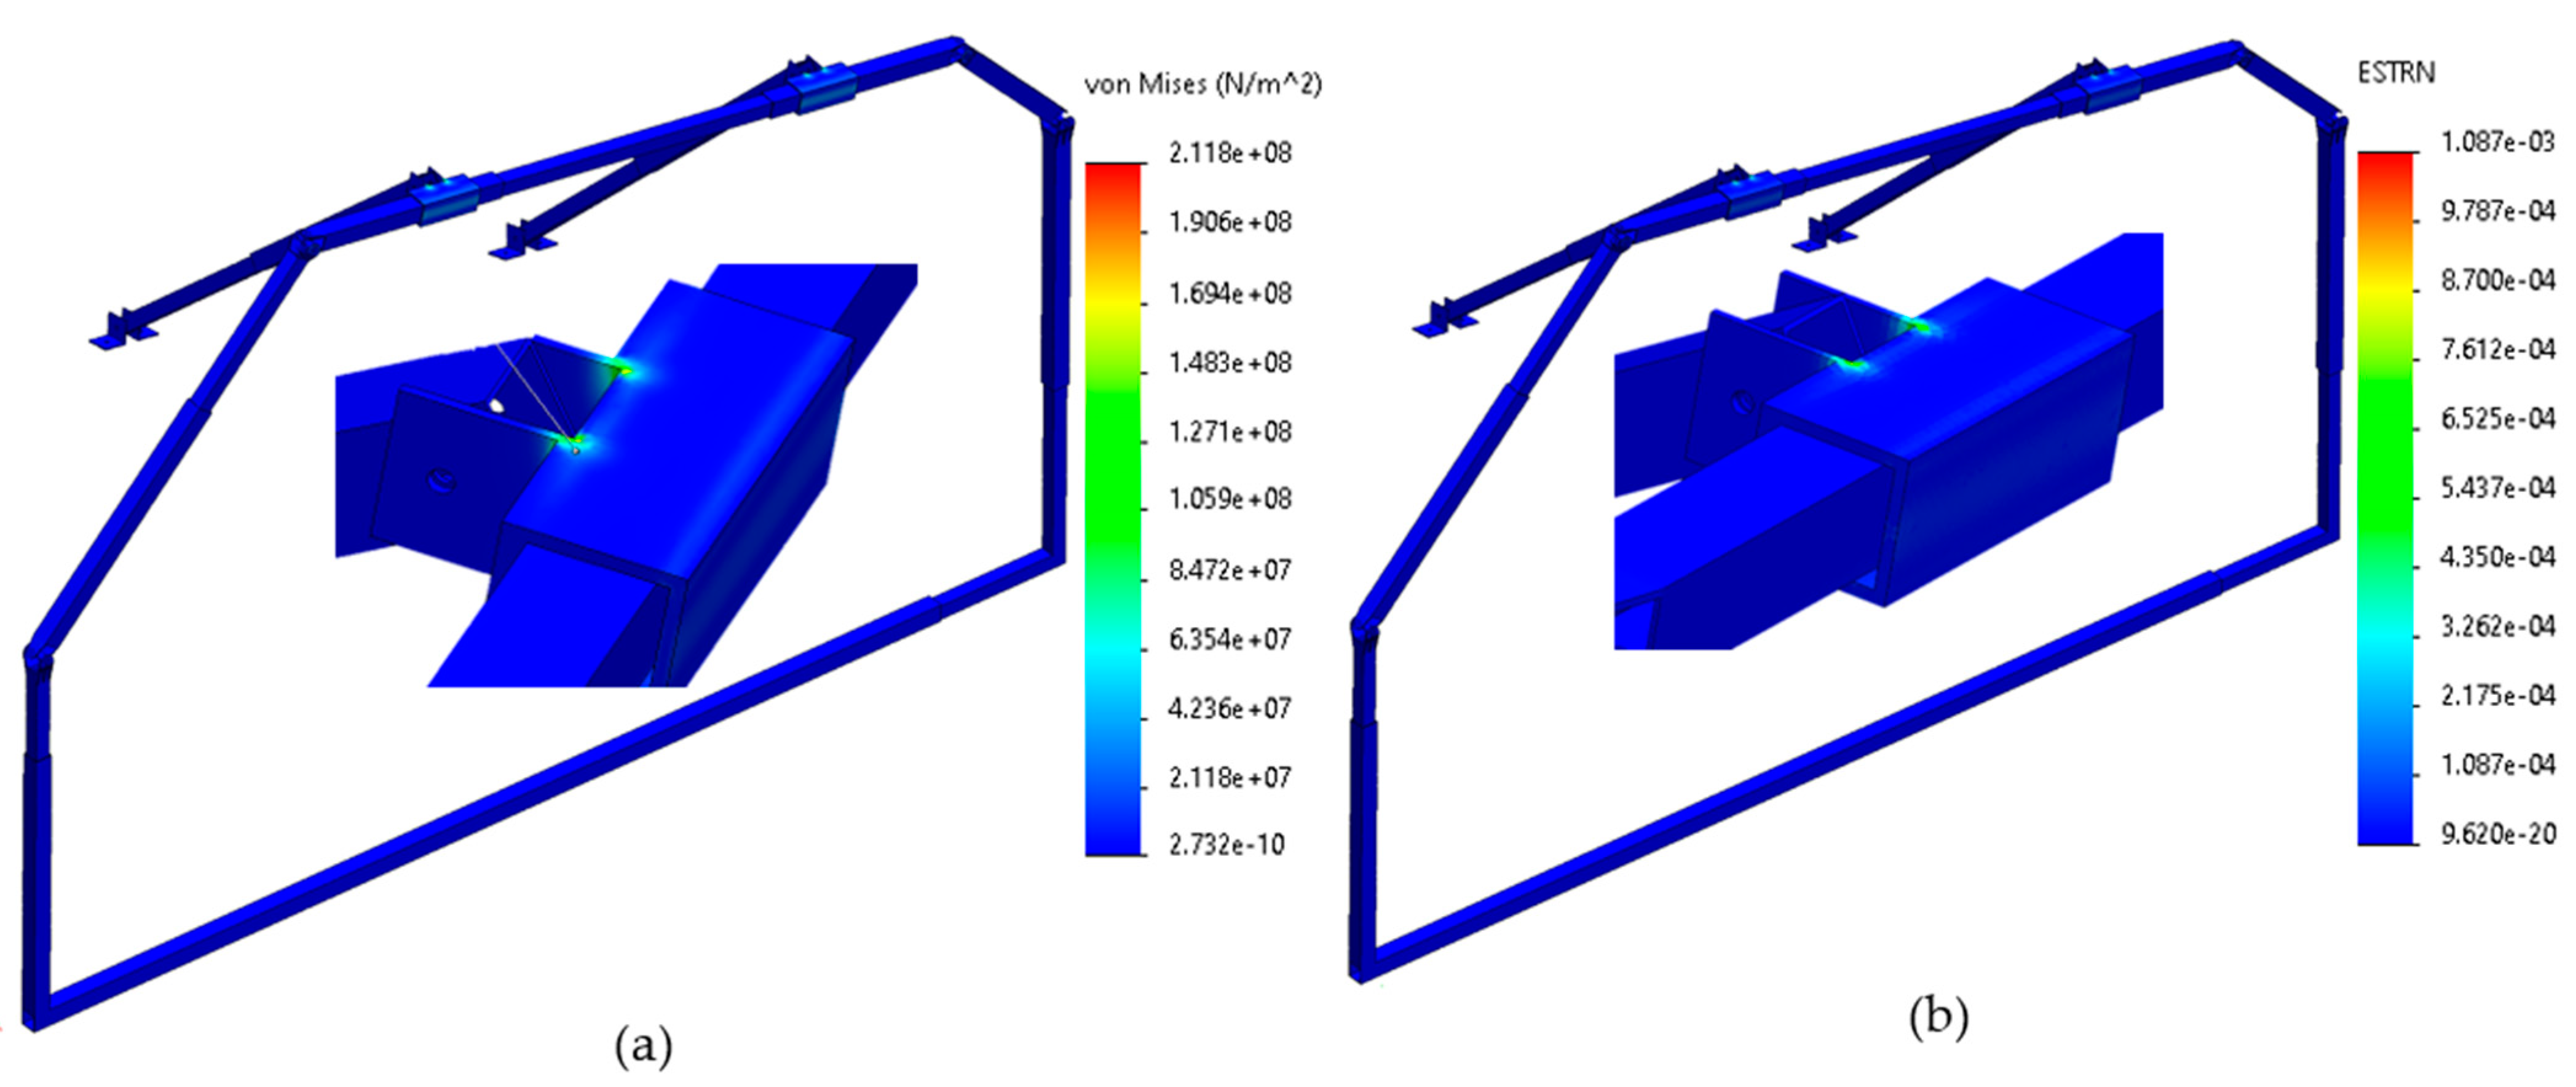
The numerical evaluation results can be seen in the example presented in
Figure 8, which represents the Hyundai Creta 2019 FEM analysis.
Figure 8a shows that most of the mechanical structure and the adjustable clamps present stresses of around 21.11 MPa, which is well below the permissible or elastic stress limit of 250 MPa. However, there are areas, such as the sliding joint of the adjustable clamps and the joint of their brackets with the telescopic arm of the adjustable clamp, that present higher stress values of around 195 MPa. The unitary deformation values of the Solidworks
® 2021 SP5.0 scale show that the model remains well below the unit, even in critical areas, as
Figure 8b shows.
Table 4 presents all the results obtained with the FEM analysis. It shows the main stress, the unitary deformation, and the displacements that the mechanical structure presented under the working conditions of the three study cases that were analyzed.
Once the design had been validated, the adjustable mechanical structure was fabricated according to the construction plans derived from the CAD model and the materials specified in the design.
Figure 9 provides an illustrative view of the components of the experimental prototype for curtain airbags, along with their arrangement for conducting experimental tests. Additionally, precise control of the distances between the high-speed camera, the experimental prototype, and the lighting setup are crucial to ensure accurate experimental results.
The instrumentation and data acquisition system of the experimental prototype for curtain airbags is designed to analyze key data related to the deployment process. This system comprises two primary devices: an industrial-grade accelerometer and a high-speed camera. The accelerometer used is a uniaxial model 603C01 from PCB PIEZOTRONICS®. Additionally, a National Instruments® NI-9232 signal decoder card, paired with the cDAQ-9171 chassis, was employed to facilitate signal visualization on a computer. The cDAQ-9171 is a USB-powered chassis designed for compact, portable measurement systems. To capture measurements of the curtain airbag’s deployment timing and speed, a Mikrotron® Cube4MGE-CM4 high-speed camera was utilized. The user interface enables the configuration of storage, recording format, and recording duration. A key objective of this study is to understand the interaction between a 3-year-old child’s head and the deploying airbag.
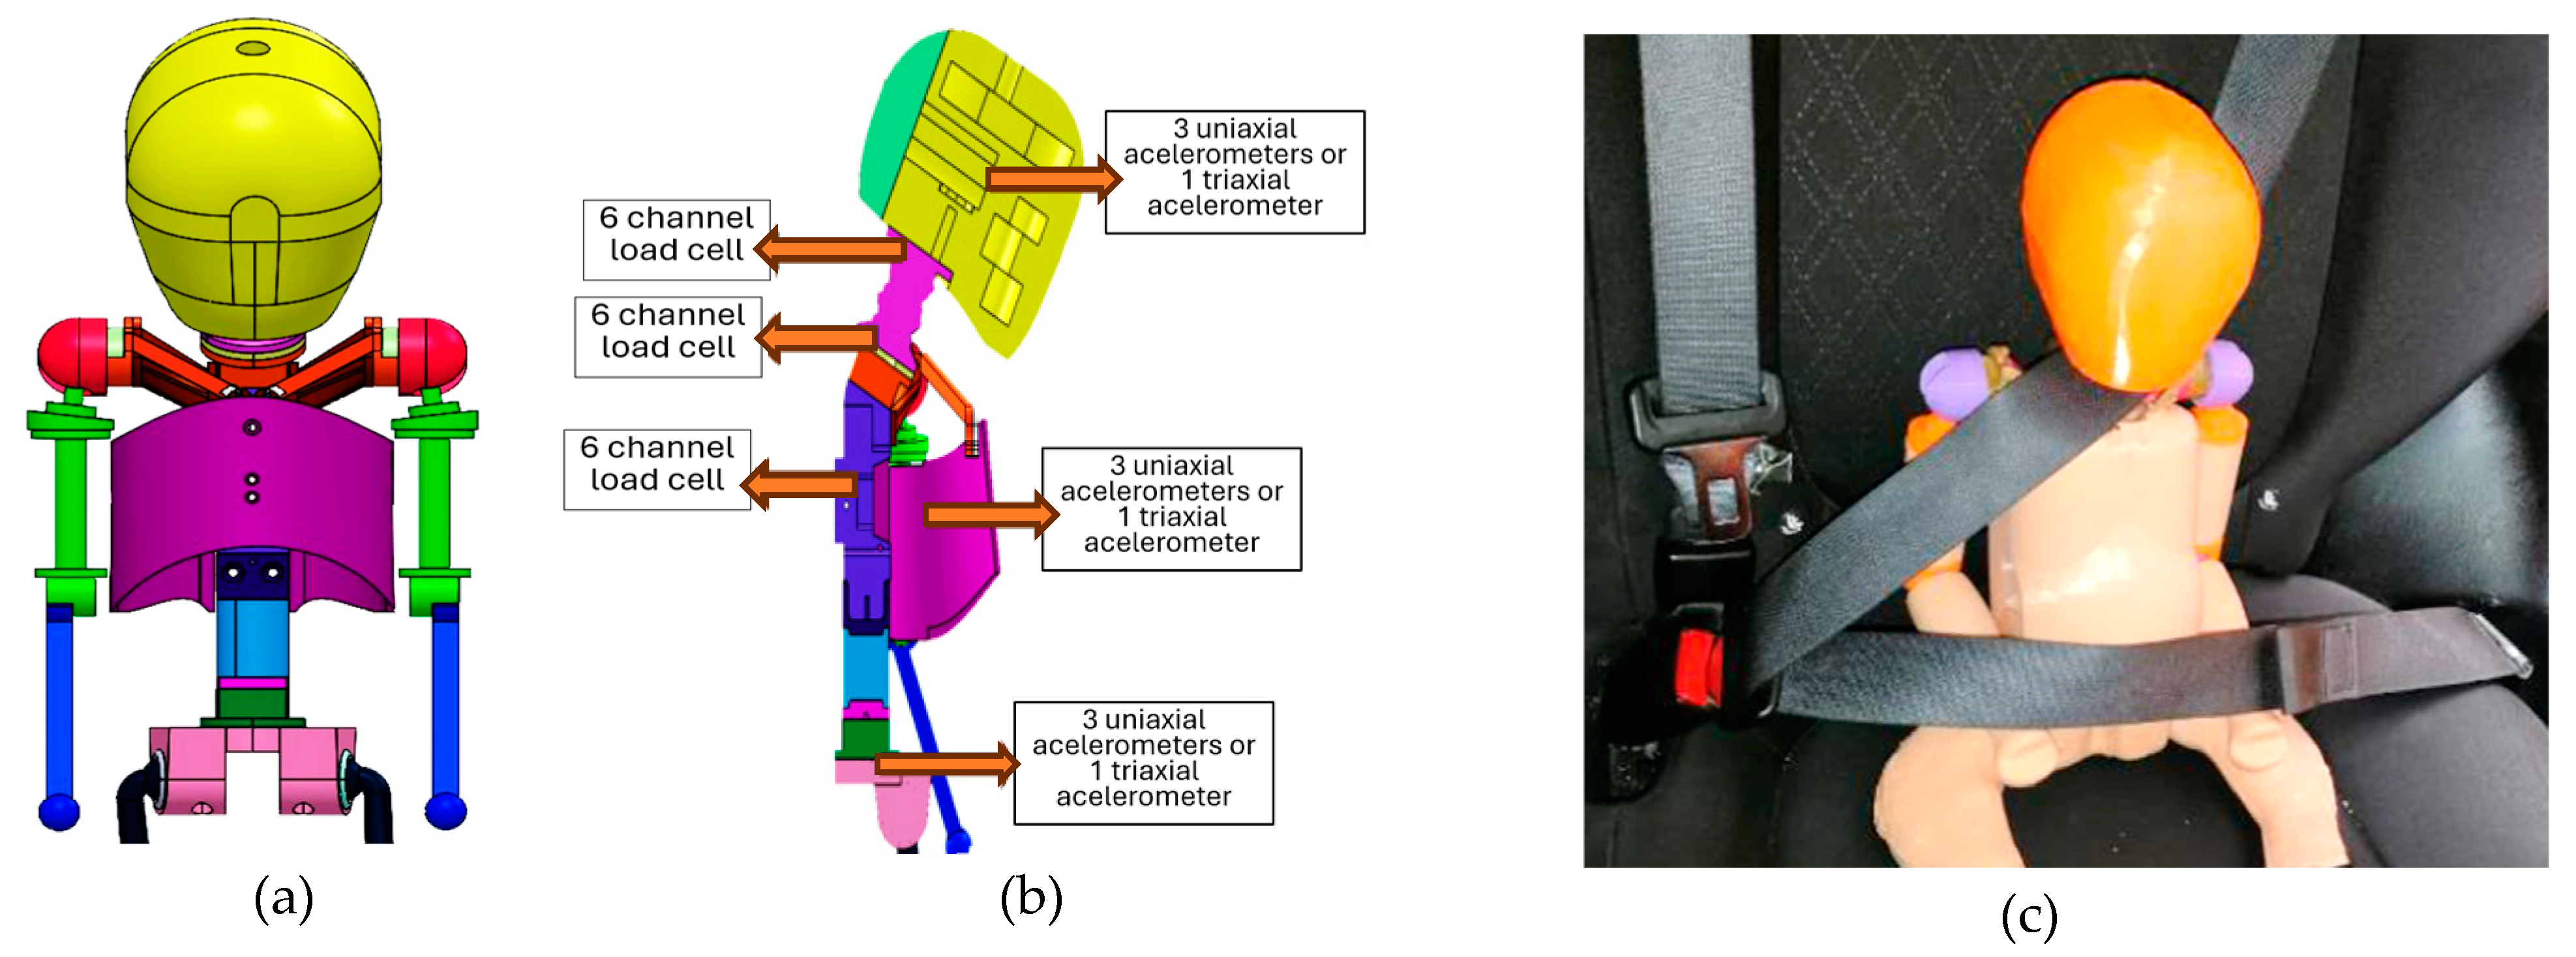
For this purpose, a specially designed infant mannequin, modeled after the Humanetics
® Q3, was employed. Given the cost of a standard Q3 mannequin (up to 2 million euros), a replica was produced using three-dimensional printing, advanced sensors, and wireless data acquisition systems to enhance data collection.
Figure 10 displays the design of the Q3 mannequin. This prototype mannequin was physically conceptualized using 3D printing, and PLA (Polyvalent Acid) was used. Once the prototype mannequin was printed, its lining was manufactured using a Mold Max 10T silicone and specially designed and manufactured molds. The material is composed of translucent tin-cured silicone rubber and is a good alternative for creating human skin effects.
Figure 10 shows an image of the mannequin used where it is positioned in the rear seats of a vehicle. It can be seen that it corresponds to a size similar to that of a 3-year-old child.
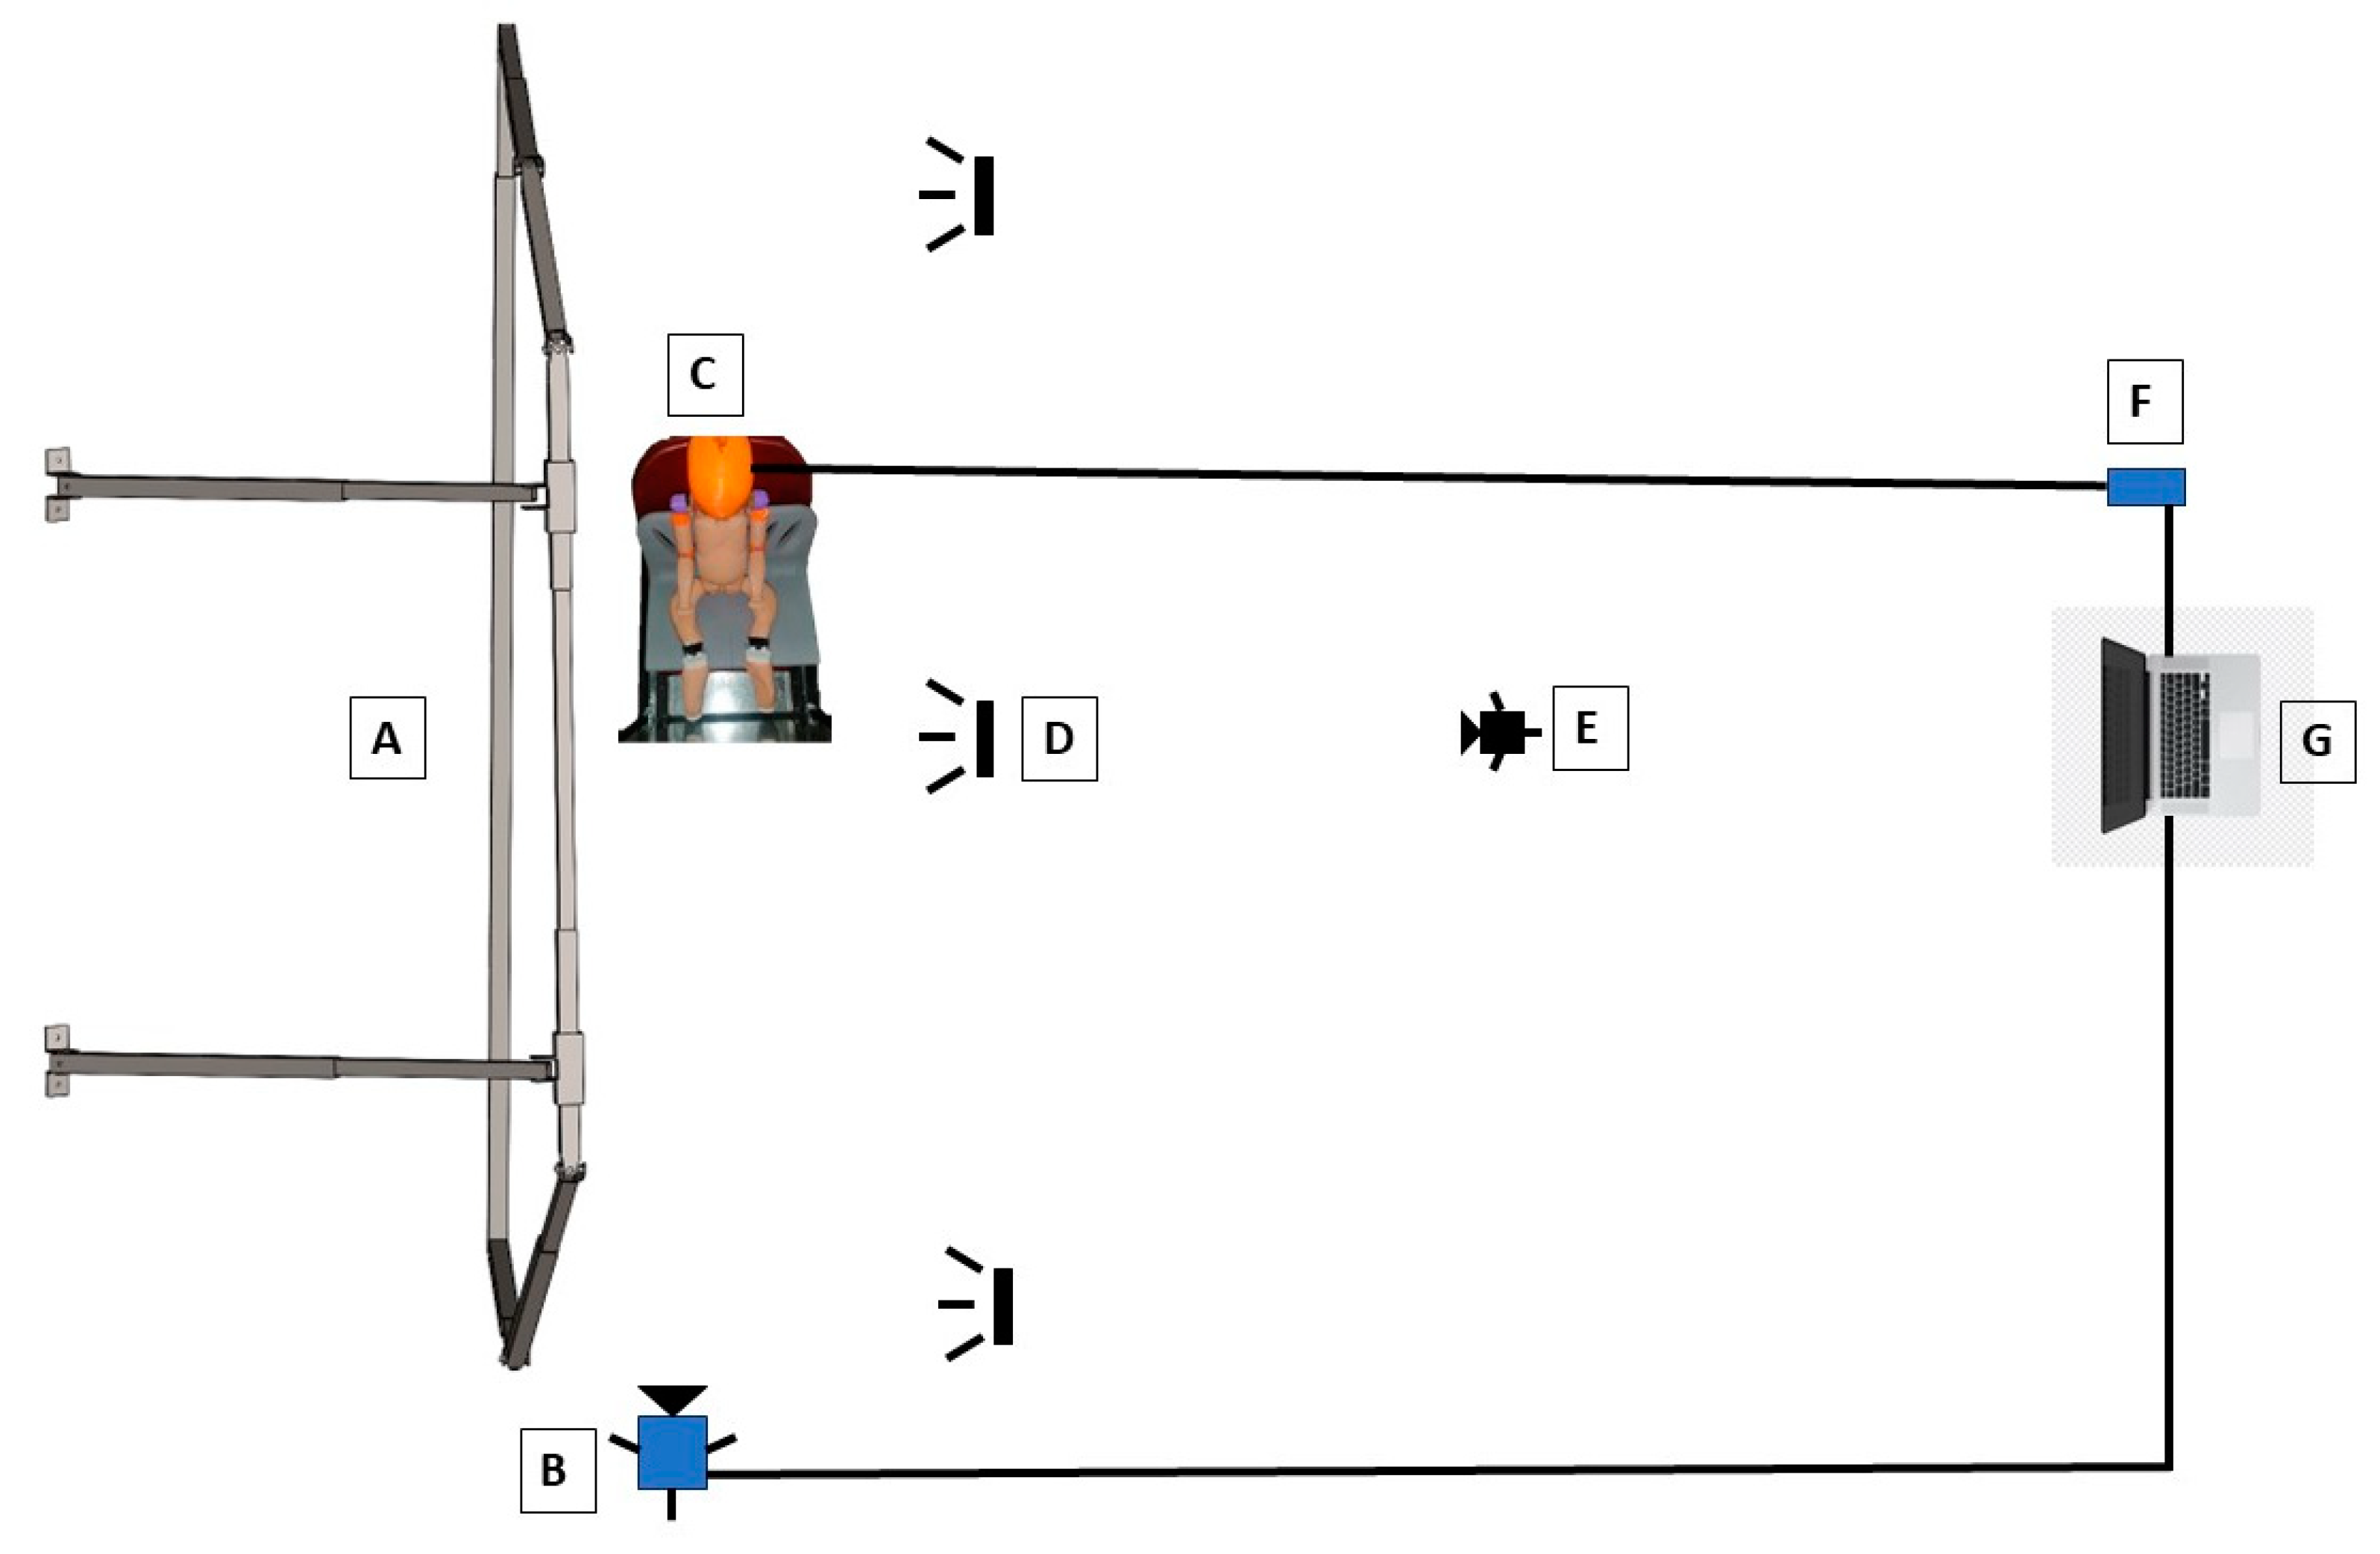
The experimental prototype for curtain airbags is a multidisciplinary system composed of several subsystems. Without a hierarchical structure, the primary subsystems include the adjustable mechanical structure and the instrumentation, which encompasses measurement devices such as the accelerometer, the high-speed camera, and a third slow-motion camera. For the experimental test, the adjustable mechanical structure and the aforementioned curtain airbag were utilized. The adjustable mechanical structure, designed with the dimensions of the Hyundai Creta 2022 body, was installed on the worktable, with the curtain airbag positioned on top. Additional essential components for obtaining accurate physical measurements include the dummy chair, accelerometer, data acquisition devices, high-speed camera, GoPro camera, and lighting system. In
Figure 11, the letter A represents the adjustable mechanical structure, B represents the Cube4MGE-CM4 high-speed camera, C represents the dummy, and D denotes the lighting system composed of three light sources. Dimension E corresponds to the GoPro camera, while F represents the data acquisition system, consisting of the NI-9232 signal decoder card and cDAQ-9171 chassis. Dimension G represents the mobile computer used for data interpretation and display, facilitated by the NI-DAQ Express 2022 Q4 software.
3. Results
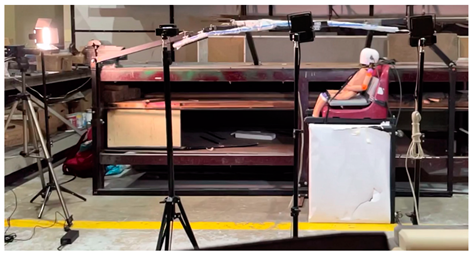
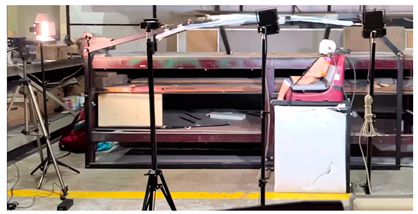
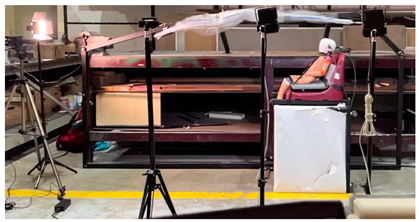
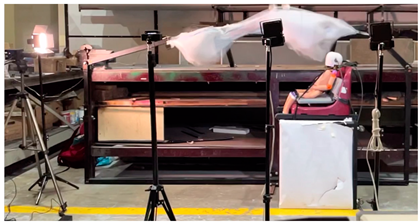
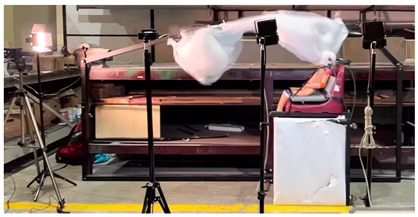
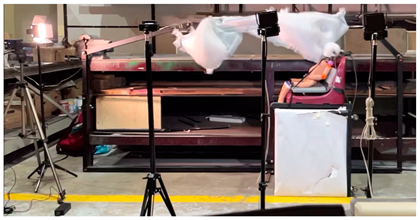
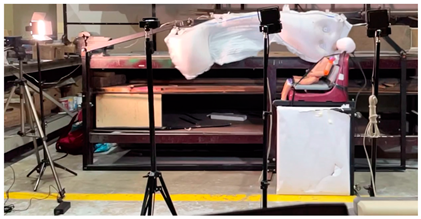
Using the GoPro camera, video footage was captured at 240 frames per second, documenting the deployment of the curtain airbag and its contact with the dummy’s head.
Table 5 presents a sequence of images extracted from the video, showcasing the deployment process of the curtain airbag until the moment of impact with the dummy’s head. The sequence comprises eight images taken at critical moments to depict the airbag’s behavior during deployment accurately and its interaction with the dummy’s head.
As shown in
Table 5, the curtain airbag begins deploying at 787 ms and continues to inflate for 29 ms, reaching a level of inflation sufficient to initiate occupant protection, as demonstrated by the dummy used in the test. However, contact between the airbag and the dummy’s head occurs at 818 ms, 36 ms after deployment started. The airbag continues inflating, albeit at a reduced rate, until 849 ms and remains fully inflated until 1096 ms, resulting in a total inflation duration of 314 ms. Additionally, deployment time and speed measurements were conducted using the Kinovea
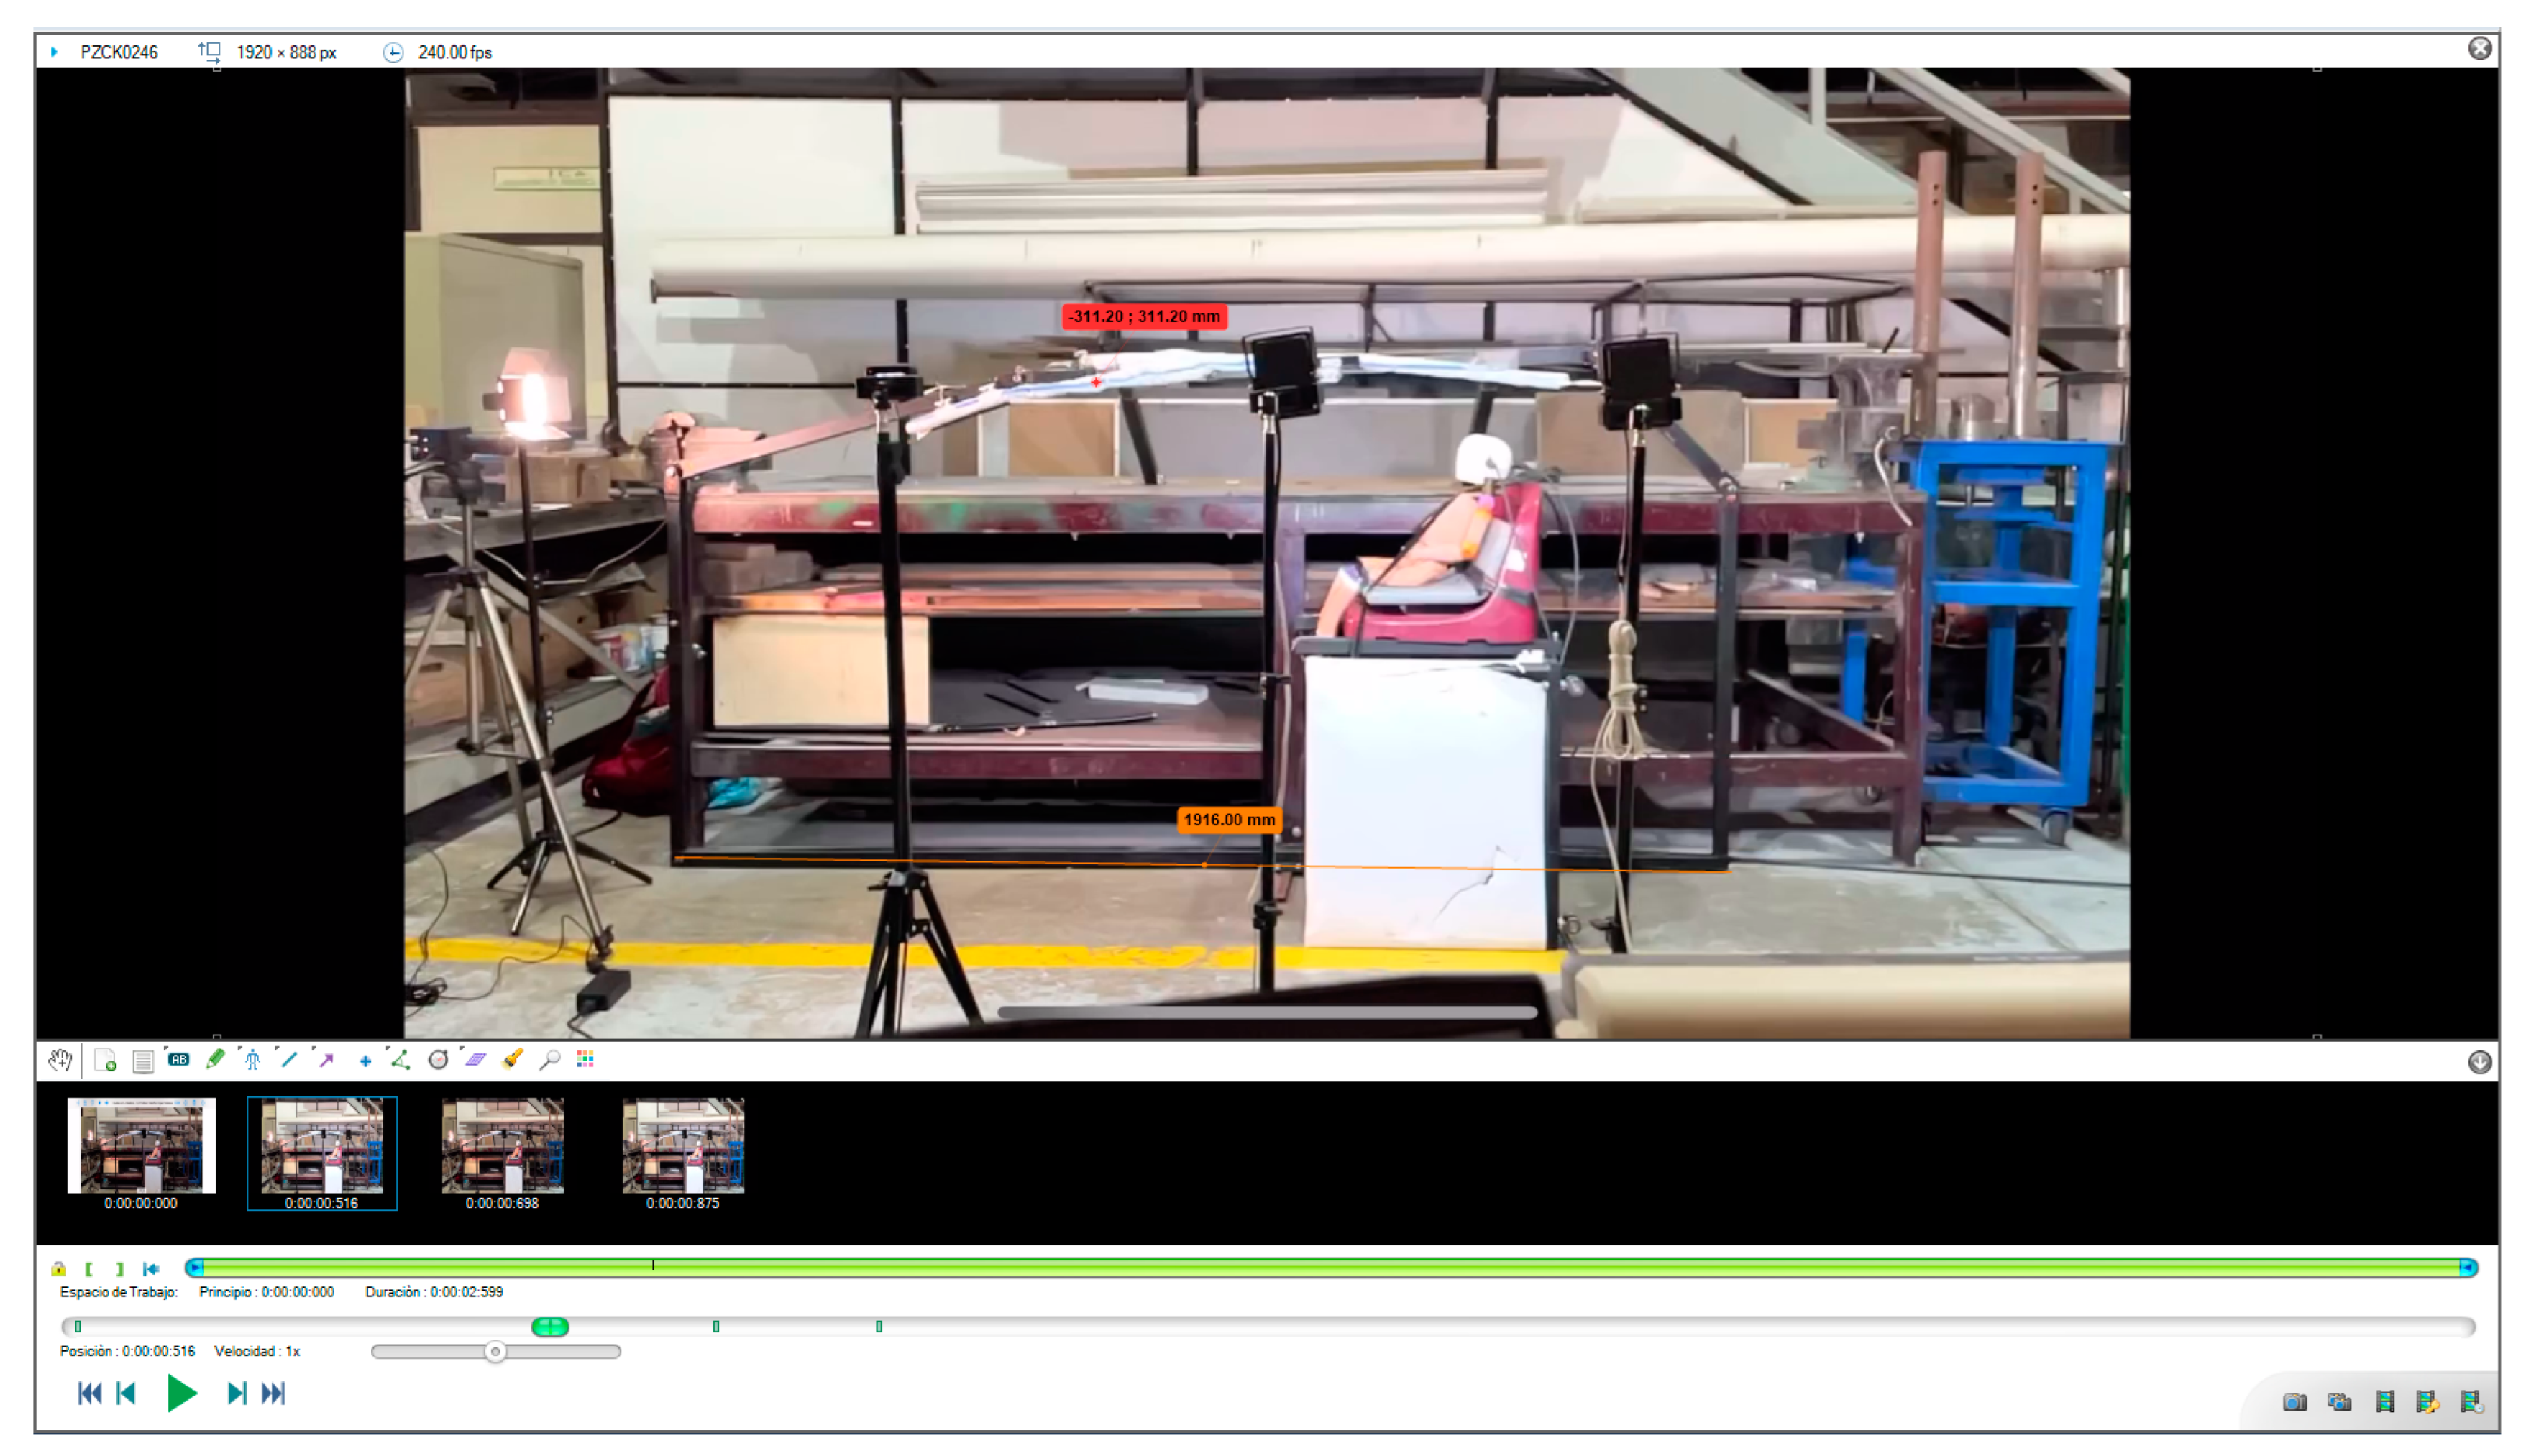
® 0.8.27 software. Motion analysis was performed by placing a tracking point on the airbag to measure its deployment trajectory. This tracking allowed for the determination of the curtain airbag’s deployment speed and timing.
Figure 12 shows a line drawn on the arm of the adjustable mechanical structure to scale the video environment, ensuring the software can calculate the measurements more precisely, along with the placement of the trajectory tracking point on the curtain airbag.
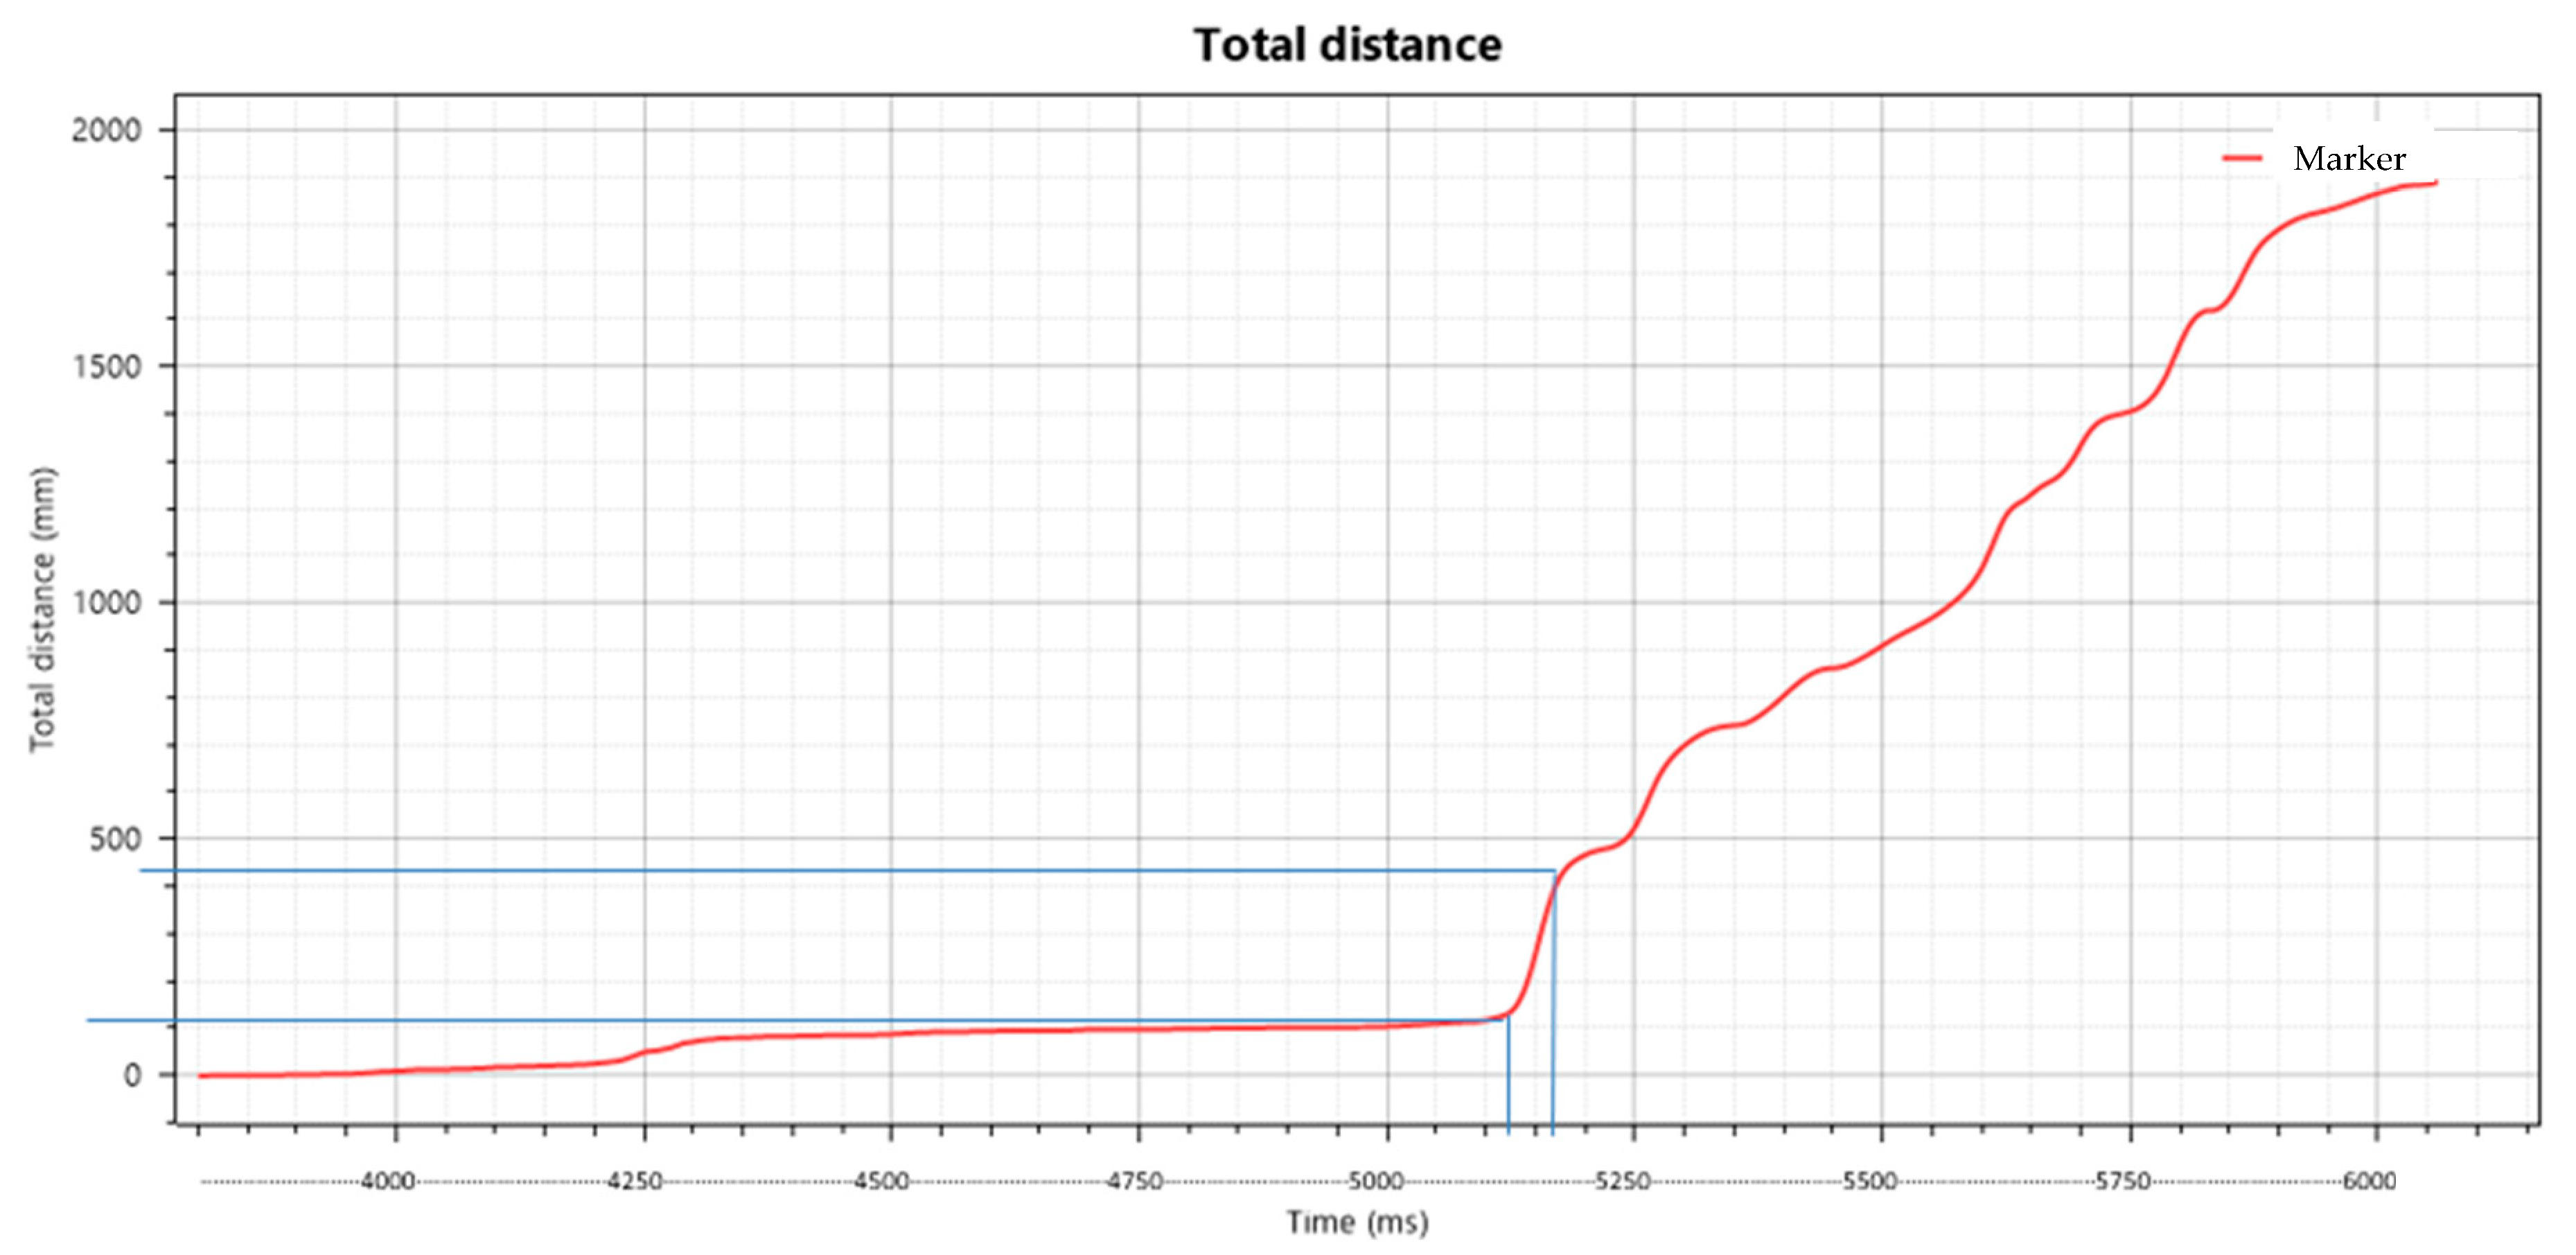
Figure 13 shows the graph provided by Kinovea
® 0.8.27 after the motion analysis. The graph shows the trajectory and displacement of the tracking point during the deployment sequence of the curtain airbag.
According to the graph, the deployment took from 5130 ms to 5175 ms with a difference of 45 ms, and a distance of approximately 350 mm was covered. Therefore, the resulting deployment speed is as follows:
The experimental results include measured values for deployment time, deployment speed, and the acceleration generated upon airbag impact with the dummy’s head. These metrics are consistent and suitable for direct comparison with findings from related studies in the field.
4. Discussion
The literature review revealed that, although experimental testbeds for simulating frontal airbag deployment exist, no records were found of nondestructive experimental platforms specifically designed to emulate the functioning of side curtain airbags. Existing studies predominantly focus on numerical analyses that evaluate parameters such as deployment time, speed, and impact force. These parameters are essential for comparative analysis and serve as benchmarks for the present study. Additionally, knowledge regarding side-impact dynamics, injury risks to occupants, and the FMVSS 214 regulatory framework guided the development of an experimental testbed and a child-sized dummy suitable for assessing injury levels in 3-year-old children following curtain airbag deployment in side-impact scenarios.
An adjustable mechanical structure was developed, capable of replicating the side body configurations of vehicles in segments B, C, D, and E of the automotive market. The structural profile was designed in accordance with the NTC-Acero-2020 standard [
48], ensuring that the Rectangular Tubular Profile (RTP) could resist the 7000 N force reported during curtain airbag deployment, as cited by Hideo Omura et al. [
7].
The instrumentation and data acquisition system recorded critical parameters during each airbag deployment, including deployment time, deployment speed, and the linear acceleration experienced by the dummy’s head. High-speed video analysis showed that, in the first test, the airbag reached an effective deployment at 32 ms and remained inflated for up to 58 ms. In a second trial, deployment occurred at 29 ms, with ideal geometry and protective positioning achieved at 36 ms. The airbag made contact with the dummy’s head 7 ms later, at 36 ms post-activation. These measurements align with ranges reported in the literature, supporting the testbed’s reliability and experimental validity. In
Table 6, all data of interest, such as type of work, time, and speed deployment of the airbag, were collected and summarised to compare the results obtained with other related studies.
According to prior research, and as can be seen in
Table 6, the deployment time for curtain airbags ranges between 20 and 44 ms, placing the experimental testbed designed in this work within this range, with values between 29 and 36 ms. D. Breed et al. [
6] found a deployment time of 20–40 ms, H. Omura et al. [
7] of 30 ms, H. Zhang et al. [
11] of 20 and 30 ms, Y. W. Yun et al. [
13] and J. Lee and collaborators [
14] of 30 ms. On the other hand, regarding speed deployment, F. Bandak et al. [
4] found values between 2.3 and 6.7 m/s, and Stefan M. et al. [
5] determined deployment speeds of 20 m/s, 40 m/s, and 60 m/s. Similarly, the deployment speed of the experimental testbed designed, recorded at 7.77 m/s, aligns with the literature, where values range from 2.3 m/s to 6.7 m/s.
Additionally, the accelerometer embedded in the dummy’s head recorded a peak impact acceleration of 136.17 g during airbag deployment. According to the injury scale provided in
Table 7, this corresponds to an AIS level 2 injury, with associated Head Injury Criterion (HIC) values ranging from 520–899. This suggests a potential for loss of consciousness for less than one hour and the possibility of a linear skull fracture.
The confirmation experiment carried out by Y.W. Yun et al. [
13] yielded a Head Injury Criterion (HIC) value of 83.91, with a maximum of 117.40, corresponding to AIS level 1, which is associated with symptoms such as headache and/or dizziness. When comparing these results to those obtained from the testbed developed in this thesis for curtain airbags, a difference of one AIS level is observed. This discrepancy is likely attributable to three primary factors: differences in airbag models, the fact that Y.W. Yun et al.’s work was conducted through numerical simulation, and the use of different morphologies—Y.W. Yun et al. [
13] employed an adult model (unspecified), while the testbed used a 3-year-old infant model.
This study offers a significant contribution to advancing child safety in side-impact collisions by proposing a nondestructive and adaptable experimental methodology for evaluating curtain airbags. While promising, further development is needed. As a next step, we suggest performing dynamic numerical simulations of the same airbag models tested experimentally, enabling direct comparison between computational and experimental results. This integration improves the robustness and predictive value of the testbed and supports future enhancements in occupant protection technologies.
5. Conclusions
This work presents the development and validation of a novel, low-cost, and nondestructive experimental testbed for evaluating curtain airbag performance, with a specific focus on child safety in side-impact scenarios. The proposed methodology enabled the design of an adjustable mechanical structure capable of adapting to vehicle geometries from the B, C, D, and E segments of the automotive market. This versatility allows repeated and consistent testing of various curtain airbag models used in subcompacts, hatchbacks, sedans, and large sedans.
The results obtained from the experimental trials, including deployment time (29–36 ms), deployment speed (7.77 m/s), and head acceleration (136.17 g), fall within the ranges reported in related studies and standards. These findings confirm the reliability and functional performance of the testbed under realistic test conditions. The measured acceleration corresponds to an AIS level 2 injury, consistent with the results reported by Yong-Won Yun et al. [
13], and indicates a valid impact representation for a 3-year-old occupant model. These outcomes validate the testbed as a suitable platform for assessing injury risk and airbag effectiveness, particularly in vulnerable occupants such as children.
Despite its promising performance, several technical challenges were encountered during implementation. These include the following:
The need for a proper automotive power source to activate the airbag inflator.
Signal interruptions in the high-speed camera due to the pressure wave from the airbag detonation.
Limitations in the dummy’s neck joint led to head detachment during testing.
Difficulties in video tracking due to the absence of physical markers on the airbag surface.
Each of these challenges provided valuable insights for future improvements. Proposed solutions include integrating more robust dummies, optimizing camera shielding and positioning, and applying visual tracking markers to the airbag prior to detonation to improve motion analysis accuracy.
From a broader perspective, this testbed offers a practical alternative to full-scale crash tests, significantly reducing material waste and costs while maintaining a high degree of repeatability. The system contributes to the enhancement of passive safety evaluation methods, supporting manufacturers, researchers, and regulatory bodies in developing safer vehicles. Future work will focus on extending this platform through numerical simulation integration, allowing for combined computational–experimental validation and deeper exploration of occupant injury mechanisms under side-impact conditions. In particular, coupling the current prototype with finite element models will enhance result interpretation and system optimization.


 ,
, 
