
Assessing and Visualizing Pilot Performance in Traffic Patterns: A Composite Score Approach


Abstract
1. Introduction
The Present Study
2. Material and Methods
2.1. Participants
2.2. Material
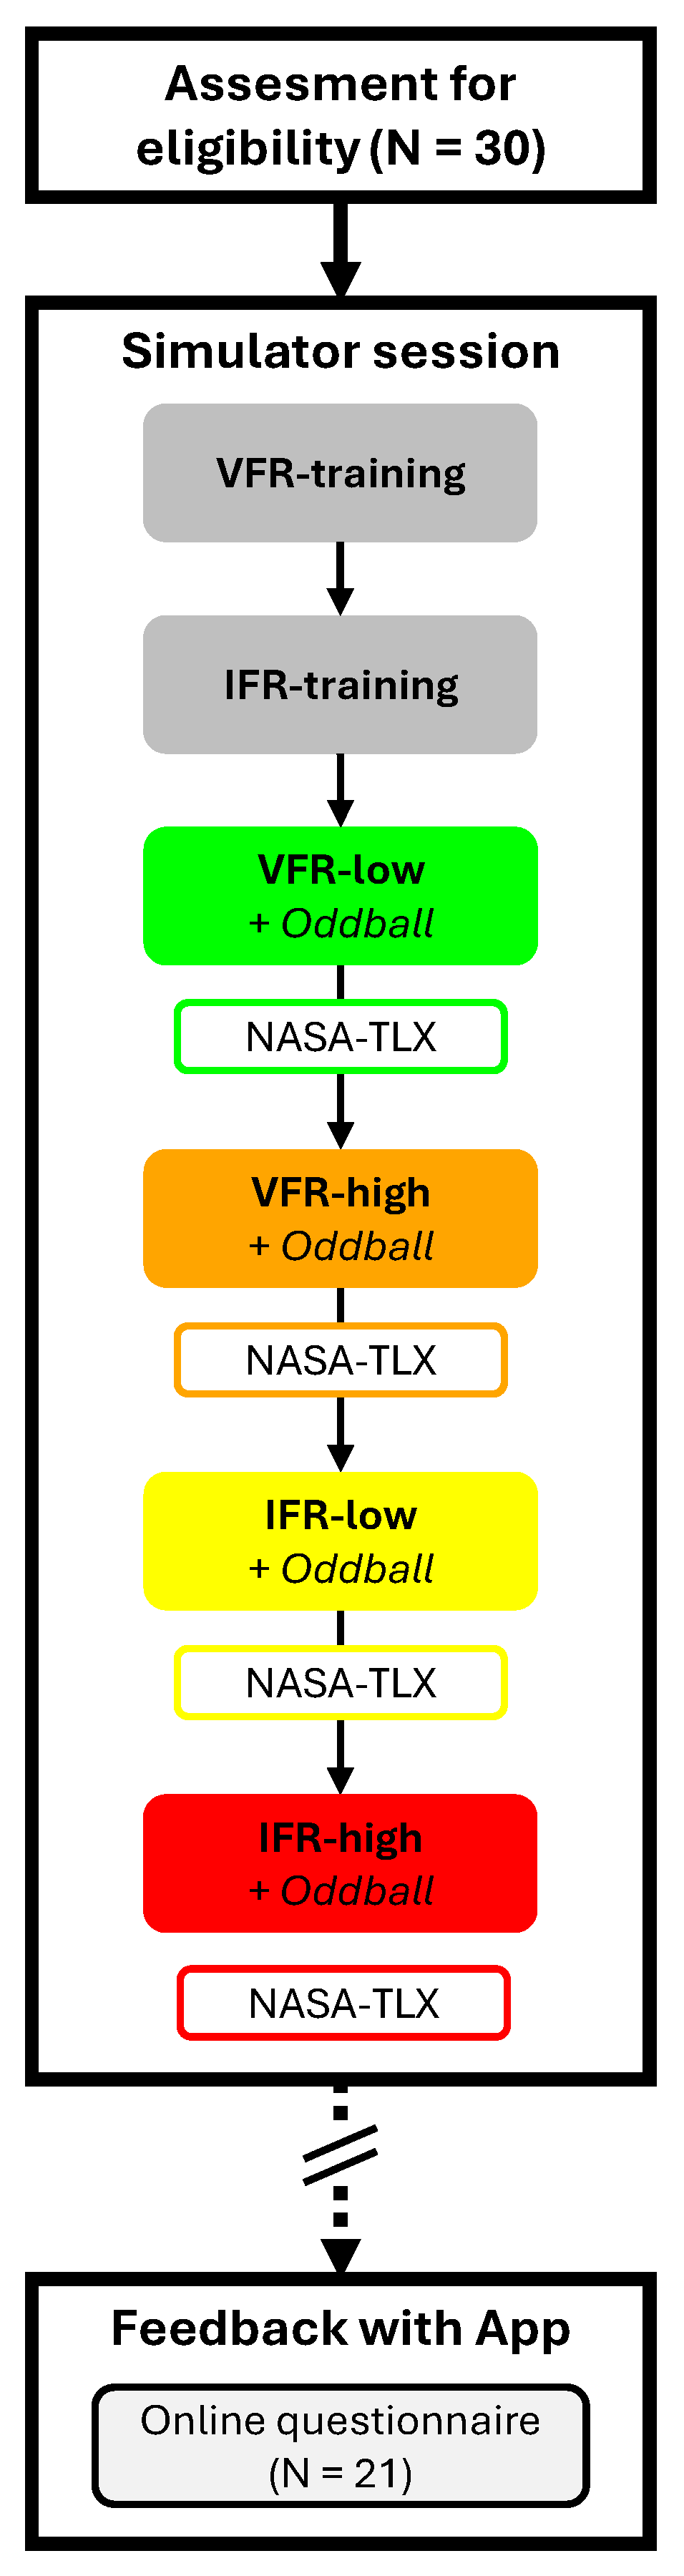
2.3. Experimental Design and Procedure
2.3.1. Experimental Design
2.3.2. Procedure
2.3.3. Flight Scenarios
2.3.4. Workload Indicators
Objective Workload
Subjective Workload
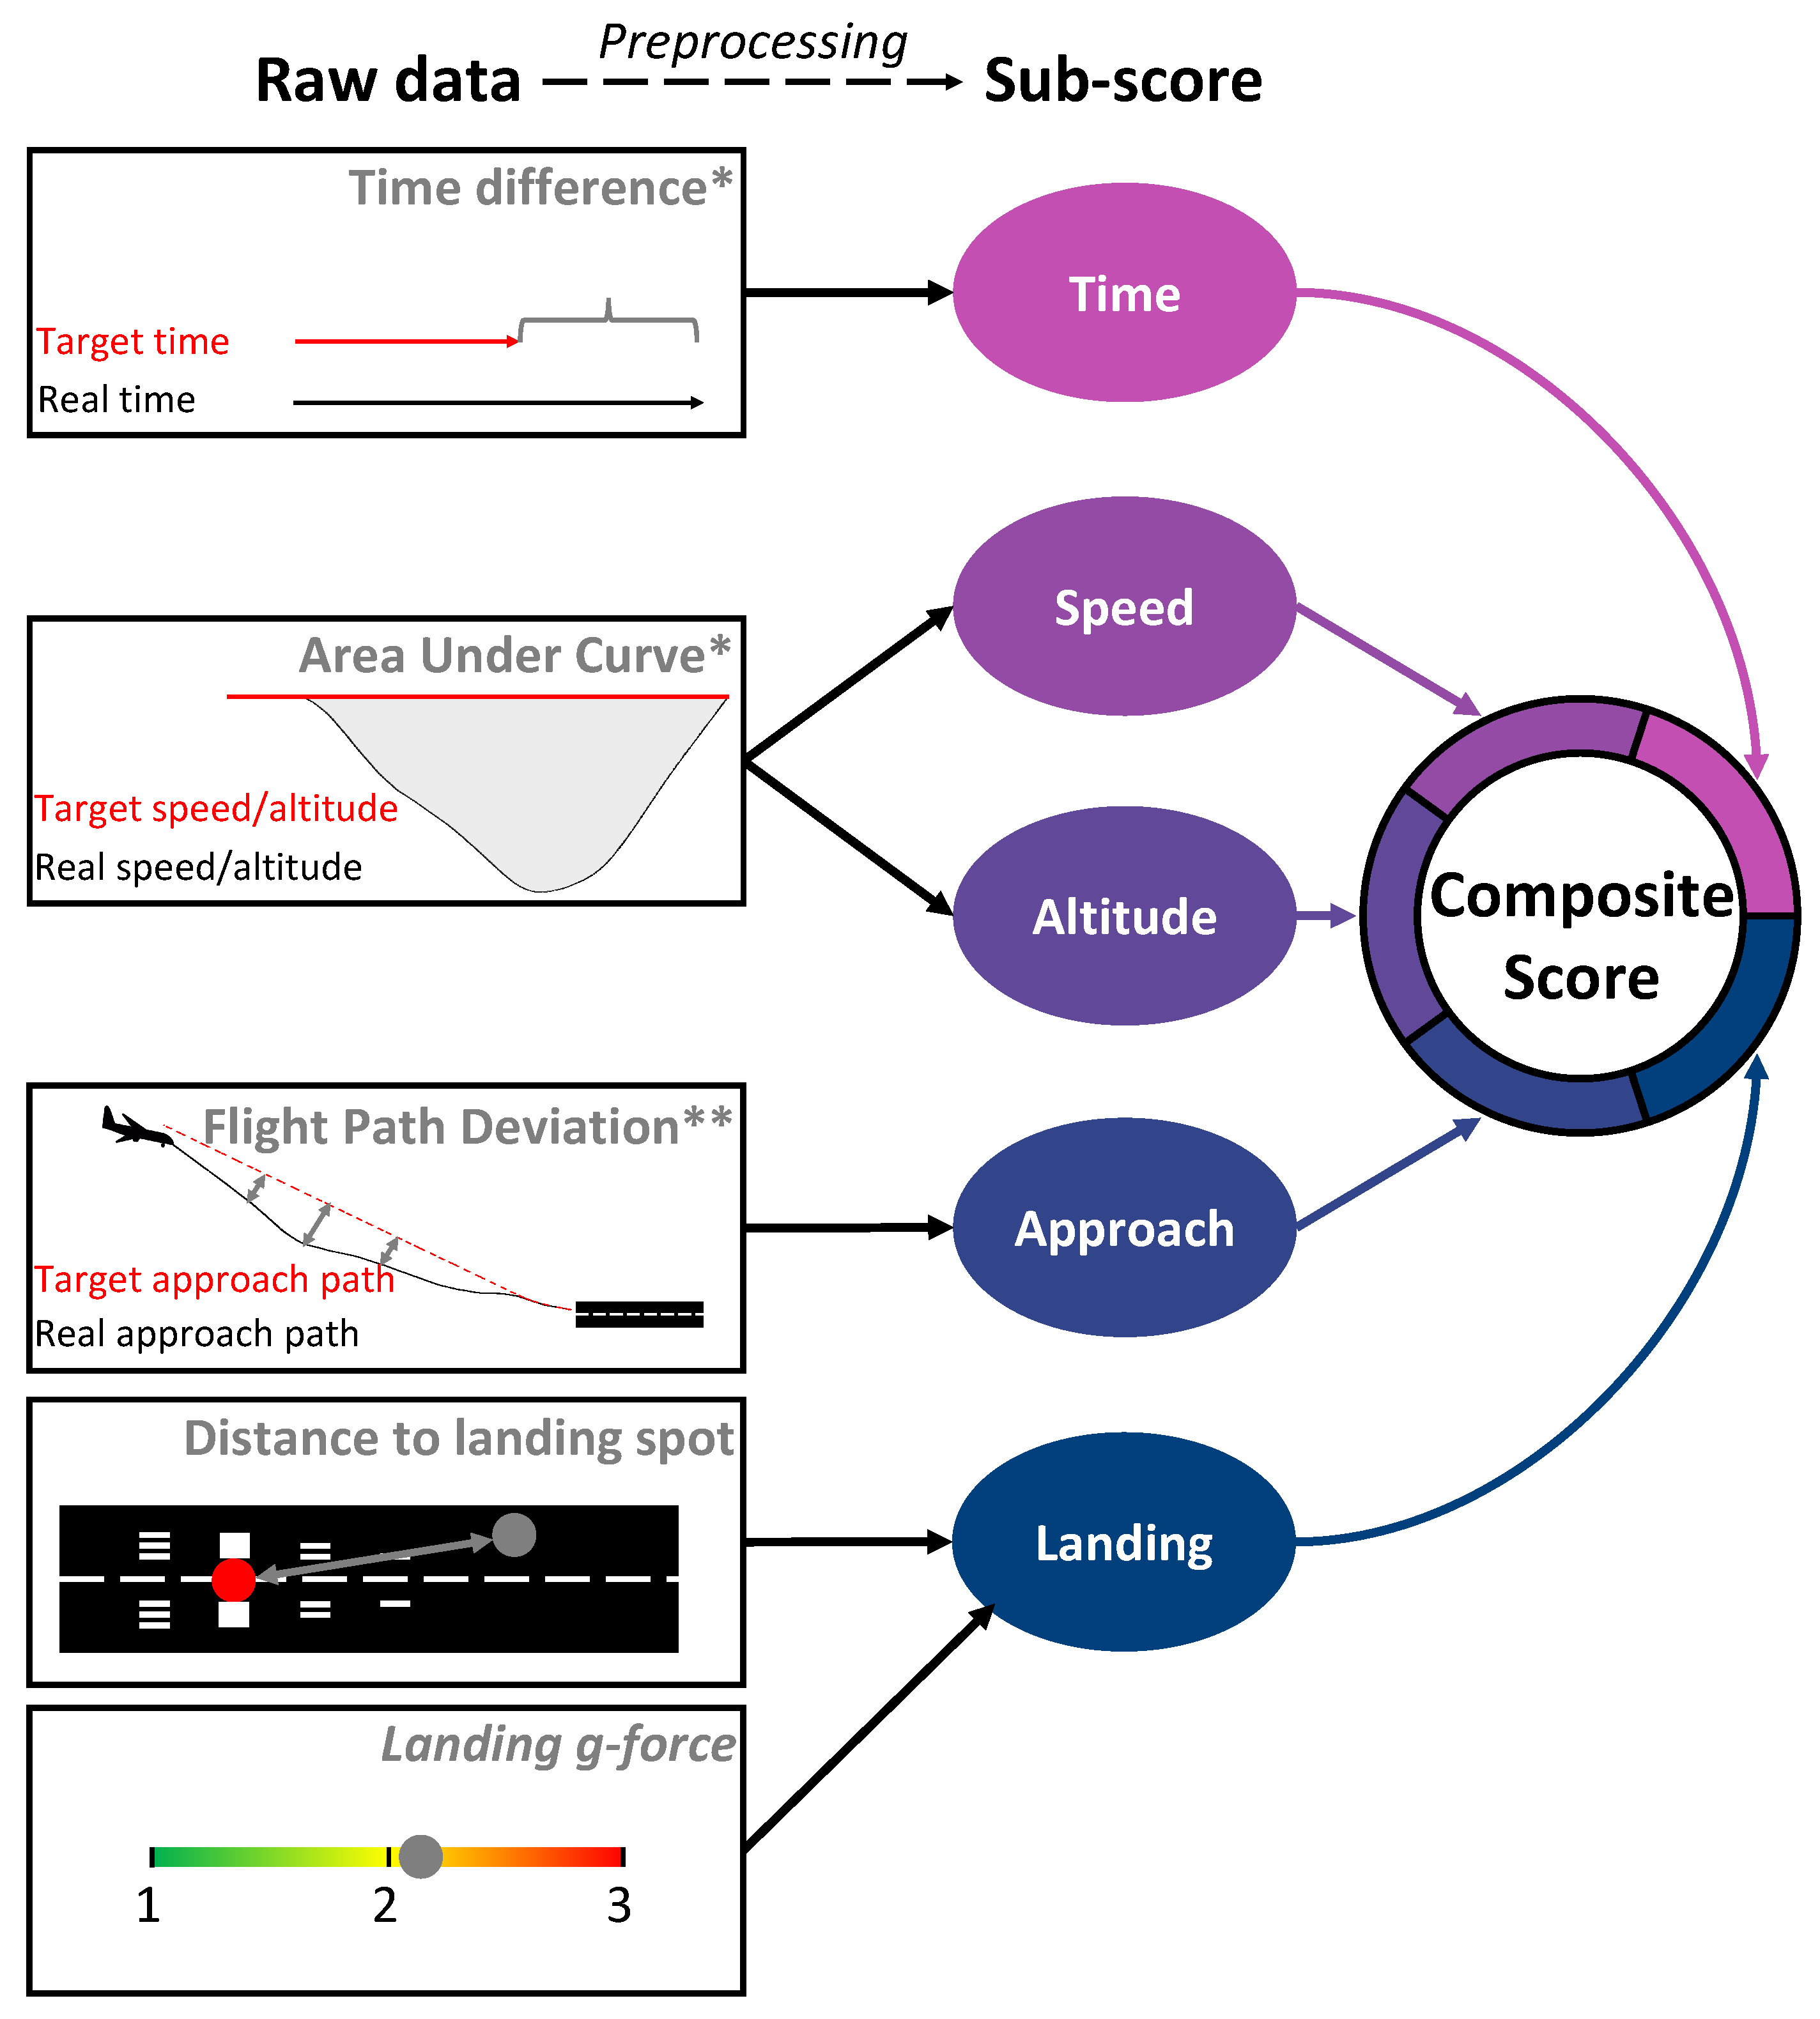
2.4. Flight Simulator Composite Score
Composite Score Preprocessing
- Time Metric: Defined as the absolute difference in seconds between the expected and actual time taken for each flight phase. For instance, the time metric for the downwind phase was calculated based on a reference duration of 3 min.
- Speed Metric: Similar to the altitude metric, this was determined by the absolute area under the curve, comparing the expected (e.g., 140 knots) and achieved speeds.
- Altitude Metric: Computed as the absolute area under the curve, representing the deviation from the expected altitude (e.g., 2000 feet) to the altitude flown by the pilot.
- Approach Metric: Calculated as the mean distance deviation between the expected approach path (as it would be executed by an autopilot) and the pilot’s actual flight path.
- Landing Metric: This metric involved two components: the measured g-forces during landing and the distance deviation from the ideal landing spot (as determined by an automated pilot landing) to the pilot’s landing position.
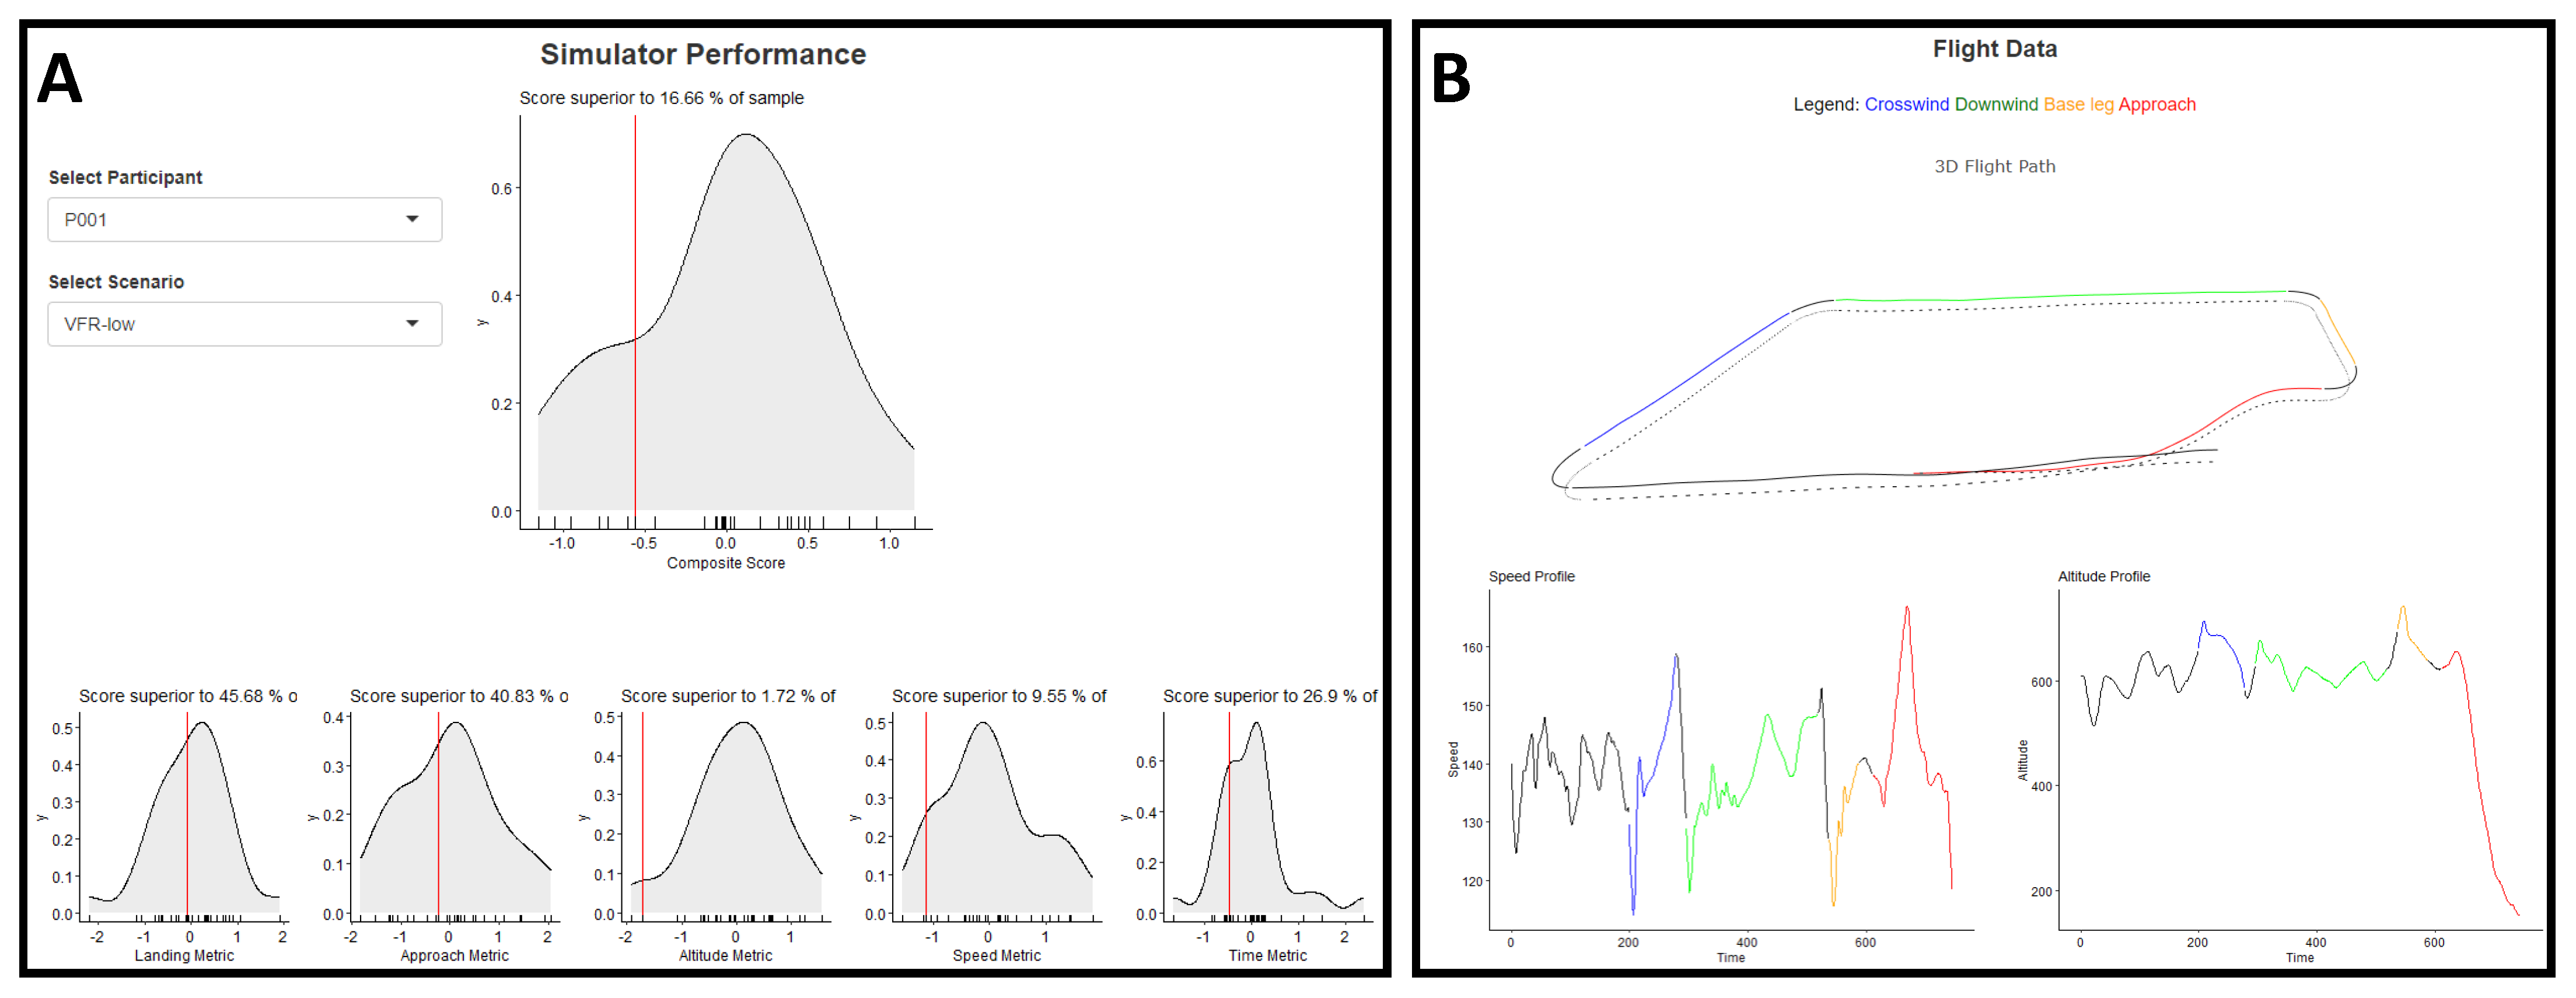
2.5. Flight Performance Visualization
2.5.1. Application Description
2.5.2. Questionnaire
2.6. Hypotheses and Statistical Analysis Plan
2.6.1. Hypothesis 1—Scenario and Workload
- Workload is the dependent variable, measured by either (1) the NASA-TLX score or (2) the auditory oddball miss percentage.
- Difficulty is an independent variable with two modalities: Low and High.
- FlightRule is an independent variable with two modalities: Visual Flight Rules (VFR) and Instrument Flight Rules (IFR).
- denotes a random effect for participants, accounting for the within-participant variability.
2.6.2. Hypothesis 2—Subjective and Objective Workload
- Subjective Workload is a dependent variable, measured by the NASA-TLX score.
- Objective Workload is a dependent variable, measured by the auditory oddball miss percentage.
- denotes a random effect for participants, accounting for the within-participant variability.
2.6.3. Hypothesis 3—Composite Score and Workload
2.6.4. Supplementary Analyses: Flight Hours, Workload and Composite Score
3. Results
3.1. Hypothesis 1—Scenario and Workload
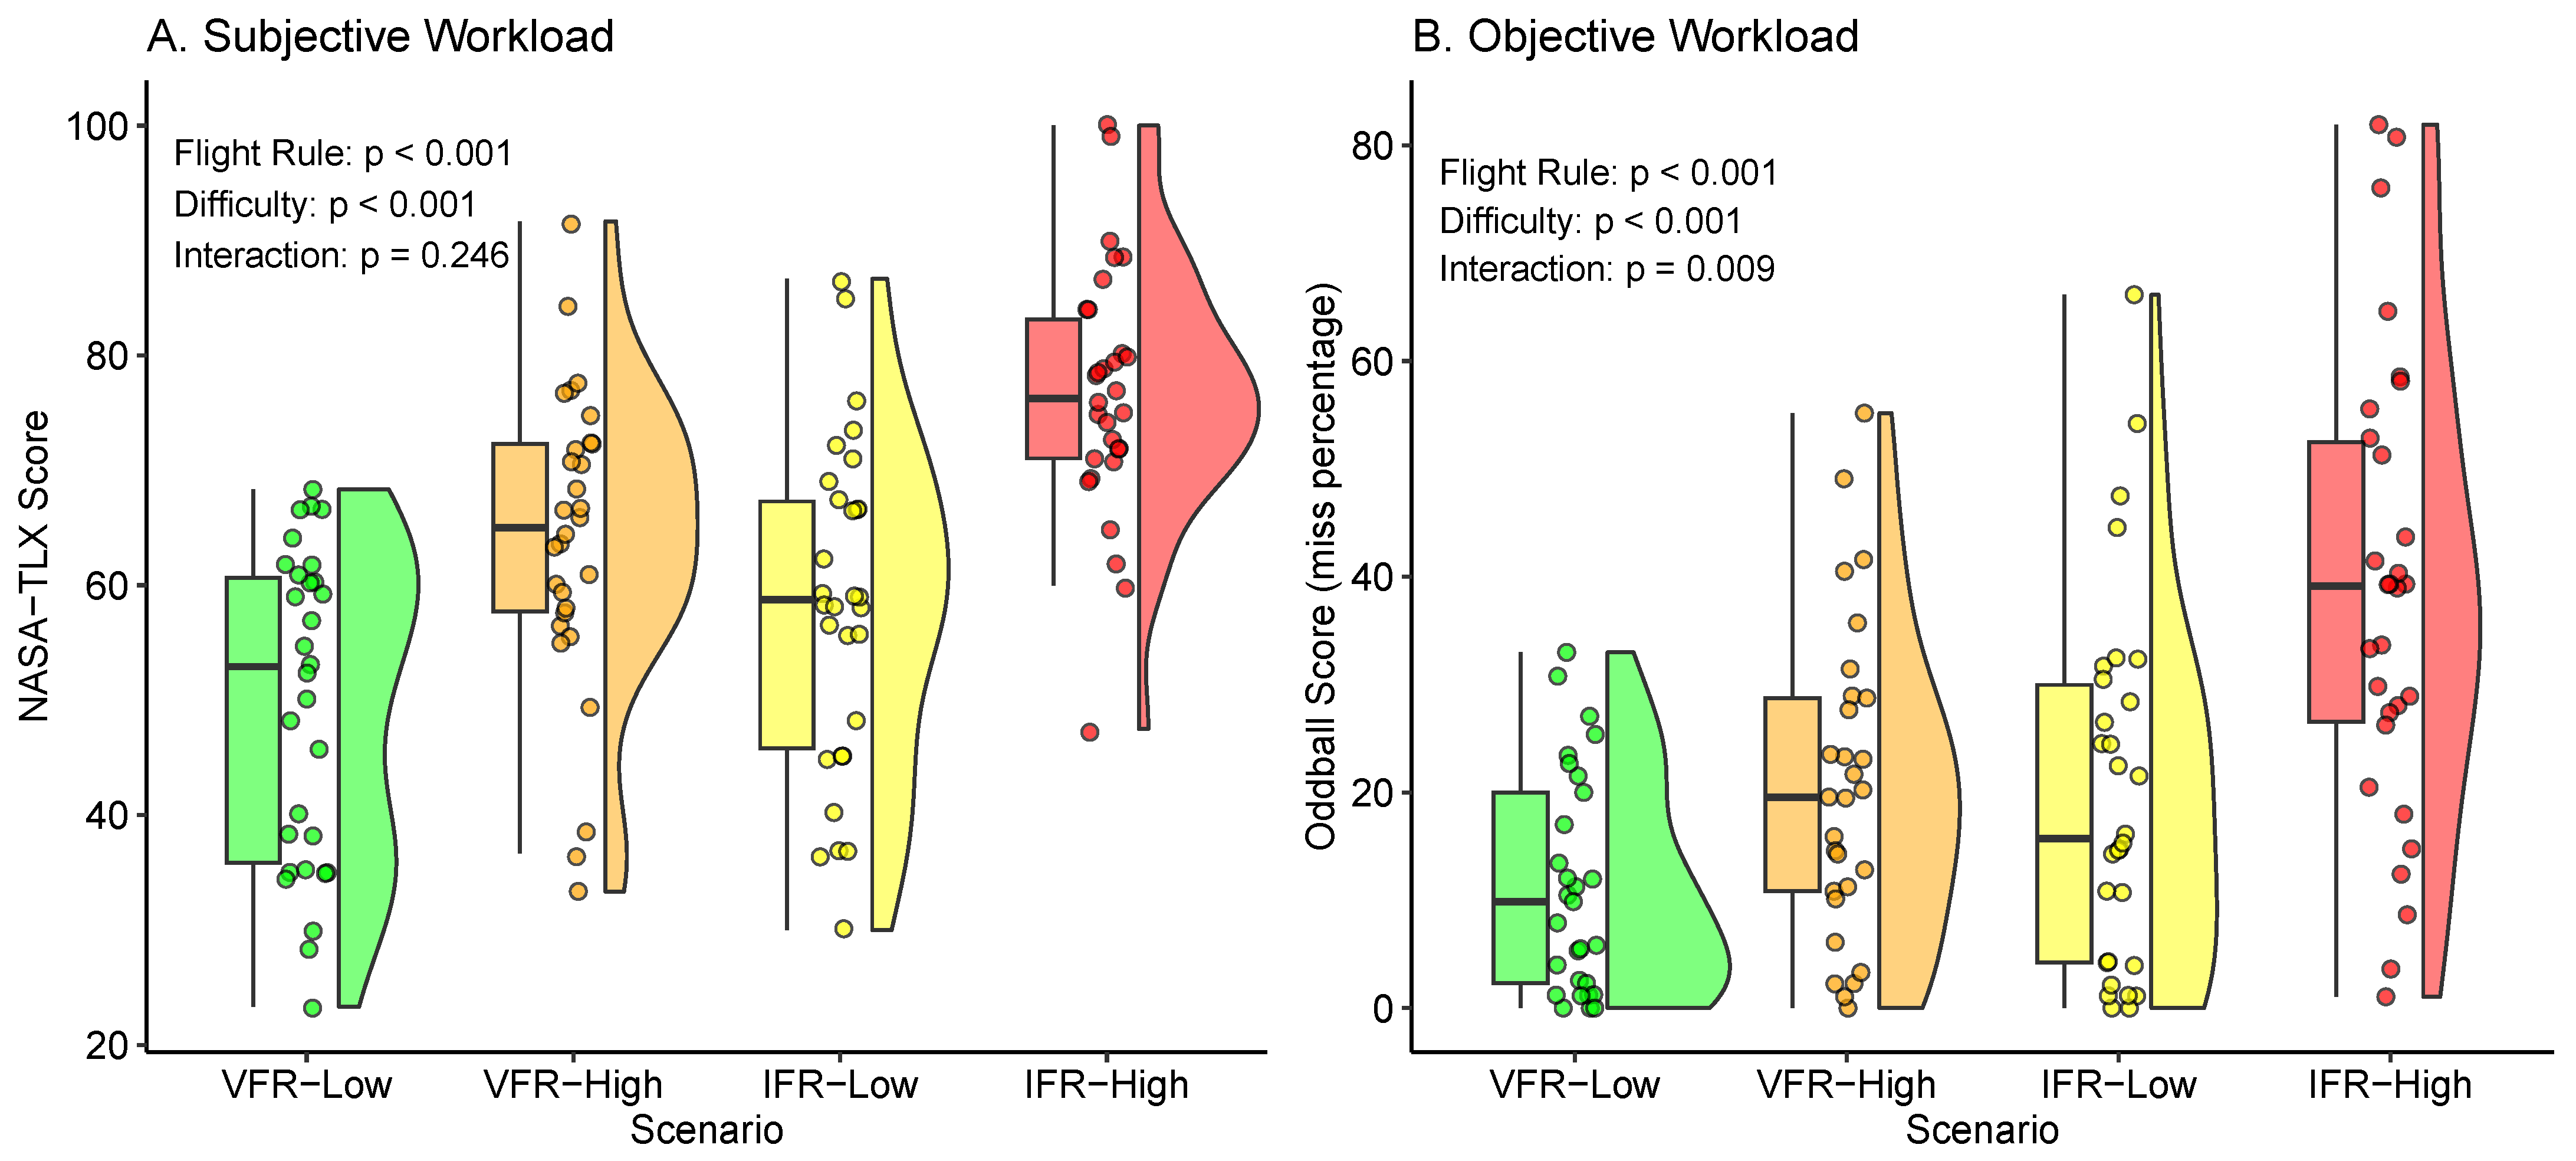
3.1.1. Hypothesis 1a—Subjective Workload (NASA-TLX)
3.1.2. Hypothesis 1b—Objective Workload (Oddball)
3.2. Hypothesis 2—Subjective and Objective Workload
3.3. Hypothesis 3—Composite Score and Workload
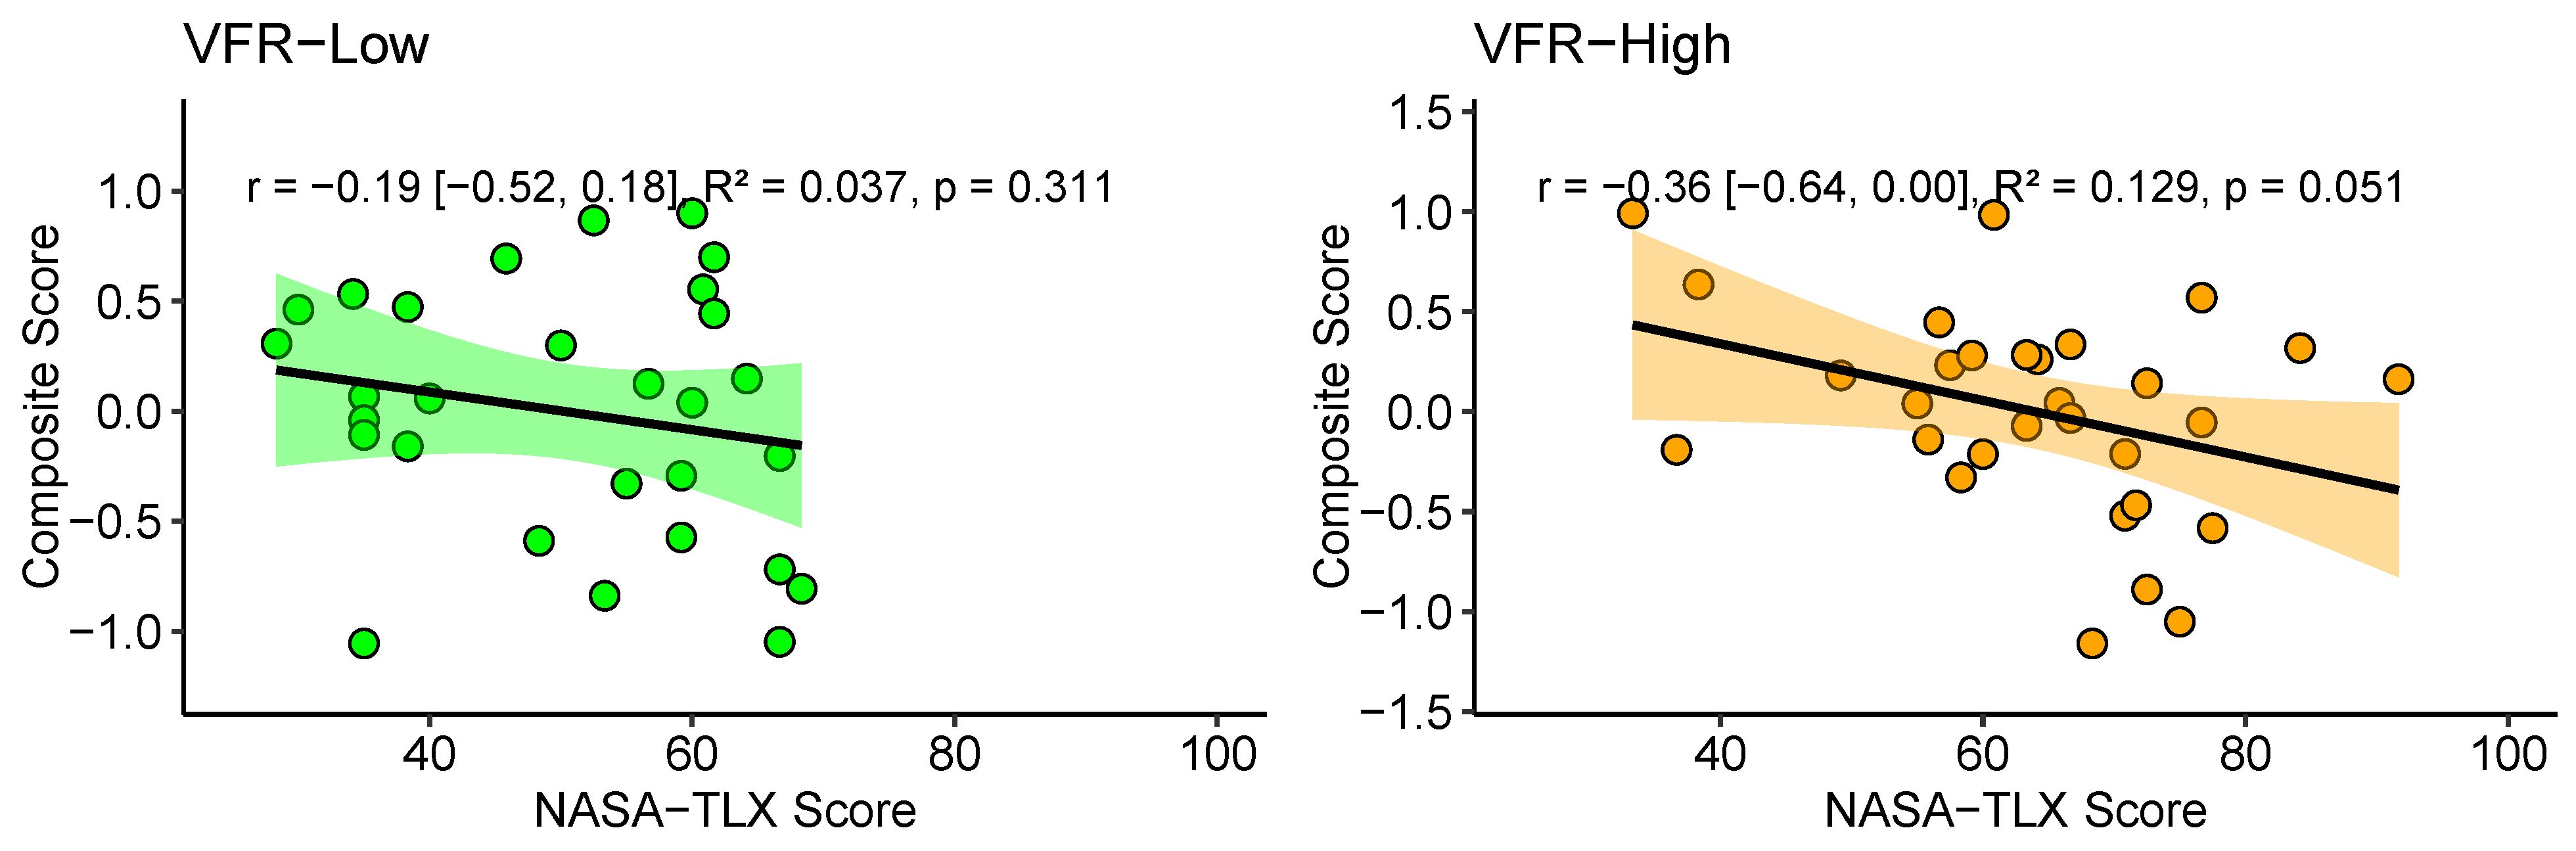
3.3.1. Hypothesis 3a—Subjective Workload
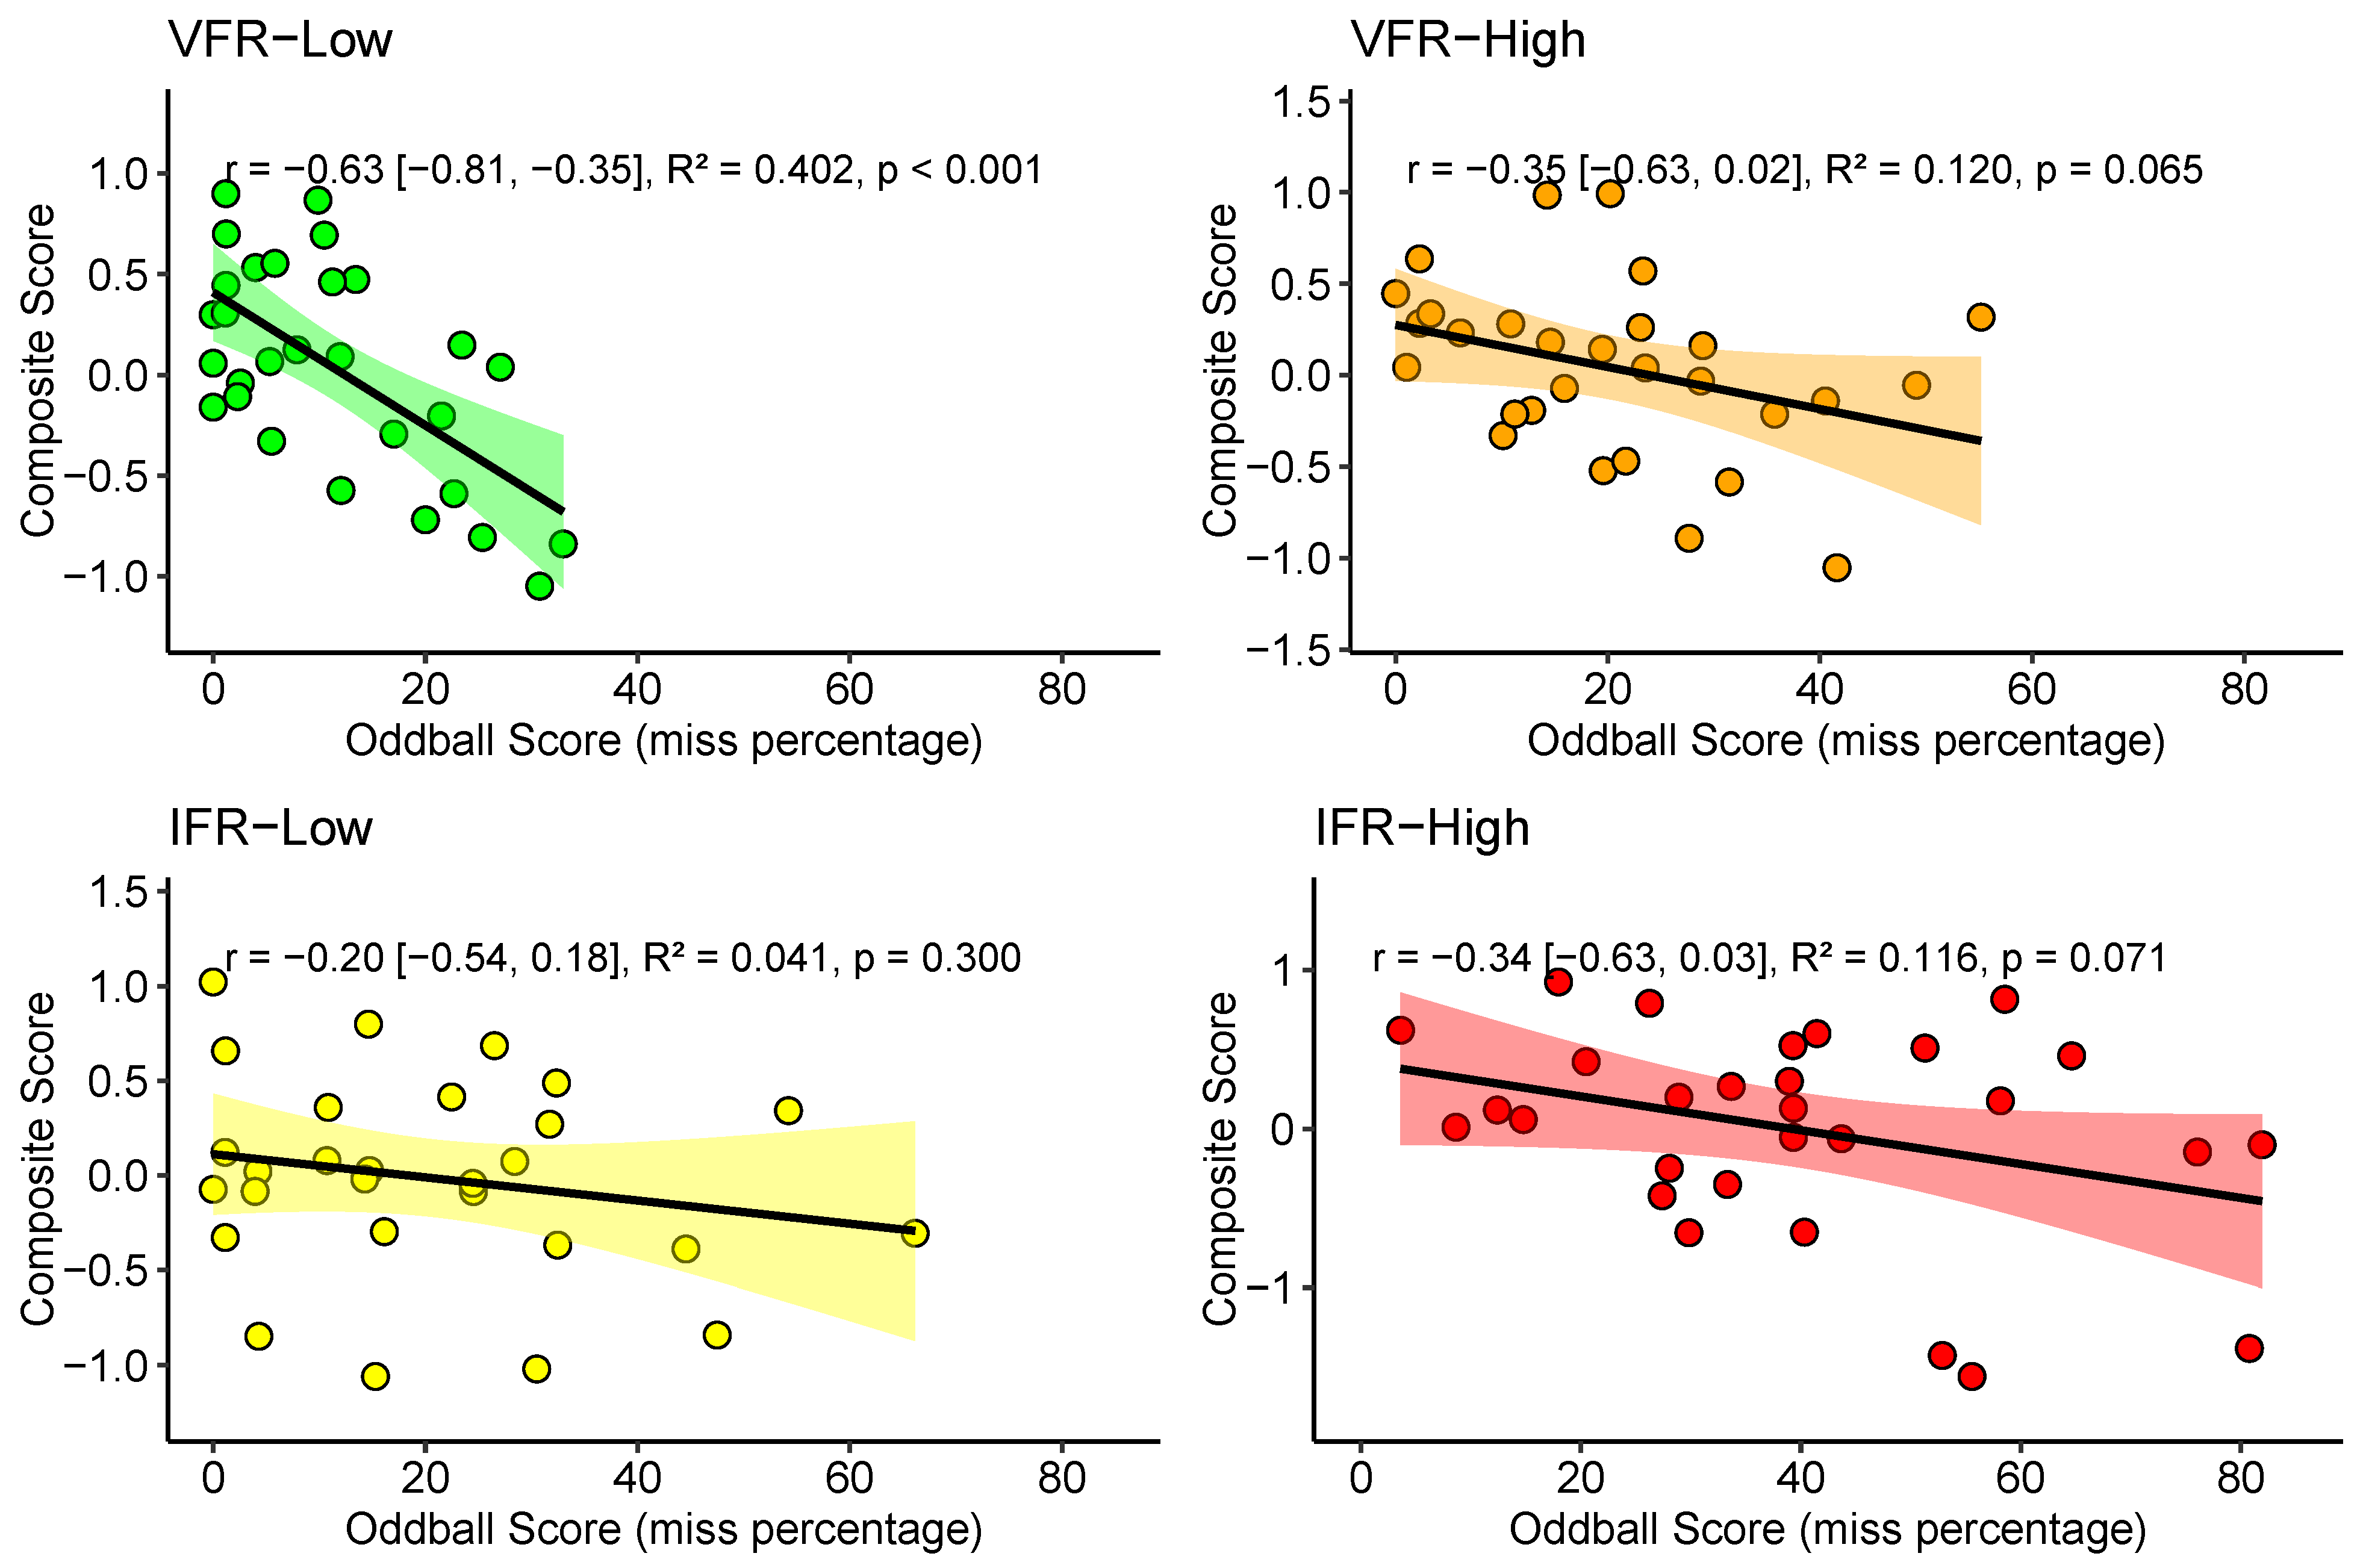
3.3.2. Hypothesis 3b—Objective Workload
3.4. Supplementary Analyses: Flight Hours, Workload and Composite Score
3.5. Flight Performance Visualization (Web Application Questionnaire)
3.6. Summary of Hypotheses and Results
4. Discussion
4.1. Hypothesis 1—Scenarios and Workload
4.2. Hypothesis 2—Subjective and Objective Workload Relationship
4.3. Hypothesis 3—Composite Score and Workload
4.4. Supplementary Analyses: Flight Hours, Workload, and Composite Score
4.5. Flight Performance Visualization
4.6. Limitations and Future Direction
5. Conclusions
Supplementary Materials
Author Contributions
Funding
Institutional Review Board Statement
Informed Consent Statement
Data Availability Statement
Conflicts of Interest
Abbreviations
| TLX | Task-Load Index |
| SD | Standard Deviation |
| VFR | Visual Flight Rule |
| IFR | Instrument Flight Rule |
References
- Bugeja, K.; Spina, S.; Buhagiar, F. Telemetry-based optimisation for user training in racing simulators. In Proceedings of the 2017 9th International Conference on Virtual Worlds and Games for Serious Applications (VS-Games), Athens, Greece, 6–8 September 2017; pp. 31–38. [Google Scholar]
- Trophi.Ai. Available online: https://www.trophi.ai/ (accessed on 20 April 2025).
- O’Hare, D. Human Performance in General Aviation; Routledge: London, UK, 2017. [Google Scholar]
- Shaker, M.H.; Al-Alawi, A.I. Application of big data and artificial intelligence in pilot training: A systematic literature review. In Proceedings of the 2023 International Conference on Cyber Management and Engineering (CyMaEn), Bangkok, Thailand, 26–27 January 2023; pp. 205–209. [Google Scholar]
- Kharoufah, H.; Murray, J.; Baxter, G.; Wild, G. A review of human factors causations in commercial air transport accidents and incidents: From to 2000–2016. Prog. Aerosp. Sci. 2018, 99, 1–13. [Google Scholar] [CrossRef]
- Causse, M.; Dehais, F.; Pastor, J. Executive functions and pilot characteristics predict flight simulator performance in general aviation pilots. Int. J. Aviat. Psychol. 2011, 21, 217–234. [Google Scholar] [CrossRef]
- Haslbeck, A.; Kirchner, P.; Schubert, E.; Bengler, K. A flight simulator study to evaluate manual flying skills of airline pilots. In Proceedings of the Human Factors and Ergonomics Society Annual Meeting, Chicago, IL, USA, 27–31 October 2014; SAGE Publications Sage: Los Angeles, CA, USA, 2014; Volume 58, pp. 11–15. [Google Scholar]
- Lounis, C.; Peysakhovich, V.; Causse, M. Visual scanning strategies in the cockpit are modulated by pilots’ expertise: A flight simulator study. PLoS ONE 2021, 16, e0247061. [Google Scholar] [CrossRef] [PubMed]
- Wang, L.; Zhang, J.; Dong, C.; Sun, H.; Ren, Y. A method of applying flight data to evaluate landing operation performance. Ergonomics 2019, 62, 171–180. [Google Scholar] [CrossRef]
- Hebbar, P.A.; Pashilkar, A.A. Pilot performance evaluation of simulated flight approach and landing manoeuvres using quantitative assessment tools. Sādhanā 2017, 42, 405–415. [Google Scholar] [CrossRef]
- Souza, A.C.d.; Alexandre, N.M.C.; Guirardello, E.d.B. Psychometric properties in instruments evaluation of reliability and validity. Epidemiol. Serv. Saude 2017, 26, 649–659. [Google Scholar] [CrossRef]
- Lehrer, P.; Karavidas, M.; Lu, S.E.; Vaschillo, E.; Vaschillo, B.; Cheng, A. Cardiac data increase association between self-report and both expert ratings of task load and task performance in flight simulator tasks: An exploratory study. Int. J. Psychophysiol. 2010, 76, 80–87. [Google Scholar] [CrossRef]
- Lassiter, D.L.; Morrow, D.G.; Hinson, G.E.; Miller, M.; Hambrick, D.Z. Expertise and age effects on pilot mental workload in a simulated aviation task. In Proceedings of the Human Factors and Ergonomics Society Annual Meeting, Philadelphia, PA, USA, 2–6 September 1996; SAGE Publications Sage: Los Angeles, CA, USA, 1996; Volume 40, pp. 133–137. [Google Scholar]
- Dehais, F.; Roy, R.N.; Scannella, S. Inattentional deafness to auditory alarms: Inter-individual differences, electrophysiological signature and single trial classification. Behav. Brain Res. 2019, 360, 51–59. [Google Scholar] [CrossRef]
- Hart, S.G. NASA-task load index (NASA-TLX); 20 years later. In Proceedings of the Human Factors and Ergonomics Society Annual Meeting, San Francisco, CA, USA, 16–20 October 2006; SAGE Publications Sage: Los Angeles, CA, USA, 2006; Volume 50, pp. 904–908. [Google Scholar]
- Scannella, S.; Peysakhovich, V.; Ehrig, F.; Lepron, E.; Dehais, F. Assessment of ocular and physiological metrics to discriminate flight phases in real light aircraft. Hum. Factors 2018, 60, 922–935. [Google Scholar] [CrossRef]
- Peißl, S.; Wickens, C.D.; Baruah, R. Eye-tracking measures in aviation: A selective literature review. Int. J. Aerosp. Psychol. 2018, 28, 98–112. [Google Scholar] [CrossRef]
- Hsu, C.K.; Lin, S.C.; Li, W.C. Visual movement and mental-workload for pilot performance assessment. In Proceedings of the Engineering Psychology and Cognitive Ergonomics: 12th International Conference, EPCE 2015, Held as Part of HCI International 2015, Los Angeles, CA, USA, 2–7 August 2015; Proceedings 12. Springer: Berlin/Heidelberg, Germany, 2015; pp. 356–364. [Google Scholar]
- Dehais, F.; Dupres, A.; Di Flumeri, G.; Verdiere, K.; Borghini, G.; Babiloni, F.; Roy, R. Monitoring pilot’s cognitive fatigue with engagement features in simulated and actual flight conditions using an hybrid fNIRS-EEG passive BCI. In Proceedings of the 2018 IEEE International Conference on Systems, Man, and Cybernetics (SMC), Miyazaki, Japan, 7–10 October 2018; pp. 544–549. [Google Scholar]
- Gateau, T.; Ayaz, H.; Dehais, F. In silico vs. over the clouds: On-the-fly mental state estimation of aircraft pilots, using a functional near infrared spectroscopy based passive-BCI. Front. Hum. Neurosci. 2018, 12, 187. [Google Scholar] [CrossRef] [PubMed]
- Bobko, P.; Roth, P.L.; Buster, M.A. The usefulness of unit weights in creating composite scores: A literature review, application to content validity, and meta-analysis. Organ. Res. Methods 2007, 10, 689–709. [Google Scholar] [CrossRef]
- Lichtenberger, E.O.; Kaufman, A.S. Essentials of WAIS-IV Assessment; John Wiley & Sons: Hoboken, NJ, USA, 2009; Volume 50. [Google Scholar]
- Yesavage, J.A.; Taylor, J.L.; Mumenthaler, M.S.; Noda, A.; O’Hara, R. Relationship of age and simulated flight performance. J. Am. Geriatr. Soc. 1999, 47, 819–823. [Google Scholar] [CrossRef]
- Taylor, J.L.; Kennedy, Q.; Noda, A.; Yesavage, J.A. Pilot age and expertise predict flight simulator performance: A 3-year longitudinal study. Neurology 2007, 68, 648–654. [Google Scholar] [CrossRef]
- Yesavage, J.A.; Jo, B.; Adamson, M.M.; Kennedy, Q.; Noda, A.; Hernandez, B.; Zeitzer, J.M.; Friedman, L.F.; Fairchild, K.; Scanlon, B.K.; et al. Initial cognitive performance predicts longitudinal aviator performance. J. Gerontol. Ser. Psychol. Sci. Soc. Sci. 2011, 66, 444–453. [Google Scholar] [CrossRef]
- Kennedy, Q.; Taylor, J.; Heraldez, D.; Noda, A.; Lazzeroni, L.C.; Yesavage, J. Intraindividual variability in basic reaction time predicts middle-aged and older pilots’ flight simulator performance. J. Gerontol. Ser. Psychol. Sci. Soc. Sci. 2013, 68, 487–494. [Google Scholar] [CrossRef]
- boeing.com. Statistical Summary of Commercial Jet Airplane Accidents. Available online: https://www.boeing.com/content/dam/boeing/boeingdotcom/company/about_bca/pdf/statsum.pdf (accessed on 20 April 2025).
- ntsb.gov. General Aviation Accident Dashboard: 2012–2021. Available online: https://www.ntsb.gov/safety/data/Pages/GeneralAviationDashboard.aspx (accessed on 20 April 2025).
- Wickens, C.D. Multiple resource time sharing models. In Handbook of Human Factors and Ergonomics Methods; CRC Press: Boca Raton, FL, USA, 2004; pp. 427–434. [Google Scholar]
- Fowler, B. P300 as a measure of workload during a simulated aircraft landing task. Hum. Factors 1994, 36, 670–683. [Google Scholar] [CrossRef]
- Wickens, C.D. Multiple resources and performance prediction. Theor. Issues Ergon. Sci. 2002, 3, 159–177. [Google Scholar] [CrossRef]
- Wickens, C.D. Multiple resources and mental workload. Hum. Factors 2008, 50, 449–455. [Google Scholar] [CrossRef]
- Hart, S.G.; Staveland, L.E. Development of NASA-TLX (Task Load Index): Results of empirical and theoretical research. In Advances in Psychology; Elsevier: Amsterdam, The Netherlands, 1988; Volume 52, pp. 139–183. [Google Scholar]
- R Core Team. R: A Language and Environment for Statistical Computing; R Core Team: Vienna, Austria, 2010. [Google Scholar]
- R Core Team. RStudio: Integrated Development for R; R Core Team: Vienna, Austria, 2015. [Google Scholar]
- Shinyapps.Io. Available online: https://powerbrain-simulator.shinyapps.io/shinyapphf/ (accessed on 20 April 2025).
- Github.Com. Available online: https://github.com/Chenot/FlightSimulatorMetrics (accessed on 20 April 2025).
- Grier, R.A. How high is high? A meta-analysis of NASA-TLX global workload scores. In Proceedings of the Human Factors and Ergonomics Society Annual Meeting, Los Angeles, CA, USA, 26–30 October 2015; SAGE Publications Sage: Los Angeles, CA, USA, 2015; Volume 59, pp. 1727–1731. [Google Scholar]
- Wilson, G.F.; Hankins, T. EEG and subjective measures of private pilot workload. In Proceedings of the Human Factors and Ergonomics Society Annual Meeting, Nashville, TN, USA, 24–28 October 1994; SAGE Publications Sage: Los Angeles, CA, USA, 1994; Volume 38, pp. 1322–1325. [Google Scholar]
- Dehais, F.; Roy, R.N.; Gateau, T.; Scannella, S. Auditory alarm misperception in the cockpit: An EEG study of inattentional deafness. In Proceedings of the Foundations of Augmented Cognition: Neuroergonomics and Operational Neuroscience: 10th International Conference, Toronto, ON, Canada, 17–22 July 2016; Proceedings, Part I 10. Springer: Berlin/Heidelberg, Germany, 2016; pp. 177–187. [Google Scholar]
- Giraudet, L.; St-Louis, M.E.; Scannella, S.; Causse, M. P300 event-related potential as an indicator of inattentional deafness? PLoS ONE 2015, 10, e0118556. [Google Scholar] [CrossRef]
- Causse, M.; Imbert, J.P.; Giraudet, L.; Jouffrais, C.; Tremblay, S. The role of cognitive and perceptual loads in inattentional deafness. Front. Hum. Neurosci. 2016, 10, 344. [Google Scholar] [CrossRef] [PubMed]
- Gibson, Z.; Butterfield, J.; Rodger, M.; Murphy, B.; Marzano, A. Use of dry electrode electroencephalography (EEG) to monitor pilot workload and distraction based on P300 responses to an auditory oddball task. In Proceedings of the Advances in Neuroergonomics and Cognitive Engineering: Proceedings of the AHFE 2018 International Conference on Neuroergonomics and Cognitive Engineering, Orlando, FL, USA, 21–25 July 2019; Springer: Berlin/Heidelberg, Germany, 2019; pp. 14–26. [Google Scholar]
- Thorpe, A.; Nesbitt, K.; Eidels, A. A systematic review of empirical measures of workload capacity. ACM Trans. Appl. Percept. TAP 2020, 17, 1–26. [Google Scholar] [CrossRef]
- Di Stasi, L.L.; Diaz-Piedra, C.; Suárez, J.; McCamy, M.B.; Martinez-Conde, S.; Roca-Dorda, J.; Catena, A. Task complexity modulates pilot electroencephalographic activity during real flights. Psychophysiology 2015, 52, 951–956. [Google Scholar] [CrossRef] [PubMed]
- Verdière, K.J.; Roy, R.N.; Dehais, F. Detecting pilot’s engagement using fNIRS connectivity features in an automated vs. manual landing scenario. Front. Hum. Neurosci. 2018, 12, 6. [Google Scholar] [CrossRef]
- Taheri Gorji, H.; Wilson, N.; VanBree, J.; Hoffmann, B.; Petros, T.; Tavakolian, K. Using machine learning methods and EEG to discriminate aircraft pilot cognitive workload during flight. Sci. Rep. 2023, 13, 2507. [Google Scholar] [CrossRef]


| Type | Difficulty | Visibility | Landing | Failure |
|---|---|---|---|---|
| VFR | Low | Day/clear | Visual | None |
| High | Day/cloudy | Visual | Altitude/speed indicators | |
| IFR | Low | Day/clear | Instruments | None |
| High | Night/fog | Instruments | Left engine |
| Dimension | iN | Item |
|---|---|---|
| Usability (GUI) | 1 | The application’s visual design is attractive |
| 2 | The application is responsive | |
| 3 | The layout of the application is intuitive | |
| Relevance | 1 | The feedback provided is detailed and specific |
| 2 | I understand how scores are calculated and what they represent | |
| 3 | The application clearly presents scores and performance metrics | |
| 4 | The information provided by the application is relevant | |
| Utility (experimental feedback) | 1 | The application is relevant to understand my performance during the experiment |
| 2 | The application helped me identify areas where I could improve my performance | |
| 3 | The application provided useful feedback on my performance during the experiment | |
| Utility (pilot training feedback) | 1 | A similar application would improve the quality of pilot training |
| 2 | A similar application would provide useful feedback for pilots during training | |
| 3 | A similar application would help identify areas where pilots in training could improve | |
| 4 | A similar application would be useful for pilot training |
| Variable | Estimate | SD | CI 95% | df | t | f2 | p |
|---|---|---|---|---|---|---|---|
| Intercept | 49.6 | 2.4 | [44.9, 54.3] | 73 | 20.8 | <0.001 | |
| Difficulty | 14.3 | 2.5 | [9.4, 19.2] | 87 | 5.7 | 0.402 | <0.001 |
| Flight Rule | 8.6 | 2.5 | [3.7, 13.5] | 87 | 3.4 | 0.172 | <0.001 |
| Difficulty × Flight Rule | 4.2 | 3.6 | [−2.8, 11.1] | 87 | 1.2 | 0.005 | 0.246 |
| Variable | Estimate | SD | CI 95% | df | t | f2 | p |
|---|---|---|---|---|---|---|---|
| Intercept | 10.5 | 3.0 | [4.5, 16.5] | 45 | 3.5 | <0.001 | |
| Difficulty | 9.9 | 2.2 | [5.6, 14.3] | 85 | 4.5 | 0.201 | <0.001 |
| Flight Rule | 9.5 | 2.2 | [5.3, 13.8] | 85 | 4.4 | 0.188 | <0.001 |
| Difficulty × Flight Rule | 8.3 | 3.1 | [2.2, 14.3] | 85 | 2.7 | 0.016 | 0.009 |
| Dimension | iN | Item | Mean | SD |
|---|---|---|---|---|
| Usability (GUI) | 1 | Intuitive | 5.76 | 0.62 |
| 2 | Responsive | 5 | 1.48 | |
| 3 | Appealing | 4.67 | 1.32 | |
| Relevance | 1 | Relevance | 6.19 | 0.93 |
| 2 | Score presentation | 6 | 1.14 | |
| 3 | Score understanding | 5 | 1.38 | |
| 4 | Detailed Feedback | 5.76 | 1.14 | |
| Utility (Experimental Feedback) | 1 | Feedback utility | 5.81 | 0.98 |
| 2 | Identify areas to improve | 5.48 | 1.21 | |
| 3 | Relevance | 5.9 | 0.94 | |
| Utility (pilot training feedback) | 1 | Utility of a similar app | 5.86 | 1.59 |
| 2 | Identify areas to improve | 6.14 | 1.11 | |
| 3 | Feedback utility | 5.95 | 1.12 | |
| 4 | Improve training quality | 5.67 | 1.28 |
| Hypothesis and Results | ||
|---|---|---|
Hypothesis 1. Subjective workload (H1a) and objective workload (H1b) are increased in IFR vs. VFR conditions, and in High vs Low difficulty conditions (mixed-effects models). | ||
| H1a. | High > Low | , , * |
| IFR > VFR | , , * | |
| H1b. | High > Low | , , * |
| IFR > VFR | , , * | |
Hypothesis 2. Subjective and objective workload have a strong relationship (mixed-effects model). | ||
| H2. Subjective and objective workload | , * | |
Hypothesis 3. Subjective (H3a) and objective workload (H3b) are negatively associated with the composite score in all scenarios (correlations). | ||
| H3a. | VFR-low | , |
| VFR-high | , , | |
| IFR-low | , , * | |
| IFR-high | , , * | |
| H3b. | VFR-low | , , * |
| VFR-high | , , | |
| IFR-low | , , | |
| IFR-high | , , | |
Disclaimer/Publisher’s Note: The statements, opinions and data contained in all publications are solely those of the individual author(s) and contributor(s) and not of MDPI and/or the editor(s). MDPI and/or the editor(s) disclaim responsibility for any injury to people or property resulting from any ideas, methods, instructions or products referred to in the content. |
© 2025 by the authors. Licensee MDPI, Basel, Switzerland. This article is an open access article distributed under the terms and conditions of the Creative Commons Attribution (CC BY) license (https://creativecommons.org/licenses/by/4.0/).
Share and Cite
Chenot, Q.; Riedinger, F.; Dehais, F.; Scannella, S. Assessing and Visualizing Pilot Performance in Traffic Patterns: A Composite Score Approach. Safety 2025, 11, 37. https://doi.org/10.3390/safety11020037
Chenot Q, Riedinger F, Dehais F, Scannella S. Assessing and Visualizing Pilot Performance in Traffic Patterns: A Composite Score Approach. Safety. 2025; 11(2):37. https://doi.org/10.3390/safety11020037
Chicago/Turabian StyleChenot, Quentin, Florine Riedinger, Frédéric Dehais, and Sébastien Scannella. 2025. "Assessing and Visualizing Pilot Performance in Traffic Patterns: A Composite Score Approach" Safety 11, no. 2: 37. https://doi.org/10.3390/safety11020037
APA StyleChenot, Q., Riedinger, F., Dehais, F., & Scannella, S. (2025). Assessing and Visualizing Pilot Performance in Traffic Patterns: A Composite Score Approach. Safety, 11(2), 37. https://doi.org/10.3390/safety11020037