Article

Assessing Micromobility Users’ Knowledge of Regulations: Valencia (Spain) Case Study

by
Alejandra Sofía Fonseca-Cabrera
*,
David Llopis-Castelló
,
Ana María Pérez-Zuriaga
and
Alfredo García
Highway Engineering Research Group, Universitat Politècnica de València, 46022 Valencia, Spain
*
Author to whom correspondence should be addressed.
Safety 2025, 11(2), 36; https://doi.org/10.3390/safety11020036
Submission received: 28 February 2025 / Revised: 8 April 2025 / Accepted: 8 April 2025 / Published: 14 April 2025

Abstract

:
Micromobility is a current and growing integrated transport mode that has its own regulations and requirements for riding. In this context, bicycle usage has been regulated years before. However, the coexistence with new micromobility vehicles, such as e-scooters, has generated the necessity of the development of additional regulatory frameworks. Administrators and technicians have been working for the last 7 years on this aspect. However, a proper evaluation from the user perspective has not been carried out. Thus, there is a need to identify whether micromobility users are aware of the regulations that they must comply with. This research has analyzed the users’ knowledge through a survey, a transport-typical data collection method, but used implicitly as an evaluation, where a score was obtained per user. As a result, the average score obtained was 4.5, reflecting an insufficient qualification. Additionally, statistically significant differences were found between the average score obtained between cyclists and personal mobility vehicle (PMV) users, as well as mean differences between age, micromobility vehicle, ownership, and holding a driver’s license. In conclusion, a new gap has been found in relation to micromobility users’ behavior that has to be addressed.

1. Introduction

Micromobility, which includes bicycles, e-bicycles, and personal mobility vehicles (PMV) such as e-scooters, has emerged as a significant mode of urban transportation worldwide [1]. It is currently a growing and integrated form of transport that operates under its own set of regulations and usage requirements.
Historically, bicycles were the primary form of micromobility, initially used privately and later expanded through the development of shared systems. Although the first bike-sharing system was introduced in the 1960s, its widespread adoption and growth accelerated primarily in the late 2000s [2]. Today, many major cities around the world have implemented public or private bike-sharing systems. In contrast, e-scooters have only recently gained prominence, with rapid proliferation beginning in the United States in 2018 [3], following similar trends in other countries. These vehicles have become popular through both private ownership and shared services.
However, integrating bicycles and e-scooters into urban environments to effectively promote micromobility usage has proven complex, raising numerous regulatory and operational challenges over the past seven years for policymakers, engineers, and urban planners [2,4,5,6,7,8].
To address these challenges, many countries have adopted a dual-level policy framework to regulate micromobility, combining national guidelines with locally tailored policies. These regulations typically address infrastructure usage, speed limits, designated parking, and safety requirements. This approach is common across several European countries including France, Netherlands, Germany, Italy, Denmark, and Spain, as well as in Canada [9,10,11,12]. In contrast, in the United Kingdom (i.e., England, Scotland, and Wales), only nationwide regulations apply to bicycle use, and e-scooters remain prohibited [13]. In the United States, no federal-level regulations exist; instead, policies are defined at the state and municipal levels [1].
Despite the existence of such regulatory frameworks, considerable variability persists within and across countries, and users are often subject to multiple, overlapping rules. This raises critical questions including the following: To what extent are micromobility users aware of the applicable regulations? Do they comply with these regulations? How can user knowledge and adherence to micromobility laws be ensured? Addressing these questions require empirical investigation.
Surveys have long been a primary tool for collecting data in the transportation sector. In micromobility research, surveys have been widely used to analyze various factors and remain one of the most prominent sources of primary data [14]. For instance, a survey conducted in Vienna examined the demographics of e-scooter users, their trip purposes, and substitution effects on motorized transport [15]. A similar study in Palermo explored user preferences regarding ownership, rental, and shared scooter services, as well as perceptions and usage frequency [16]. Additionally, a stated preference survey utilizing a mixed logit model was applied to evaluate motivational factors influencing mode-switching to shared e-scooters and mopeds [17].
Bicycle-related surveys have gone beyond simple usage characterization, helping to fill data gaps concerning user behavior, safety, and legal compliance. A cross-country study employed logistic regression to analyze cycling habits, helmet use, and self-reported accidents, revealing significant underreporting of bicycle crashes [18]. Similarly, self-reported surveys have recently been used to assess e-scooter crash risks, linking user demographics and behavioral factors to accident involvement using statistical models such as risk ratios, negative binomial regressions, and Poisson robust variance regressions [19].
In relation to pedestrian–micromobility interactions, a 2023 systematic review identified 42 studies (1995–2022) that used surveys to assess (i) level of service estimations, (ii) collision, injury, and casualty rates, (iii) attitudes, perceptions, and experiences, and (iv) conflicts and interactions. Many of these studies combined surveys with field data collection [14]. Additionally, Likert-scale surveys have been employed to examine user perceptions of infrastructure conditions [20] and perceived risk during operational conflicts [21]. In summary, survey-based research has been extensively applied to the study of micromobility for both planning and operational purposes.
The city of Valencia, Spain—the 2024 European Green Capital—serves as an ideal case study due to its high micromobility usage, well-established bicycle infrastructure, efficient public bike-sharing system, and regulatory framework allowing both bicycles and e-scooters to circulate under specific conditions. Furthermore, no license or permit is required to operate these vehicles, and dual-level policies apply. For these reasons, Valencia was selected as the site for this study, which aims to address the previously stated research questions.
Given the demonstrated functionality and flexibility of surveys, this study seeks to assess micromobility users’ knowledge of applicable regulations through an online evaluation survey. The underlying hypothesis is that such knowledge may vary depending on socio-demographic characteristics (e.g., age and gender) and mobility-related factors (e.g., vehicle type and possession of a driver’s license).
This article is structured as follows: first, the materials and methods are described, including a review of applicable regulations, survey design, data collection, and analytical methodology. This is followed by a presentation of the results and, finally, a discussion of the findings with conclusions and recommendations for future research.

2. Materials and Methods

The development of this research was divided into four stages: (i) Regulations review, (ii) Survey design, (iii) Data collection, and (iv) Analysis of users’ knowledge. In this section, each stage process is presented.

2.1. Regulations Review

An exhaustive review of the current regulatory framework was conducted. In Spain, as in many other countries, micromobility is governed by both national legislation and local ordinances. The key regulatory documents include the General Traffic Regulations [10], the Technical Specifications for Personal Mobility Vehicles (PMVs) [22], and, at the local level, the Valencia Municipal Mobility Ordinance [23].
From a hierarchical perspective, local policies must align with national legislation, and users are required to comply with all applicable regulations. The General Traffic Regulations [10] establish traffic rules for all vehicle types permitted on Spanish roads, with a primary focus on motorized traffic and interurban routes. This document delegates responsibility for regulating urban mobility to local governments through municipal ordinances.
Although the national framework includes some bicycle-related rules—such as restrictions on alcohol and drug use, right-of-way regulations, and mandatory use of safety equipment (e.g., lights and helmets on interurban roads)—it initially did not address PMVs. To address this gap, the General Directorate of Traffic (DGT) published the Technical Specifications for PMVs [22], thereby establishing a legal framework for their use.
Under current Spanish law, a PMV is defined as a vehicle with one or more wheels, equipped with a single seat, and powered exclusively by electric motors. These vehicles must have a maximum design speed between 6 and 25 km/h. A saddle is permitted only if the vehicle incorporates a self-balancing system.
The technical specifications establish requirements for maximum power output, and for physical dimensions including height, length, width, saddle height, and handlebar height (depending on whether a self-balancing system is used). PMVs must also include systems for speed control, braking, parking stabilization, front and rear lighting, and an audible warning device (e.g., a bell). Additional criteria regarding electrical safety, wheel conditions, and certification are also outlined in the document.
As of 22 January 2024, all PMVs sold in Spain must comply with these specifications. Vehicles lacking certification will be prohibited from circulation starting 22 January 2027. A transitional period is currently in effect.
The third regulatory document reviewed was the Valencia Municipal Mobility Ordinance [23], which governs the use of urban roads and public spaces by both motorized and non-motorized users. It provides specific regulations for bicycles and PMVs, including user rights and responsibilities, permitted circulation areas, speed limits for bike lanes and shared roads, parking rules, required safety accessories, and visibility requirements. However, vehicle classifications and specifications differ between bicycles and PMVs.
For bicycles and electric bicycles (defined as pedal-assist cycles with a motor output of up to 250 W, which disengages upon stopping pedaling or reaching 25 km/h), the regulations are identical. PMVs are categorized into (i) Type A which is self-balancing vehicles and small, lightweight electric scooters, and (ii) Type B which is larger electric scooters, typically equipped with a seat and electric motor. Each PMV type is subject to distinct regulatory requirements. Additionally, a minimum age is mandated for operation. In cases where PMV-specific regulations are not provided, bicycle regulations apply by default.
These three regulatory documents served as the foundation for the survey design described in the following section.

2.2. Survey Design

The survey was structured according to the framework illustrated in Figure 1 and focused on two main components. First, participants were asked to provide general information regarding their mobility patterns and demographic characteristics. To ensure that only current and frequent micromobility users completed the section on regulations, a control question was included.
Second, two separate questionnaires were developed based on the type of micromobility vehicle primarily used by the respondent. This classification followed the definitions established in both national and local Spanish regulations, as previously outlined.
Since the primary objective of the survey was to evaluate micromobility users’ awareness of current regulations, it was designed as an assessment tool that produced a gross score upon completion. All questions were multiple choice with a single correct answer and included an “I don’t know” option. Only correct responses contributed one point to the gross score.
Participants were shown their final score along with the correct answer for each question, with the aim of facilitating immediate learning and awareness.
Survey items were organized into five categories based on the regulatory content. The statements presented to respondents are shown in Table 1 and Table 2, corresponding to bicycles and PMVs, respectively. The correct answers, based on both local ordinances and national regulations (when applicable), are also included.
The survey was created and distributed using Microsoft Forms.

2.3. Data Collection

Data collection was conducted between 1 July and 15 November 2024. The survey was distributed online to ensure broad outreach, using an eye-catching post accompanied by a unique Microsoft Forms link. Participants were recruited through two primary channels: the academic community (via institutional email) and the general public (via social media platforms such as X, Facebook, and LinkedIn). Participation was entirely voluntary, and no incentives or rewards were offered upon completion of the survey.

2.4. Analysis

2.4.1. Definition of Variables

The primary outcome of the survey was the gross score obtained by each participant, which was defined as the dependent variable. For analysis purposes, this score was standardized using a base-10 scale, as described by the following equation:
S c o r e = g r o s s   s c o r e × 10 T o t a l   n u m b e r   o f   q u e s t i o n s
The resulting scale ranges from 0 to 10, where higher values indicate greater regulatory knowledge.
In addition, five categorical independent variables were selected for studying their influence on the results, which are as follows:
  • Age. Discrete variable;
  • Sex. Categorical variable: Man, woman, I rather not to say;
  • Type of micromobility vehicle. Categorical variable: Bicycle and PMV;
  • Ownership. Categorical variable: Own, not own (rented, public share system);
  • Driver’s license possession. Categorical variable (yes or no).

2.4.2. Sample Size

To ensure that the collected data are representative of the overall population and tend to follow a normal distribution, the minimum required sample size was determined based on the central limit theorem [24,25] as follows:
E S = S a m p l i n g   e r r o r   Z
n = p 1 p E S 2
n = n 1 + n N
where Z parameter value is 1.96 for a confidence level of 95%, p is the percentage of micromobility users in the city and N, the city population.
Given that Valencia city has 807.693 inhabitants (N), according to the Spanish National Statistical Institute [26], and the percentage of micromobility users (p) is 26.57% [27], a minimum of 153 respondents is needed in order to guarantee a confidence level of 95% and a maximum assumed error of 7%.

2.4.3. Statistical Analysis

Descriptive statistical methods were employed to evaluate participants’ knowledge of micromobility regulations. Initially, general descriptive metrics were calculated for all responses, followed by a stratified analysis based on predefined socio-demographic and mobility-related variables. In addition, knowledge scores were analyzed by regulatory category, as defined in Table 1 and Table 2.
To assess whether independent variables influenced participants’ overall scores, univariable analyses were conducted. One-way ANOVA tests were applied to compare mean scores across groups, after confirming the assumptions of normality and homogeneity of variance. Where significant differences were detected, post hoc tests were used to identify specific group-level variations.
For multivariable analysis, independence tests were conducted across the five independent variables to evaluate their relative contribution to participants’ regulatory knowledge. This analysis was not intended for prediction, but rather to explore the extent to which each variable influenced awareness.
All analyses were conducted using Python 3.10 in Google Colaboratory. The following libraries were utilized for data processing, statistical testing, and visualization: NumPy 2.0.2, Pandas 2.2.2, Statsmodels 0.14.4, Matplotlib 3.10.0, and Seaborn 0.13.2.

3. Results

3.1. Participants

A total of 298 survey responses were collected, of which 167 corresponded to active micromobility users, as identified by a control question included in the questionnaire. No responses were excluded from this subset, as completion times were verified to ensure validity.
The total time required to complete the survey varied widely; non-micromobility users typically finished in under one minute, while micromobility users took up to twenty minutes, with an average completion time of approximately six minutes.
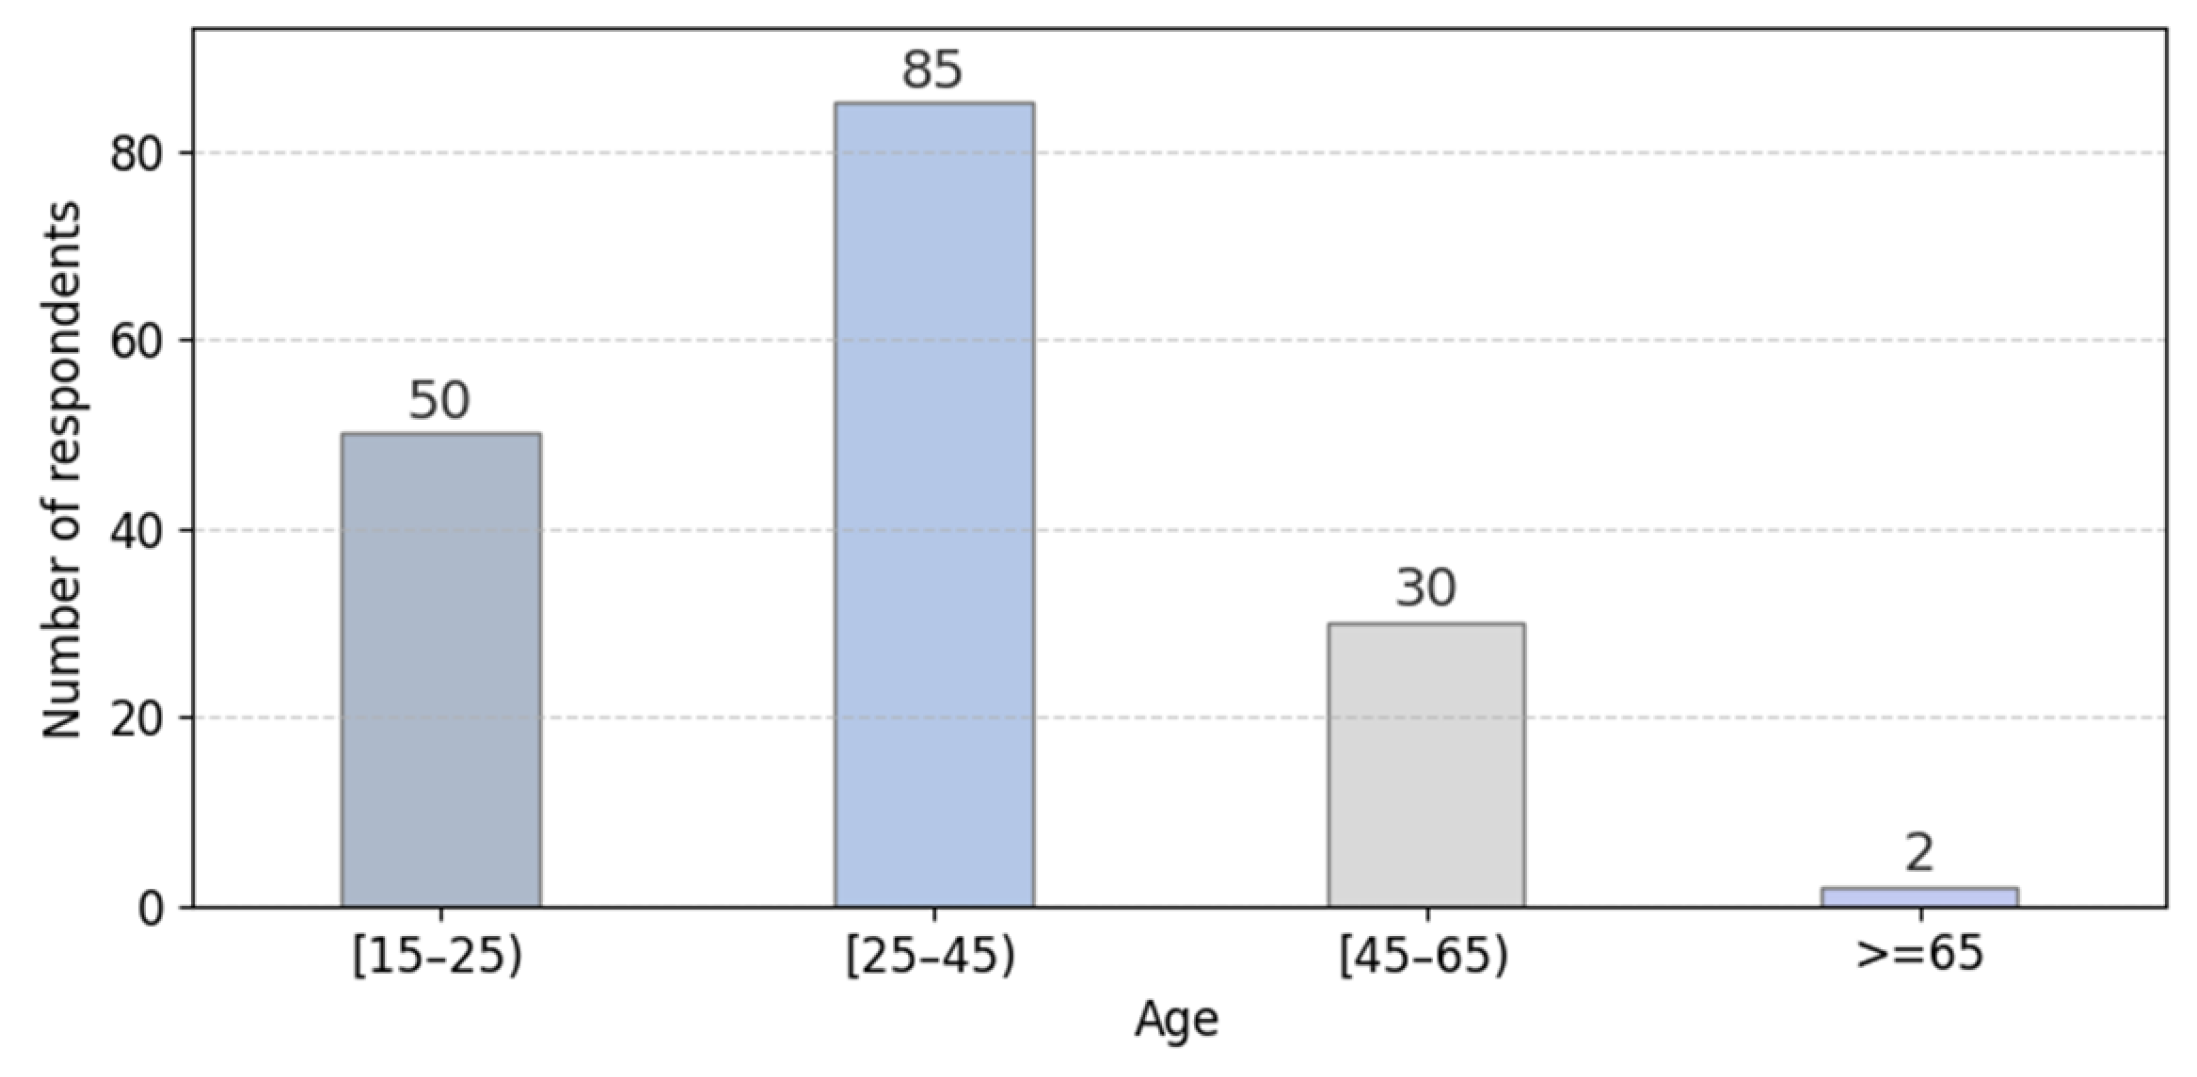
Among micromobility users, 31.13% identified as women and 68.86% as men. Participants’ ages ranged from 18 to 78 years. The largest age group was 25–44 years (50.9%), followed by 15–24 years (29.9%) and 45–65 years (18.0%). The age distribution is presented in Figure 2.
Regarding the primary micromobility vehicle used (Figure 3), 79.0% of participants reported commuting by bicycle. The majority of them relied on the public bike-sharing system “Valenbisi” in Valencia (39.5%) or used their own bicycle (32.9%). In contrast, only 4.2% used rental bicycles and 2.4% reported using their own electric bicycle.
As for personal mobility vehicles (PMVs), 14.4% of respondents owned an electric scooter, 2.4% reported using a non-electric scooter, and 1.2% relied on rental e-scooters. Overall, more than half of the respondents (55.0%) owned a micromobility vehicle, either a bicycle or a PMV, while 74.3% held a valid driver’s license.

3.2. Univariate Analysis

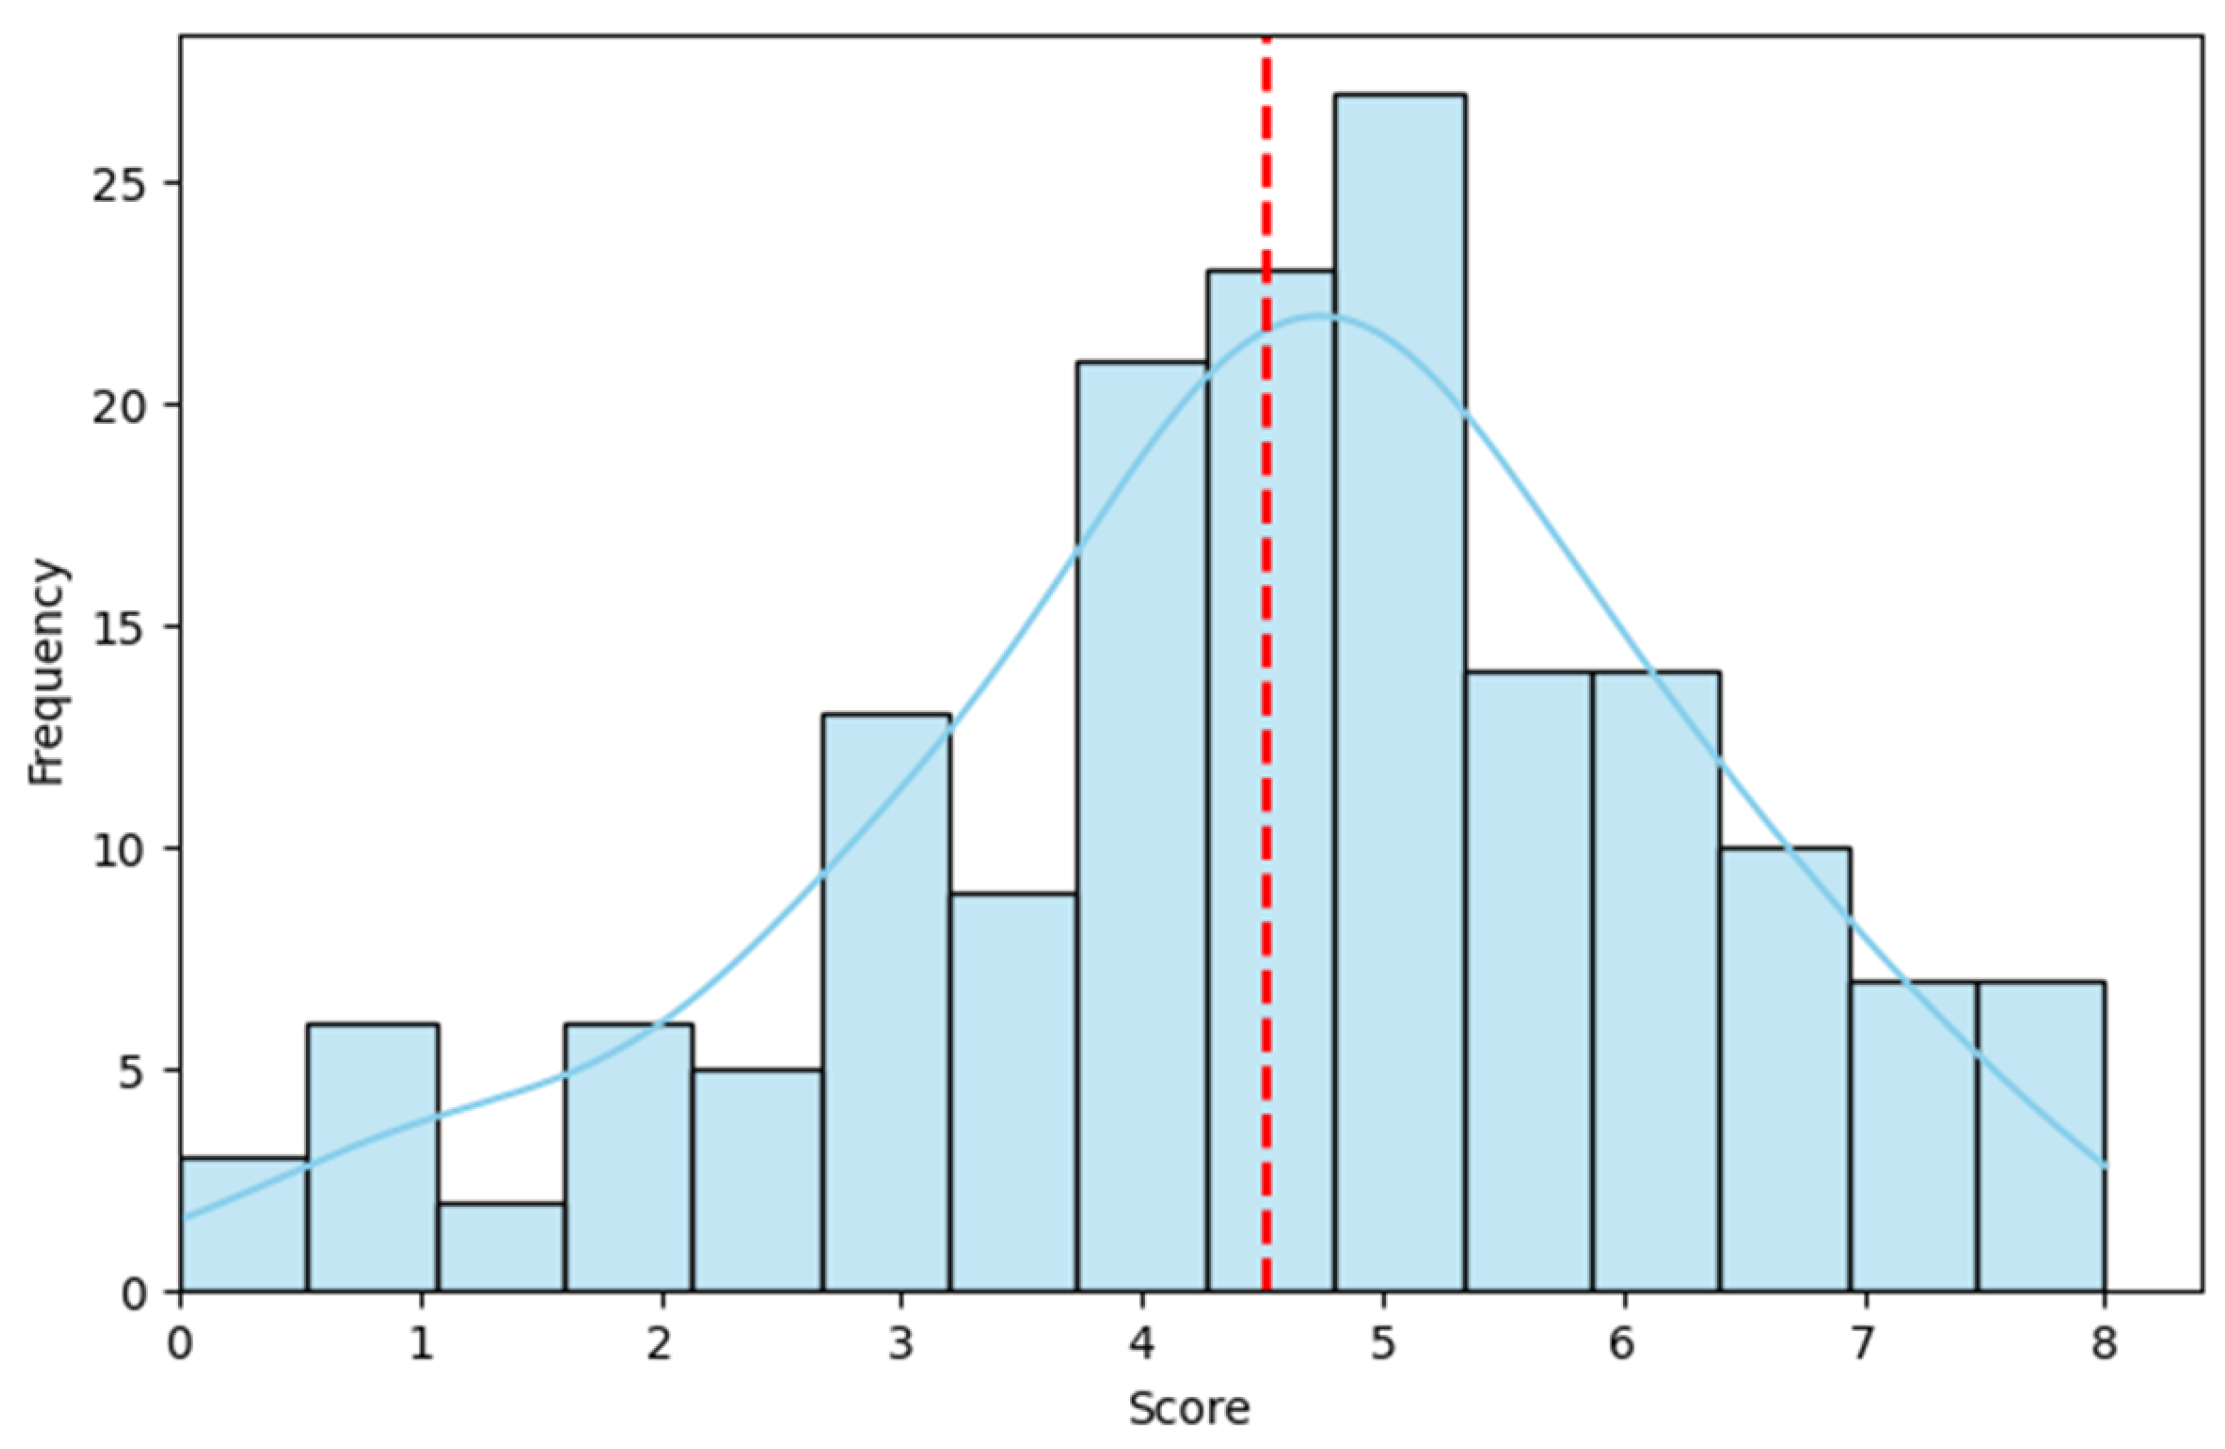
The overall mean knowledge score among micromobility users was 4.5 out of 10 (SD = 1.67), indicating a generally insufficient level of regulatory awareness. The distribution of scores approximated a normal distribution (Figure 4), as confirmed by a Kolmogorov–Smirnov test (p = 0.1128).
To better understand variations among user profiles, the average score was also calculated across different socio-demographic and mobility-related groups (Table 3). Substantial differences in mean scores were observed between groups.
Participants aged 15–24 and 45–65 scored 0.41 and 0.54 points higher, respectively, than those in the 25–44 age group. Although participants over 65 years old had the highest mean score (6.0), this result is considered biased due to the very small sample size (n = 2) within this subgroup.
With respect to gender, male respondents outperformed female respondents by an average of 0.52 points, while both groups had similar standard deviations, indicating comparable variability in responses.
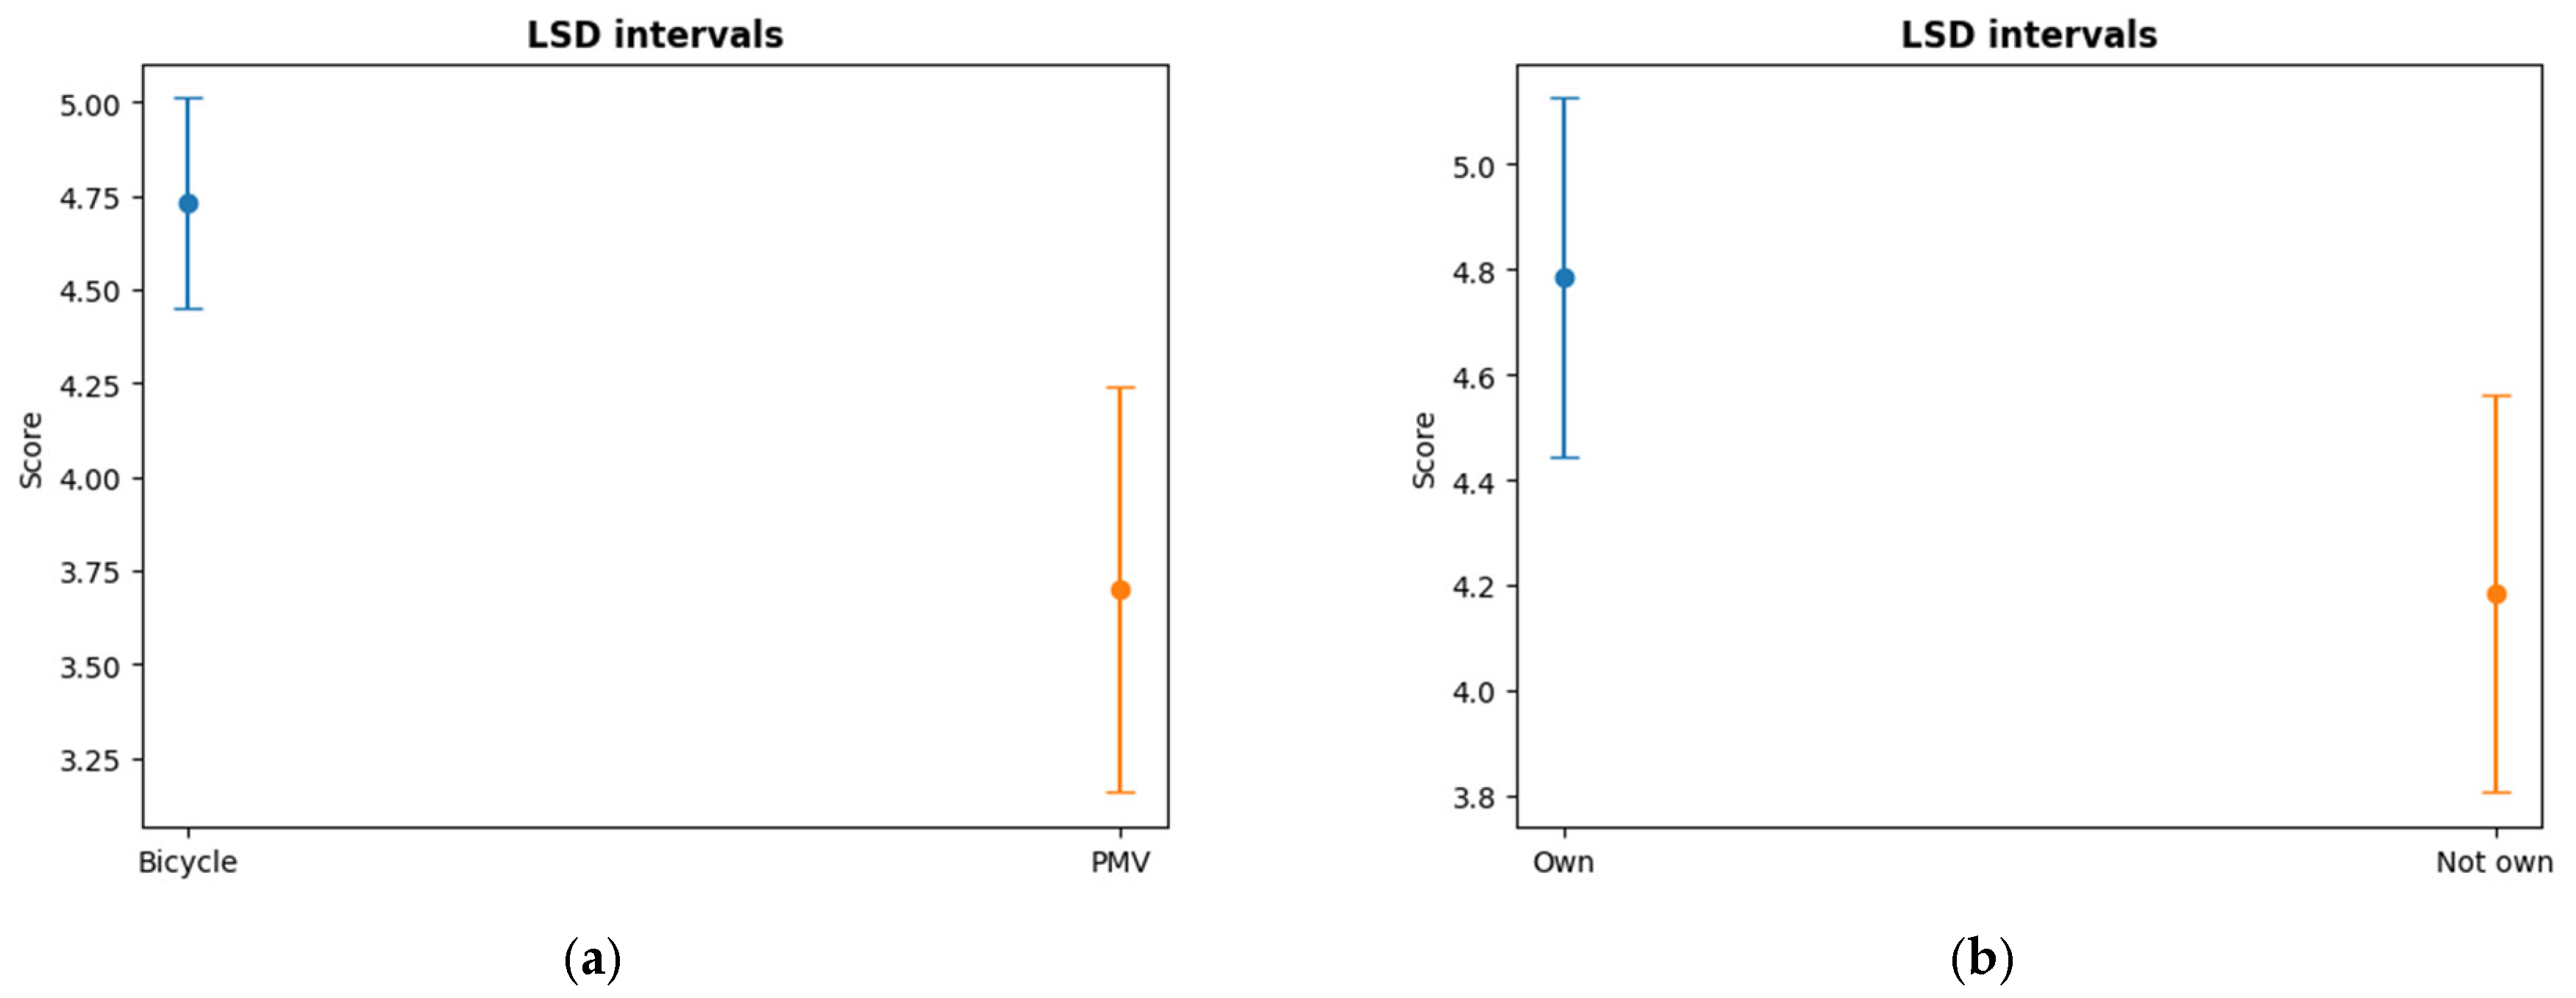
The most notable difference emerged when comparing micromobility vehicle types, cyclists achieved a mean score of 4.73, whereas PMV users scored significantly lower, with an average of 3.70. This gap is consistent with expectations, given the ongoing regulatory changes and greater complexity surrounding PMVs. These vehicles often require more specific safety and operational requirements than bicycles, which are more established within existing infrastructure.
In terms of ownership, individuals who did not own a micromobility vehicle scored on average 0.6 points lower and exhibited greater score variability. Lastly, participants who held a driver’s license scored 0.42 points higher than those without one. This may reflect a broader exposure to traffic regulations, as some aspects of micromobility regulations are included within the general traffic code for motorized vehicles.
Despite the differences observed, all groups scored below 5 out of 10, confirming a general lack of knowledge across all subgroups. Therefore, it can be concluded that there is a widespread lack of awareness among micromobility users.
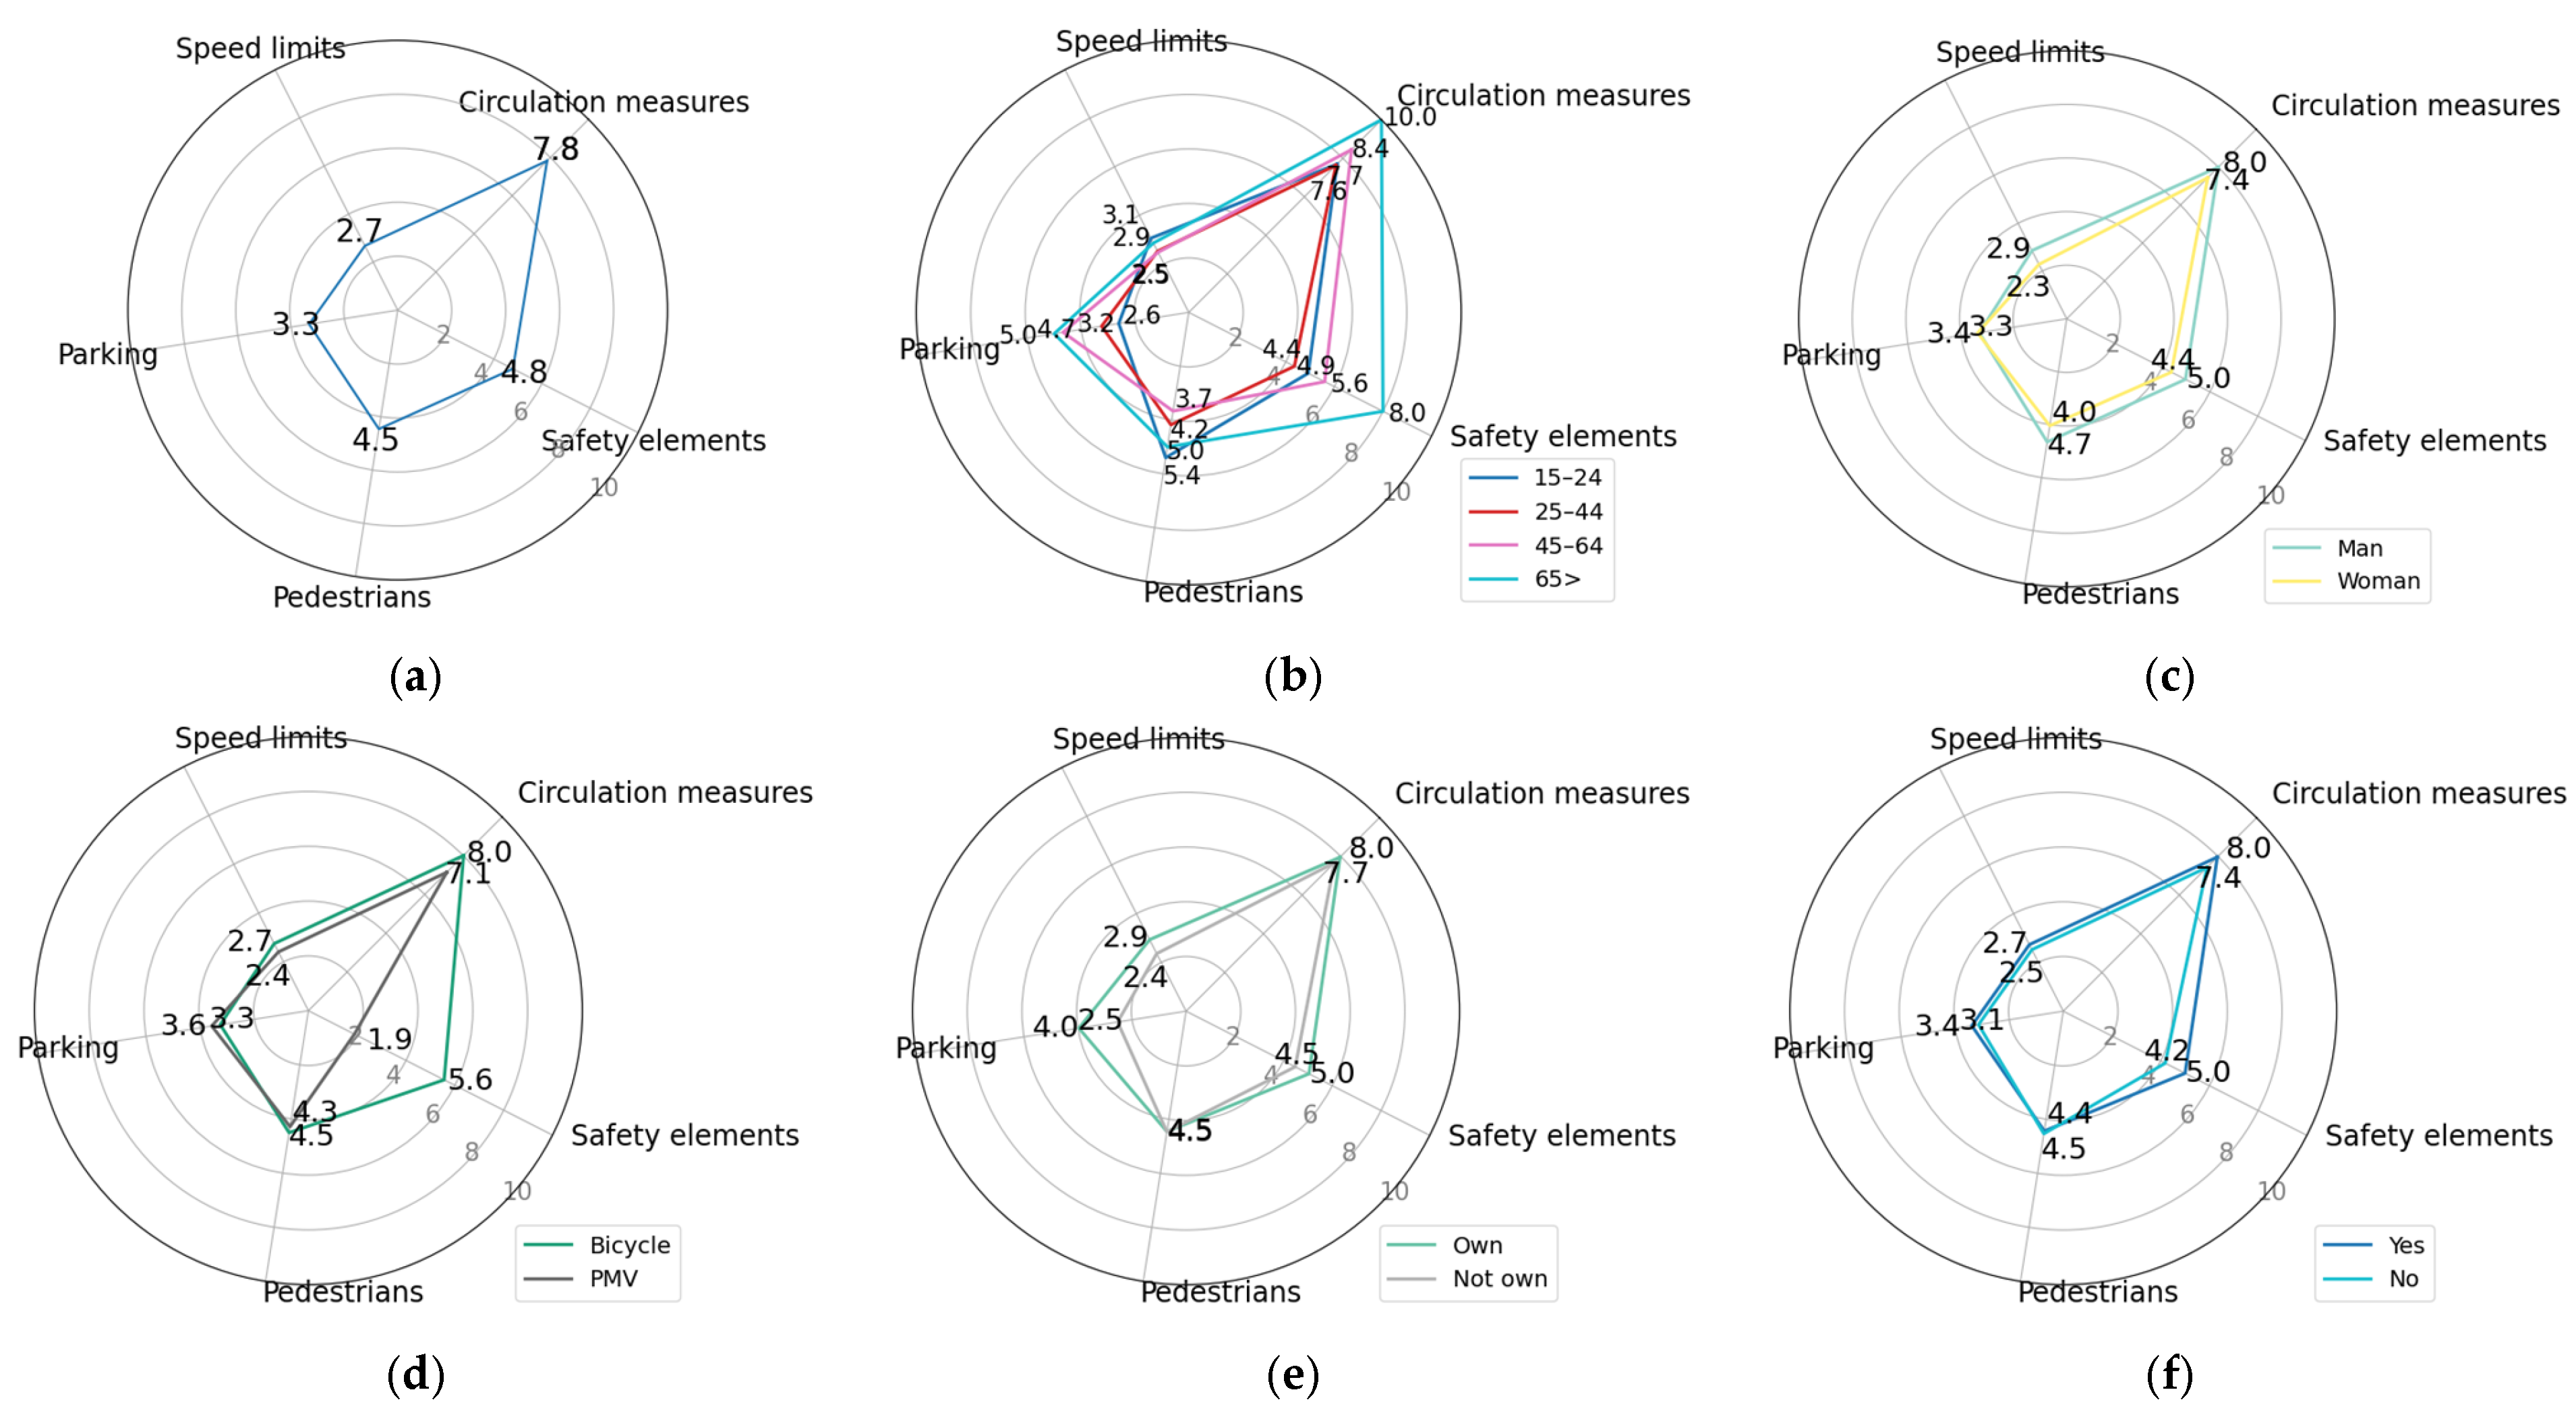
As mentioned previously, regulations address various needs and safety concerns on roads and bike lanes. To identify the specific areas in which users show the least awareness, average scores were calculated for each policy category defined in the survey design. These scores were standardized on a 10-point scale, considering the number of questions in each section.
Figure 5a shows that, from a general perspective, the most critical category is speed limits (score = 2.7), followed by parking regulations (score = 3.3). Scores for pedestrian-related policies and safety elements were slightly higher, averaging 4.4 and 4.8, respectively, while the highest average score was observed in the circulation measures category (score = 7.8).
The categorical analysis was also performed by subgroups, and a consistent trend was observed across all groups. Circulation measures consistently received the highest average scores, all above 7. In contrast, scores related to pedestrian policies, parking regulations, and safety elements generally ranged between 3 and 5, with few exceptions. For example, individuals who do not own a micromobility vehicle scored particularly low on parking-related questions—unsurprisingly, as they have little need to be familiar with such regulations. Finally, the speed limits category showed the lowest scores overall, with all subgroup averages falling below 3.
With respect to average scores by micromobility vehicle type (Figure 5d), cyclists achieved slightly higher overall scores. In the category of safety elements, although the mean score of 5.6 was still suboptimal, a significant proportion of respondents incorrectly identified certain items as mandatory. 24.6% believed helmet use was compulsory, and 62.7% mistakenly considered the use of a bell as a legal requirement, when in fact they were not. However, from a safety point of view these results are not negative at all.
In the pedestrian-related category, 67.9% of cyclists correctly recognized pedestrian priority when applicable. Regarding the minimum safe passing distance, only 21.6% selected the correct response, while 35.8% selected a greater distance. Conversely, 5.2% and 9.7% selected a shorter distance or no distance at all, respectively. Additionally, 27.6% indicated that they did not know the correct answer.
In terms of parking regulations, nearly 30% of users were unaware of the restriction against parking next to trees, and 56% did not know about the time limit for parking near urban furniture.
The lowest score among cyclists was once again in the speed limits category, with a mean of 2.7. Detailed response distributions are presented in Table 4.
Among PMV (personal mobility vehicle) users, 62.9% correctly identified their priority over pedestrians when circulating in bike lanes. However, 40% were unaware of the minimum safety distance, and 8.6% believed that no such requirement exists. Regarding parking restrictions, 25.7% did not know about the prohibition of parking next to trees, while 11.4% answered incorrectly. Additionally, 54.3% were unaware of the maximum allowable time to park near urban furniture.
The lowest score among PMV riders was in the safety elements category, with an average of 1.9. Nevertheless, this result should be interpreted with caution. Safety equipment requirements vary depending on the specific type of PMV, and as such, strict adherence to regulations was not always reflected in the answers. In fact, over 74% of respondents considered helmet and bell use mandatory, and 85.7% considered the use of lights obligatory. Regarding insurance and vehicle registration, approximately 26% of users indicated that they did not know the correct answer.
Finally, Table 5 presents detailed responses related to speed limits. Specifically, for motorized roads, only 34.3% of PMV users correctly identified the circulation restrictions. In contrast, 17.1% admitted not knowing the answer, while 48.6% responded incorrectly.

Inferential Analysis

Based on the results presented in Table 3, a statistical hypothesis test was conducted to determine whether statistically significant differences exist between the standardized scores obtained by each subgroup. To this end, the assumption of normality was assessed using the Kolmogorov–Smirnov test (for sample sizes greater than 50) and the Shapiro–Wilk test (for sample sizes smaller than 50) [28]. In both cases, the null hypothesis (Ho) stated that the data followed a normal distribution (Table 6). The p-values obtained for all samples were greater than 0.005; therefore, it can be assumed that the data are normally distributed at a 95% confidence level.
Since the data were normally distributed, the Bartlett test for homoscedasticity was performed to verify the assumption of equal variances. As shown in Table 7, the data met this assumption, as all p-values were greater than 0.005. Therefore, it can be concluded with 95% confidence that the variance are equal across groups. Given the homogeneity of variance, pairwise analysis was not required.
Consequently, a parametric ANOVA test was conducted for each grouping variable (Table 8). The analysis revealed statistically significant differences between micromobility vehicle subgroups (bicycle vs. PMV) and ownership status subgroups (own vs. not own).
In addition, effect sizes were calculated for the variables showing statistically significant differences. For micromobility vehicle type, the effect size was η2 = 0.0631, indicating a medium effect. For ownership status, the effect size was η2 = 0.0321, which corresponded to a small effect.
An LSD (least significant difference) post hoc test was also conducted (Table 9). The results confirmed significant differences in mean scores between bicycle and PMV users. LSD intervals did not overlap (Figure 6a), and the p-value was below 0.005. In contrast, although the p-value for the ownership group was also below 0.005, the LSD intervals overlapped (Figure 6b), indicating that the difference in means between owners and non-owners was not substantial relative to the within-group variability.
In summary, the five variables selected for independent analysis of the standardized scores, allowed for the identification of variations in mean scores across subgroups. From a socio-demographic perspective, individuals aged 45–64 obtained higher scores, as did men compared to women. In terms of mobility-related factors, bicycle users outperformed PMV riders, while individuals who do not own a micromobility vehicle or do not hold a driver’s license obtained lower scores. However, the only variable that showed statistically significant differences in mean scores at the 95% confidence level was the type of micromobility vehicle.

3.3. Multivariate Analysis

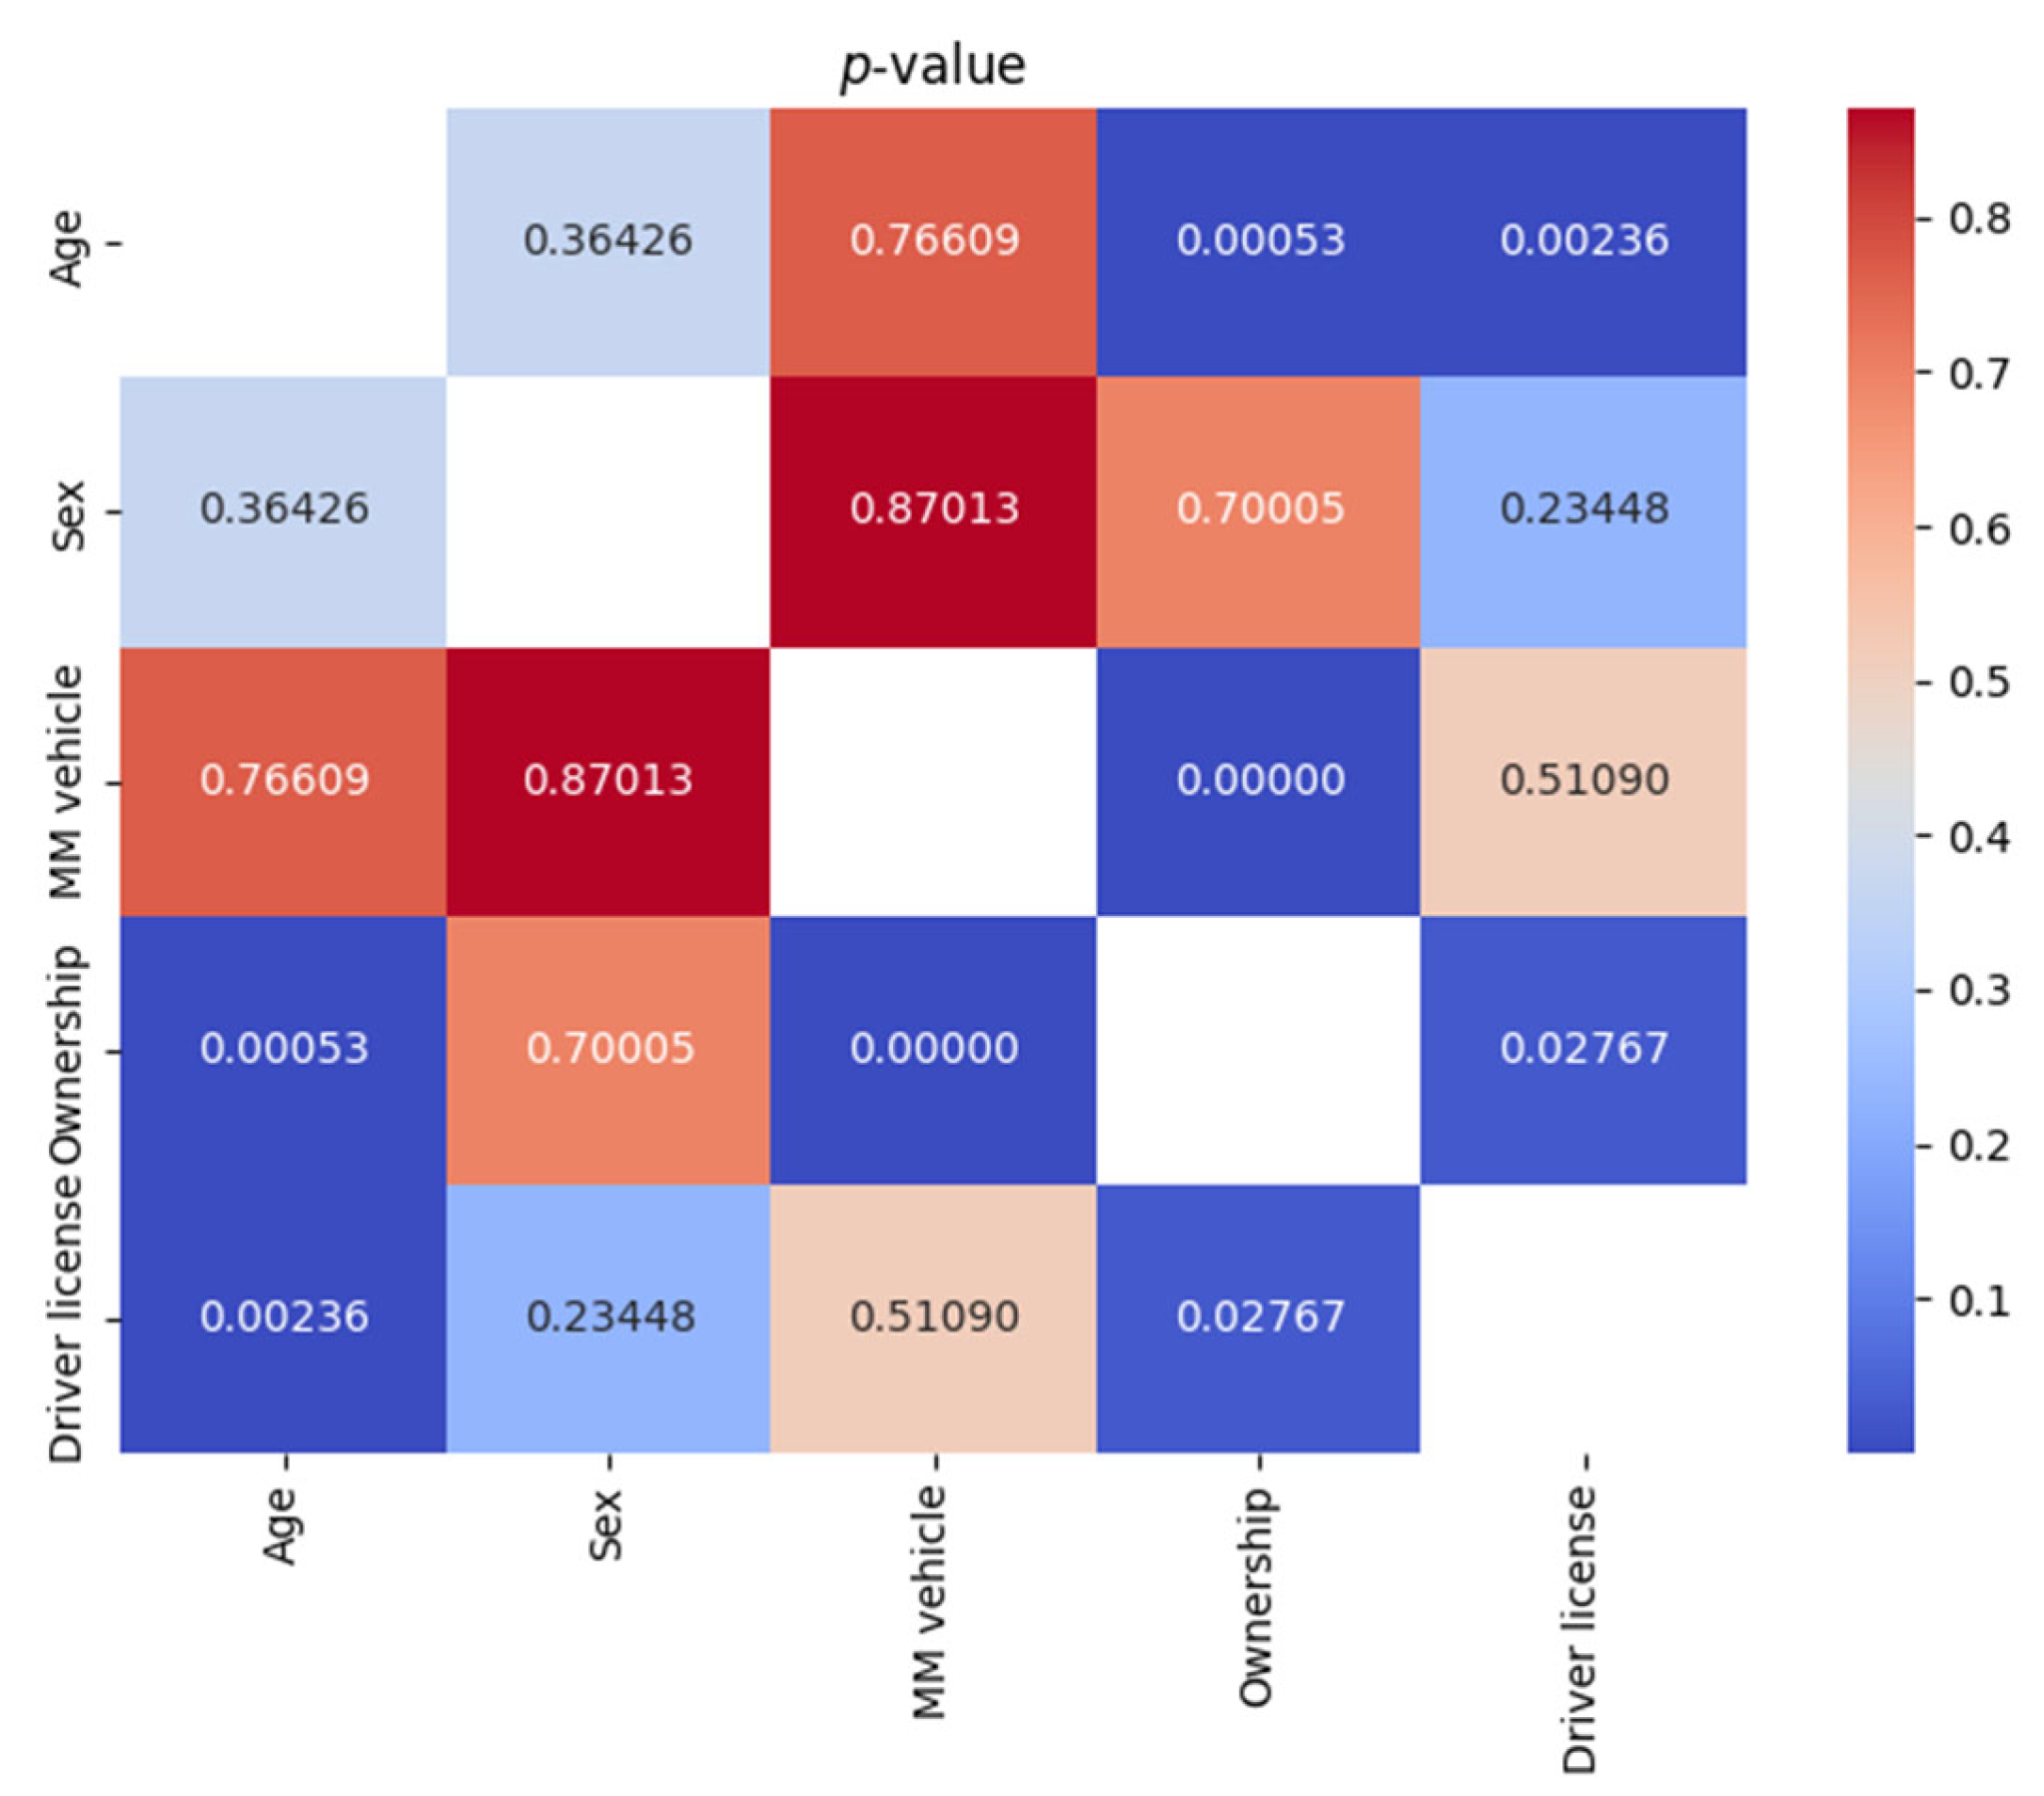
A Chi-square test of independence was conducted to explore potential relationships between the independent variables. Pairwise tests were performed under the null hypothesis that no association exists between each pair of variables. The results, shown in Figure 7, indicate that p-values below 0.005 reflect statistically significant relationships at the 95% confidence level.
Among the significant associations identified, the relationship between age and possession of a driver’s license is notable and expected, although recent trends in Spain suggest this association is not necessarily growing stronger [29]. A significant relationship was also found between age and vehicle ownership, which can be attributed to the tendency for income levels and willingness to own a vehicle to increase with age. Furthermore, micromobility vehicle type and ownership status were significantly related. In the case of Valencia, where public policies restrict the use of rental scooters [23], most scooter users are required to own their vehicles. In contrast, bicycle users often rely on Valenbisi, the city’s efficient public bike-sharing system [30], which reduces the necessity of owning a personal bicycle—this modal distribution is illustrated in Figure 3.
Another significant association was observed between driver’s license possession and micromobility vehicle ownership. Although a driver’s license is not legally required to operate micromobility vehicles, the data reveal that individuals who hold a driver’s license are also more likely to own such a vehicle, and vice versa.
Overall, despite the presence of statistically significant relationships among some of the variables, the five independent variables analyzed in this study cannot be considered collectively as a robust explanatory model for the knowledge scores regarding micromobility regulations.

4. Discussion

The findings of this study are based on the analysis of 167 responses from micromobility users in Valencia, Spain, who were asked to identify correct answers regarding current local regulations governing micromobility use.
The results indicate that the socio-demographic variables analyzed, specifically age and gender, did not significantly influence users’ level of knowledge, as no statistically significant differences were observed. Among the mobility-related factors, only the type of vehicle showed statistically validated differences, with a medium effect size. In fact, 6.31% of the total variance in knowledge scores could be explained by this variable. In contrast, neither vehicle ownership nor possession of a driver’s license showed any statistically significant influence at the 95% confidence level established for the study. The most notable overall finding is that mean scores across all subgroups ranged between four and five out of ten, which confirms a general lack of knowledge regarding micromobility regulations.
To date, few studies have directly addressed users’ awareness of such regulations. One related effort was conducted by Esztergár-Kiss and López Lizárraga in 2021 [5], who collected survey data regarding general operating conditions and usage of e-micromobility across five cities. While the sample sizes ranged from 128 to 232 respondents per city, their questions did not address specific legal knowledge. Most responses reflected only vague or general understanding of the rules, and no analysis of independent variables was conducted in relation to regulatory awareness.
A more directly comparable study was carried out by Féliz Ferreira [31], who surveyed 142 users in Valencia based on local policies. The results, with a mean score of 4.5 and a standard deviation of 1.7, align closely with the present findings. However, in that case, the same questionnaire was applied to all participants, without distinction based on vehicle type, despite the fact that different vehicles are subject to different regulatory requirements. One of the key contributions of the present study is precisely this differentiation, demonstrating that knowledge varies significantly depending on the type of vehicle used. No further analysis of variable influence was conducted in the previous study.
It is also relevant to consider the timing of a local awareness campaign launched by the Valencia municipal government in February 2024, titled “You are the chassis”. The campaign aimed to promote proper use of bicycles and PMVs, emphasizing safety equipment, and speed limits on various types of infrastructure. However, the survey for this study was conducted in July 2024, just four months after the campaign, and the results did not reflect a measurable impact on user knowledge, raising questions about the campaign’s reach or effectiveness.
Overall, the findings support the use of surveys as an effective method for identifying knowledge gaps among micromobility users. However, corrective measures should not be generalized; rather, they should be tailored to the specific requirements of different vehicle types.
Among the five policy categories evaluated, speed limits emerged as the most critical area. Not only did it yield the lowest average scores, but it also showed high rates of incorrect responses, indicating widespread confusion or misinformation. This is particularly concerning on segregated roads, where more than 30% of cyclists admitted to not knowing the correct speed limit, and on cycle paths, where 58.25% of cyclists selected speeds above the legal limit. PMV users also displayed poor understanding in this area, with over 60% indicating excessive speeds on shared infrastructure, and over 80% doing so on cycle paths.
This misunderstanding poses a significant safety risk, as exceeding speed limits may lead to dangerous interactions with other micromobility users or motorized traffic. Promoting the correct use of safety equipment is equally important. Many users showed uncertainty regarding which safety elements are mandatory, which suggests a need for clearer communication and educational efforts. Parking regulations also revealed notable knowledge gaps, especially among vehicle owners, highlighting the need for targeted information campaigns. Regarding pedestrian-related policies, most users demonstrated conservative attitudes, although a substantial proportion still admitted to not knowing the applicable rules.
Further research is needed to deepen the understanding of how users’ knowledge develops and how best to address the deficits observed. While the overall score offers a useful numerical summary, a more granular, categorical analysis could yield additional insights—especially from a safety perspective. Moreover, the recognition of “not knowing” as a common response in several categories suggests not just confusion, but a general lack of awareness that should not be overlooked.
Multivariate analysis should also be expanded to investigate how specific factors—such as those used in this study—may influence knowledge and help predict future trends. Beyond identifying deficits, it is essential to explore both preventive and corrective strategies to reduce regulatory ambiguity. These could include simplifying or clarifying current policies, improving signage and street-level information, reinforcing educational campaigns, and developing training programs that help micromobility users understand and follow the regulations applicable to their specific mode of transport.

5. Conclusions

This study assessed the level of knowledge that micromobility users in Valencia, Spain, have regarding current local regulations, indirectly measuring their awareness through a structured survey. Data collection took place between 1 July and 15 November 2024.
The survey was developed based on the regulatory documents that govern micromobility use in the city which are the General Traffic Regulations, the Technical Specifications for Personal Mobility Vehicles, and the Valencia Municipal Mobility Ordinance. Five key categories were established to evaluate users’ knowledge: (i) circulation measures, (ii) safety elements, (iii) pedestrians, (iv) parking, and (v) speed limits.
Participants were classified into two main user groups in accordance with local definitions: bicycle users (including e-bikes) and PMV users (including scooters and e-scooters). Of the 298 responses received, 167 were analyzed. The overall average score was 4.5 out of 10, with a standard deviation of 1.67. Among the five categories, the highest score corresponded to circulation measures (mean = 7.8), while the lowest was observed for speed limits (mean = 2.7).
Categorical analysis by type of micromobility vehicle revealed an urgent need to improve awareness about speed limits—especially on segregated bike lanes—as well as parking regulations across all user groups. On the other hand, the widespread belief that the use of safety elements (e.g., helmets, lights, bells) is mandatory can be viewed positively, from a road safety perspective. With regard to pedestrians and circulation behavior, most users demonstrated a relatively safe and rule-conscious approach, although a notable proportion admitted not knowing the exact legal requirements.
Univariate analysis of the five independent variables, age, gender, type of micromobility vehicle, ownership, and driver’s license possession, revealed low knowledge levels across all groups, with mean scores ranging between four and five. However, only one variable showed statistically significant differences at the 95% confidence level, the type of micromobility vehicle, with a medium effect size (η2 = 0.0631). Multivariate analysis additionally revealed relationships between the independent variables, notably between age, ownership, vehicle type, and possession of a driver’s license. These associations reflect broader socio-demographic patterns and contextual conditions that shape micromobility usage in Valencia.
While this study focused primarily on knowledge scores derived from regulatory statements, further research is recommended to explore how safety-related behaviors align with the users’ understanding of the rules. The relatively high percentage of participants who openly admitted to not knowing the correct answers suggest a critical lack of awareness that must be further explored and addressed.
Despite the differences between user groups, the overall low scores emphasize a general lack of knowledge about existing micromobility regulations. The study also highlights a deeper issue, a gap between what users should know and what they theoretically assume or believe is correct. Bridging this gap will require both strategic and technical actions, ranging from regulatory simplification to targeted communication campaigns and educational initiatives, to ensure that users not only understand the rules but are also able to apply them safely and confidently on the roads.

Author Contributions

Conceptualization, A.G., A.M.P.-Z. and D.L.-C.; methodology, A.S.F.-C., A.M.P.-Z. and D.L.-C.; formal analysis, A.S.F.-C., A.M.P.-Z. and D.L.-C.; writing—original draft preparation, A.S.F.-C.; writing—review and editing, D.L.-C. and A.M.P.-Z.; supervision, A.G. and D.L.-C.; project administration, A.G. and D.L.-C.; funding acquisition, A.G. and D.L.-C. All authors have read and agreed to the published version of the manuscript.

Funding

This study is part of the research project PID2022-141135OB-I00 funded by MCIN/AEI/10.13039/501100011033/FEDER, UE.

Institutional Review Board Statement

The study was conducted in accordance with the Declaration of Helsinki, and approved by the Institutional Ethics Committee of Universitat Politècnica De València (Evaluation of research and/or teaching activities with ethical or biosecurity implications approved on 19 June 2024).

Informed Consent Statement

Not applicable.

Data Availability Statement

The survey and data are available in Zenodo repository. DOI https://doi.org/10.5281/zenodo.14998187 (R1 & R3), accessed on 28 February 2025.

Conflicts of Interest

The authors declare no conflicts of interest. The funders had no role in the design of the study; in the collection, analyses, or interpretation of data; in the writing of the manuscript, or in the decision to publish the results.

Abbreviations

The following abbreviations are used in this manuscript:
PMVPersonal Mobility Vehicle

References

  1. Santacreu, A.; Yannis, G.; de Saint Leon, O.; Crist, P. Safe Micromobility; The International Transport Forum: Paris, France, 2020. [Google Scholar]
  2. DuPuis, N.; Griess, J.; Klein, C. Micromobility in Cities a History and Policy Overview; National League of Cities, Center for City Solutions: Washington, DC, USA, 2019; Available online: https://www.nlc.org/wp-content/uploads/2019/04/CSAR_MicromobilityReport_FINAL.pdf (accessed on 8 January 2025).
  3. National Association of City Transportation Officials (NACTO). Shared Micromobility in the U.S.: 2018; NACTO: New York, NY, USA, 2018. [Google Scholar]
  4. Hossein Sabbaghian, M.; Llopis-Castelló, D.; García, A. A Safe Infrastructure for Micromobility: The Current State of Knowledge. Sustainability 2023, 15, 10140. [Google Scholar] [CrossRef]
  5. Esztergár-Kiss, D.; Lopez Lizarraga, J.C. Exploring User Requirements and Service Features of E-Micromobility in Five European Cities. Case Stud. Transp. Policy 2021, 9, 1531–1541. [Google Scholar] [CrossRef]
  6. Gössling, S. Integrating E-Scooters in Urban Transportation: Problems, Policies, and the Prospect of System Change. Transp. Res. Part D Transp. Environ. 2020, 79, 102230. [Google Scholar] [CrossRef]
  7. Shaheen, S. Micromobility Policy Toolkit: Docked and Dockless Bike and Scooter Sharing; eScholarship: Oakland, CA, USA, 2019. [Google Scholar] [CrossRef]
  8. Bretones, A.; Marquet, O. Sociopsychological Factors Associated with the Adoption and Usage of Electric Micromobility. A Literature Review. Transp. Policy 2022, 127, 230–249. [Google Scholar] [CrossRef]
  9. Ministry of Infrastructure and Water Management. Road Traffic Signs and Regulations in the Netherlands; Government of The Netherlands: The Hague, The Netherlands, 2024. Available online: https://www.government.nl/documents/reports/2024/02/09/road-traffic-signs-and-regulations-in-the-netherlands (accessed on 15 January 2025).
  10. Ministerio del Interior. BOE-A-2003-23514 Real Decreto 1428/2003, de 21 de Noviembre, Por El Que Se Aprueba El Reglamento General de Circulación Para La Aplicación y Desarrollo Del Texto Articulado de La Ley Sobre Tráfico, Circulación de Vehículos a Motor y Seguridad Vial, Aprobado Por El Real Decreto Legislativo 339/1990, de 2 de Marzo. Available online: https://www.boe.es/buscar/act.php?id=BOE-A-2003-23514 (accessed on 15 May 2024).
  11. Mobility Portal Europe. These Are the Micromobility Policies in 13 European Countries. Available online: https://mobilityportal.eu/countries-micromobility-policies/ (accessed on 15 January 2025).
  12. Canadian Council of Motor Transport Administrators (CCMTA). Request for Proposal for Micromobility White Paper; CCMTA: Ottawa, ON, Canada, 2024. [Google Scholar]
  13. Department for Transport. The Highway Code, Road Safety and Vehicle Rules Rules for Motorists, Cyclists and Pedestrians and Road Safety. Available online: https://www.gov.uk/browse/driving/highway-code-road-safety (accessed on 28 February 2025).
  14. Zhang, C.; Du, B.; Zheng, Z.; Shen, J. Space Sharing between Pedestrians and Micro-Mobility Vehicles: A Systematic Review. Transp. Res. Part D Transp. Environ. 2023, 116, 103629. [Google Scholar] [CrossRef]
  15. Laa, B.; Leth, U. Survey of E-Scooter Users in Vienna: Who They Are and How They Ride. J. Transp. Geogr. 2020, 89, 102874. [Google Scholar] [CrossRef]
  16. Campisi, T.; Akgün-Tanbay, N.; Md Nahiduzzaman, K.; Dissanayake, D. Uptake of E-Scooters in Palermo, Italy: 21st International Conference on Computational Science and Its Applications, ICCSA 2021. In Computational Science and Its Applications—ICCSA 2021; Springer: Cham, Switzerland, 2021; pp. 669–682. [Google Scholar] [CrossRef]
  17. Frolich, D.; Al Adib Sarker, M.; Jin, X. Evaluating the Potential for Micromobility in South Florida through a Stated Preference Survey. Int. J. Transp. Sci. Technol. 2024, S2046043024000923. [Google Scholar] [CrossRef]
  18. Shinar, D.; Valero-Mora, P.; Van Strijp-Houtenbos, M.; Haworth, N.; Schramm, A.; De Bruyne, G.; Cavallo, V.; Chliaoutakis, J.; Dias, J.; Ferraro, O.E.; et al. Under-Reporting Bicycle Accidents to Police in the COST TU1101 International Survey: Cross-Country Comparisons and Associated Factors. Accid. Anal. Prev. 2018, 110, 177–186. [Google Scholar] [CrossRef] [PubMed]
  19. Tian, D.; Ryan, A.D.; Craig, C.M.; Sievert, K.; Morris, N.L. Characteristics and Risk Factors for Electric Scooter-Related Crashes and Injury Crashes among Scooter Riders: A Two-Phase Survey Study. Int. J. Environ. Res. Public Health 2022, 19, 10129. [Google Scholar] [CrossRef] [PubMed]
  20. Gadsby, A.; Tsai, J.; Watkins, K. Understanding the Influence of Pavement Conditions on Cyclists’ Perception of Safety and Comfort Using Surveys and Eye Tracking. Transp. Res. Rec. 2022, 2676, 112–126. [Google Scholar] [CrossRef]
  21. Fonseca-Cabrera, A.S.; Llopis-Castelló, D.; Pérez-Zuriaga, A.M.; Alonso-Troyano, C.; García, A. Micromobility Users’ Behaviour and Perceived Risk during Meeting Manoeuvres. Int. J. Environ. Res. Public Health 2021, 18, 12465. [Google Scholar] [CrossRef] [PubMed]
  22. Ministerio del Interior Resolución de 12 de Enero de 2022, de la Dirección General de Tráfico, por la que se Aprueba el Manual de Características de los Vehículos de Movilidad Personal 2022. Available online: https://www.boe.es/diario_boe/txt.php?id=BOE-A-2022-987 (accessed on 15 May 2024).
  23. Ajuntament de València, Ordenanza Movilidad Valencia 2022. Available online: https://www.valencia.es/documents/20142/628173/Nueva+versión+VTC+ORDENANZA+DE+MOVILIDAD+castellano+090425.pdf/5f19a41e-47bd-b2bf-566b-2434f35700b5?t=1744277581734 (accessed on 15 May 2024).
  24. Richardson, A.J.; Ampt, E.S.; Meyburg, A.H. Survey Methods for Transport Planning; Eucalyptus Press: Parkville, Australia, 1995; Available online: http://worldcat.org/isbn/064621439X (accessed on 15 December 2024).
  25. De Ortúzar, J.D.; Willumsen, L.G. Modelling Transport, 4th ed.; Wiley-Blackwell: Chichester, UK, 2011; ISBN 978-1-119-99330-8. [Google Scholar]
  26. Instituto Nacional de Estadística Cifras Oficiales del Padrón por Municipio. Available online: https://www.ine.es/jaxiT3/Datos.htm?t=29005 (accessed on 28 February 2025).
  27. Moovit Inc Informe Global de Transporte Público 2022. Available online: https://moovitapp.com/insights/es-419/Moovit_Insights_%C3%8Dndice_de_Transporte_P%C3%BAblico-countries (accessed on 28 February 2025).
  28. Shapiro, S.S.; Wilk, M.B. An analysis of variance test for normality (complete samples). Biometrika 1965, 52, 591–611. [Google Scholar] [CrossRef]
  29. Moral Rincón, M.J. Posesión del carnet de conducir: Falacias y realidades. Papeles Econ. Española 2022, 171, 50–62. Available online: https://www.funcas.es/wp-content/uploads/2022/04/PEE-171_-MORAL.pdf (accessed on 17 February 2025). (In Spanish).
  30. Valenbisi. Available online: https://www.valenbisi.es/es/home (accessed on 28 February 2025).
  31. Féliz-Ferreira, E. Influencia de la Configuración Geométrica de Los Carriles Bici de la Ciudad de Valencia (España), en la Micromovilidad. Master’s Thesis, Universitat Politènica de València, València, Spain, 2021. [Google Scholar]
Figure 1. Survey structure design.
Safety 11 00036 g001
Figure 2. Number of respondents to the survey by age.
Safety 11 00036 g002
Figure 3. Micromobility users’ modal split.
Safety 11 00036 g003
Figure 4. Standardized score distribution.
Safety 11 00036 g004
Figure 5. Average score for category by group of analysis: (a) Overall; (b) age; (c) sex; (d) micromobility vehicle; (e) ownership; (f) driver’s license possession.
Safety 11 00036 g005
Figure 6. LSD intervals: (a) LSD intervals for micromobility type of vehicle and (b) LSD intervals for ownership.
Safety 11 00036 g006
Figure 7. p-value results for Chi-Square independence test.
Safety 11 00036 g007
Table 1. Bicycle regulations.
CategoryItemLocal PolicyNationwide Statements
Circulation measuresRide on sidewalkForbiddenForbidden
Headphones useForbiddenForbidden
Overtake on bidirectional bike lanesAllowedND **
Ride in urban tunnel without bike laneForbiddenForbidden
Safety elementsMandatory insuranceNoND **
Mandatory registrationNoND **
Mandatory helmet useNo *No *
Mandatory bell useNoND **
Mandatory lights useYesYes
PedestriansPriority on bike lanes without pedestrian crossingBicyclesBicycles
Minimum safety distance with pedestrians1 mND **
ParkingParking next to treesForbiddenND **
Maximum parking time next to urban furniture72 hND **
Speed limit on segregate bike lanesOn sidewalk bike lane15 km/hND **
On road bike lane20 km/hND **
Cycle path10 km/hND *
Speed limit on shared roadsMotorized roads45 km/hND **
30 street30 km/hND **
Residential street20 km/hND **
Pedestrian street10 km/hND **
* Helmet use is mandatory for cyclists under 16 years old. ** ND—Not defined.
Table 2. PMV regulations.
CategoryItemLocal PolicyNationwide Statements
Circulation measuresMinimum age for riding1616
Type of VMPA or BND *
Ride on sidewalkForbiddenForbidden
Headphones useForbiddenForbidden
Overtake on bidirectional bike lanesAllowedNot applicable
Ride in urban tunnel without bike laneForbiddenForbidden
Safety elementsMandatory insuranceNoND *
Mandatory registrationNoND *
Mandatory helmet useType BAll PMV
Mandatory bell useType BAll PMV
Mandatory lights useType BAll PMV
PedestriansPriority on bike lanes without pedestrian crossingPMVPMV
Minimum safety distance with pedestrians1 mND *
ParkingParking next to treesForbiddenND *
Maximum parking time next to urban furniture72 hND *
Speed limit on segregated bike lanesOn sidewalk bike lane15 km/hND *
On road bike lane20 km/hND *
Cycle path10 km/hND *
Speed limit on shared roadsMotorized roadsForbiddenND *
30 streetType A 20 km/h and type B 25 km/hND *
Residential streetAll types 20 km/hND *
Pedestrian streetType A 10 km/h and type B forbiddenND *
* ND—Not defined.
Table 3. Statistical summary of score.
GroupSubgroupNAverage ScoreStandard Deviation
Age15–24504.691.63
25–44854.281.58
45–64304.821.93
65>26.00.70
SexMan1154.681.66
Woman524.161.66
Micromobility vehicleBicycle1324.731.63
PMV353.701.62
OwnershipOwn924.781.62
Not own754.181.81
Driver’s license possessionYes1244.621.68
No434.201.62
Table 4. Speed limit answer results for bicyclists.
BicyclesCorrect AnswerUnder Speed LimitAbove Speed LimitDid Not Know
On sidewalk bike lane31.3%11.2%26.9%30.6%
On road bike lane28.4%9.6%28.4%33.6%
Cycle path4.5%0.0%58.2%37.3%
Motorized roads14.2%* 45.5%0.0%40.3%
30 street59.7%17.2%0.0%23.1%
Residential street28.4%* 31.3%9.7%30.6%
Pedestrian street24.6%* 39.6%13.4%22.4%
* From a safety perspective, sums-up under speed limit and not allowed to ride answers.
Table 5. Speed limit answer results for PMV riders.
PMVCorrect AnswerUnder Speed LimitAbove Speed LimitDid Not Know
On sidewalk bike lane22.9%0.0%60.0%17.1%
On road bike lane17.1%8.6%65.7%8.6%
Cycle path2.8%0.0%82.9%14.3%
30 street40.0%11.4%14.3%34.3%
Residential street40.0%40.0%0.0%20.0%
Pedestrian street11.4%* 37.1%22.8%28.6%
* Not allowed to ride despite PMV type.
Table 6. Normality test results by group.
GroupSubgroupNStatisticp-Value
Age15–24500.11650.4706
25–44850.10160.3226
45–6430 *0.95410.2171
>652--
SexMan115 0.09890.1969
Woman520.09680.6782
Micromobility vehicleBicycle1320.11450.0581
PMV35 *0.98620.9300
OwnershipOwn920.09440.3626
Not own750.13480.1192
Driver’s license possessionYes1240.09250.2250
No43 *0.95420.0850
* Subgroup evaluated with Shapiro–Wilk test.
Table 7. Bartlett homoscedasticity test results by group.
GroupStatisticp-Value
Age2.45470.4835
Sex0.00030.9860
Micromobility vehicle0.00060.9804
Ownership0.10280.7484
Driver’s license possession0.89180.3450
Table 8. ANOVA test results.
GroupStatisticp-Value
Age1.61030.189006
Sex3.48650.063642
Micromobility vehicle11.113 0.001058 *
Ownership5.47290.020511 *
Driver’s license possession1.971 0.162215
* If p-value less than 0.05 and H0 rejected at a 95% confidence level.
Table 9. Post hoc LSD test results.
GroupSubgroupLSDLower BoundUpper BoundFPR (>F)
Micromobility VehicleBicycle0.2793844.455.0111.1130810.001058
PMV0.5425683.164.24
OwnershipOwn0.3401444.445.125.4729130.020511
Not own0.3767263.804.56
Disclaimer/Publisher’s Note: The statements, opinions and data contained in all publications are solely those of the individual author(s) and contributor(s) and not of MDPI and/or the editor(s). MDPI and/or the editor(s) disclaim responsibility for any injury to people or property resulting from any ideas, methods, instructions or products referred to in the content.

