Article

Assessing and Visualizing Pilot Performance in Traffic Patterns: A Composite Score Approach

Fédération ENAC ISAE-SUPAERO ONERA, Université de Toulouse, 31400 Toulouse, France
*
Author to whom correspondence should be addressed.
Safety 2025, 11(2), 37; https://doi.org/10.3390/safety11020037
Submission received: 4 March 2025 / Revised: 11 April 2025 / Accepted: 21 April 2025 / Published: 23 April 2025

Abstract

:
Objective measurement of pilot performance has long been a research challenge. This study introduces a new composite score that combines various flight metrics, along with its visual representation through an online application. Thirty general aviation pilots completed flight simulator scenarios under different Flight Rules (VFR: Visual Flight Rules vs. IFR: Instrument Flight Rules) and difficulty levels (Low vs. High). Workload was assessed using subjective and objective indicators. The composite score was developed using flight parameter compliance, approach stability, and landing quality. Workload indicators confirmed the scenario difficulties, showing significant increases under IFR compared to VFR and in High vs. Low difficulty conditions. As predicted by multiple resources theory, the composite score correlated negatively with workload, particularly in IFR conditions, demonstrating its effectiveness in assessing pilot performance. In a follow-up questionnaire, pilots rated the online application positively, highlighting its usefulness in understanding their performance and recognizing its potential for pilot training.

1. Introduction

Learning to fly is inherently complex, making effective training a critical goal in aeronautics. While instructor feedback is crucial during training, novice pilots may also benefit from objective, data-driven performance metrics. Other fields, such as professional racing, for example, already use telemetry to improve training and performance [1], and even to generate AI-based training assistants [2]. Despite the abundance of flight data, such tools remain underdeveloped in aviation training [3,4]. This study sought to address this gap by introducing a holistic metrics–as well as its visualization–to assess pilot performance during simulated traffic patterns under varying conditions.
Assessing pilot performance is crucial for aviation safety, especially since human factors are involved in approximately 75% of accidents [5]. To mitigate this risk, national aviation authorities define minimum performance standards for pilot licensing, typically involving both objective metrics and instructor evaluations. In research, pilot performance has been measured using various metrics, such as flight path deviation [6,7], deviation from expected flight parameters [8], landing operation performance [9] and response to control inputs [10]. Although individually informative, these metrics often fail to provide a comprehensive view of the pilot’s performance. Furthermore, some of these metrics may lack the sensitivity/validity [11] required to discern the wide range of differences in pilot performance, especially during critical parts of the flight. For example, a pilot maintaining the correct flight path might still perform a hard landing, which would not be captured if flight path deviation were the sole metric. Expert ratings [12] offer an alternative that is, however, resource-intensive and potentially subjective. Indirect measures using secondary tasks (e.g., responding to auditory stimuli [13,14]); workload questionnaires [15]; or physiological measures (e.g., cardiac activity [16], eye tracking, [17], electroencephalography [18,19], and functional near-infrared spectroscopy [20]) can be insightful but may require specific, costly devices. Consequently, the scientific literature seems to lack a cost-effective metric that would allow a holistic and objective approach to assess aircraft pilot performance.
Similar to the measurement of complex constructs like personality or intelligence [21], pilot performance could benefit from a composite score approach. In IQ tests (WAIS-IV [22]), intelligence is represented as a composite score of the performance of various cognitive tasks, allowing for a comprehensive assessment and comparison through normalization. Interestingly, this IQ composite score can also be decomposed into specific sub-scores such as working memory index or processing speed index, for example. To our knowledge, only one research team has already used a similar approach with flight simulator performance [23,24,25,26]. They calculated a composite score by averaging several normalized metrics (z-scores), including communication performance, traffic avoidance, emergency management, and approach parameters. However, their composite score omitted a key metric: the landing, which is one of the most important phases of flight. Indeed, according to recent reports in both general and commercial aviation, nearly half of all accidents in aviation occur in the approach or landing phases [27,28]. While these incidents may involve factors beyond individual pilot error, the high accident rate underscores the importance of evaluating performance during these phases.

The Present Study

The present study aimed to build on the findings of previous research [23,24,25] and develop a holistic metric of flight performance, taking into account not only the cruise part during the traffic pattern, but also the approach and the landing phase. The second objective was to create a web application to visualize these flight performance metrics/scores.
In order to provide performance metrics in various flight scenarios, we first had to design and validate traffic patterns with different workload levels. These were designed taking into account the multiple resource theory [29], which postulates that workload and task performance are based on three factors: (1) the difficulty of each task component (e.g., failure vs. no failure during flight); (2) the allocation of resources to task components (e.g., instrument landing vs. visual landing); (3) the extent to which tasks require shared attentional resources (e.g., adding a concurrent oddball task during the flight). We created four flight simulation scenarios reflecting these factors: VFR (Visual Flight Rule) vs. IFR (Instrument Flight Rule) and Low vs. High difficulty (good weather vs. bad weather/system failures). Workload indicators were measured subjectively (NASA-TLX [15]) and objectively (miss rate in a concurrent auditory oddball task [30]). Based on the predictions of the multiple resources theory, we expected the workload to be highest in the IFR-high condition and lowest in the VFR-low condition.
The composite score was developed to provide a comprehensive evaluation of pilot performance during these traffic patterns. This composite score encapsulates various sub-scores based on flying tasks, including compliance with flight parameters (altitude, speed, time), as well as approach stability and landing quality. Based on the multiple resource theory, we hypothesized a significant negative correlation between the composite score and both objective and subjective workload measures [29,31,32].
An online application built with R (Shiny App 1.7.5) was also developed to provide detailed feedback on performance, including composite and sub-scores. A questionnaire was used to assess the pilot’s perception of the usefulness of the feedback provided and its potential value in pilot training.

2. Material and Methods

2.1. Participants

Thirty general aviation pilots (27 men, 24 right-handed) were included in this study, all holding or pursuing a Private Pilot License (PPL). The recruitment criterion was to have flown at least one hour in the presence of an instructor, and not to hold a commercial pilot’s license (CPL). The average number of flying hours was 62.2 [1–180]. Mean age was 22.1 years old, while the mean education level was 16.0 years.
Participants in this study were part of a comprehensive cognitive training research project. The initial session reported in this article aimed to establish a baseline performance score on flight simulator scenarios for use in later sessions to measure the effects of cognitive training. Participants received 250 € upon completing the entire study.

2.2. Material

A 3-axis flight simulator (Pegase, ISAE-SUPAERO, Figure 1) was used. Eight screens arranged in a 180° arc displayed the environment outside the cockpit. In the cockpit, five screens displayed flight parameters, with a display similar to that of an A320 Airbus. The cockpit included Airbus-like stick and throttle (two engines), and a Flight Control Unit (FCU) panel deactivated for this experiment. The simulation software was FlightGear 2.4, and the simulated aircraft was an A320. The aircraft’s flight-by-wire controls and aerodynamics were homemade, based on the A320’s systems and flight envelope. Several data were recorded in the flight simulator, at a 50 Hz frequency. They included time (seconds), geographic coordinates (latitude and longitude in decimal degrees), speed (knots), altitude (feet), variometer (feet per minute), g-force and aircraft axes (pitch, roll, yaw in degrees).

2.3. Experimental Design and Procedure

2.3.1. Experimental Design

Pilots completed four traffic pattern scenarios in a 2 × 2 (VFR vs. IFR; Low vs. High difficulty) factorial design. The order of the scenarios was predetermined as follows: VFR-low, VFR-high, IFR-low, and IFR-high. This non-randomized order was deliberately chosen to control for potential learning effects and to ensure a consistent experience, especially considering that pilots had limited exposure to IFR with their training.

2.3.2. Procedure

The procedure can be found in Figure 2. First, the pilots provided informed consent and answered a demographic questionnaire (age, gender, handedness, education level, flight hours, flight simulator hours). They then had to complete two training scenarios and four flight scenarios (traffic patterns) during a single experimental session, each scenario lasting approximately 10 min. Following each of the four flight scenarios, they answered the NASA-TLX questionnaire. Overall, this simulator session took 1 h and 30 min to complete. The pilots were recontacted weeks later, and were given the feedback with the app. They were asked to complete an optional questionnaire on the usefulness of the app.

2.3.3. Flight Scenarios

Pilots first familiarized themselves with the simulator and aircraft instruments across two traffic patterns (one in VFR, one in IFR) with the experimenter giving instructions in the cockpit (flight parameters to be maintained such as speed, altitude, timings, and the type of landing). Once the familiarization was over, the participants performed the four experimental traffic patterns (VFR-low, VFR-high, IFR-low, IFR-high) alone in the cockpit. Complete instructions given to the participants are available in the supplementary material.
In low difficulty scenarios, the weather was good (no wind, clear visibility, 2 p.m. local time). The pilots were asked to land on the 14 L runway, and no failure happened during the flight. The two high difficulty scenarios were slightly different in weather and failures, and required the pilots to land on the 32 L runway. The VFR-high included medium weather (no wind, scattered clouds, 2 p.m. local time) and a failure with a loss of airspeed and altitude indicators happening at the start. The IFR-high included poor weather (no wind, fog, 2 a.m. local time) and a failure with the loss of the left engine during the downwind leg.
During the flight scenarios, the participants had access to a sheet describing VFR and IFR traffic patterns flight parameters (altitude, speed, timers). Even though the pilots knew they were going to perform two VFR then two IFR scenarios, they were not aware of the difficulty (e.g., system failures) beforehand. No specific instructions were given to the pilots on how to handle these failures. A summary of the scenarios can be found in Table 1, and a competency-based matrix can be found in the supplementary material. An example traffic pattern chart can be found in Figure 3. After each traffic pattern, the participants completed the subjective workload questionnaire.

2.3.4. Workload Indicators

Objective Workload

During the four traffic patterns, along with flying, the participants had to perform an auditory oddball task [14]. High- and low-pitched sounds (200 ms, 75 dB, pure tones at 1250 and 750 Hz, respectively) were played through the simulator speakers, with a random inter-trial interval between 0.5 and 2 s. Twenty percent of sounds were high-pitched. Participants were instructed to respond to as many high-pitched sounds as possible by pressing the joystick trigger, while ignoring the low-pitched ones. Additionally, they were told that while flying the aircraft was the main task, they had to try to respond as best as they could to the oddball task. In this task, the dependent variable was the percentage of auditory target missed (ranging from 0 to 100) and was intended to measure objective workload [30].

Subjective Workload

After the landing of each flight scenario, the participants completed the NASA-TLX [33], which includes five 20-point Likert scales, asking each participant to rate mental demand, physical demand, temporal demand, performance, and effort during the task. The dependent variable was the total score in these scales (ranging from 0 to 100) and was intended to measure subjective workload [15].

2.4. Flight Simulator Composite Score

Composite Score Preprocessing

To quantitatively evaluate pilots’ performance, we developed a composite score integrating various flight parameters. Five metrics were calculated for each scenario (Figure 4):
  • Time Metric: Defined as the absolute difference in seconds between the expected and actual time taken for each flight phase. For instance, the time metric for the downwind phase was calculated based on a reference duration of 3 min.
  • Speed Metric: Similar to the altitude metric, this was determined by the absolute area under the curve, comparing the expected (e.g., 140 knots) and achieved speeds.
  • Altitude Metric: Computed as the absolute area under the curve, representing the deviation from the expected altitude (e.g., 2000 feet) to the altitude flown by the pilot.
  • Approach Metric: Calculated as the mean distance deviation between the expected approach path (as it would be executed by an autopilot) and the pilot’s actual flight path.
  • Landing Metric: This metric involved two components: the measured g-forces during landing and the distance deviation from the ideal landing spot (as determined by an automated pilot landing) to the pilot’s landing position.
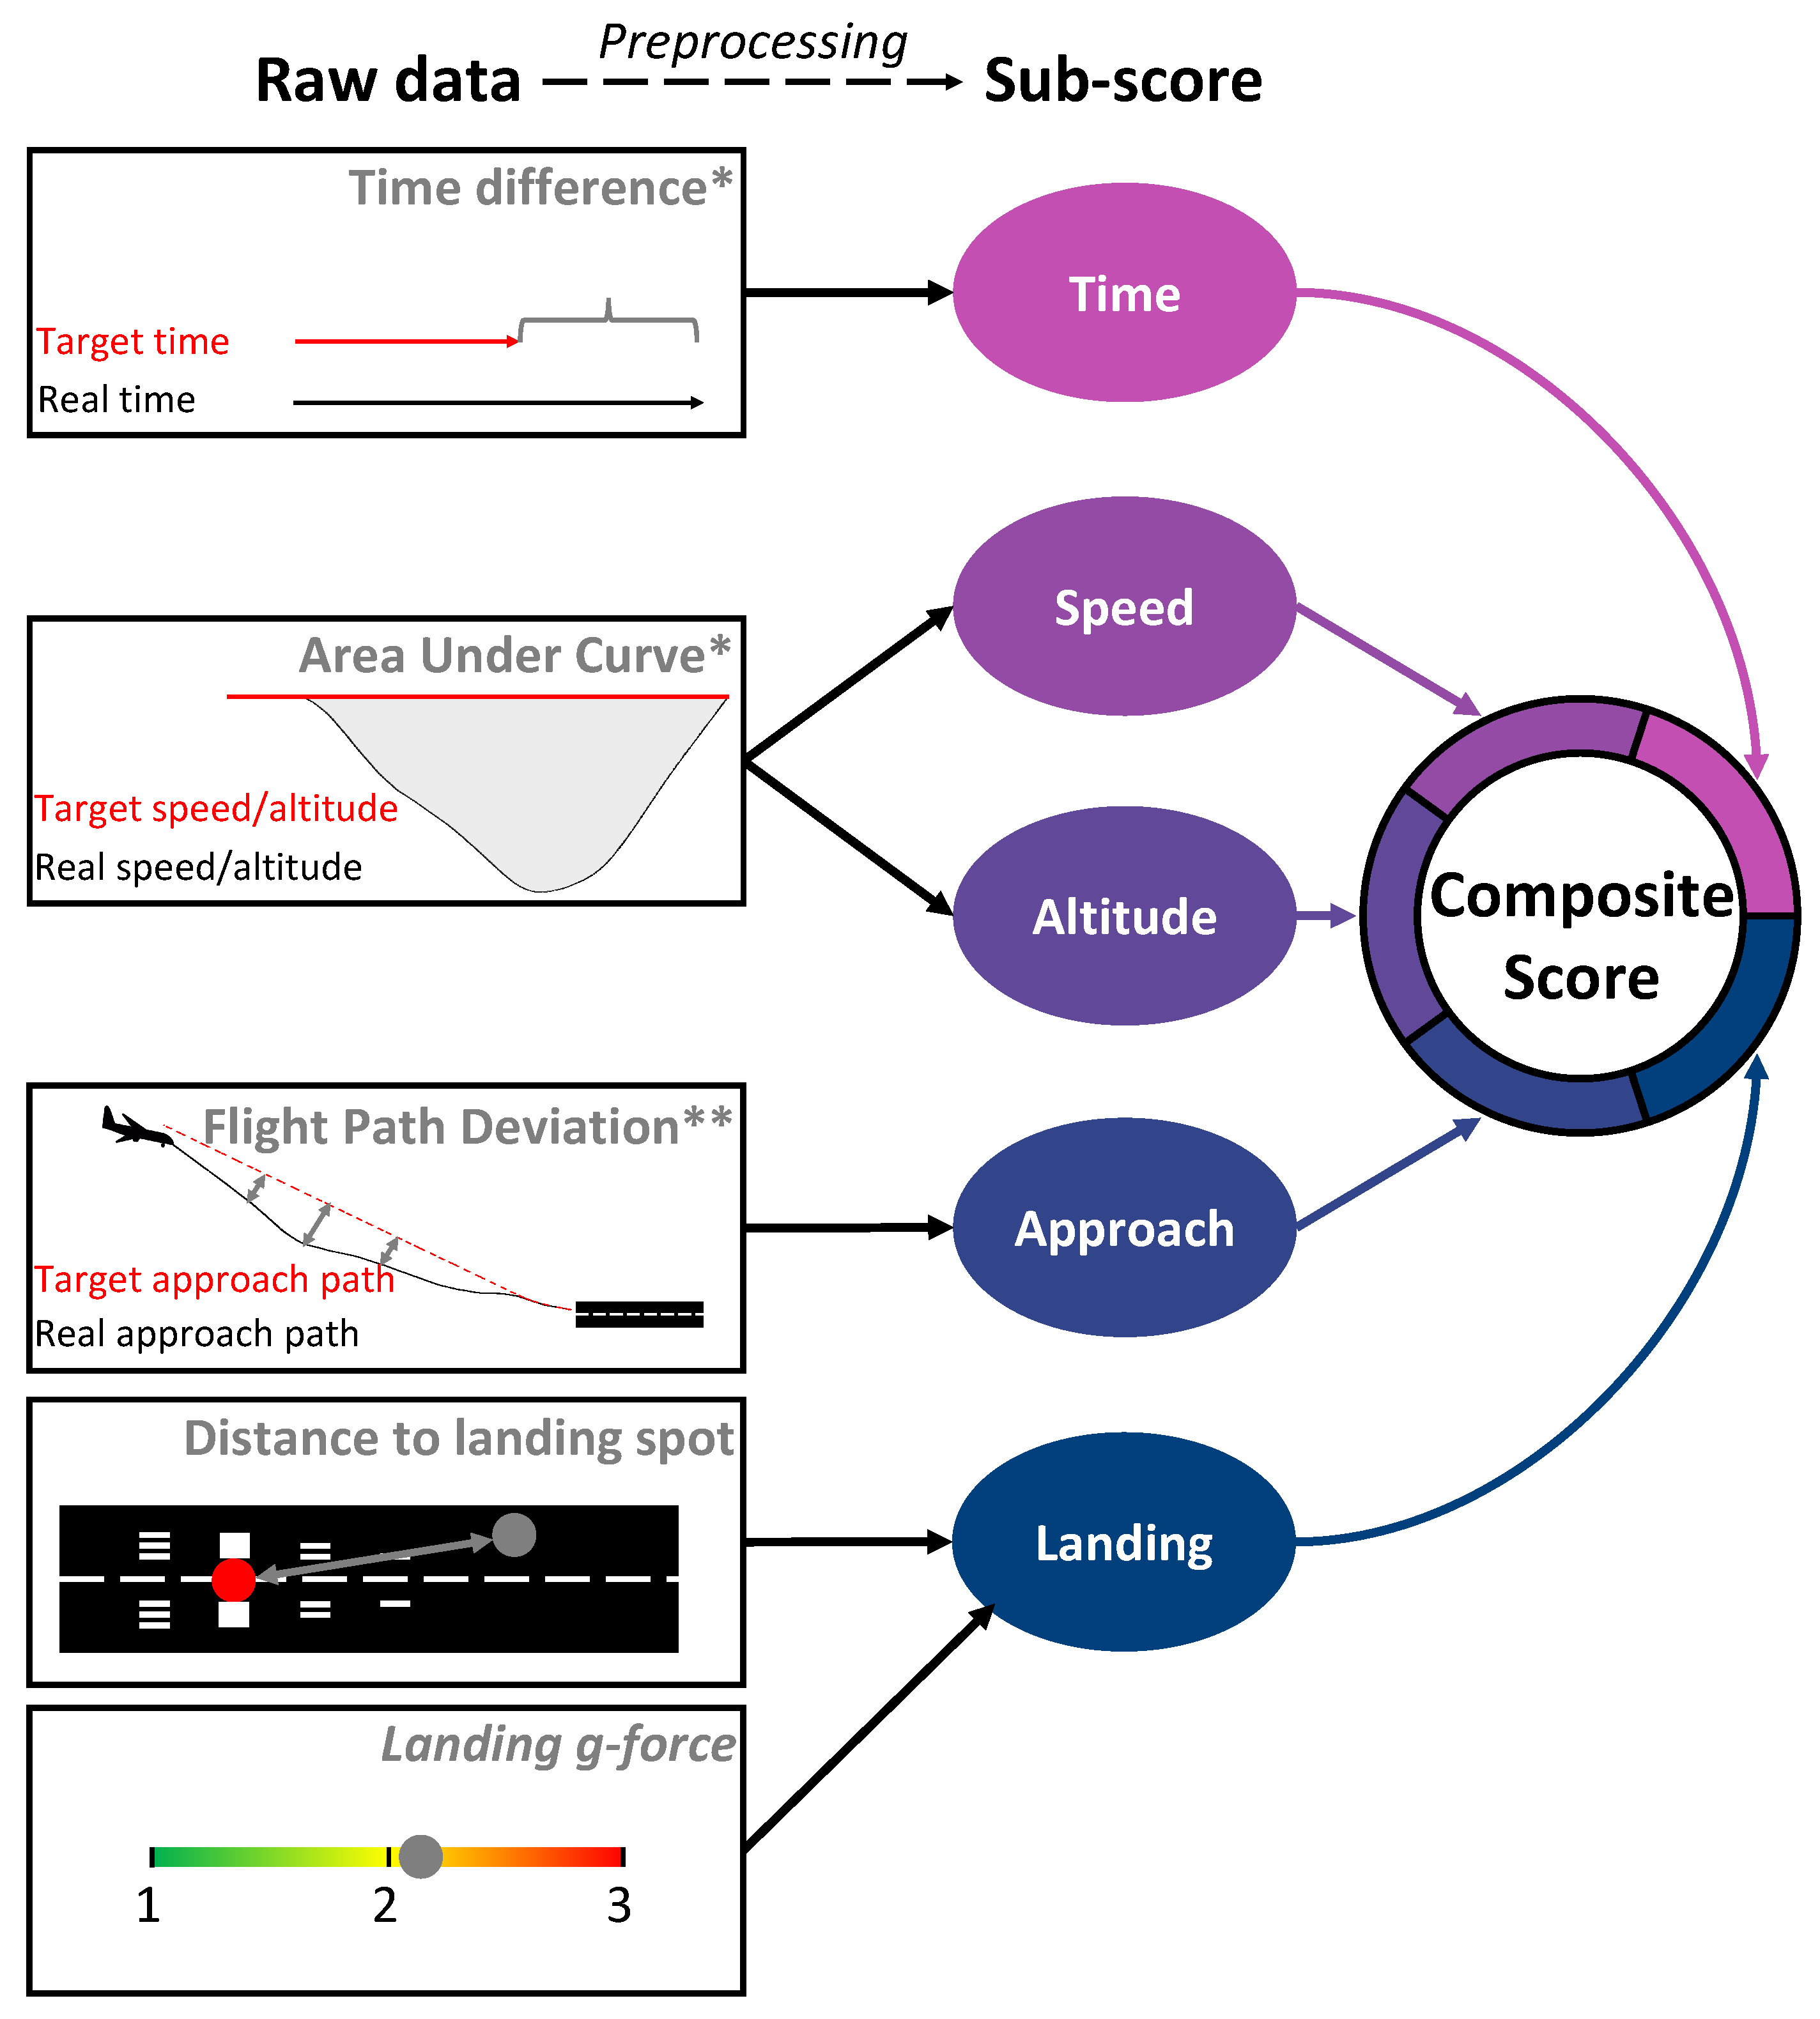
Figure 4. Summary of the composite score computation. Metrics are calculated from raw data and transformed into several sub-scores (z-scored). The composite score is then calculated by averaging the sub-scores. *: the time difference and area under curve were calculated for each phase (crosswind, downwind, base leg); **: the flight path deviation was calculated using 3D Euclidian space.
Safety 11 00037 g004
In order to compute the composite score, a three-step preprocessing of these metrics was performed using R studio (ver. 4.2.2) [34,35]:
(1) Log Transformation: Applied to address the positive skewness observed in the data distribution of these metrics;
(2) Normalization (Z-Score Transformation): Data were then normalized and converted into z-scores. These scores were multiplied by −1, ensuring that positive scores corresponded to superior performance (for example, the pilot with the highest area under the curve for the altitude metric had its positive z-score changed into a negative z-score). This normalization allows averaging out all five metrics, giving the composite score.
Given the specificities of the four traffic patterns (target altitude, speed, etc.), the data preprocessing pipeline (log-transformation and z-scoring) was applied to each scenario, independently. This approach ensured that an individual score was computed for each scenario. A detailed overview of the preprocessing is available in the Supplementary Materials.

2.5. Flight Performance Visualization

2.5.1. Application Description

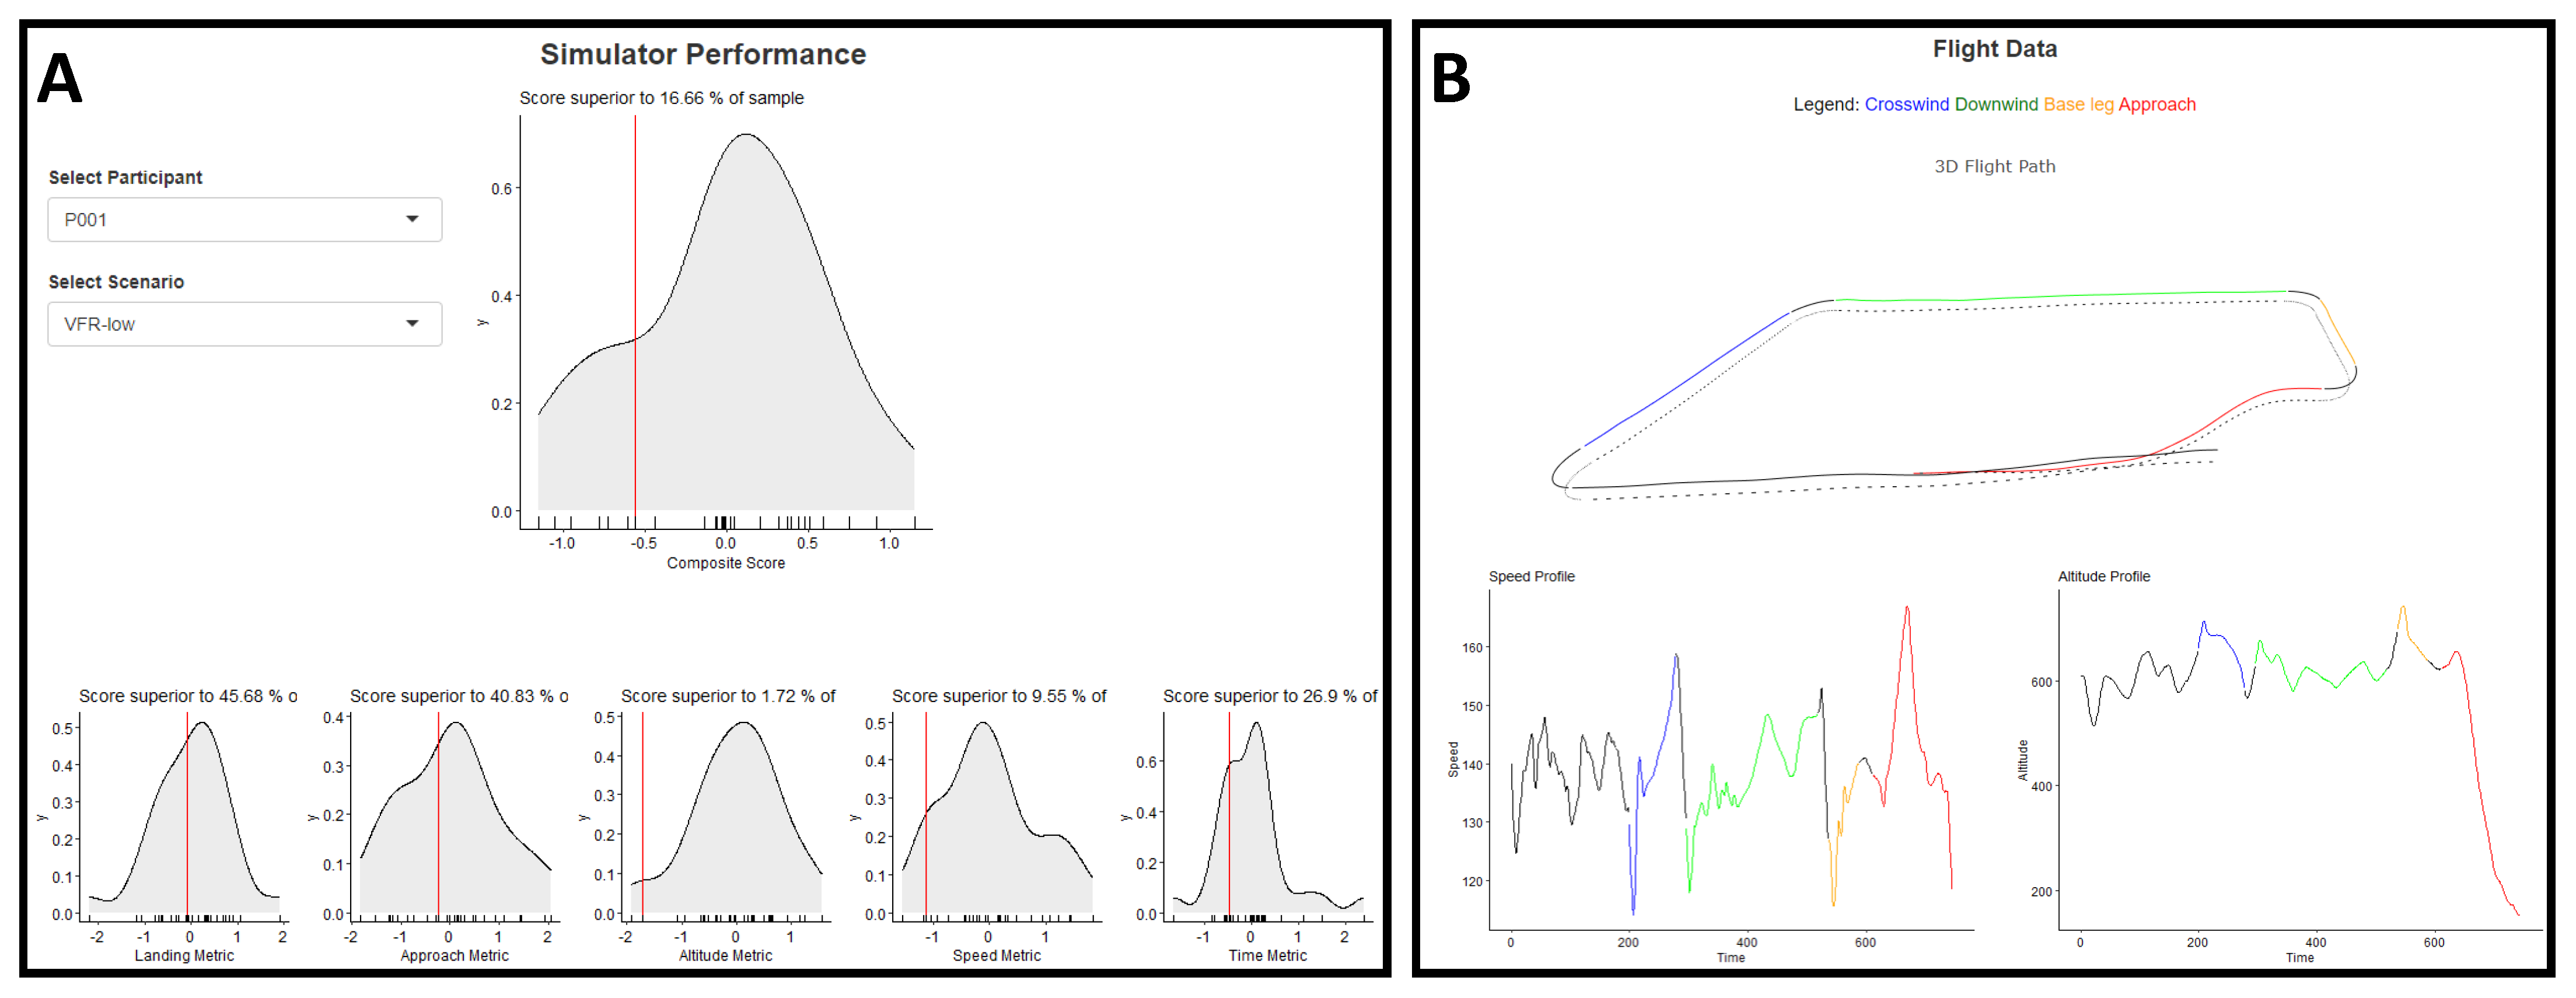
After data acquisition, an online application was developed in R Studio [35], using the shiny-package to create a Shiny app 1.7.5. This application was designed to interactively display various flight parameters (e.g., speed and altitude profiles, flight path in 3D) per scenario. It also integrates the previous described metrics, the composite score and its sub-scores, as well as the objective and subjective workload indicators. Data visualization within the application is facilitated through the use of density plots, which provide a comprehensive view of the distribution of scores across participants. The individual’s performance is indicated on the graph by a vertical red line. This feature enabled participants to easily compare their results with those of the sample, facilitating a deeper understanding of their skills and areas for improvement. The Shiny app 1.7.5 code is open source and available here [36]. The application link was shared with the pilots once they all completed the experiment, and is available here [37].

2.5.2. Questionnaire

To get feedback on the usefulness of this app, a 14-item questionnaire was developed. Participants had to answer in a Likert scale from 1 to 7, with 1 being “completely disagree”, 4 “neutral”, and 7 “completely agree”. It included four dimensions: (1) the user’s experience with the application (usability); (2) the relevance of the information presented in the application (relevance); (3) the utility of the application as feedback from the experiment itself (utility—experimental feedback); and (4) the potential utility of a similar application in the context of pilot training (utility—pilot training feedback). The items are available in Table 2. From the original sample of thirty pilots, twenty-one completed the questionnaire.

2.6. Hypotheses and Statistical Analysis Plan

2.6.1. Hypothesis 1—Scenario and Workload

First, it was needed to ensure that there were different levels of workload in the four scenarios. We hypothesized that there would be an increase in workload for IFR vs. VFR conditions (Flight Rule), and for High vs. Low conditions (Difficulty). As a consequence, it was expected that mental workload would be at the lowest level in the VFR low scenario and at the highest level in the IFR high scenario. To test this hypothesis, we applied two mixed-effects models: for the subjective workload with the NASA-TLX scores (Hypothesis 1a) and for the objective workload with the target miss percentage (Hypothesis 1b). The equation was as follows:
Workload Difficulty × FlightRule + ( 1 | Participant )
where
  • Workload is the dependent variable, measured by either (1) the NASA-TLX score or (2) the auditory oddball miss percentage.
  • Difficulty is an independent variable with two modalities: Low and High.
  • FlightRule is an independent variable with two modalities: Visual Flight Rules (VFR) and Instrument Flight Rules (IFR).
  • ( 1 | Participant ) denotes a random effect for participants, accounting for the within-participant variability.

2.6.2. Hypothesis 2—Subjective and Objective Workload

A supplementary analysis was conducted to evaluate the relationship between subjective workload and objective workload. We hypothesized a strong and significant relationship between the two workload indicators. This was evaluated with the following mixed model:
Subjective Workload Objective Workload + ( 1 | Participant )
where:
  • Subjective Workload is a dependent variable, measured by the NASA-TLX score.
  • Objective Workload is a dependent variable, measured by the auditory oddball miss percentage.
  • ( 1 | Participant ) denotes a random effect for participants, accounting for the within-participant variability.

2.6.3. Hypothesis 3—Composite Score and Workload

We investigated the relationship between the composite score and the workload across scenarios. We hypothesized that higher performance in the simulator would be associated with lower workload. Operationally, we hypothesized significant negative correlations between the composite score and NASA-TLX (Hypothesis 3a); and significant negative correlations between the composite score and oddball miss percentage (Hypothesis 3b).

2.6.4. Supplementary Analyses: Flight Hours, Workload and Composite Score

Finally, we performed supplementary analyses, with the assumption that more experienced pilots would have higher performance and lower workload. Operationally, we hypothesized significant positive correlations between the composite score and flight hours, and negative correlations between both objective/subjective workload and flight hours.

3. Results

3.1. Hypothesis 1—Scenario and Workload

3.1.1. Hypothesis 1a—Subjective Workload (NASA-TLX)

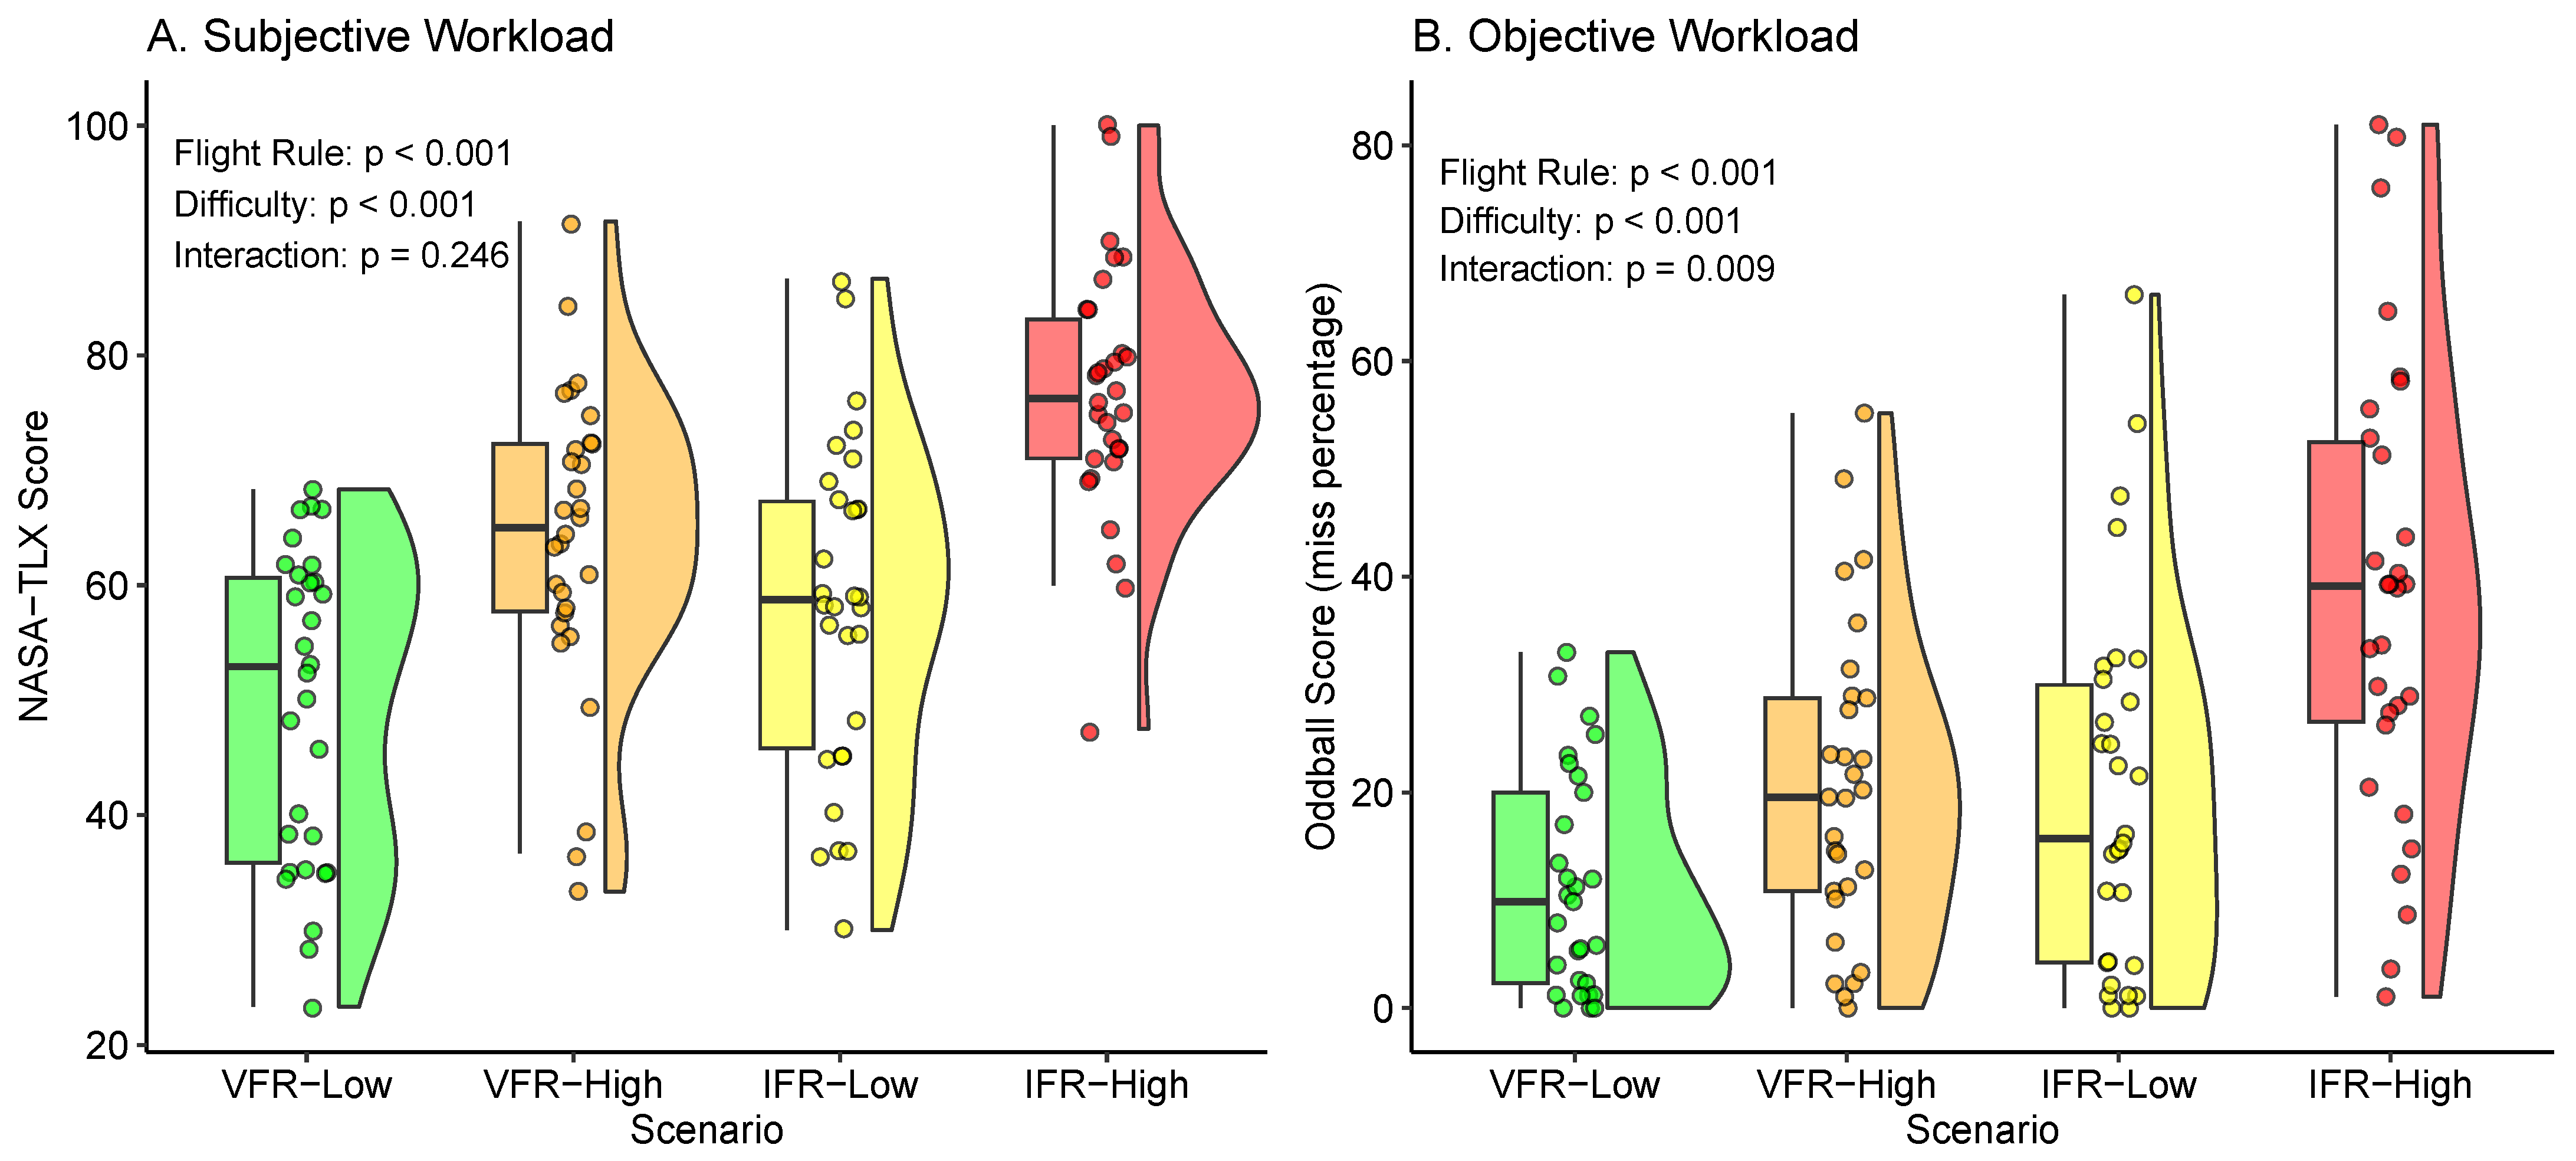
The results of this hypothesis are highlighted in Table 3 and Figure 5–left panel. The NASA-TLX mean score for VFR-low and VFR-high were 49.6 (±13.6) and 64.0 (±13.2), respectively. For IFR-low and IFR-high, the mean scores were 58.2 (±14.4) and 76.8 (±11.0), respectively. The mixed-effects model revealed a significant difference in NASA-TLX scores, with higher values for High vs. Low difficulty conditions (p < 0.001), and for IFR vs. VFR conditions (p < 0.001), thus supporting our hypotheses. No significant interaction was found (p = 0.246).

3.1.2. Hypothesis 1b—Objective Workload (Oddball)

The results of this hypothesis are highlighted in Table 4 and Figure 5–right panel. For VFR-low and VFR-high, the mean oddball miss percentage was 11.3% (±10.2) and 20.5% (±14.4), respectively. For IFR-low and IFR-high, the mean miss rate was 20.1% (±17.2) and 38.3% (±21.5), respectively. The mixed-effects model revealed a significant difference in oddball score, with higher miss rates for High vs. Low difficulty conditions (p < 0.001), and for IFR vs. VFR conditions (p < 0.001), thus supporting our hypotheses. A significant interaction was found (p = 0.009), showing that the difference between Low and High difficulty scenarios was more pronounced for IFR compared to VFR conditions.

3.2. Hypothesis 2—Subjective and Objective Workload

A mixed-effects model was fitted to understand the relationship between the NASA-TLX scores and the oddball miss percentage (N = 30, 118 observations), and is shown in Figure 6. The fixed effect of oddball miss percentage on the NASA-TLX scores was significant (p < 0.001). Effect sizes were calculated with Conditional R² (random and fixed effect) and Marginal R2 (fixed effect only), and were 0.605 and 0.373, respectively. This indicates that a higher oddball miss percentage is associated with higher NASA-TLX scores, with 37% of explained variance, which was in line with our hypothesis.

3.3. Hypothesis 3—Composite Score and Workload

3.3.1. Hypothesis 3a—Subjective Workload

All correlations between the Composite Score and the NASA-TLX are shown in Figure 7, and were negative, ranging from −0.19 to −0.47. These correlations were significant in the IFR conditions at both Low (p = 0.011) and High difficulty levels (p = 0.013). Although the negative correlations are in line with our hypotheses, they were only significant in the IFR conditions, thus partially supporting our hypotheses.

3.3.2. Hypothesis 3b—Objective Workload

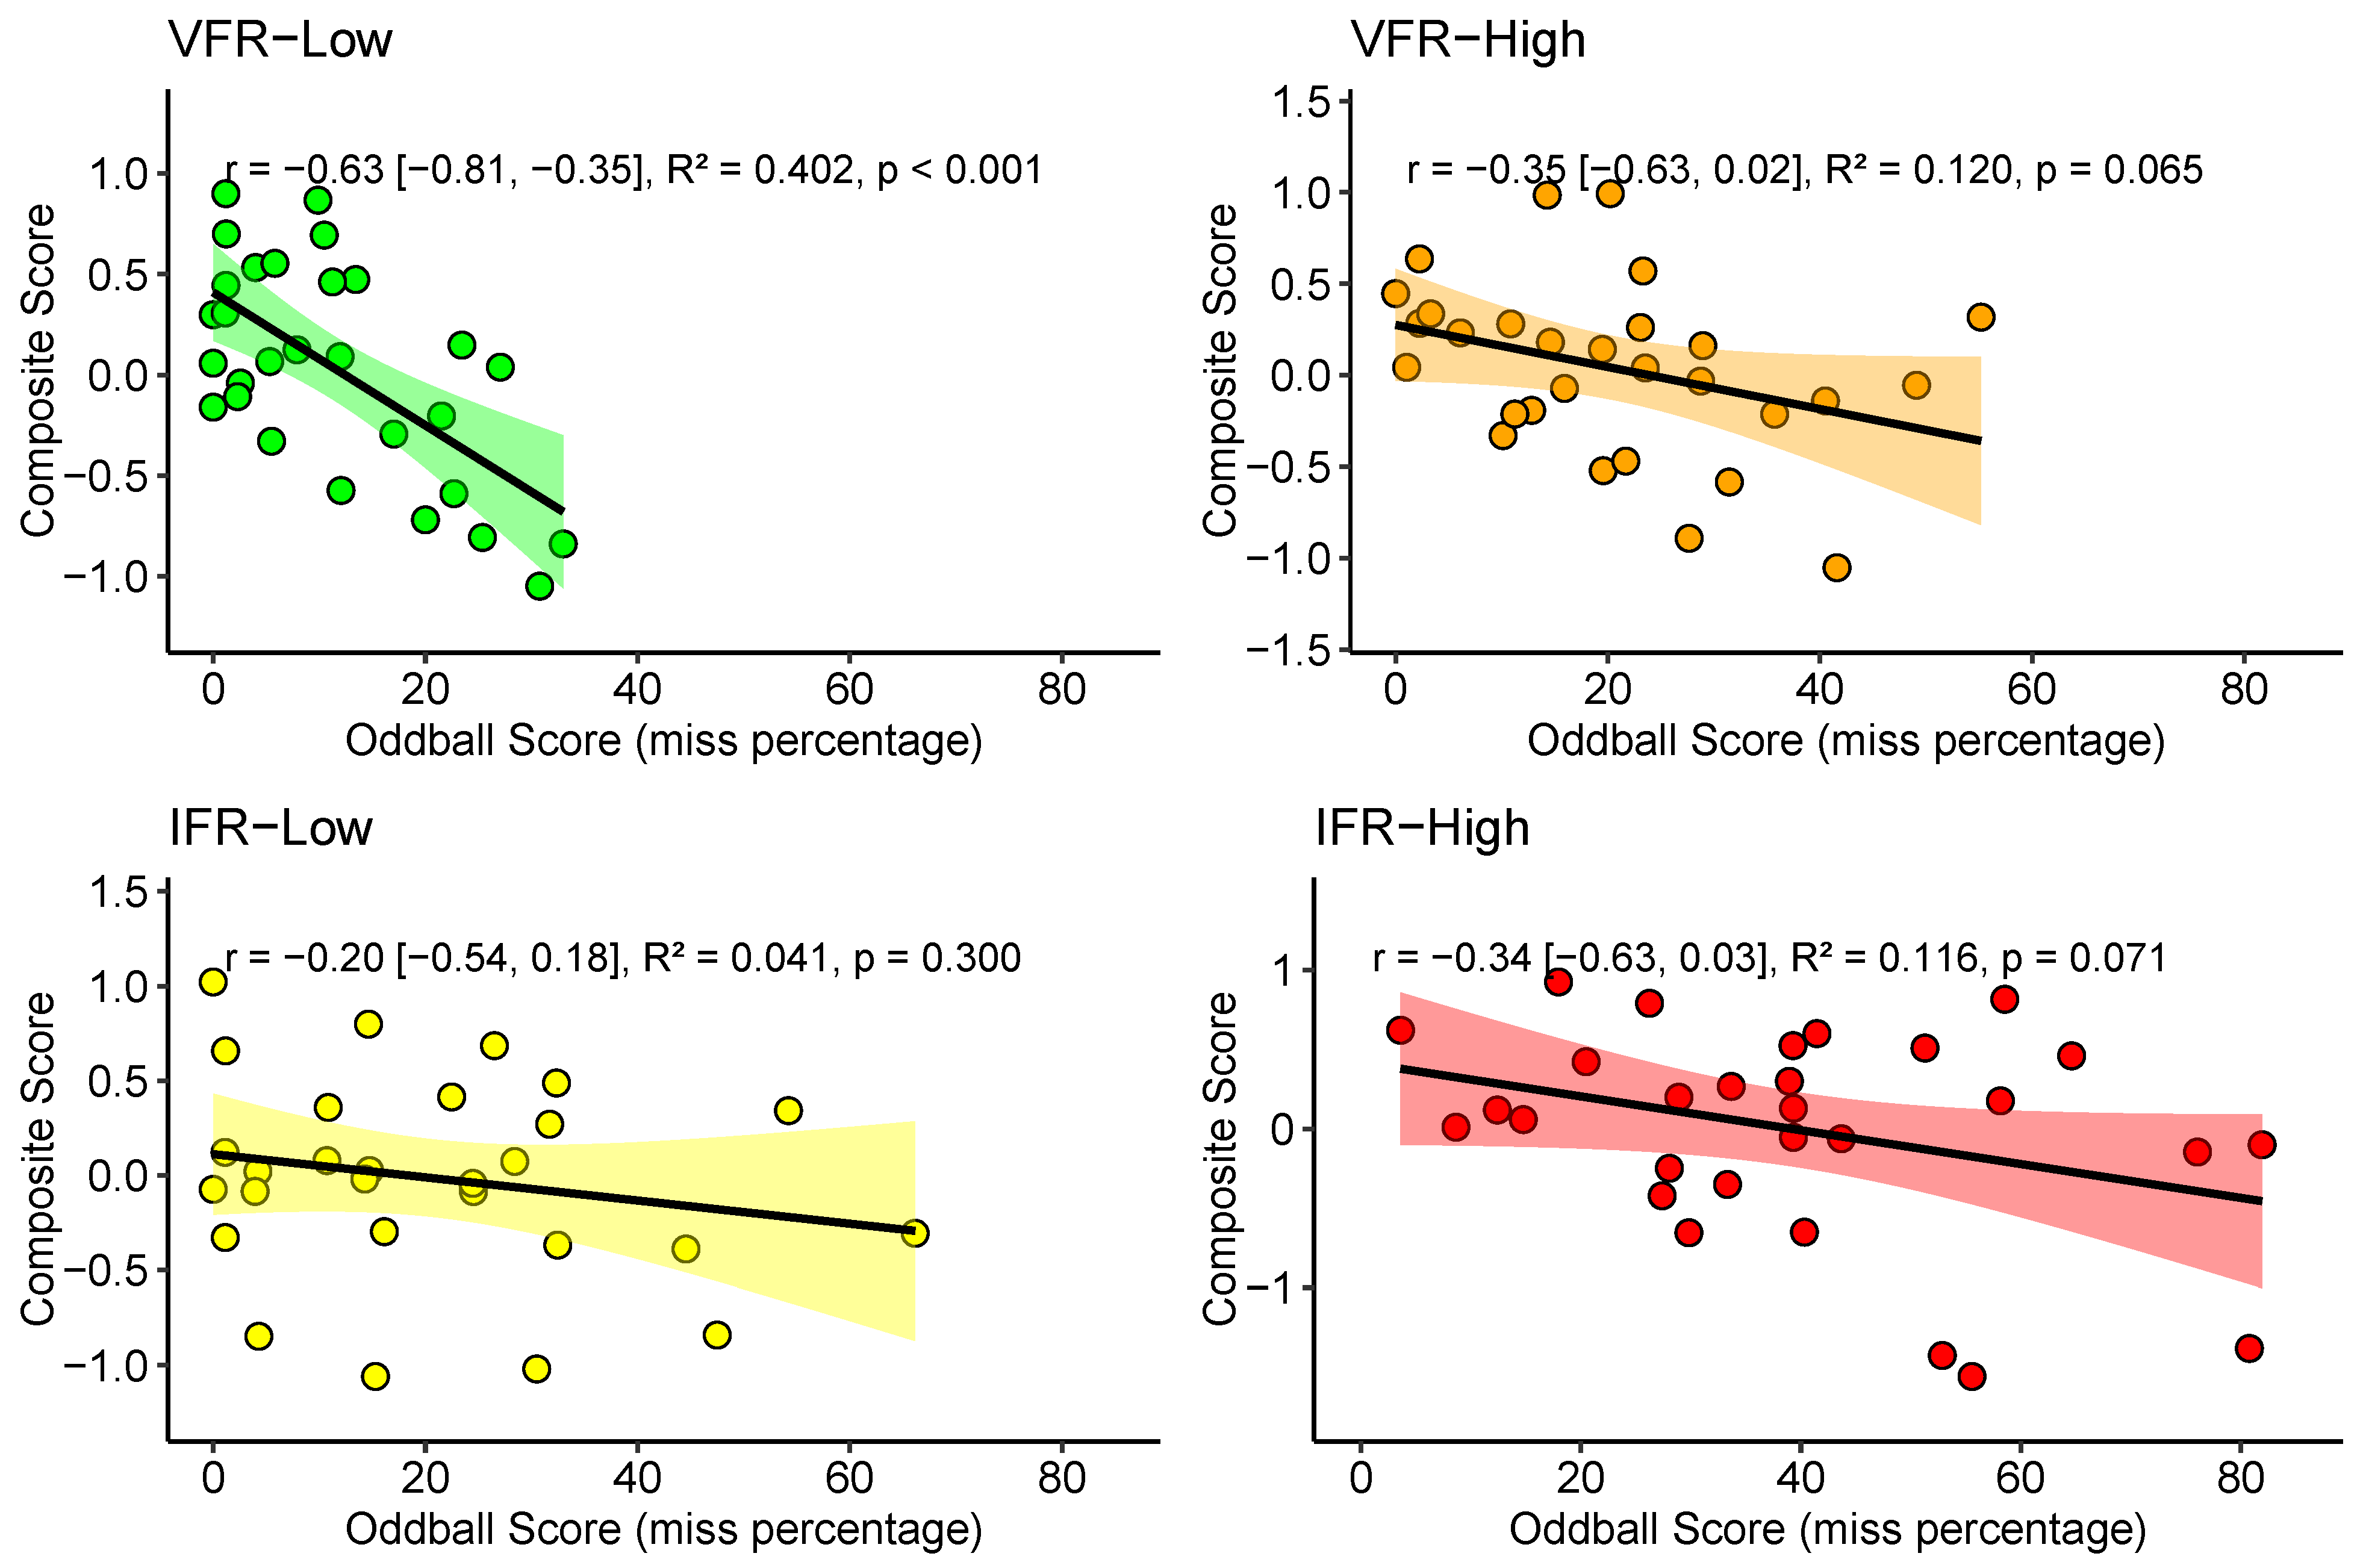
All correlations between the Composite Score and the oddball miss percentage are shown in Figure 8 and were negative, indicating a consistent inverse relationship across conditions, with values ranging from −0.20 to −0.63. This relationship reached statistical significance only in the VFR-low condition (p = 0.001), and was near significant for VFR-hard and IFR-hard (p = 0.065 and p = 0.071, respectively).

3.4. Supplementary Analyses: Flight Hours, Workload and Composite Score

The results of these analyses can be found in the supplementary material. Overall, there were negative relationships between flight hours and workload (r between −0.21 and −0.54) and positive relationships between flight hours and the composite score (r between 0.00 and 0.32), although they did not reach significance.

3.5. Flight Performance Visualization (Web Application Questionnaire)

An example of the results for one pilot in the application is highlighted in the Figure 9. Concerning the questionnaire, the descriptive statistics for each dimension are as follows: Usability (GUI) (mean = 5.14, SD = 1.27); Relevance (mean = 5.74, SD = 1.22); Utility (experimental feedback) (mean = 5.73, SD = 1.05); Utility (pilot training feedback) (mean = 5.90, SD = 1.28). The lowest score was obtained for the item ‘Appealing’ (mean = 4.67, SD = 1.32) while the highest score was obtained for the item ‘Relevance’ (mean = 6.19, SD = 0.93). The Table 5 shows the results for each item.

3.6. Summary of Hypotheses and Results

The summary of hypotheses and results can be found in Table 6.

4. Discussion

The primary objective of this study was to develop a composite score to evaluate pilot performance during traffic patterns and to provide a visual representation of this performance with an app. In this section, we will delve into the results of the main hypotheses. Then we will conclude with the limitations and future directions.

4.1. Hypothesis 1—Scenarios and Workload

The increase in both objective and subjective workload for IFR vs. VFR conditions, and for High vs. Low difficulty scenarios aligns with our hypotheses.
Specifically, the NASA-TLX scores (subjective workload) in the VFR-low condition are similar to those reported in a meta-analysis [38], where aircraft piloting scores ranged from 16 to 74 with a median of 48. The higher scores obtained for the IFR conditions may be due to the participants being recreational pilots. As argued previously [39], these novice pilots experience higher workload during IFR conditions. This may reflect the fact that they were not trained for these conditions (for example, the use of instrument landing system during a night flight in clouds) or for one engine failure in a twin-engine aircraft. Nor were they familiar with a glass cockpit, as most of them flew with light single-engine aircraft’s with analog instruments. Note that the scenarios were designed to challenge participants with unfamiliar situations, much like flight training. Furthermore, the concurrent oddball task likely increased subjective workload, requiring sustained attention.
The 40% oddball miss rate (objective workload) in the IFR-high condition is lower than the 50–60% reported in previous studies [14,40], likely because engine failure was introduced only in the latter half of the IFR-high scenario. Furthermore, our experimental setup was inherently less stressful than these previous studies [14,40], which involved the use of actual smoke within the cabin to simulate a failure scenario and included the silent presence of flight instructors, thereby introducing additional psychological and social stress factors. In any case, these high percentages can be related to very high mental workload, and may be explained by degraded mental states such as attentional tunneling or inattentional deafness [41,42].
In summary, the results indicate that the scenarios require different levels of workload to perform adequately, from very easy scenarios to more difficult ones involving complex cognitive processes. The results therefore suggest that they are suitable for the development of a performance score across a diverse range of situations.

4.2. Hypothesis 2—Subjective and Objective Workload Relationship

The strong relationship between subjective (NASA-TLX) and objective (auditory oddball miss percentage) workload measures highlight their validity in capturing different aspects of the workload construct. This is consistent with previous studies [43].
It is however important to consider the temporal context of these workload measures. The oddball task, performed concurrently with the flight task, may assess attentional resource allocation [44], with a lower miss rate indicating greater attentional capacity for the secondary task. In contrast, the NASA-TLX [15], a post-task questionnaire, aims to evaluate overall workload, reflecting the cognitive demands of both the flight and oddball tasks. However, it may not fully capture fluctuating workload demands across different flight phases, potentially oversimplifying workload variations within a scenario. Therefore, while both measures assess workload, they do so from different perspectives.
As a result, these two workload indicators (oddball and NASA-TLX scores) may be considered complementary, each providing a unique insight of the pilots’ workload [44].

4.3. Hypothesis 3—Composite Score and Workload

The validity of the composite score is partially supported by its consistent, though subtle, negative relationship with both subjective and objective workload measures across scenarios.
Indeed, the composite score capacity to reflect performance variations in response to differing workload levels is consistent with the multiple resource theory [29,31,32]. The observed instances of higher subjective workload (especially in IFR-high scenarios, for which pilots were untrained) corresponded to lower composite scores, corroborating this theory and affirming the metric’s utility in capturing some complexity of pilots’ performance. However, in VFR scenarios, this relationship was less evident. A possible interpretation could be that the subjective workload was not high enough in these scenarios to significantly challenge the pilots’ cognitive resources, thus not causing a wide range of performance differences in the task.

4.4. Supplementary Analyses: Flight Hours, Workload, and Composite Score

As expected, workload was negatively correlated with flight experience, measured by total flight hours. This relationship was the strongest under VFR conditions, which aligns with typical private pilot training. It is therefore not surprising that pilots with more flight hours experienced lower workload in these familiar scenarios. In contrast, under IFR conditions, the correlation was weaker, which is consistent with the fact that the pilots in this study had not received IFR training, and thus faced a novel situation regardless of their flight time.
The relationship between flight hours and the composite performance score was consistently positive, although it did not reach significance. This may reflect limited statistical power in our study. It is also plausible that the relationship is not linear but asymptotic, as more experienced pilots may approach a performance ceiling within the calibrated scenarios used here.

4.5. Flight Performance Visualization

The evaluation of the application through the questionnaire provided valuable insights into its usability, relevance, and utility. Overall, the application received positive feedback.
While the application was judged as intuitive, improvements in responsiveness and visual appeal (GUI) are certainly needed. Relevant to our goal, the participants’ ratings indicated that the visualization helped them understand their level of performance and identify areas to improve, and that they received considerable support for its use in pilot training.
In an open question about what could be improved in the application, pilots asked for more dynamic visualization (for example, a “replay-mode” with the associated data from various instruments within a 3D environment), better visualization of approach quality (allowing the comparison of the optimal slope and alignment with the runway), and the addition of thresholds on certain metrics (for example speed, altitude, g load, etc.). These recommendations from pilots are essential to the development of a potential future application.
Overall, these results suggest that an application providing objective performance metrics could significantly enhance pilot training. This data-driven approach has the potential to improve training effectiveness by complementing the subjective feedback from instructors with quantifiable insights. Notably, similar data-driven approaches have been successfully employed in other fields, such as professional racing [1]. Such an application could be utilized by both instructors and trainees during post-flight debriefings, facilitating more effective skill acquisition. Future developments may focus on integrating dynamic visualizations and comparative analyses with threshold indicators for key metrics such as approach or landing quality, thereby enriching the training experience and performance evaluation.

4.6. Limitations and Future Direction

Several limitations exist in this experiment. The focus on manual flying scenarios makes the composite score less applicable to commercial aviation, which frequently involves autopilot systems. Therefore, adapting the score to include automated flight aspects seems necessary.
The utility of the score depends on normalization within each flight scenario. As a result, computing a composite score for other types of flight scenarios (e.g., different aircraft, weather, airport, events, etc.) would require a comprehensive normative dataset with a large sample size for each specific scenario. Furthermore, while stable laboratory conditions in the flight simulator aid consistency, real-world variables (e.g., wind, temperature, unexpected events) could make it difficult to derive norms. One way to remedy this would be to adapt metrics to specific time windows or flight phases (e.g., achieving certain speeds or altitudes) to better reflect varying conditions.
The composite score may also lack sensitivity to discriminate performance between expert pilots due to potential ceiling effects. We argue that its use would be primarily for novice pilots to track changes in their manual piloting during training and should complement rather than replace instructor assessments.
A last limitation would be that the study’s design did not allow testing of the score’s external validity, as we lacked access to an instructor for independent performance evaluation, preventing us from establishing a correlation with the composite score (intraclass correlation).
Finally, regarding the app, pilots expressed their concerns about the responsiveness and visualization features. The responsiveness could be improved with code optimization of dataframe loading, and visualization could be improved by providing charts for various metrics (speed, altitude, approach, etc.).
In conclusion, the generalization of the composite score is limited by the study’s sample size (N = 30) and the number of scenarios (4). Future research should expand the sample size; include both simulated and real-flight data across more scenarios, especially those with higher difficulty levels; and test external validity with independent instructor evaluations. Additionally, enhancing the score to include metrics like communication efficiency, decision-making under pressure, and physiological measures (e.g., electrocardiography, near-infrared spectroscopy, electroencephalography, eye tracking; see [45,46,47]) would provide a more comprehensive view of a pilot’s abilities. These improvements would enhance the robustness and applicability of the composite score in pilot training. Finally, future research is recommended to test the effect of a data-driven approach (via a similar visualization app) on training quality and effectiveness.

5. Conclusions

This study aimed to develop a composite score—and its visualization through an online application—for assessing pilot performance in traffic patterns. Our findings suggest that this score is somewhat representative of performance in various scenarios, although future studies need to test its external validity by correlating it with expert instructor’s ratings. While primarily applicable to scenarios involving manual flying and private pilot license training, the potential for its adaptation to broader aviation contexts is present.

Supplementary Materials

The following supporting information can be downloaded at: https://www.mdpi.com/article/10.3390/safety11020037/s1, Figure S1: Illustration of the traffic pattern for all scenarios; Figure S2: Illustration of the preprocessing pipeline to derive comparable sub-scores; Figure S3: Density of the composite score for each scenario; Figure S4: Correlations between Flight Hours and NASA-TLX Scores; Figure S5: Correlations between Flight Hours and Odball Scores; Figure S6. Correlations between Flight Hours and Composite Scores; Table S1: Competency-based task matrix by flight phase and scenario; Table S2. Sensitivity of the composite score per scenario.

Author Contributions

Conceptualization, Q.C., F.D. and S.S.; methodology, Q.C., F.R., F.D. and S.S.; software, Q.C.; validation, S.S.; formal analysis, Q.C. and F.R.; investigation, Q.C. and F.R.; resources, S.S.; data curation, Q.C.; writing—original draft preparation, Q.C.; writing—review and editing, Q.C., F.R., F.D. and S.S.; visualization, Q.C.; supervision, S.S.; project administration, S.S.; funding acquisition, S.S. All authors have read and agreed to the published version of the manuscript.

Funding

This research was funded by French National Research Agency (ANR) and the Defense Procurement Agency (DGA), ASTRID program [grant numbers ANR-17-ASTR-0005].

Institutional Review Board Statement

This research was conducted in accordance with the Declaration of Helsinki and was approved by the Institutional Review Board of EuroMov-Montpellier (IRB2203C, in March 2022).

Informed Consent Statement

Informed consent was obtained from each participant involved in the study, and they were informed of their right to stop their participation at any time.

Data Availability Statement

The processed data presented in the study are openly available in Github at https://github.com/Chenot/FlightSimulatorMetrics (accessed on 20 April 2025). The raw data will be made available by the authors on request.

Conflicts of Interest

The authors declare no conflicts of interest. The funders had no role in the design of the study; in the collection, analyses, or interpretation of data; in the writing of the manuscript; or in the decision to publish the results.

Abbreviations

The following abbreviations are used in this manuscript:
TLXTask-Load Index
SDStandard Deviation
VFRVisual Flight Rule
IFRInstrument Flight Rule

References

  1. Bugeja, K.; Spina, S.; Buhagiar, F. Telemetry-based optimisation for user training in racing simulators. In Proceedings of the 2017 9th International Conference on Virtual Worlds and Games for Serious Applications (VS-Games), Athens, Greece, 6–8 September 2017; pp. 31–38. [Google Scholar]
  2. Trophi.Ai. Available online: https://www.trophi.ai/ (accessed on 20 April 2025).
  3. O’Hare, D. Human Performance in General Aviation; Routledge: London, UK, 2017. [Google Scholar]
  4. Shaker, M.H.; Al-Alawi, A.I. Application of big data and artificial intelligence in pilot training: A systematic literature review. In Proceedings of the 2023 International Conference on Cyber Management and Engineering (CyMaEn), Bangkok, Thailand, 26–27 January 2023; pp. 205–209. [Google Scholar]
  5. Kharoufah, H.; Murray, J.; Baxter, G.; Wild, G. A review of human factors causations in commercial air transport accidents and incidents: From to 2000–2016. Prog. Aerosp. Sci. 2018, 99, 1–13. [Google Scholar] [CrossRef]
  6. Causse, M.; Dehais, F.; Pastor, J. Executive functions and pilot characteristics predict flight simulator performance in general aviation pilots. Int. J. Aviat. Psychol. 2011, 21, 217–234. [Google Scholar] [CrossRef]
  7. Haslbeck, A.; Kirchner, P.; Schubert, E.; Bengler, K. A flight simulator study to evaluate manual flying skills of airline pilots. In Proceedings of the Human Factors and Ergonomics Society Annual Meeting, Chicago, IL, USA, 27–31 October 2014; SAGE Publications Sage: Los Angeles, CA, USA, 2014; Volume 58, pp. 11–15. [Google Scholar]
  8. Lounis, C.; Peysakhovich, V.; Causse, M. Visual scanning strategies in the cockpit are modulated by pilots’ expertise: A flight simulator study. PLoS ONE 2021, 16, e0247061. [Google Scholar] [CrossRef] [PubMed]
  9. Wang, L.; Zhang, J.; Dong, C.; Sun, H.; Ren, Y. A method of applying flight data to evaluate landing operation performance. Ergonomics 2019, 62, 171–180. [Google Scholar] [CrossRef]
  10. Hebbar, P.A.; Pashilkar, A.A. Pilot performance evaluation of simulated flight approach and landing manoeuvres using quantitative assessment tools. Sādhanā 2017, 42, 405–415. [Google Scholar] [CrossRef]
  11. Souza, A.C.d.; Alexandre, N.M.C.; Guirardello, E.d.B. Psychometric properties in instruments evaluation of reliability and validity. Epidemiol. Serv. Saude 2017, 26, 649–659. [Google Scholar] [CrossRef]
  12. Lehrer, P.; Karavidas, M.; Lu, S.E.; Vaschillo, E.; Vaschillo, B.; Cheng, A. Cardiac data increase association between self-report and both expert ratings of task load and task performance in flight simulator tasks: An exploratory study. Int. J. Psychophysiol. 2010, 76, 80–87. [Google Scholar] [CrossRef]
  13. Lassiter, D.L.; Morrow, D.G.; Hinson, G.E.; Miller, M.; Hambrick, D.Z. Expertise and age effects on pilot mental workload in a simulated aviation task. In Proceedings of the Human Factors and Ergonomics Society Annual Meeting, Philadelphia, PA, USA, 2–6 September 1996; SAGE Publications Sage: Los Angeles, CA, USA, 1996; Volume 40, pp. 133–137. [Google Scholar]
  14. Dehais, F.; Roy, R.N.; Scannella, S. Inattentional deafness to auditory alarms: Inter-individual differences, electrophysiological signature and single trial classification. Behav. Brain Res. 2019, 360, 51–59. [Google Scholar] [CrossRef]
  15. Hart, S.G. NASA-task load index (NASA-TLX); 20 years later. In Proceedings of the Human Factors and Ergonomics Society Annual Meeting, San Francisco, CA, USA, 16–20 October 2006; SAGE Publications Sage: Los Angeles, CA, USA, 2006; Volume 50, pp. 904–908. [Google Scholar]
  16. Scannella, S.; Peysakhovich, V.; Ehrig, F.; Lepron, E.; Dehais, F. Assessment of ocular and physiological metrics to discriminate flight phases in real light aircraft. Hum. Factors 2018, 60, 922–935. [Google Scholar] [CrossRef]
  17. Peißl, S.; Wickens, C.D.; Baruah, R. Eye-tracking measures in aviation: A selective literature review. Int. J. Aerosp. Psychol. 2018, 28, 98–112. [Google Scholar] [CrossRef]
  18. Hsu, C.K.; Lin, S.C.; Li, W.C. Visual movement and mental-workload for pilot performance assessment. In Proceedings of the Engineering Psychology and Cognitive Ergonomics: 12th International Conference, EPCE 2015, Held as Part of HCI International 2015, Los Angeles, CA, USA, 2–7 August 2015; Proceedings 12. Springer: Berlin/Heidelberg, Germany, 2015; pp. 356–364. [Google Scholar]
  19. Dehais, F.; Dupres, A.; Di Flumeri, G.; Verdiere, K.; Borghini, G.; Babiloni, F.; Roy, R. Monitoring pilot’s cognitive fatigue with engagement features in simulated and actual flight conditions using an hybrid fNIRS-EEG passive BCI. In Proceedings of the 2018 IEEE International Conference on Systems, Man, and Cybernetics (SMC), Miyazaki, Japan, 7–10 October 2018; pp. 544–549. [Google Scholar]
  20. Gateau, T.; Ayaz, H.; Dehais, F. In silico vs. over the clouds: On-the-fly mental state estimation of aircraft pilots, using a functional near infrared spectroscopy based passive-BCI. Front. Hum. Neurosci. 2018, 12, 187. [Google Scholar] [CrossRef] [PubMed]
  21. Bobko, P.; Roth, P.L.; Buster, M.A. The usefulness of unit weights in creating composite scores: A literature review, application to content validity, and meta-analysis. Organ. Res. Methods 2007, 10, 689–709. [Google Scholar] [CrossRef]
  22. Lichtenberger, E.O.; Kaufman, A.S. Essentials of WAIS-IV Assessment; John Wiley & Sons: Hoboken, NJ, USA, 2009; Volume 50. [Google Scholar]
  23. Yesavage, J.A.; Taylor, J.L.; Mumenthaler, M.S.; Noda, A.; O’Hara, R. Relationship of age and simulated flight performance. J. Am. Geriatr. Soc. 1999, 47, 819–823. [Google Scholar] [CrossRef]
  24. Taylor, J.L.; Kennedy, Q.; Noda, A.; Yesavage, J.A. Pilot age and expertise predict flight simulator performance: A 3-year longitudinal study. Neurology 2007, 68, 648–654. [Google Scholar] [CrossRef]
  25. Yesavage, J.A.; Jo, B.; Adamson, M.M.; Kennedy, Q.; Noda, A.; Hernandez, B.; Zeitzer, J.M.; Friedman, L.F.; Fairchild, K.; Scanlon, B.K.; et al. Initial cognitive performance predicts longitudinal aviator performance. J. Gerontol. Ser. Psychol. Sci. Soc. Sci. 2011, 66, 444–453. [Google Scholar] [CrossRef]
  26. Kennedy, Q.; Taylor, J.; Heraldez, D.; Noda, A.; Lazzeroni, L.C.; Yesavage, J. Intraindividual variability in basic reaction time predicts middle-aged and older pilots’ flight simulator performance. J. Gerontol. Ser. Psychol. Sci. Soc. Sci. 2013, 68, 487–494. [Google Scholar] [CrossRef]
  27. boeing.com. Statistical Summary of Commercial Jet Airplane Accidents. Available online: https://www.boeing.com/content/dam/boeing/boeingdotcom/company/about_bca/pdf/statsum.pdf (accessed on 20 April 2025).
  28. ntsb.gov. General Aviation Accident Dashboard: 2012–2021. Available online: https://www.ntsb.gov/safety/data/Pages/GeneralAviationDashboard.aspx (accessed on 20 April 2025).
  29. Wickens, C.D. Multiple resource time sharing models. In Handbook of Human Factors and Ergonomics Methods; CRC Press: Boca Raton, FL, USA, 2004; pp. 427–434. [Google Scholar]
  30. Fowler, B. P300 as a measure of workload during a simulated aircraft landing task. Hum. Factors 1994, 36, 670–683. [Google Scholar] [CrossRef]
  31. Wickens, C.D. Multiple resources and performance prediction. Theor. Issues Ergon. Sci. 2002, 3, 159–177. [Google Scholar] [CrossRef]
  32. Wickens, C.D. Multiple resources and mental workload. Hum. Factors 2008, 50, 449–455. [Google Scholar] [CrossRef]
  33. Hart, S.G.; Staveland, L.E. Development of NASA-TLX (Task Load Index): Results of empirical and theoretical research. In Advances in Psychology; Elsevier: Amsterdam, The Netherlands, 1988; Volume 52, pp. 139–183. [Google Scholar]
  34. R Core Team. R: A Language and Environment for Statistical Computing; R Core Team: Vienna, Austria, 2010. [Google Scholar]
  35. R Core Team. RStudio: Integrated Development for R; R Core Team: Vienna, Austria, 2015. [Google Scholar]
  36. Shinyapps.Io. Available online: https://powerbrain-simulator.shinyapps.io/shinyapphf/ (accessed on 20 April 2025).
  37. Github.Com. Available online: https://github.com/Chenot/FlightSimulatorMetrics (accessed on 20 April 2025).
  38. Grier, R.A. How high is high? A meta-analysis of NASA-TLX global workload scores. In Proceedings of the Human Factors and Ergonomics Society Annual Meeting, Los Angeles, CA, USA, 26–30 October 2015; SAGE Publications Sage: Los Angeles, CA, USA, 2015; Volume 59, pp. 1727–1731. [Google Scholar]
  39. Wilson, G.F.; Hankins, T. EEG and subjective measures of private pilot workload. In Proceedings of the Human Factors and Ergonomics Society Annual Meeting, Nashville, TN, USA, 24–28 October 1994; SAGE Publications Sage: Los Angeles, CA, USA, 1994; Volume 38, pp. 1322–1325. [Google Scholar]
  40. Dehais, F.; Roy, R.N.; Gateau, T.; Scannella, S. Auditory alarm misperception in the cockpit: An EEG study of inattentional deafness. In Proceedings of the Foundations of Augmented Cognition: Neuroergonomics and Operational Neuroscience: 10th International Conference, Toronto, ON, Canada, 17–22 July 2016; Proceedings, Part I 10. Springer: Berlin/Heidelberg, Germany, 2016; pp. 177–187. [Google Scholar]
  41. Giraudet, L.; St-Louis, M.E.; Scannella, S.; Causse, M. P300 event-related potential as an indicator of inattentional deafness? PLoS ONE 2015, 10, e0118556. [Google Scholar] [CrossRef]
  42. Causse, M.; Imbert, J.P.; Giraudet, L.; Jouffrais, C.; Tremblay, S. The role of cognitive and perceptual loads in inattentional deafness. Front. Hum. Neurosci. 2016, 10, 344. [Google Scholar] [CrossRef] [PubMed]
  43. Gibson, Z.; Butterfield, J.; Rodger, M.; Murphy, B.; Marzano, A. Use of dry electrode electroencephalography (EEG) to monitor pilot workload and distraction based on P300 responses to an auditory oddball task. In Proceedings of the Advances in Neuroergonomics and Cognitive Engineering: Proceedings of the AHFE 2018 International Conference on Neuroergonomics and Cognitive Engineering, Orlando, FL, USA, 21–25 July 2019; Springer: Berlin/Heidelberg, Germany, 2019; pp. 14–26. [Google Scholar]
  44. Thorpe, A.; Nesbitt, K.; Eidels, A. A systematic review of empirical measures of workload capacity. ACM Trans. Appl. Percept. TAP 2020, 17, 1–26. [Google Scholar] [CrossRef]
  45. Di Stasi, L.L.; Diaz-Piedra, C.; Suárez, J.; McCamy, M.B.; Martinez-Conde, S.; Roca-Dorda, J.; Catena, A. Task complexity modulates pilot electroencephalographic activity during real flights. Psychophysiology 2015, 52, 951–956. [Google Scholar] [CrossRef] [PubMed]
  46. Verdière, K.J.; Roy, R.N.; Dehais, F. Detecting pilot’s engagement using fNIRS connectivity features in an automated vs. manual landing scenario. Front. Hum. Neurosci. 2018, 12, 6. [Google Scholar] [CrossRef]
  47. Taheri Gorji, H.; Wilson, N.; VanBree, J.; Hoffmann, B.; Petros, T.; Tavakolian, K. Using machine learning methods and EEG to discriminate aircraft pilot cognitive workload during flight. Sci. Rep. 2023, 13, 2507. [Google Scholar] [CrossRef]
Figure 1. The Pegase flight simulator.
Safety 11 00037 g001
Figure 2. Procedure overview. Note that the feedback with the app took place several weeks after the session, and that the associated questionnaire was only completed by part of the initial sample.
Safety 11 00037 g002
Figure 3. Illustration of the traffic pattern in the IFR-high scenario (not to scale). The pilots had to perform a night landing in low visibility, after an engine failure during the downwind phase. msl: mean sea level; agl: above ground level; kt: knots.
Safety 11 00037 g003
Figure 5. Workload indicators per scenario. (A) Subjective workload assessed by the NASA-TLX. (B) Objective workload assessed by the auditory oddball miss percentage.
Safety 11 00037 g005
Figure 6. Mixed-effects model regression between NASA-TLX score and oddball miss percentage for all scenarios.
Safety 11 00037 g006
Figure 7. Correlations between the Composite Score and the NASA-TLX score across scenarios.
Safety 11 00037 g007aSafety 11 00037 g007b
Figure 8. Correlations between the Composite Score and the oddball miss percentage across scenarios.
Safety 11 00037 g008
Figure 9. Screenshots of the Shiny app 1.7.5 developed to visualize Flight Performance, allowing pilots to have access to their simulator scores. (A) This panel displays the composite score (top) and sub-scores (bottom, from left to right: landing, approach, altitude, speed, and time). Density plots compare the pilot’s performance to the sample, with the pilot’s score highlighted by a red line. (B) This panel shows the 3D flight path, speed, and altitude profiles, with color-coded flight segments (crosswind, downwind, base leg, approach).
Safety 11 00037 g009
Table 1. Flight simulator scenarios.
TypeDifficultyVisibilityLandingFailure
VFRLowDay/clearVisualNone
HighDay/cloudyVisualAltitude/speed indicators
IFRLowDay/clearInstrumentsNone
HighNight/fogInstrumentsLeft engine
Table 2. Application questionnaire.
DimensioniNItem
Usability
(GUI)
1The application’s visual design is attractive
2The application is responsive
3The layout of the application is intuitive
Relevance1The feedback provided is detailed and specific
2I understand how scores are calculated and what they represent
3The application clearly presents scores and performance metrics
4The information provided by the application is relevant
Utility
(experimental
feedback)
1The application is relevant to understand my performance during the experiment
2The application helped me identify areas where I could improve my performance
3The application provided useful feedback on my performance during the experiment
Utility
(pilot
training
feedback)
1A similar application would improve the quality of pilot training
2A similar application would provide useful feedback for pilots during training
3A similar application would help identify areas where pilots in training could improve
4A similar application would be useful for pilot training
iN: Item number.
Table 3. Results of the mixed-effects model (subjective workload).
VariableEstimateSDCI 95%dftf2p
Intercept49.62.4[44.9, 54.3]7320.8 <0.001
Difficulty14.32.5[9.4, 19.2]875.70.402<0.001
Flight Rule8.62.5[3.7, 13.5]873.40.172<0.001
Difficulty × Flight Rule4.23.6[−2.8, 11.1]871.20.0050.246
Table 4. Results of the mixed-effects model (objective workload).
VariableEstimateSDCI 95%dftf2p
Intercept10.53.0[4.5, 16.5]453.5 <0.001
Difficulty9.92.2[5.6, 14.3]854.50.201<0.001
Flight Rule9.52.2[5.3, 13.8]854.40.188<0.001
Difficulty × Flight Rule8.33.1[2.2, 14.3]852.70.0160.009
Table 5. Mean and SD for each questionnaire item (N = 21). The Likert scale ranged from 1 (strongly disagree) to 7 (strongly agree). See Table 2 for complete item description.
DimensioniNItemMeanSD
Usability
(GUI)
1Intuitive5.760.62
2Responsive51.48
3Appealing4.671.32
Relevance1Relevance6.190.93
2Score presentation61.14
3Score understanding51.38
4Detailed Feedback5.761.14
Utility
(Experimental
Feedback)
1Feedback utility5.810.98
2Identify areas to improve5.481.21
3Relevance5.90.94
Utility
(pilot
training
feedback)
1Utility of a similar app5.861.59
2Identify areas to improve6.141.11
3Feedback utility5.951.12
4Improve training quality5.671.28
iN: Item Number.
Table 6. Summary of statistical analyses, including main results, effect sizes, and p-values for each hypothesis.
Hypothesis and Results
Hypothesis 1. 
Subjective workload (H1a) and objective workload (H1b) are increased in IFR vs. VFR conditions, and in High vs Low difficulty conditions (mixed-effects models).
H1a.High > Low t = 5.7 , f 2 = 0.402 , p < 0.001 *
IFR > VFR t = 3.4 , f 2 = 0.172 , p < 0.001 *
H1b.High > Low t = 4.5 , f 2 = 0.201 , p < 0.001 *
IFR > VFR t = 4.4 , f 2 = 0.188 , p < 0.001 *
Hypothesis 2. 
Subjective and objective workload have a strong relationship (mixed-effects model).
H2. Subjective and objective workload R 2 = 0.373 , p < 0.001 *
Hypothesis 3. 
Subjective (H3a) and objective workload (H3b) are negatively associated with the composite score in all scenarios (correlations).
H3a.VFR-low r = 0.19 , r 2 = 0.037 , p = 0.311
VFR-high r = 0.36 , r 2 = 0.129 , p = 0.051
IFR-low r = 0.47 , r 2 = 0.222 , p = 0.011 *
IFR-high r = 0.46 , r 2 = 0.210 , p = 0.013 *
H3b.VFR-low r = 0.63 , r 2 = 0.402 , p < 0.001 *
VFR-high r = 0.35 , r 2 = 0.120 , p = 0.065
IFR-low r = 0.20 , r 2 = 0.041 , p = 0.300
IFR-high r = 0.34 , r 2 = 0.116 , p = 0.071
*: significant value.
Disclaimer/Publisher’s Note: The statements, opinions and data contained in all publications are solely those of the individual author(s) and contributor(s) and not of MDPI and/or the editor(s). MDPI and/or the editor(s) disclaim responsibility for any injury to people or property resulting from any ideas, methods, instructions or products referred to in the content.