Article

Occupational Risks in a Brazilian Aluminum Forming Industry: Risk Analysis and Work Environment

by
Maressa Fontana Mezoni
1,*,
Antonio Augusto de Paula Xavier
1,
Sheila Regina Oro
2,
Sergio Luiz Ribas Pessa
3,
Maiquiel Schmidt de Oliveira
2 and
Vilmar Steffen
4
1
Postgraduate Program in Production Engineering (PPGEP), Federal University of Technology—Parana (UTFPR), Rua Doutor Washington Subtil Chueire, 330, Jardim Carvalho, Ponta Grossa 84017-220, Parana, Brazil
2
Academic Department of Physics, Statistics and Mathematics, Federal University of Technology—Parana (UTFPR), 2000 Gelindo João Folador Street, Francisco Beltrão 85602-863, Parana, Brazil
3
Postgraduate Program in Production and Systems Engineering (PPGEPS), Federal University of Technology—Parana (UTFPR), Via do Conhecimento s/n, Km 01, Fraron, Pato Branco 85530-390, Parana, Brazil
4
Academic Departments of Engineering (DAENG), Federal University of Technology—Parana (UTFPR), Rua Gelindo João Folador, 2000, Francisco Beltrão 85602-863, Parana, Brazil
*
Author to whom correspondence should be addressed.
Safety 2025, 11(2), 30; https://doi.org/10.3390/safety11020030
Submission received: 14 January 2025 / Revised: 26 March 2025 / Accepted: 28 March 2025 / Published: 30 March 2025

Abstract

:
Data on work accidents reflect the incidence of harm to workers’ health and occupational diseases, supported by studies that indicate the influence of length of service on service, age, and dominant skills as contributing factors to occupational accidents. This study aimed to assess whether the working environment conditions were favorable to workers and to determine whether gender, age, and length of service influenced the occurrence of work-related accidents. The goal was to identify and mitigate risk factors to improve worker health. Descriptive statistics techniques, including Pearson correlation, Analysis of Variance, the Tukey’s test, and Cluster Analysis were applied. Additionally, a categorical variable analysis (survey) was conducted to assess the work environment, alongside postural analysis using the OWAS (Ovako Working Posture Analyzing System) method. The results revealed noise levels exceeding recommended limits in almost all investigated sectors, as well as inadequate illuminance and temperature conditions on the production line. The clustering analysis identified three distinct groups. Group 1: Individuals aged 18 to 27 with little experience in the activity, of whom 42% reported pain or discomfort. Group 2: Older operators with 62% experiencing pain or discomfort. Group 3: Young male workers with experience in the role, a higher incident of work accidents, and alcohol consumption up to three times a week, of whom 50% reported pain or discomfort. Statistical inference allowed the identification of process deficiencies and a detailed analysis of work-related pain through self-perceived diagnosis, enabling corrective actions to similar processes and contributing to existing research.

1. Introduction

With advancements in information technology and other technological innovations, the world of work has undergone significant transformations, reducing distances, and accelerating the development of new products and techniques, often at a pace that is difficult to keep up with. Organizations increasingly adapt employees to a fast-paced, digitalized work environment, effectively integrating them as just another component of the organizational structure.
Discussions on work accidents also encompass gender-related issues, introducing several ambiguities in investigations, as these concerns go beyond the male/female binary [1] and involve cultural and psychological factors [2]. In addition to gender, age, and work relationships, several studies address factors such as stress and fatigue, commitment and performance [3], as well as workers’ age and length of experience [4].
Reports of reduced work capacity, associated with health deterioration, include conditions that impair physical fitness, such as body aches and back problems, as well as emotional issues, including anxiety, depression, burnout, and stress, among others [5,6,7].
Work accidents result in significant losses in working hours and productivity for companies, and in more severe cases, may lead to the loss of human life [8,9,10]. Data on work accidents reflect both the incidence of health damage to workers and the occurrence of occupational diseases.
Studies examining work accidents across various sectors indicate the influence of personal characteristics, such as length of service, age, and dominant skills [11,12,13,14]. These studies emphasize the significance of variables related to working conditions and the work environment [15,16], while also highlighting the importance of analyzing variables associated with the consequences of these accidents, such as the type of injury, the affected body part, and the severity of the injury [17,18,19].
Brazil is among the countries with the highest incidence of work accidents [20]. Data from the International Labour Organization (ILO) show that every 15 s, a worker dies due to a work-related accident or illness, resulting in an average of 6300 deaths per day, or 2.3 million deaths per year globally. According to ILO data for 2024, only 37.4% of the workforce is protected in the event of work-related accidents, while approximately 2.3 billion workers remain unprotected [21].
Several studies have been conducted worldwide on ergonomics, but few focus on the metallurgical industry [4], which is characterized by a high mortality rate and a significant incidence of work accidents, particularly in the metalworking sector. These issues reflect the precariousness of working conditions, which, when combined with non-compliance with workplace safety and health standards, contribute to the increased rates of accidents and occupational diseases [22].
According to Altunkaynak [23], the sectors with the highest incidence of workplace accidents are mining, industry, construction, and agriculture. Within the industrial sector, the metallurgical subsector has one of the highest accident rates [24,25] and is also one of the subsectors where workers face the most hazardous and unsafe working conditions [26].
Regarding fatal accidents, 64% of the currently available research indicates that younger workers have a lower mortality rate than older workers, 16% of studies show a higher mortality rate for younger workers, while 20% found no significant difference between the age groups compared [4,12].
Research on workplace accidents has increased every decade, especially in industrialized countries, due to the high costs of accidents not only for companies but also for the workers themselves.
Another important factor is that older workers often remain in the workforce for financial reasons. However, studies show that many of these workers are compelled to leave their jobs due to poor working conditions and methods. Furthermore, the decline in muscle strength with age increases the likelihood of severe physical injuries and prolongs the recovery period for these workers [26].
According to data from the Brazilian Micro and Small Business Support Service (SEBRAE), the metalworking sector holds a strategic position in the country’s economic growth, as it plays a key role in the generation and dissemination of new technologies across all other industrial sectors. However, this sector also has one of the highest workplace accident rates [27].
The risk factors to the safety and health of workers in this complex sector are closely linked to the various types of work and production management. The physical, cognitive, and psychological demands in the work environment can lead to illness when workers’ ability to recover is exceeded [28]. The lack of standardized work organization, which is related to production capacity and available resources, often influenced by market demands, frequently alters the pace of production, leading to changes in work organization and an increase in environmental and psychosocial issues related to work [29].
The main objectives of this study were to evaluate the working conditions in the analyzed metalworking industry, identify potential process failures, and implement corrective measures to mitigate risks to workers’ health. Additionally, the study aimed to compare noise, illuminance, and temperature levels with current standards, as well as assess self-reported pain associated with work activities. It also sought to investigate the correlation between occupational accidents and variables such as age, gender, and length of service in the role, providing a broader understanding of the factors contributing to workplace accidents. Based on these findings, recommendations for process improvements were proposed to ensure the health, safety, and dignity of workers.
The results of this study can provide valuable information for process control and improvements for employers, workers, prevention specialists, legislators, and researchers. The goal is to achieve organizational and regulatory improvements that reduce workplace accident rates in the metalworking sector, thereby enhancing workers’ quality of life and minimizing the economic and social impact of work-related accidents.
To achieve the objectives, this study is structured as follows. Section 2 provides a brief review of the literature that supported this study and outlines the methods used to achieve the objectives. The results and discussion are presented in Section 3. Section 4 presents the main conclusions and recommendations for future studies.

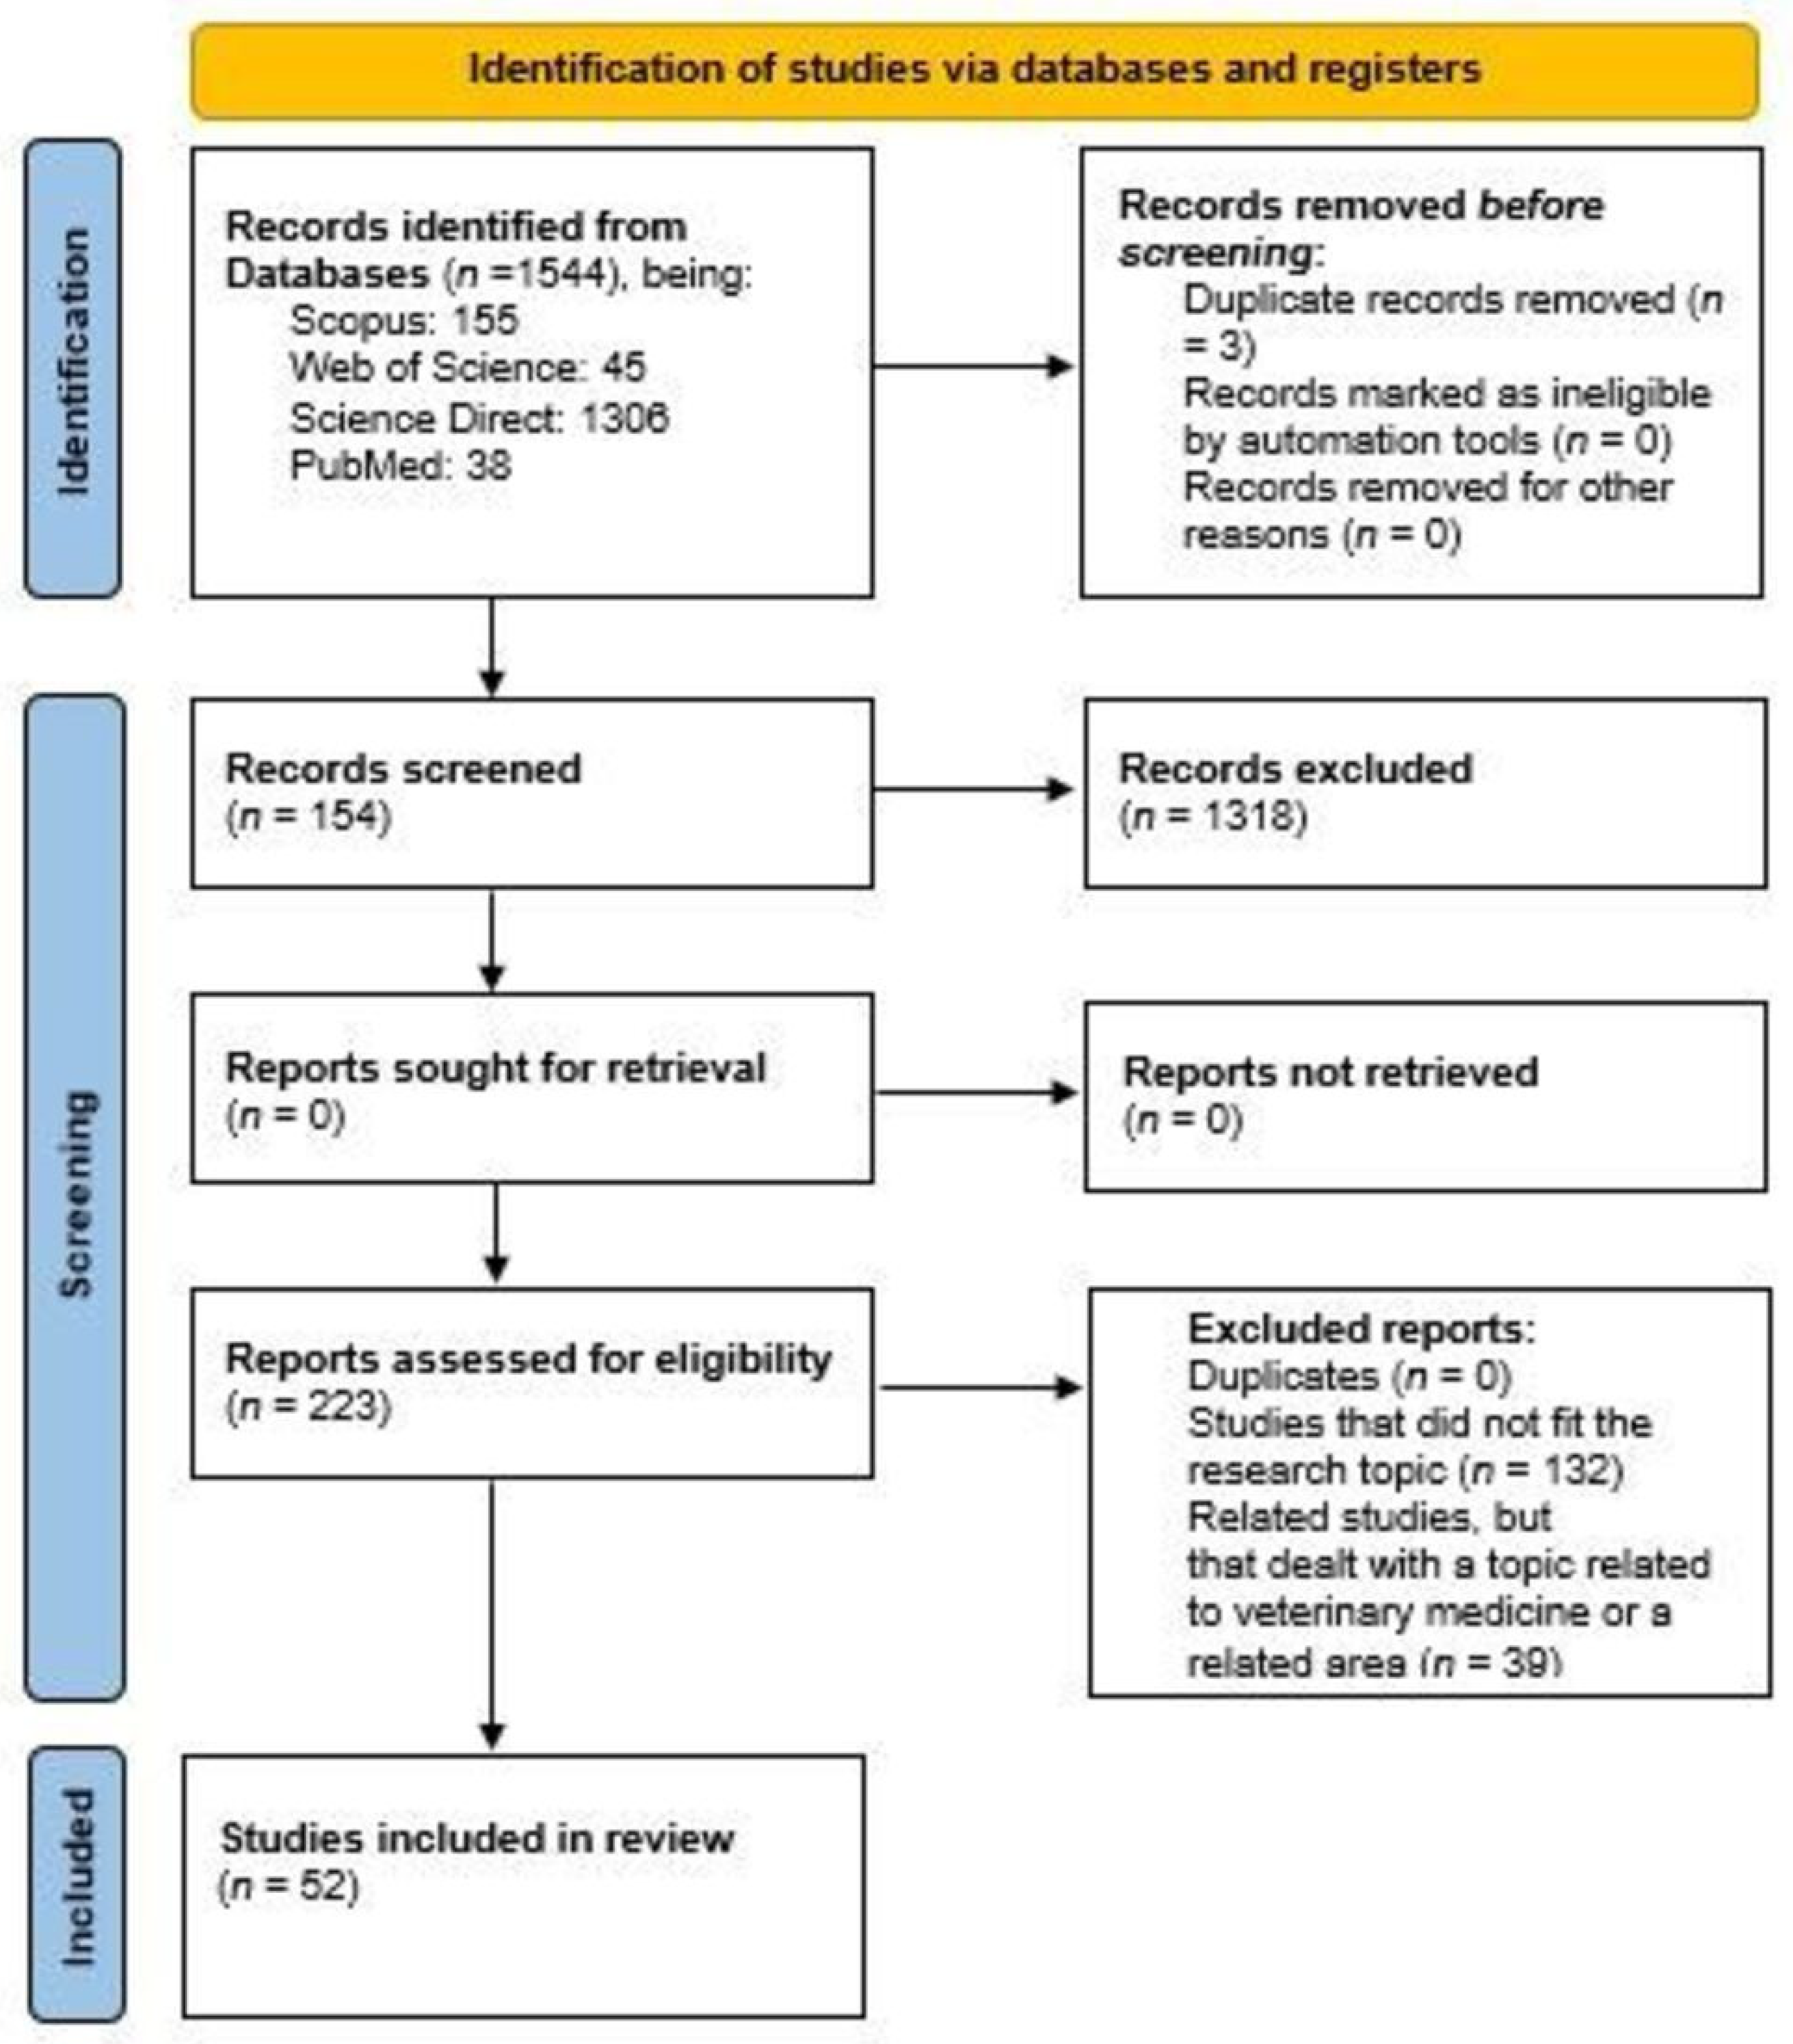
2. Materials and Methods

2.1. Ethical Procedures

To ensure that this research was conducted in accordance with ethical standards, a research project outlining this study was submitted to the Ethics and Research Committee (COEP) at the Federal Technological University of Paraná (UTFPR), as it directly involves human participation. This research project was approved by COEP and is registered under protocol number (CAEE) 30826420.1.0000.5547. In addition, full consent was also obtained.

2.2. Theoretical Basis of the Research

The study was conducted through a bibliographical survey of current and relevant literature, focused on the topic of interest. The PRISMA method [30] was employed, relying on quantitative research in databases such as Scopus, Web of Science, and Science Direct, as well as complementary databases with articles related to health, such as PubMed. These databases were chosen due to their extensive collections, which strengthen the theoretical foundation, in addition to PubMed, which contains studies related to health areas pertinent to this research.
It is important to note that the initial search retrieved 1544 studies, which were then subjected to a review of their titles and contents, applying exclusion criteria based on the PRISMA Statement as shown in the flow diagram below (Figure 1). This process considered the relevance to the research topic and the context in which the study was conducted. Only research relevant to the topic under investigation was included in this study.
Table 1 presents the keyword combinations used in the preliminary search, along with the number of studies retrieved from each database and the total number of studies identified. The details are described in the following text.

2.3. Structured Sociodemographic Questionnaire

The first procedure adopted in this study was a survey, conducted through a sociodemographic questionnaire structured based on the adapted National Aeronautics and Space Administration Task Load Index (NASA-TLX) methodology. The objective was to understand the pain experienced by production line operators from their perspective and assess the incidence of workplace accidents.
This questionnaire consisted of four sections: personal information, questions related to the physical environment and work characteristics, inquiries about previous workplace accidents, and a Pain Diagram. In the Pain Diagram, workers were asked to indicate the part of the body where they experienced pain or discomfort while performing their tasks, as well as its intensity, rated on a scale from 1 (no pain/discomfort) to 5 (unbearable pain or discomfort).
Following the administration of the structured questionnaire, a visit to the production line was conducted to observe ongoing processes, providing insights into production line operations, worker movement, and general work procedures.
The structured sociodemographic questionnaire was applied to all members of the production team to ensure that the data collected was representative and reliable.

Identification of Pain

Pain identification was conducted using the Corlett and Manenica Pain Diagram [31], which was presented alongside the structured sociodemographic questionnaire to a sample of 31 participants, representing the total number of workers on the company’s production line. This sampling approach was chosen to ensure the reliability of the collected data. In the diagram, workers used self-reported assessments to indicate the areas of the body where they experienced pain and the severity of that pain [20].

2.4. Measurements of Noise, Temperature, and Illuminance Indices in the Work Environment

The work environment in an aluminum utensil industry, like any other, can pose various risks to its operators. Therefore, this study focused on assessing the environmental risks related to noise, temperature, and illuminance in the production sector. Data collection was conducted on-site using a sound level meter, a thermal stress meter, and a multimeter (standard lux meter). All equipment was calibrated before use, and the accuracy of the sound level meter was verified by comparing noise measurements with those obatinde from specialized calibration devices.
Noise levels were evaluated based on the standards set by the Brazilian Association of [32] which establishes a maximum error tolerance of 5% for 95% reliability. The reliability of the thermal stress meter, also known as the Wet Bulb Globe Temperature (WBGT) meter, was verified through comparison with standard tables, following the guidelines of the Brazilian Calibration Network (RBC). The expanded measurement uncertainty corresponds to a coverage probability of approximately 95%, with a maximum acceptable standard error of ±0.4 °C. Similarly, the accuracy of the lux meter was assessed following RBC references by comparing its spectral readings with those of a calibrated standard device, allowing for a maximum spectral error of ±3%.
Measurements were taken at the beginning and end of the workday, with three readings conducted for each parameter in the different sectors under investigation. The arithmetic mean of the measurements was calculated, and the results analyzed according to the criteria established in Regulatory Standard No. 17 (NR17) [33], Regulatory Standard No. 15 (NR15) [34], and Occupational Hygiene Standards NHO 06 [35] and NHO 11.

2.5. Statistical Analysis

The data obtained were analyzed using the R software within the RStudio interface, R version 4.4.1 (2024-06-14 ucrt).
The analysis involved the use of the data packages ‘stats’, ‘multcomp’, ‘cor.test’, and ‘cluster’ for calculating descriptive statistics, the ‘ggplot2’ package for plotting graphs, and the ‘dplyr’ package for manipulating the remaining data. Pearson correlation was applied to identify associations between variables and work accident rates. Analysis of Variance (ANOVA) was performed to determine whether there were significant differences between the sector averages, followed by Tukey’s test for pairwise comparisons of work environment characteristics related to noise levels. Confidence intervals were estimated for variables associated with illuminance and temperature indices in the production line. Finally, Cluster Analysis was applied to group individuals based on the similarity on their responses in the structured sociodemographic questionnaire.
To assess the degree of association between the variables and the incidence of workplace accidents, data collected from the sociodemographic questionnaire were analyzed. Pearson correlation coefficient was applied to quantitative variables, while tetrachoric correlation was used for ordinal dichotomous variables. The tetrachoric correlation estimates Pearson linear correlation coefficient for variables assumed to be continuous and normally distributed. These techniques were employed to determine the strength and significance of the associations between the investigated variables and the occurrence of workplace accidents.
These techniques were used to assess the degree of significant dependence between the investigated variables (gender, age, and length of service in the role) and the number of workplace accidents (response variable). The results include the correlation matrix and the challenges encountered in applying tetrachoric correlations when applicable. Analysis of Variance (ANOVA) was performed for variables that exhibited a significant correlation to examine causality and the effects of these variables on workplace accidents. Following the ANOVA results, Tukey’s test was conducted to identify which means differed significantly from each other.
Cluster Analysis is a multivariate analytical technique used to identify meaningful subgroups of individuals or objects. To assess similarity between individuals, the Euclidean Distance Measure was applied, where the smaller values indicate greater similarity. Group formation was carried out using Ward’s hierarchical method.

3. Results

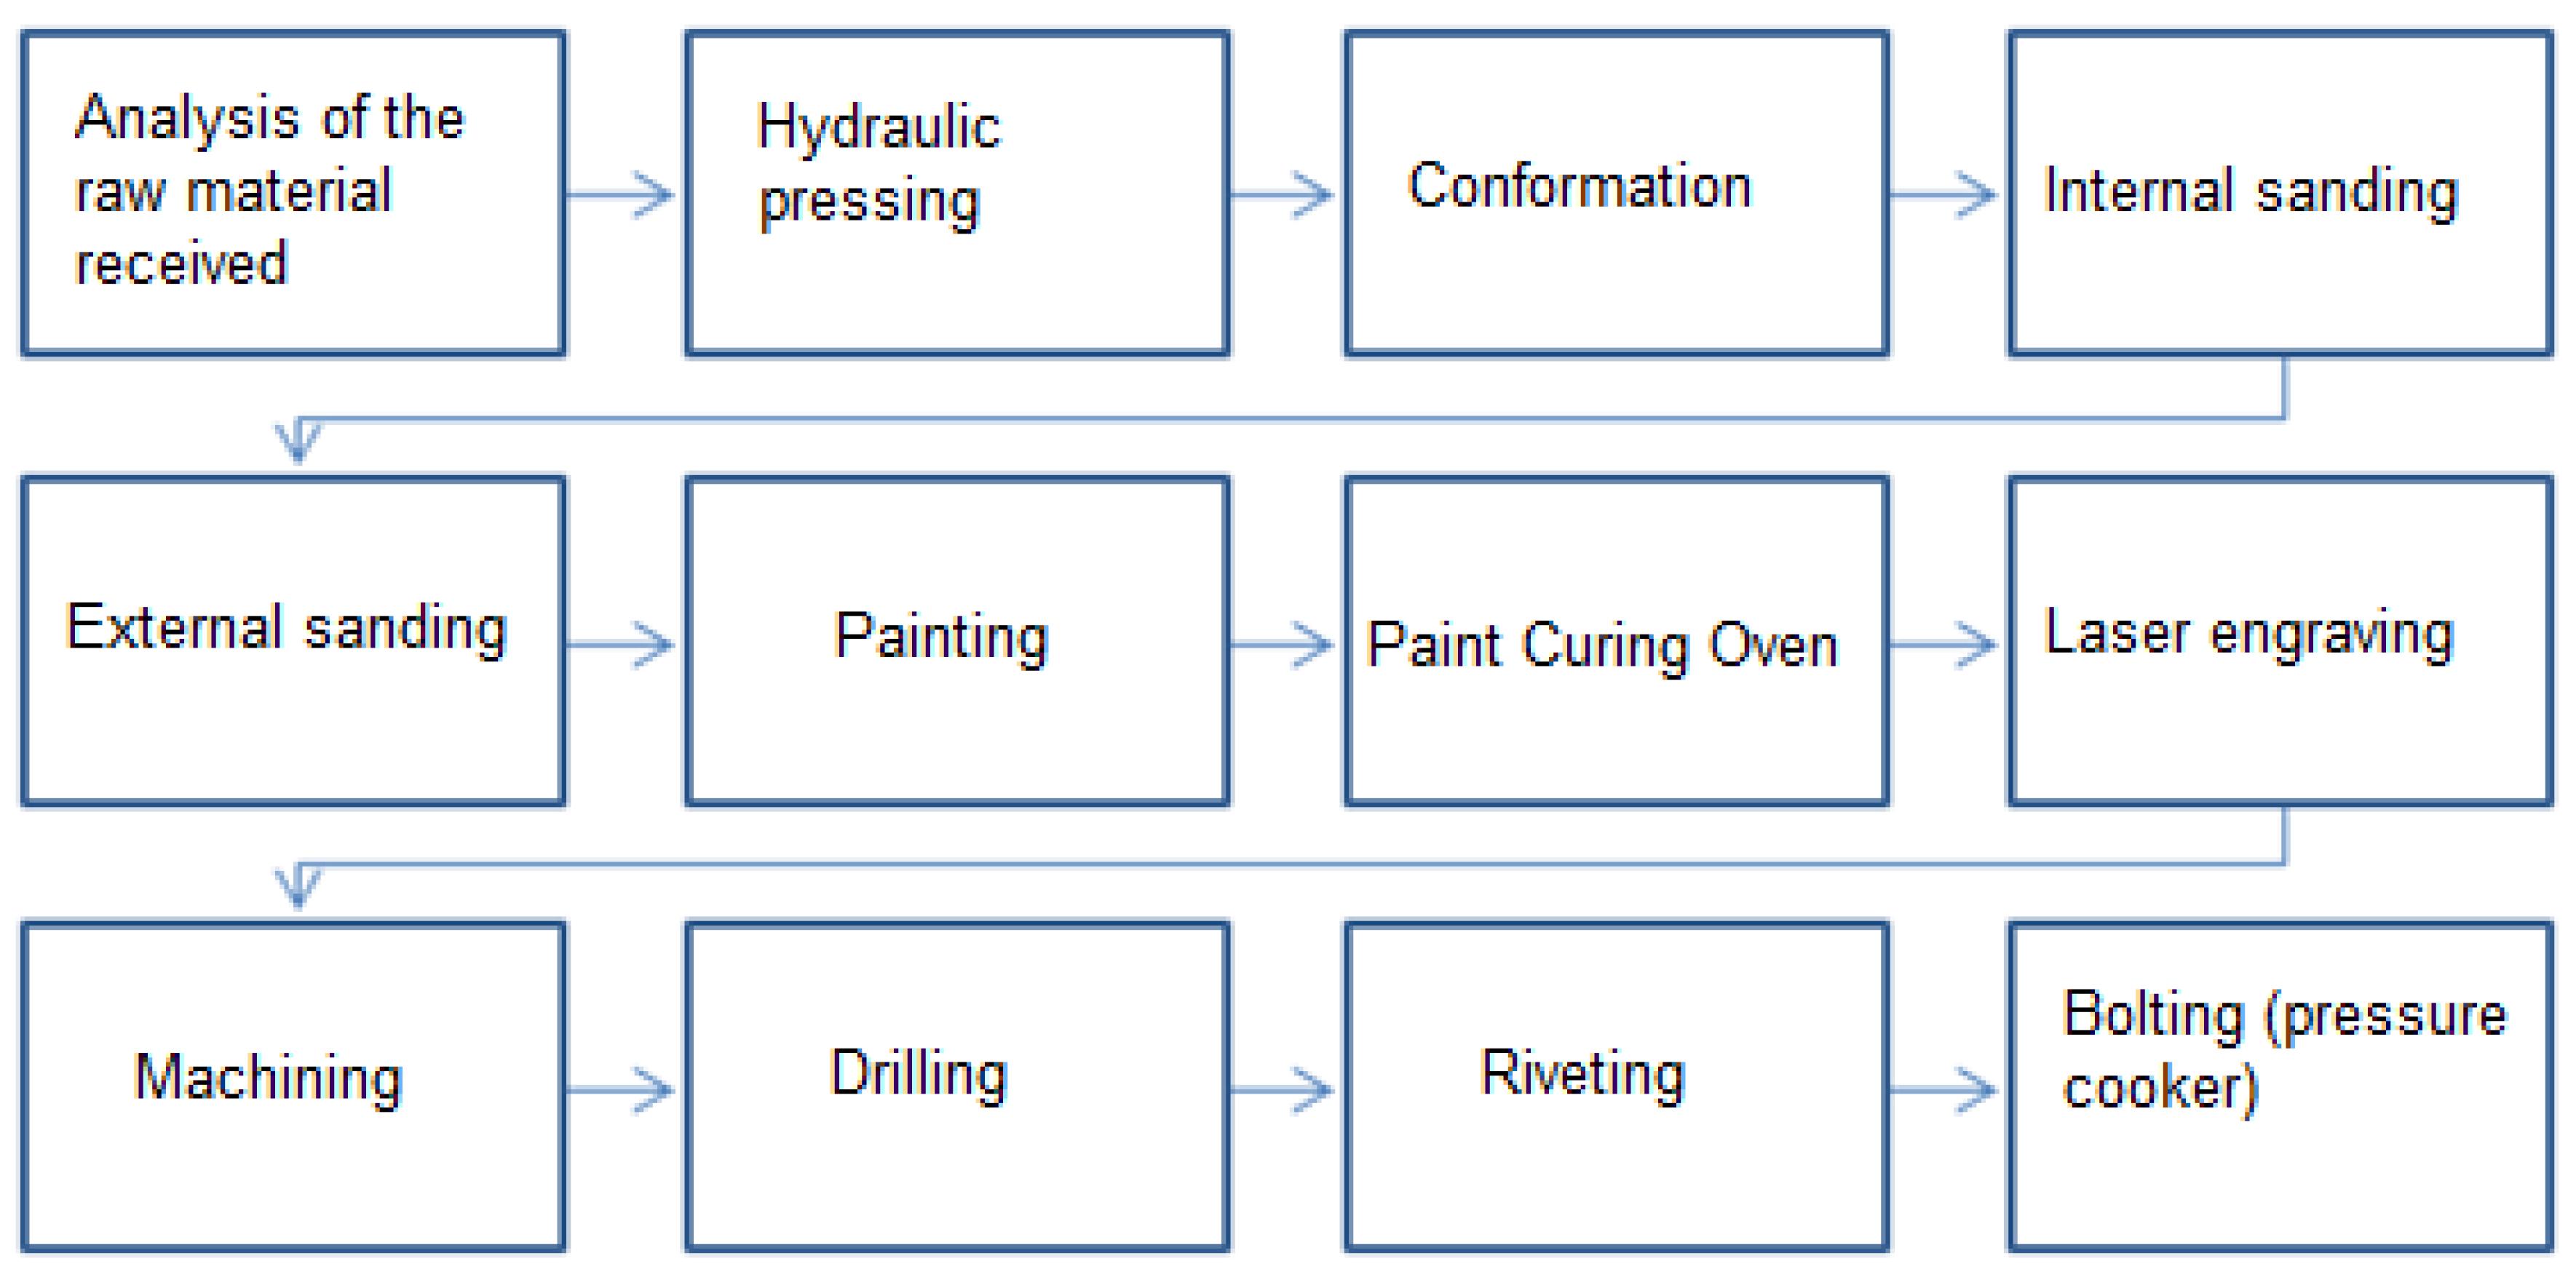
3.1. Characterization of the Company

This is a privately owned, medium-sized exporter located in Brazil, specializing in the production of aluminum pans and utensils. Its production is distributed to the local region as well as to other states across the country and neighboring countries such as Argentina and Paraguay.
As previously mentioned, the metalworking sector is characterized by a high rate of workplace accidents, which directly impact the health and safety of workers in this field. Moreover, there is a need for studies addressing this issue in similar sectors. Recognizing the necessity of improving both processes and worker safety, the company’s management team requested this study. The company operates in the sector of interest and faces challenges related to process adaptation to enhance the quality of professional life for its employees, which motivated the acceptance of the invitation to conduct this study.

Characterization of Functions and Processes

Operators in the company’s manufacturing sector, all of whom are of legal age, are categorized according to their roles: production operator, production assistant, turner, maintenance mechanic, riveter, refiller, and technical designer.
Production operators are involved in the entire manufacturing process of the parts, as shown in Figure 2, while production assistants are assigned tasks that do not directly involve machine operation.
The process begins with the receipt of the raw material, which consists of pre-laminated aluminum discs. These discs are inserted into the hydraulic press to be stamped, acquiring the preliminary shape of a pan, casserole, or lid. This stage typically involves two operators responsible for operating the press.
The second stage involves folding the edge of the casseroles. The stamped aluminum is sent to the forming process.
Once formed, the parts are moved to a sanding process to remove any burrs. The aparts are fixed in a sanding cabin, where sharp edges from the previous process are smoothed and a preliminary finish is applied. This sanding process consists of two stages: internal and external sanding.
The final process involves painting the parts using a thermosetting polymer. After the paint has cured, the parts are sent for cable attachment, packaging, and then shipped according to the order placed.

3.2. Analysis of Work Demands and Postures

The demand analysis conducted in this research aimed to identify workers’ subjective perception of physical demands, efforts, and the work environment. The identification of these factors served as a guideline for understanding issues present in the work environment and for analyzing work accidents. It helped prioritize the factors that most interfere with work performance and worker health, according to the workers’ own perspective.
Table 2 presents the results obtained from the structured sociodemographic questionnaire, based on the adapted National Aeronautics and Space Administration Task Load Index (NASA-TLX) methodology. These results were used to construct the data matrix for the Cluster Analysis, which included questions about the physical environment, the workplace, and personal factors of each operator, such as gender, age, and length of service in the role, among other factors deemed relevant to the study.
The production sector includes most of the tasks performed by operators and is where posture assessment was conducted using the OWAS (Ovako Working Posture Analyzing System). This method was applied to each activity involved in the production process of pots and pans. To this end, photographic images were taken and analyzed, along with on-site observation of the operators’ postures during their respective work activities.

3.3. Work Environment
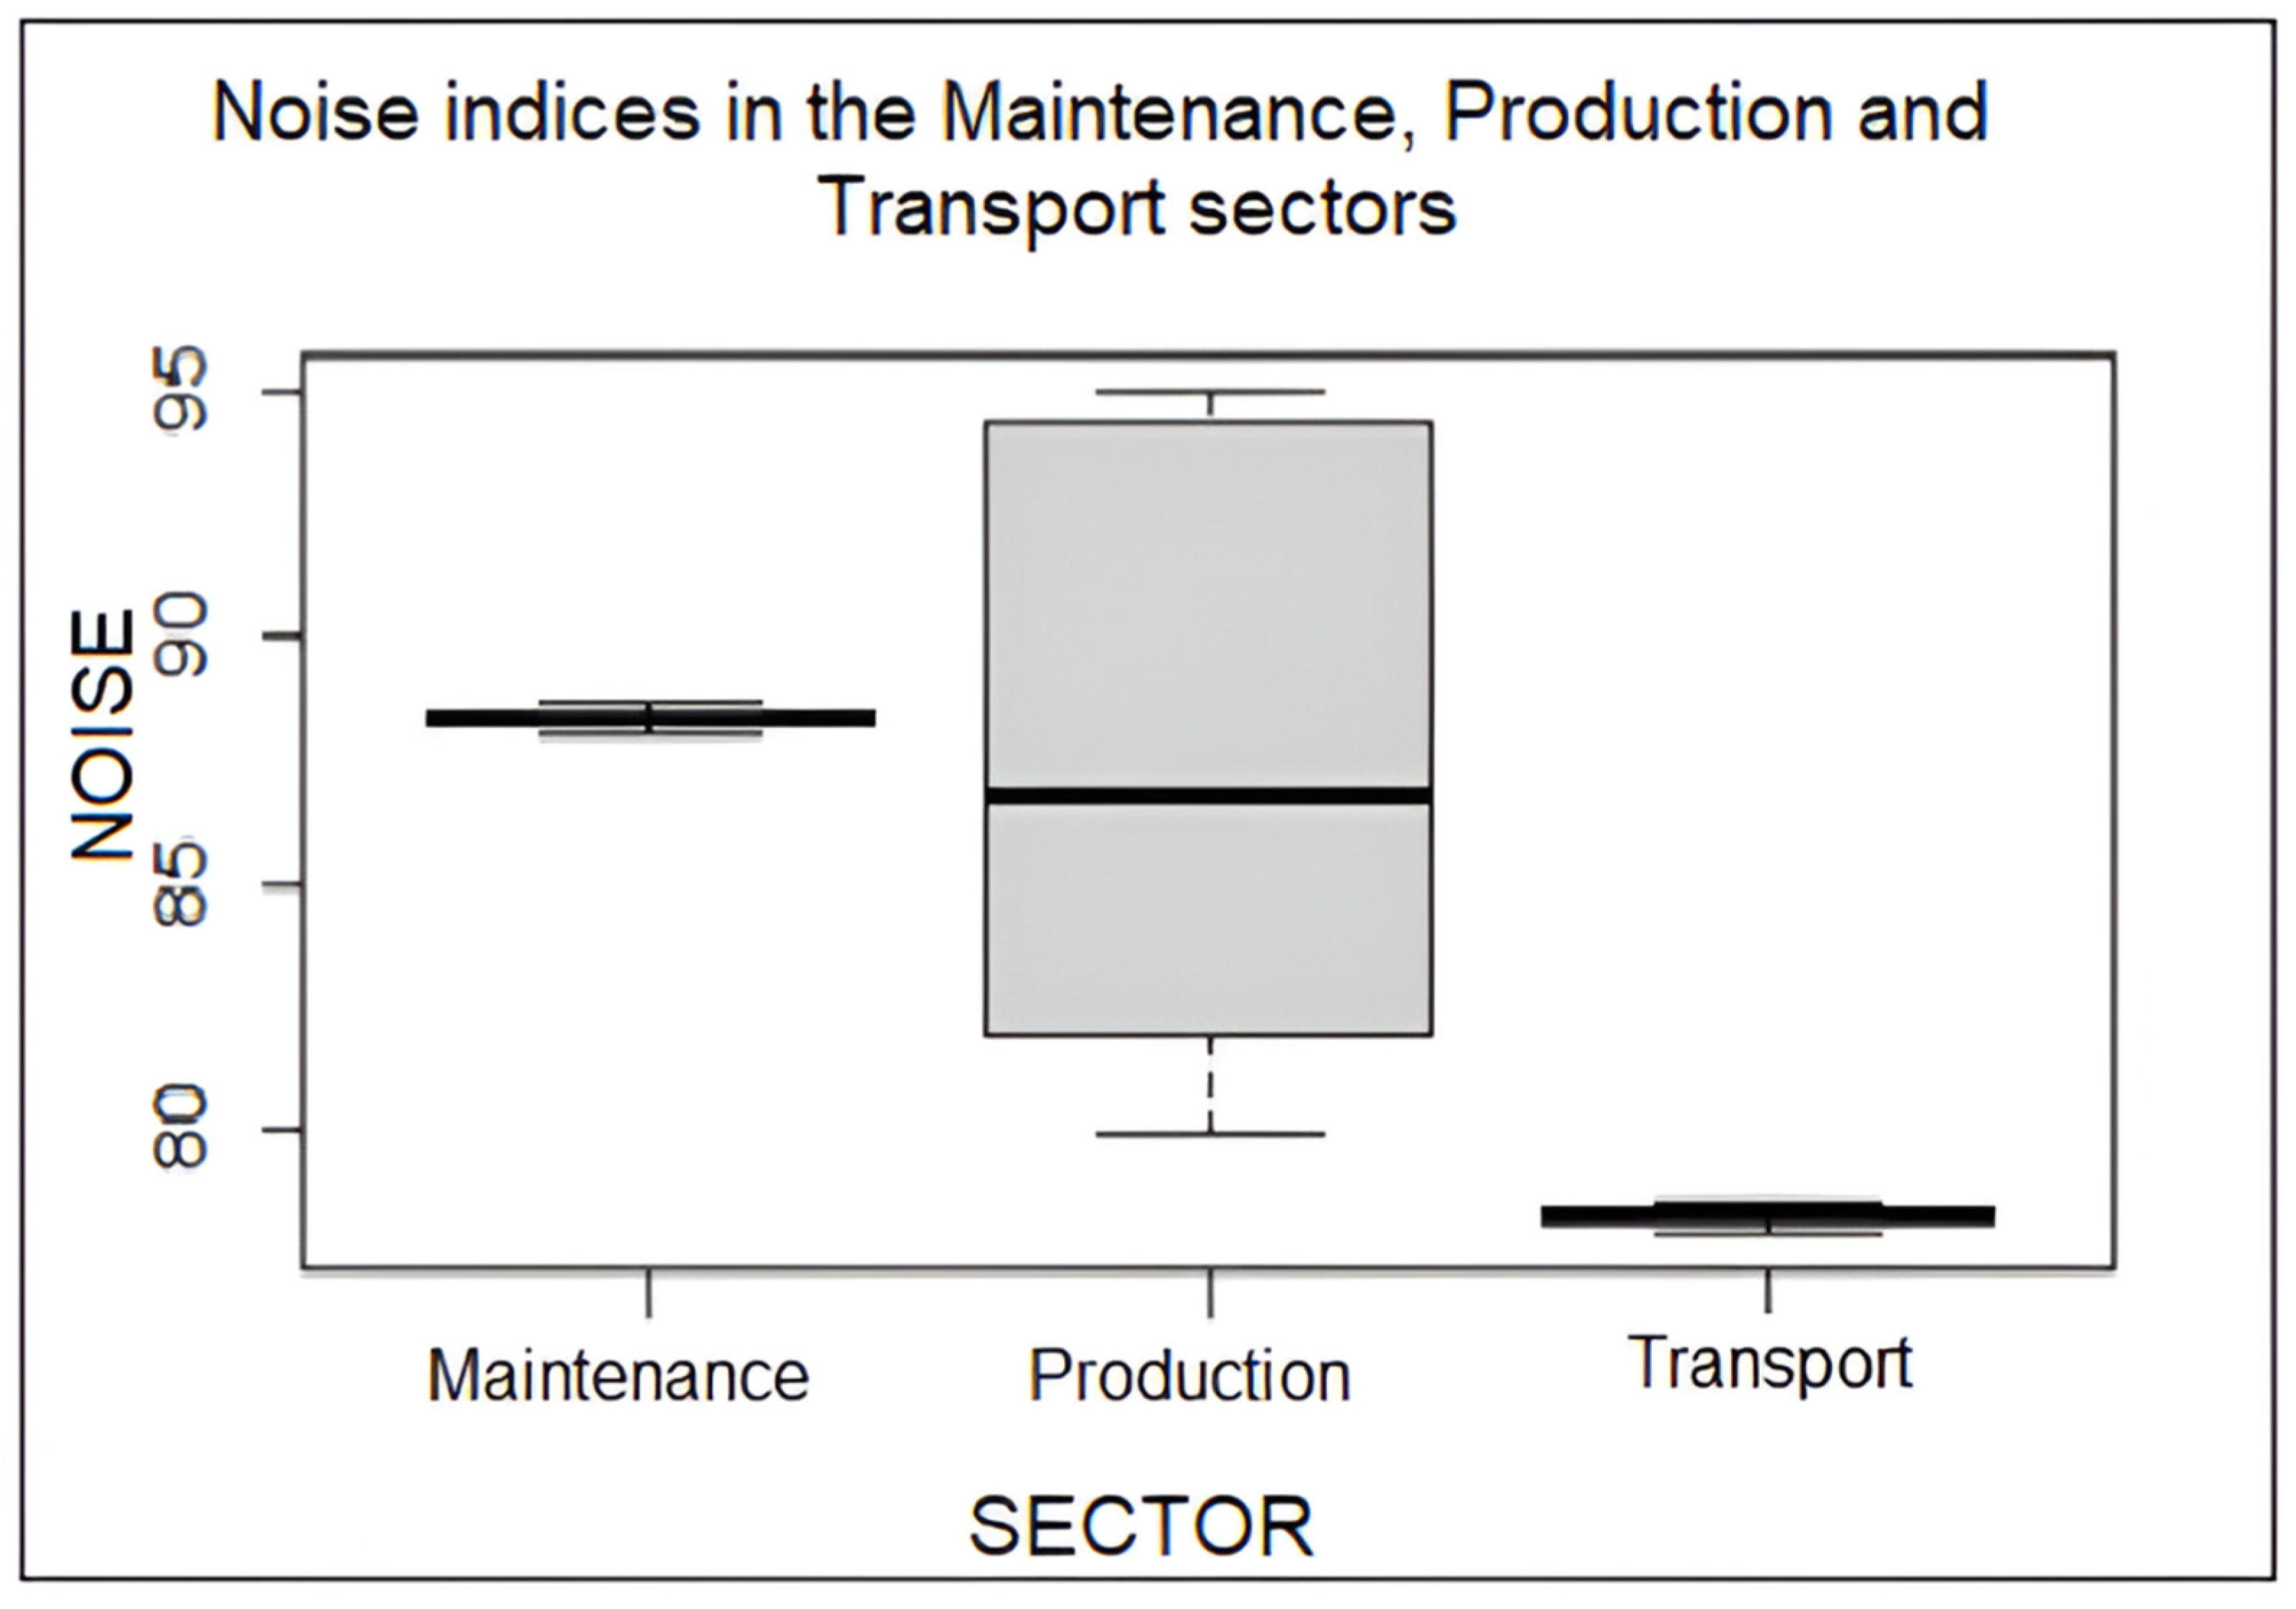
Considering [33], which establishes parameters for adapting working conditions to workers’ psychophysiological characteristics, Table 3 presents its recommended tolerance levels for noise, temperature, and illuminance. These recommendations are provided for each function/workstation and are listed in Table 3 under the ‘recommendation’ column, positioned next to the respective measured values of noise, temperature, and illuminance in the work environment.
Regulatory Standards No. 15 (Annex III) [34] and No. 17 (Annex II) [33] along with Occupational Hygiene Standard No. 11 from Jorge Duprat Figueiredo, of Medicine and Occupational Safety—FUNDACENTRO, created in 1966 to study and research the conditions of work environments and with headquarters in several Brazilian states, define acceptable tolerance limits for human occupation. These standards served as the basis for evaluating the limits observed on the production line of the studied company. To conduct this evaluation, the collected data were analyzed using descriptive and inferential statistical methods. This included calculating the mean and standard deviation for each investigated sector (Table 4). It is notable that the average noise levels in some sectors are higher than in others, mainly because production sectors—such as painting assistant, production assistant, mechanic, production manager, and safety technician—involve metal shaping using specialized equipment, which generates higher decibel levels and, consequently, more noise. In contrast, the average noise levels for truck operators are mitigated by the driver’s cabin. An Analysis of Variance (ANOVA) was also performed to evaluate the noise indices (Table 5). Additionally, for illuminance and temperature indices, simple linear regression and confidence intervals for the means were computed.

3.3.1. Noise

As shown in Table 3, the noise levels measured in the work environment exceed the tolerance limits established by the Regulatory Standards. The sectors under investigation were grouped into three categories: Maintenance, Production, and Transportation. The box plot displays the results obtained from ANOVA for these sectors, and the Tukey’s test was applied to identify differences between the means (Figure 3). The results indicate a significant difference between the groups, with the Transportation sector exhibiting the lowest noise levels, followed by the Maintenance sector, and then the Production sector.
Analysis of the box plot reveals that the Production sector exhibits the largest range between the quartiles, indicating a greater disparity between the lowest and highest values, including the lower and upper limits of the box.
When performing the Analysis of Variance (ANOVA) using the means of the three individual measurements for the noise index on the production line to compare the distribution of the groups, significant differences were found (p-values < 5%), as shown in Table 5 for the average noise levels between the three groups investigated.
To identify which groups exhibited the greatest differences, the Tukey’s test was applied. The Transport sector showed a statistically significant difference compared to both the Maintenance and Production sectors. However, the comparison between the Production and Maintenance sectors was not considered statistically significant, as shown in Table 6.

3.3.2. Temperature

Based on the three temperature measurements taken on the production line (Table 3), statistical analysis was performed to assess the confidence intervals (CIs) of these values. The averages obtained for each sector where measurements were made exceeded the maximum temperature limit recommended by [33] for thermal comfort. It is important to note that Brazil has various climatic regions, with six distinct climate types. This study was conducted in the southern region, where the predominant subtropical climate is characterized by cold winters and hot summers. However, considering the metabolic rate of 243 W for standing work using both arms, the temperature limit recommended by NR15 (Annex III) is 29.2 °C, meaning the temperatures recorded on the production line are within compliance. The confidence intervals were calculated with a 95% significance level, as shown in Table 7.
According to [34], the temperature in a work environment for thermal comfort must be between 20 and 23 degrees Celsius. The confidence intervals indicate that, regardless of the sector investigated, this temperature range is exceeded, with 95% confidence level, accounting for the standard error of the measurements. This suggests that the temperature in the sectors investigated are high, requiring implementation of temperature control measures. These could include exhaust fans or fans or other cooling systems strategically placed along the production line, considering that temperature levels tend to fluctuate depending on the season.

3.3.3. Illuminance

The illuminance indices measured on the production line (Table 3) were subjected to statistical analysis, similar to the temperature indices. Confidence intervals for these data were calculated, as shown in Table 8.
Considering the confidence intervals obtained, which reflect estimates of the ideal value, the only sector that complies with the acceptable illuminance limits, according to [34], is the “safety technician” sector. It is observed that for some sectors, the confidence interval was punctual, therefore, it did not present variation between the limits; this is due to the fact that, even with the sample being random, the illuminance for these sectors was still widely distributed, but not in compliance. The other sectors do not comply with the standard, as they exceed the maximum recommended limits, considering a 95% confidence level. To address this issue and mitigate potential damage to the operators’ eye health, it is recommended to develop a lighting project for the production line and conduct regular inspections to ensure the proper conservation and functioning of the lighting system.

3.4. Result of Statistical Analyzes

3.4.1. Pearson Correlation and Tetrachoric Correlation

To determine which of the variables investigated—namely, gender, age, and length of service (in years), as shown in Table 9—had the strongest relationship with work accidents (referred to as ‘Response’), correlation tests were applied, specifically Pearson correlation and tetrachoric correlation. The sample evaluated consisted of 31 operators from the production sector, labeled ‘p’ in ascending order.
Table 10, represented below, shows the results of the tetrachoric correlation between the number of work accidents (Response) and the operator’s sex, age, and length of service at the company. The analysis demonstrates that there is no significant association between the Response and age or length of service. However, the sex of the operator shows a significant correlation (p-value < 5%) with the number of work accidents. The negative correlation indicates that the incidence of work accidents is higher among men than among women.
Although research conducted in the United States, Sweden, and Canada involving both non-fatal and fatal accidents, cited in the study by [4,27,28], as well as studies by [29] and others in the metal–mechanical sector, suggests that the majority of these accidents occur with younger workers, the results from the study in the researched company indicate a stronger correlation between “Factor 3”, which represents the length of service in years, and the “Response”, consisting of the number of work accidents. This suggests that the greater the experience, the lower the perceived safety when performing the task. In other words, more experienced operators may work in an “automatic” mode, leading to a higher incidence of work accidents on average among those with longer service time.

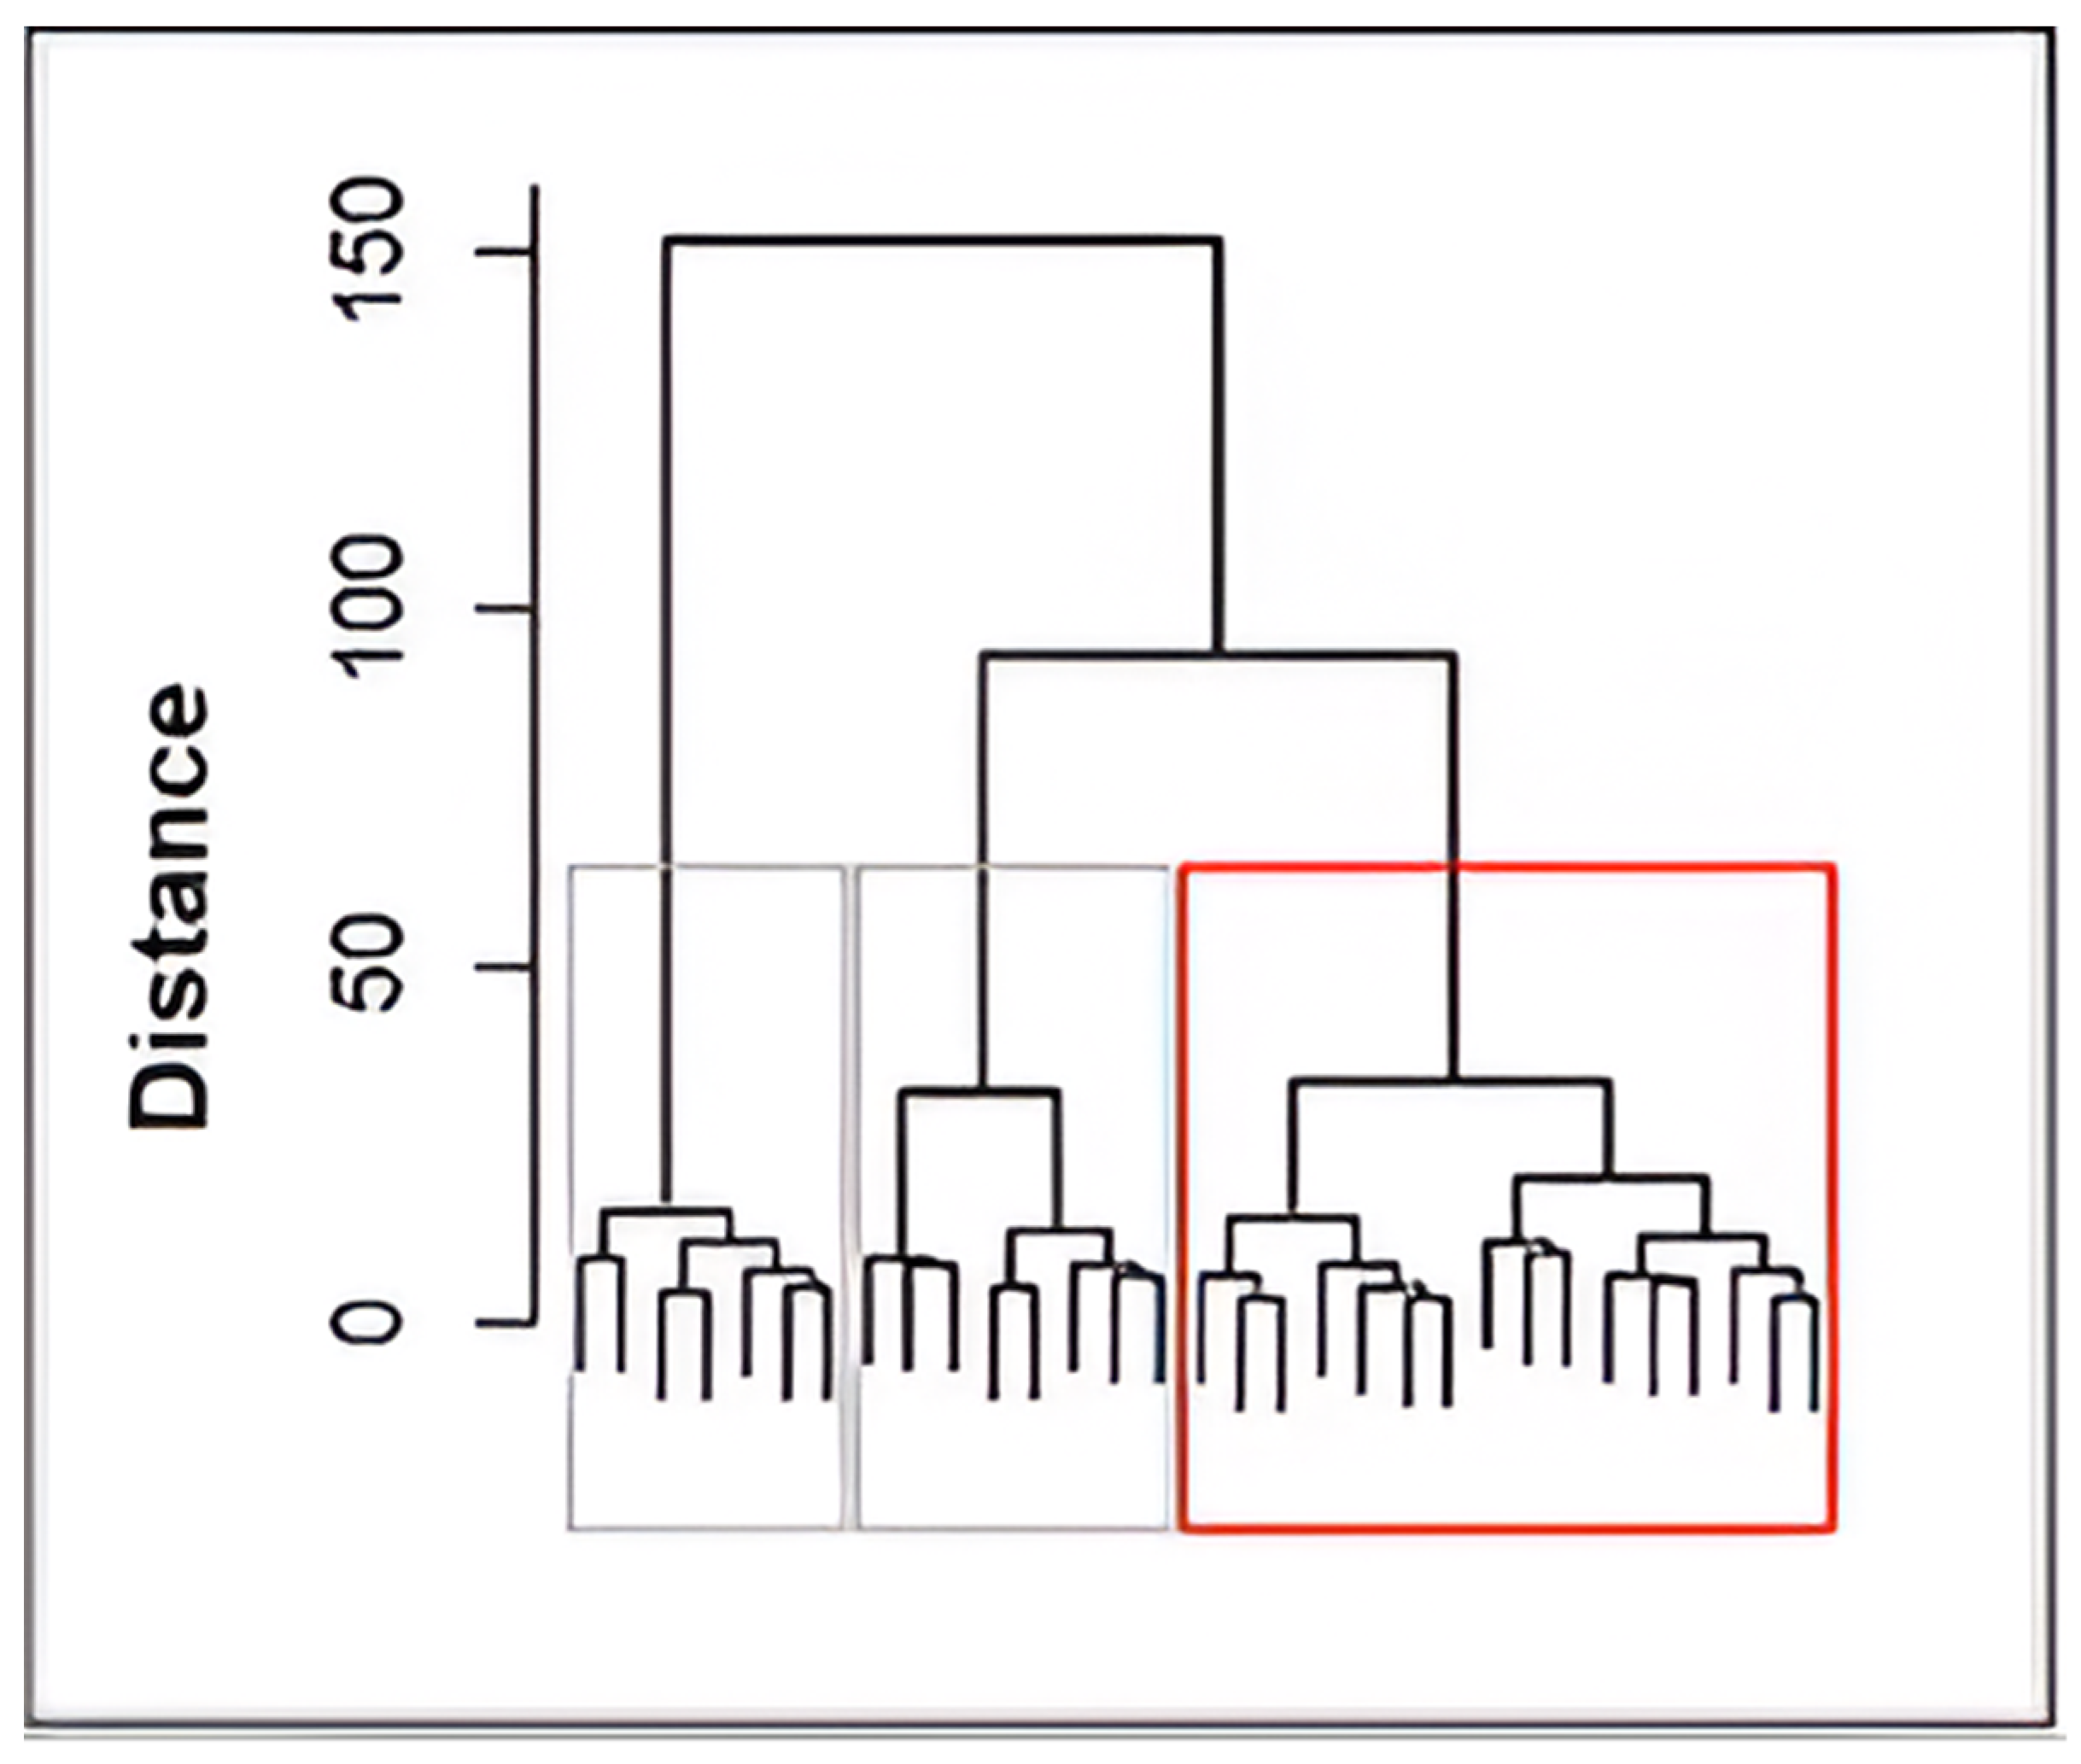
3.4.2. Cluster Analysis

Nine variables related to the work environment and workplace, along with ten personal variables such as gender, age, alcohol consumption, number of machines operated, incidence of work accidents throughout the worker’s life, and pain or discomfort, were analyzed.
The relationships between the variables were analyzed using the Cluster Analysis method, with Euclidean Distance employed to calculate the distance between groups and the Ward method for their linkage. The result showed the following: The first group, composed of individuals 5, 9, 16, 17, 23, 24, and 25, exhibited the following characteristics: individuals aged 18 to 27, with limited work experience. Some of then had already experienced work accidents within the company. They operate several machines weekly, consider noise and dust to hinder their work activities, and find the temperature and air quality in the manufacturing sector unpleasant. Approximately 42% of individuals in this group report experiencing pain or discomfort during their activities in the company.
The second group, composed of individuals 1, 3, 6, 7, 8, 19, 26, and 29, exhibits distinct characteristics compared to the first group. These individuals are older, and none of them reported work accidents. They operate fewer machines per week and believe that noise does not interfere with their work activities. They consider the cleanliness of their workstation to be adequate, but they report that dust in the environment interferes with the execution of their tasks. Approximately 62% of individuals in this group complain of pain or discomfort during their activities at the company.
The third group includes individuals 2, 4, 10, 11, 12, 13, 14, 15, 18, 20, 21, 22, 27, 28, 30, and 31, predominantly young men, and presents the following characteristics: frequent consumption of alcoholic beverages (two or more times per week), a history of at least one work accident in their current role, and longer experience in the position. They report that noise does not interfere with their work activities, and they consider their workstation to be adequate and clean, with sufficient and well-maintained tolls. However, they identify poor air quality, inadequate ventilation, and high environmental temperatures in the manufacturing sector. Additionally, dust is present in the environment, and approximately 50% of individuals in this group report experiencing pain or discomfort during their work activities at the company.
The dendrogram (Figure 4) reinforces the results obtained through tetrachoric correlation, providing a clearer visualization of group formation. This allows for a better understanding of the factors and variables that contributed to the clustering process.
The Cluster Analysis revealed the formation of three distinct groups based on the information provided by research participants Notably, the third group, indicated by the color red, had the highest incidence of workplace accidents and, therefore, was the one that showed the least similarity with the other two groups formed. Contrary to findings from previous studies on this topic, the analysis indicates that operators with greater experience in their roles had a higher occurrence of work accidents. This highlights the need for implementing awareness initiatives aimed at reducing workplace accidents by addressing the identified risk factors
The Euclidean Distance Measure was applied to assess similarities between individuals, and Ward’s hierarchical method was used to form the groups. The results confirm a statistically significant difference between the groups, with Group 3 standing out as the most concerning. This group consists mainly of young men (up to 30 years old) who consume alcoholic beverages at least two to three times a week, reinforcing the ANOVA findings that male workers experience the highest incidence of workplace accidents. The characterization of these groups based on similarity provides a valuable foundation for implementing corrective and awareness measures. While such actions should be applied to all workers, focusing on specific high-risk groups can help identify process flaws and take targeted steps to mitigate or eliminate them, ultimately reducing workplace hazards and discomfort.

4. Final Considerations

The study aimed to identify the demands of the work environment and the factors influencing accidents among workers in the aluminum household utensils industry. The applied instruments provided in-depth and meaningful results, effectively meeting the research objectives. The study successfully collected, analyzed, and interpreted data to identify workplace demands, comparing the findings with existing literature and current Regulatory Standards.
The analysis of workplace accidents revealed a higher incidence among male operators, representing 61% of the total studied. These workers were generally young, had longer service time in their roles, and reported consuming alcoholic beverages at least twice a week. Additionally, some environmental factors were identified as obstacles to their work perfomance, as indicated by the structured sociodemographic questionnaire. Reports of pain during the workday were also significant, with 51.6% of respondents experiencing pain or discomfort while performing their tasks.
An investigation into the work environment, focusing on noise, temperature, and illuminance in the production line, identified several sectors with excessive noise exposure. These include painting assistant, warehouseman, production pointer, warehouse assistant, production assistant, person in charge of the production line, dispatch, production line manager, production operator, and safety technician. Regarding temperature, all sectors of the production line recorded high values, exceeding thermal comfort standards. As for illuminance, the only one in compliance with the current Regulatory Standard is the safety technician sector, while all other sectors require adjustments to meet the recommended lighting levels.
In the analysis of postures, all verified photographic images underwent postural risk assessment. Overall, they were classified as category 1, indicating no immediate need for correction or significant health risks. However, the Forming and Boxing activities were classified as category 2 and 3, respectively, according to the coding obtained through the application of the OWAS (Ovako Working Posture Analyzing System), signaling the need for further attention and potential ergonomic adjustments.
This study demonstrated, through the application of the stipulated methodology, that it is possible to identify potential failure points in the production process, factors that may contribute to or cause physical constraints for workers and even lead to work-related accidents. Additionally, the study provided an opportunity to understand the work environment from the operator’s perspective and to analyze the incidence of pain and discomfort through a self-perceived diagnosis. This diagnosis was obtained via the structured sociodemographic questionnaire, based on the National Aeronautics and Space Administration Task Load Index (NASA-TLX) methodology.
The bibliographic findings of this study indicate that there are still few investigations addressing work accidents in the metal–mechanical sector, specifically in the production of aluminum household utensils. Additionally, some of the existing studies do not detail the analysis methods used, making replication in similar contexts challenging and highlighting a research gap. However, the literature emphasizes the significant impact of work accidents on workers’ health and quality of life. Moreover, some studies highlight the financial burden these incidents impose on companies and the Social Security System, reinforcing the importance of seeking relevant information to contribute to existing research.
As a result of this study, several adaptation measures are proposed with the aim of improving workers’ quality of life in the workplace. These include the implementation of mandatory training programs focused on safety during work activities, adjustments to temperature and illuminance at identified problematic points, and periodic noise level measurements. Additionally, it is recommended that personal protective equipment, such as sound dampers, be provided to workers. Finally, the establishment of an Internal Accident Prevention Commission (CIPA) is suggested to further enhance safety and prevent accidents in the workplace.
Throughout the study, it became evident that the workers were receptive to the suggested improvements, even when these implied changes to their work routine or modifications to processes they were accustomed to. Notably, 100% of the sample expressed willingness to participate, and the company fully supported the data collection process, allowing us to gather all the necessary information to conduct the study in the most effective manner. This openness to change and collaboration significantly contributed to the study’s success.
The results revealed some gaps, namely, the care taken with equipment maintenance and the occupational safety of operators were not entirely clear. The information obtained and statistically processed regarding the work environment was collected from operators at the time of the structured sociodemographic questionnaire application, as few documents were available regarding recording equipment maintenance or Workplace Accident Reports. Care for operators who suffered work accidents was often provided on-site, with hospital treatment being sought only in more severe cases, such as crushed limbs or deep cuts. The company was advised on the appropriate procedures to follow in such situations.
It is worth mentioning that this industry is just one of many in this sector in Brazil. Although it is a medium-sized company, its commitment to proper processes, prioritization of employee health and safety, and provision of opportunities for improvement and training position it as a suitable work environment. This, in turn, attracts workers and encourages other companies in the sector to adopt similar practices.
Several opportunities for future research were also offered, namely, (i) Conducting similar studies in companies with similar profiles would enable the comparison of results and provide more accurate conclusions. A potential area for improvement would be to evaluate the correlation between work accidents and the regular consumption of alcoholic beverages; (ii) Investigating other factors that may contribute to or influence the incidence of work accidents, pain, or physical constraints during or after work activity could provide a deeper understanding of the underlying causes; (iii) Implementing and testing corrective measures based on the diagnosis provided by workers in the manufacturing sector and assessing how these measures would impact work performance could offer valuable insights into the effectiveness of intervention strategies; (iv) Exploring in greater depth which age group is most affected by work accidents in industries and identifying the possible causes; (v) Examining mental load and its impact on workers’ ability to perform work tasks, which could provide additional insights into improving overall occupational health and performance.

Author Contributions

Conceptualization M.F.M.; methodology M.F.M., S.L.R.P., S.R.O. and V.S.; validation, A.A.d.P.X. and M.S.d.O.; investigation, M.F.M.; resources, M.F.M.; data curation, M.F.M.; writing—original draft preparation, M.F.M., S.L.R.P. and A.A.d.P.X.; writing—review and editing, V.S., S.R.O. and A.A.d.P.X.; supervision, A.A.d.P.X.; project administration, M.F.M.; funding acquisition, M.F.M. and V.S. All authors have read and agreed to the published version of the manuscript.

Funding

This research received no external funding.

Institutional Review Board Statement

The study was submitted to the Ethics and Research Committee (COEP) at the Federal Technological University of Paraná (UTFPR); it was approved by COEP and registered under protocol number (CAEE) 30826420.1.0000.5547 for studies involving humans.

Informed Consent Statement

Informed consent was obtained from all subjects involved in the study.

Data Availability Statement

The consent of the participants in this research was validated by the ethics committee of the Federal Technological University—Paraná, and is under ethics approval protocol number 30826420.1.0000.5547. The other data generated by carrying out this research are the responsibility of the main author and may be requested at any time via email.

Acknowledgments

We sincerely thank the workers who participated in this study for their willingness to participate in this research. Their contributions were invaluable to the findings of this study.

Conflicts of Interest

The authors declare no conflicts of interest.

References

  1. Bauerle, T.J.; McGonagle, A.K.; Magley, V.J. Mere overrepresentation? Using cross-occupational injury and job analysis data to explain men’s risk for workplace fatalities. Saf. Sci. 2016, 83, 102–113. [Google Scholar]
  2. Åkerstedt, T.; Wright, K.P. Sleep loss and fatigue in shift work and shift work disorder. Sleep Med. Clin. 2009, 4, 257–271. [Google Scholar]
  3. Ince, H.; İnce, N.; Ozyildirim, B.A. Occupational accidents and forensic medicine in Turkey. J. Clin. Forensic Med. 2006, 13, 326–330. [Google Scholar] [CrossRef] [PubMed]
  4. Ribeiro, F.H.; Hermosilla, J.L.G.; Achcar, J.A.; da Silva, E.C.C. Work accidents and their association with the factors of age and length of experience of the worker: A documentary research based on the SINAN system registry. In Proceedings of the XXXV National Meeting on Production Engineering: Global Perspectives for Production Engineering, Odessa, Ukraine, 10–12 August 2018. [Google Scholar]
  5. Fischer, F.M.; Borges, F.N.d.S.; Rotenberg, L.; Latorre, M.d.R.D.d.O.; Soares, N.S.; Rosa, P.L.F.S.; Nagai, R.; Landsbergis, P. Work (in)ability in nursing workers. Braz. J. Occup. Med. 2005, 3, 97–103. [Google Scholar]
  6. El Fassi, M.; Bocquet, V.; Majery, N.; Lair, M.L.; Couffignal, S.; Mairiaux, P. Work ability assessment in a worker population: Comparison and determinants of Work Ability Index and Work Ability score. BMC Public Health 2013, 13, 305. [Google Scholar] [CrossRef]
  7. Klasan, A.; Madzarac, G.; Milosevic, M.; Mustajbegovic, J.; Keleuva, S. Predictors of lower work ability among emergency medicine employees: The Croatian experience. Emerg. Med. J. 2013, 30, 275–279. [Google Scholar] [CrossRef] [PubMed]
  8. Cagno, E.; Micheli, G.J.L.; Perotti, S. Identification of OHS-related factors and interactions among those and OHS performances in SMEs. Saf. Sci. 2011, 49, 216–225. [Google Scholar] [CrossRef]
  9. International Labour Organization (ILO). 112th International Labour Conference. Geneva, Switzerland, 3–14 June 2024. Available online: https://www.ilo.org/resource/news/ilc/112/ilo-hold-its-112th-annual-international-labour-conference (accessed on 5 November 2024).
  10. Wang, B.; Wu, C.; Huang, L.; Zhang, L.; Kang, L.; Gao, K. Prevention and control of major accidents (MAs) and particularly serious accidents (PSAs) in the industrial domain in China: Current status, recent efforts, and future prospects. Process Saf. Environ. Prot. 2018, 117, 254–266. [Google Scholar] [CrossRef]
  11. Chau, N.; Predine, R.; Benamghar, L.; Michaely, J.P.; Choquet, M.; Predine, E. Determinants of school injury proneness in adolescents: A prospective study. Public Health 2008, 122, 801–808. [Google Scholar] [CrossRef]
  12. Salminen, S. Have young workers more injuries than older ones? An international literature review. J. Saf. Res. 2004, 35, 513–521. [Google Scholar] [CrossRef]
  13. Reniers, G.; Gidron, Y. Do cultural dimensions predict prevalence of fatal work injuries in Europe? Saf. Sci. 2013, 58, 76–80. [Google Scholar] [CrossRef]
  14. Carrillo-Castrillo, J.A.; Rubio-Romero, J.C.; Onieva, L.; López-Arquillos, A. The causes of severe accidents in the Andalusian manufacturing sector: The role of human factors in official accident investigations. Hum. Factors Ergon. Manuf. Serv. Ind. 2016, 26, 68–83. [Google Scholar] [CrossRef]
  15. Cheng, C.-W.; Leu, S.-S.; Lin, C.-C.; Fan, C. Characteristic analysis of occupational accidents at small construction enterprises. Saf. Sci. 2010, 48, 698–707. [Google Scholar]
  16. Chang, D.-S.; Tsai, Y.-C. Investigating the long-term change of injury pattern on severity, accident types, and sources of injury in Taiwan’s manufacturing sector between 1996 and 2012. Saf. Sci. 2014, 68, 231–242. [Google Scholar]
  17. Camino López, M.A.; Ritzel, D.O.; Fontaneda, I.; González Alcantara, O.J. Construction industry accidents in Spain. J. Saf. Res. 2008, 39, 497–507. [Google Scholar] [CrossRef]
  18. López Arquillos, A.; Rubio Romero, J.C.; Gibb, A. Analysis of construction accidents in Spain, 2003–2008. J. Saf. Res. 2012, 43, 381–388. [Google Scholar]
  19. Zhang, J.J.; Xu, K.L.; Reniers, G.; You, G. Statistical analysis of the characteristics of extraordinarily severe coal mine accidents (ESCMAs) in China from 1950 to 2018. Process Saf. Environ. Prot. 2020, 133, 332–340. [Google Scholar]
  20. Iida, I.; Guimarães, L.B.M. Ergonomics: Design and Production, 3rd ed.; Blucher: São Paulo, Brazil, 2016. [Google Scholar]
  21. International Labour Organization (ILO). ILO Centenary Declaration for the Future of Work. 2019. Available online: https://www.ilo.org/about-ilo/mission-and-impact-ilo/ilo-centenary-declaration-future-work-2019 (accessed on 5 November 2024).
  22. Santana, V.; Nobre, L.; Waldvogel, B.C. Occupational accidents in Brazil between 1994 and 2004: A review. Sci. Public Health 2005, 10, 841–855. [Google Scholar]
  23. Altunkaynak, B. A statistical study of occupational accidents in the manufacturing industry in Turkey. Int. J. Ind. Ergon. 2018, 66, 101–109. [Google Scholar] [CrossRef]
  24. Nenonen, S. Fatal workplace accidents in outsourced operations in the manufacturing industry. Saf. Sci. 2011, 49, 1394–1403. [Google Scholar]
  25. Hedlund, F.H. Recorded fatal and permanently disabling injuries in South African manufacturing industry—Overview, analysis and reflection. Saf. Sci. 2013, 55, 149–159. [Google Scholar]
  26. Díaz Aramburu, C.; de la Orden Rivera, M.V.; Zimmermann Verdejo, M. Actividades Económicas Con Mayor Siniestralidad, Penosidad y Peligrosidad: Sector de la Construcción; Departamento de Investigación e Información: Madrid, Spain, 2010. [Google Scholar]
  27. Adão, N.M.L.; Dias, K.P. Green economy and the challenges of the metalworking sector. E-TECHJ. Technol. Ind. Compet. 2012, 1–13. [Google Scholar] [CrossRef]
  28. Veiga, R.A.R.; Xavier, E.A.; Lenzi, F.C. Uma análise do processo produtivo e das condições ergonômicas do trabalho na Mefaro Indústria Metalmecânica. Rev. Ciênc. Exatas Tecnol. 2012, 7, 97–106. [Google Scholar]
  29. Fernandes, R.C.P.; Assunção, A.A.; Carvalho, F.M. Changes in industrial production methods and workers’ health. Sci. Public Health 2010, 15, 2143–2151. [Google Scholar]
  30. Liberati, A.; Altman, D.G.; Tetzlaff, J.; Mulrow, C.; Gotzsche, P.C.; Ioannidis, J.P.A.; Clarke, M.; Devereaux, P.J.; Kleijnen, J.; Moher, D. The PRISMA statement for reporting systematic reviews and meta-analyses of studies that evaluate healthcare interventions: Explanation and elaboration. BMJ 2009, 339, b2700. [Google Scholar] [CrossRef]
  31. Corlett, E.N.; Manenica, I. The evaluation of posture and its effects. In Evaluation of Human Work: A Practical Ergonomics Methodology; Wilson, J.R., Corlett, E.N., Eds.; Taylor & Francis: Abingdon, UK, 1995; pp. 1–10. [Google Scholar]
  32. Ministry of Labor. Regulatory Standard 17—Ergonomics. 2022. Available online: https://www.gov.br/trabalho-e-emprego/pt-br/acesso-a-informacao/participacao-social/conselhos-e-orgaos-colegiados/comissao-tripartite-partitaria-permanente/normas-regulamentadora/normas-regulamentadoras-vigentes/norma-regulamentadora-no-17-nr-17 (accessed on 20 July 2024).
  33. Ministry of Labor. Regulatory Standard 15—Unhealthy Activities. 2021. Available online: https://www.gov.br/trabalho-e-emprego/pt-br/acesso-a-informacao/participacao-social/conselhos-e-orgaos-colegiados/comissao-tripartite-partitaria-permanente/normas-regulamentadora/normas-regulamentadoras-vigentes/norma-regulamentadora-no-15-nr-15 (accessed on 20 July 2024).
  34. Fundacentro. NHO 06—Assessment of Occupational Exposure to Heat. 2017. Available online: https://apisobrecarga.fundacentro.gov.br/doc/NHO06.pdf (accessed on 2 August 2024).
  35. Fundacentro. NHO 11—Assessment of Lighting Levels in Indoor Work Environments. 2024. Available online: https://www.gov.br/fundacentro/pt-br/centrais-de-conteudo/biblioteca/nhos (accessed on 2 August 2024).
Figure 1. Flow diagram used for selecting studies for the theoretical foundation.
Safety 11 00030 g001
Figure 2. Manufacturing process of aluminum parts.
Safety 11 00030 g002
Figure 3. ANOVA box plot for noise indices in the investigated groups.
Safety 11 00030 g003
Figure 4. Formation of groups of individuals according to Euclidean Distance and Ward’s method.
Safety 11 00030 g004
Table 1. Combinations of keywords and the number of studies found per database.
Number of Publications
KeywordsScopusWeb of ScienceScience DirectPubMed
“metal industry” AND “work accidents”70295
self-perception at work AND “work accidents”764805
physical pain and “accidents at work” AND “industry”0040
“work environment” AND “work accidents”1373948921
accident statistics AND metal sector AND “occupational diseases”403047
Total15545130638
Table 2. Validated data from the sociodemographic questionnaire.
SexAge (Years)Company Times (Years)FunctionNumber of Accidents in the Company
Female345Production assistant0
Female350.6Production assistant0
Female213Production assistant0
Female432Production assistant0
Female180.6Production assistant0
Female408Production assistant0
Female264Production assistant0
Female469Production assistant0
Male544Machine operater1
Male230.8Machine operater0
Male250.5Machine operater0
Female415Machine operater0
Male275Machine operater0
Male283Machine operater1
Male256Machine operater2
Male240.2Machine operater0
Female293Machine operater0
Male230.3Machine operater1
Male180.6Machine operater2
Male190.1Machine operater0
Male190.7Machine operater1
Male216Machine operater0
Male337Machine operater2
Male223Machine operater0
Male233Maintenance supervisor0
Female469Production assistant0
Female243Production assistant0
Female180.6Production assistant0
Male336Electrical technician1
Male285Mechanic1
Male285CNC lathe mechanic/operator0
Table 3. Average noise index, temperature, and illuminance measurements on the production line compared to the maximum recommended levels.
FunctionNoise (dB)Recommended Maximum dBTemperature (°C)Recommended Maximum
(°C)
Illuminance (lux)Recommend-ed Maximum
(lux)
CNC machining machine operator88.38526.220–23700500
Maintenance Assistant88.38525.720–23430300
Electromechanics88.3852420–23430300
Industrial mechanic88.3852420–23430300
Painting helper94.7852720–23800750
Organizer89.48524.520–23350200
Production pointer81.18524.520–23350300
Production assistant94.78524.120–23400300
Responsible for the production line86.1852420–23350300
Expedition87.9852420–23458300
Production manager81.28524.220–23350300
Production operator94.78524.820–23400300
Production supervisor81.28524.520–23350300
Security technician86.78524.320–23473500
Driver78.2852520–23458300
Truck driver78.2852520–23458300
Warehouse assistant84.98524.520–23350200
Table 4. Results of the mean and standard deviation calculations for the values obtained from the three noise index measurements.
FunctionAverage (dB)Standard Deviation (dB)FunctionAverage (dB)Standard Deviation (dB)
CNC machining machine operator8.80.1In charge of the production line86.10.2
Maintenance assistant8.80.3Expedition8.70.1
Electromechanics8.80.0Production manager8.10.2
Industrial mechanic88.30.1Production operator94.70.3
Painting helper94.70.1Production supervisor81.21.1
Warehouse8.90.2Security technician86.70.1
Production pointer8.10.2Driver7.80.3
Warehouse assistant8.40.3Truck driver7.80.3
Production assistant94.70.07---
Table 5. ANOVA results for the noise index.
Source of VariationDegrees of FreedomSum of SquaresMean SquareFp-Value
Sector2259.9129.96.70.0
Residual45869.119.3--
Table 6. Tukey’s test results for the groups investigated.
SectorsDifference Between MeansLower LimitUpper Limitp-Value
Production—
Maintenance
−0.7−4.32.80.8
Transport—
Maintenance
−10.0−16−3.20.0
Transport—
Production
−9.3−15.7−2.80.0
Table 7. Confidence intervals for the values obtained in the three temperature index measurements on the production line.
FunctionConfidence Interval for Temperature (°C)
CNC machining machine operator25.7–26.6
Maintenance Assistant25.6–25.9
Electromechanical23.7–24.3
Industrial mechanic23.6–24.4
Painting helper26.4–27.7
Warehouse23.2–25.8
Production pointer23.2–25.8
Warehouse assistant23.2–25.8
Production assistant23.7–24.5
In charge of the production line23.6–24.4
Expedition23.3–24.7
Production manager23.5–24.8
Production operator23.8–25.7
Production supervisor24.4–24.7
Security technician24.1–24.4
Driver24.5–25.6
Truck driver24.5–25.6
Table 8. Confidence intervals for the values obtained in three of the illuminance index measurements on the production line.
FunctionConfidence Interval for Illuminance (LUX)
CNC machining machine operator697.5–702.4
Maintenance assistant426.6–434.5
Electromechanical425.0–434.9
Industrial mechanic425.0–434.9
Painting helper799.1–801.7
Warehouse350.0–350.0
Production pointer350.0–350.0
Warehouse assistant350.0–350.0
Production assistant398.0–401.5
In charge of the production line349.8–350.2
Expedition454.7–463.1
Production manager350.0–350.0
Production operator399.3–401.1
Production supervisor349.2–351.1
Security technician466.7–479.2
Driver457.5–458.4
Truck driver457.5–458.4
Table 9. Variables analyzed.
IndividualSexAgeTime in the Role (Years)RIndividualSexAgeTime in the Role (Years)R
p104890p170240.160
p2134150p1812130
p3054110p1914320
p40230.60p2012930
p51250.40p2111860
p61350.50p220230.251
p71350.50p230180.52
p81410.410p240190.830
p902751p250190.581
p1002821p2614050
p1102310p2703260
p1202831p2812640
p1302850p2914690
p1403361p3003372
p1502230p3112430
p1602562-----
Table 10. Results of the tetrachoric correlation obtained from the analysis of the variables.
AssociationStudent TestDegrees of Freedomp-ValueConfidence IntervalsCorrelation
Answer—Factor 1−31.1290.004−0.7–0.1−0.5
Answer—Factor 2−1.4290.166−0.5–0.1−0.2
Answer—Factor 3−0.5290.875−0.3–0.3−0.0
Disclaimer/Publisher’s Note: The statements, opinions and data contained in all publications are solely those of the individual author(s) and contributor(s) and not of MDPI and/or the editor(s). MDPI and/or the editor(s) disclaim responsibility for any injury to people or property resulting from any ideas, methods, instructions or products referred to in the content.

