Abstract
Lithium metal battery (LMB) has the potential to be the next-generation battery system because of its high theoretical energy density. However, defects known as dendrites are formed by heterogeneous lithium (Li) plating, which hinders the development and utilization of LMBs. Non-destructive techniques to observe the dendrite morphology often use X-ray computed tomography (XCT) to provide cross-sectional views. To retrieve three-dimensional structures inside a battery, image segmentation becomes essential to quantitatively analyze XCT images. This work proposes a new semantic segmentation approach using a transformer-based neural network called TransforCNN that is capable of segmenting out dendrites from XCT data. In addition, we compare the performance of the proposed TransforCNN with three other algorithms, U-Net, Y-Net, and E-Net, consisting of an ensemble network model for XCT analysis. Our results show the advantages of using TransforCNN when evaluating over-segmentation metrics, such as mean intersection over union (mIoU) and mean Dice similarity coefficient (mDSC), as well as through several qualitatively comparative visualizations.
1. Introduction
Lithium metal batteries (LMBs) offer high specific energy density as Li is a light element. Furthermore, the liquid electrolyte is not needed in LMBs and polymer or ceramic electrolytes can be used, which are inherently more safe compared to organic electrolytes. However, currently, no commercially available LMB systems exist because of Li dendrite formation resulting from inhomogeneous Li metal plating. This section describes the current methods for imaging batteries, followed by a review of the main algorithms for image analysis, semantic segmentation, and battery characterization.
1.1. Assessing Battery Quality with Imaging
Synchrotron-based hard X-ray computed tomography (XCT) has spatial resolution suitable to resolve dendrite structures that have microscale dimensions [1,2]. Lithium has a low atomic number and, therefore, a low X-ray attenuation. For example, Li dendrites will appear to be void spaces within dense polymer electrolyte materials. XCT imaging of LMB seldom recovers chemical information and relies on differences in material thicknesses and atomic numbers to differentiate Li from solid polymer electrolytes (SPE). To worsen the detection of LMB dendrites, they are porous formations that lead to large intensity variations within their volume. When the LMB is subjected to multiple charge–discharge cycles, a phenomenon known as pitting corrosion develops, and an electrode can present a combination of pits and dendrites, with both presenting similar X-ray attenuation in XCT data. Thus, it is challenging to differentiate dendrites from pits but also to quantify them properly.
Previous LMB operando studies using XCT analyzed Li metal plating and how the interphase evolves in symmetric Li–Li cells with polymer electrolytes and in the batteries with Li metal anode [2,3,4,5,6]. These studies focused on the battery design and functioning; however, they lack methods for revealing the structure of the dendrites. Most of these previous studies applied traditional thresholding algorithms to conduct segmentation, which is, unfortunately, not reproducible when applied to new samples and rarely applicable to the differentiation between Li metal, pits, and other materials. Alternatively, manual segmentation could be used for a selected cross-section, but it is often unfeasible for full-stack high-resolution imaging surveillance because it is a highly time- and labor-intensive process [7].
1.2. Deep Learning for Semantic Segmentation
Semantic segmentation is the computer vision task of splitting an image into different categories [8] using a data-driven model to assign a pixel-wise classification given the input image. Different models have been proposed, among them being fully convolutional networks (FCN) [9], which proposed a paradigm shift in 2015, running fully connected layers, and includes a way to allow for each pixel to be classified from feature maps coming from convolutional layers. This builds on a series of local convolutions of preceding layers that aim to obtain a representation of multi-scale feature maps used for the classification tasks. Around the same time, Ronneberger et al. [10] introduced their convolutional neural network (CNN), a new CNN-based encoder–decoder model known as U-Net, and showed that combining higher and lower features symmetrically is beneficial in obtaining better performance. Soon after, SegNet [11] and Deeplab [12] were proposed, confirming that the encoder–decoder architecture is well suited for such a task.
Many of these works [12,13,14,15] also leverage the atrous convolution to show that it could help to capture contextual information. In particular, Y-Net [15] used three modules to improve segmentation accuracy. In addition to the Regular Convolution Module and the Pyramid Pooling Module, which allows the model to learn global information about potential locations of the target at different scales, the Dilated Convolution Module took advantage of the fact that the target is often shared out in the samples, which supports learning sparse features in their structure. PSPNet [14], on the other hand, adds ResNet [16] as a backbone, while multi-scale feature maps are aggregated in its encoder.
Although these architectures work well, the computer vision community has increasingly witnessed their design shift from pure CNN-based design with [9,10,11,12,14,15] to transformer-based designs, which started with ViT [17,18,19,20,21]. Later on, hybrid models started exploiting the best of both worlds by either using a transformer as an encoder and CNN as a decoder [22,23], or CNNs as encoders and a transformer as a decoder, or even using CNNs and encoder–decoder while transformers are used in the middle or in between to process the feature maps. One such hybrid model is HRNet-OCR [24], which has a CNN as a backbone and combines it with cross-attention layers between features of different scales to account for multiple contexts and scales in the data.
In all these schemes, the common denominator remains the attention mechanism, which has proven in the past few years to exceed the performance of models disregarding it. That is because it allows the features not to be subject to the inductive biases and translation invariance that occur in CNNs. Instead, it allows the model to learn long-term dependencies between pixel locations [17]. In other words, it allows for a better representation by leveraging contextual information either between pixels, patches, or channels.
1.3. Problem and Motivation
Li dendrite formations initiate during battery cycling, as illustrated in Figure 1, with dendrites nucleating on the interface between the electrolyte and the electrodes. Dendrite growth depends on the current density of plating, electrolyte transference number, electrolyte mechanical properties, and impurities present in Li metal material and at the interfaces. Earlier works have shown that increasing the shear modulus of the SPEs can help to suppress Li dendrite growth but cannot fully eliminate it [25,26,27,28]. Further studies have shown that Li metal surface impurities (LiN, LiCO, and LiO) can result in inhomogeneous current density and promote nucleation of Li dendrites.

Figure 1.
Diagram illustrating the Li–polymer–Li symmetric cell design, imaged using X-ray CT, with highlighted dendrite formations (blue) and the redeposited Li (red).
Accurate segmentation for measuring dendrite volume has guided research and quality control of battery designs, as well as tests of materials used for its components. Deep learning methods can provide exceptional segmentation results [29,30,31] when using high-resolution XCT data, particularly when large collections of annotated data are available. For example, Kodama et al. [32] and Muller et al. [33] proposed U-Net-based architectures for segmentation of lithium ion batteries (LIB), being the first article focused on segmenting samples into three phases: nickel manganese cobalt oxide, solid electrolyte, and void, and the second article described segmentation of graphite–silicon composite electrodes. More recent work by Zhang et al. [34] used a CNN known as D-LinkNet to inspect the effect of distortion on the segmentation accuracy of LIB samples. Additional works by the same team [35] used a U-Net for multiphase segmentation of battery electrodes from nano-CT images. Despite being focused on battery segmentation, those studies lack information on dendrite segmentation.
Previous studies [36,37] on inspecting dendrites in batteries discussed problems regarding the mechanisms and types of nucleation, e.g., lateral growth or Li filaments. Data acquisition modes range from electron microscopy [36,38,39] to XCT [37,39] with valuable morphological characterization and designs for suppression of dendrite growth, but dendrite detection was addressed mostly qualitatively through dendrite projections and/or visualizations. For example, the dendrite volume calculation in [39] was based on median filter and Otsu thresholding, a method that seldom works for more than a few slices from an XCT stack, unless considering strenuous manual postprocessing [40].
1.4. Research Contributions
The proposed research describes the design and implementation of dendrite and Li deposit segmentation from 3D XCT images and the contribution is two-fold: this work uses LMB, a more modern battery design in comparison with LIB, and the proposed semantic segmentation model, which builds upon a hybrid Transformer–CNN architecture never used before in LMB analysis. In performing the segmentation of a 3D volume automatically, we could either design a 3D model that performs directly on an input volume or we could leverage 2D models by subdividing the volume into slices. This paper introduces a 2D model due to its ability to be trained faster and with a limited number of samples, hence making it more versatile. In particular, we propose an architecture that benefits from both the contextual information learned from transformers and the global information captured by CNNs to predict dendrites and Li deposits (Figure 2) from a lithium metal battery that underwent cycling and was imaged using high-resolution XCT data. This article compares four different deep learning architectures, including U-Net, Y-Net, TransforCNN, and E-Net, on their ability to segment dendrites inside the cycled symmetric Li–Li battery with polymer electrolytes.
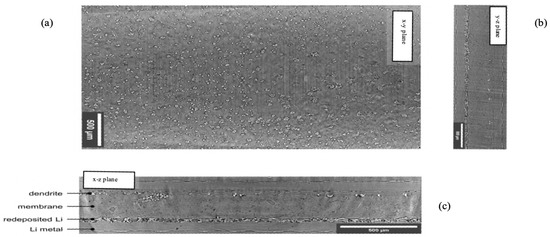
Figure 2.
Cross- sectional images for the Li–polymer–Li symmetric cell; (a) cross section of the x–y plane where the training was completed on this plane; (b) cross sections of the x–z plane and detailing of the cell components; (c) cross sections of the y–z plane.
2. Materials and Methods
Li metal holds a high theoretical capacity (3860 mAh/g) and a large negative thermodynamic potential (−3.06 V vs. SHE) [41]. Thus, it is considered a promising candidate for the next-generation battery anode. Li metal is highly active and can introduce a series of side reactions in a battery system with liquid electrolytes. This can also cause the dendrite to form, which would eventually lead to short circuits and introduce safety issues to the battery. Using solid electrolytes instead of liquid electrolytes, a more stable interface can be designed between the electrolyte and the Li metal electrodes, thus alleviating the dendrite formation issue. Recent developments in electrolyte engineering can be found in [35,39,42,43].
Currently, several solid-state materials are used as electrolytes and separators, such as polymers and single-ion conducting inorganic solid electrolytes (glass or ceramic). Polymer materials are promising as they are mechanically flexible because polymer materials can be produced in a roll-to-roll scalable process and be designed very thinly. However, for SPEs to have broad deployment, strategies for dendrite suppression must be developed, such as coatings and soft interlayers, including polymers as well as ionic liquids [44,45,46].
Design of interfaces in Li metal batteries or all solid-state batteries (ASSBs) is challenging as it involves control of Li ion plating onto Li metal and this plating process needs to be uniform. When not completed properly, interactions at the interfaces of electrodes arise due to transport processes associated with ions [43,47], which can form ionic aggregates. Dendrite growth can be triggered by the formation of localized regions of high lithium ion concentration, which can occur due to the clustering of lithium ions into ionic aggregates. In general, dendrites are formed during battery charge and discharge cycles. This happens especially when a battery is charged at high current densities due to the heterogeneous Li metal plating even when considering solid electrolytes. Tracking the structure and evolution of dendrites is important to develop a strategy to prevent their growth. Dendrites are tree-like and porous structures, usually with a size in nano to micro scale. Given the morphological structure of dendrites and their size relative to an input stack, performing XCT segmentation is a suitable method of analysis as it allows for a pixel-wise classification, which helps to quantify the volume of dendrites and use it as a proxy of battery quality.
2.1. Electrochemical Testing
Li/Li symmetric cells are assembled using two Li metal electrodes and are considered a tool for testing and observing the Li metal anode without being affected by cathode materials.
Free-standing Li metal foils with a thickness of 100 m from FMC/Livent™ were used. Polymer electrolyte membrane was sourced from an industrial partner with a thickness of 140 m as a research sample. The cell was assembled as Figure 3 shows. A red shim with a thickness of 50 m was used to create a circle with 0.8 cm diameter. Two circular polymer electrolytes with a diameter of 0.80 cm were punched out and placed on each side of the red shim. Two Li metal foils were then placed on the outside of the membranes as electrodes. The electrodes were connected to the metal tabs. The cell was sealed with a vacuum sealer. A current density of 1.5 mA/cm was periodically applied to the cell for 10 min, and the battery rested for 20 min. The cell was cycled at 3.0 mAh/cm for one full cycle (120 min for charging and 120 min for discharging), after which the cell XCT scan was acquired.
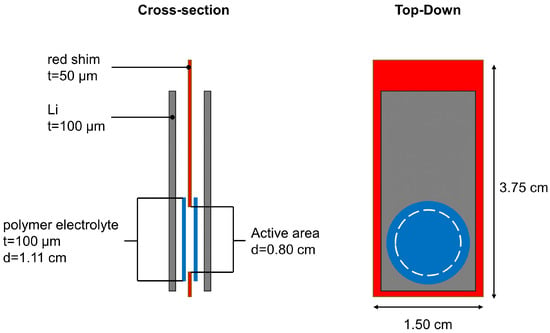
Figure 3.
Schematic illustration of the pouch cell.
2.2. Synchrotron X-ray CT Imaging
The XCT scan was acquired at Beamline 2-BM at Advanced Photon Source (APS) at Argonne National Laboratory (ANL), which used a 20 m LuAG scintillator with lenses and an sCMOS PCO edge camera. A 27.5 keV energy was selected using a multilayer monochromator, with 100 ms exposure time per back projection and over 180 degrees of rotation, enabling the collection of 1500 projections. The pixel size is 1.33 m and the field of view is 3.3 mm. Three FOVs were recorded and were stitched together to form a vertical height of >3 mm during the postprocessing. Tomographic reconstructions considered TomoPy version 1.14 with Gridrec algorithm [48,49,50].
2.3. Raw Data Preprocessing
The resulting raw TomoPy reconstruction was a large volume of size and required additional alignments to correct for the various motion involved in collecting the data, as shown in Figure 4. As these raw data contain a great deal of noise and irrelevant parts, we proceed to develop an algorithm that will allow us to cleanly crop out those regions. In the process, we inverted the grayscale volume and obtained a maximum projection [40] image on the stacks to facilitate our ability to locate corners.
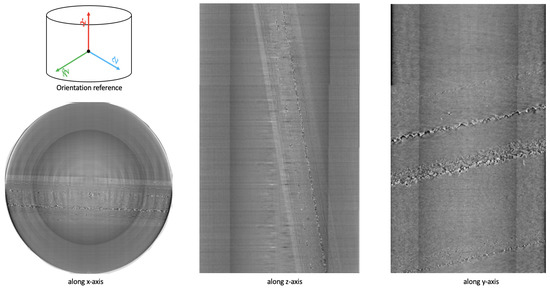
Figure 4.
Sample raw data obtained after TomoPy reconstruction of a CT scan.
To align the data, we first used a series of perspective transformations and homography to rectify the region of interest along each plane. Although this process could be automated using feature detectors and feature matching techniques, such as MOPS [51] and SIFT [52], we manually selected corners for optimal precision. We then rectified and cropped the raw data to obtain the region of interest to a volume of size , as shown in Figure 5.
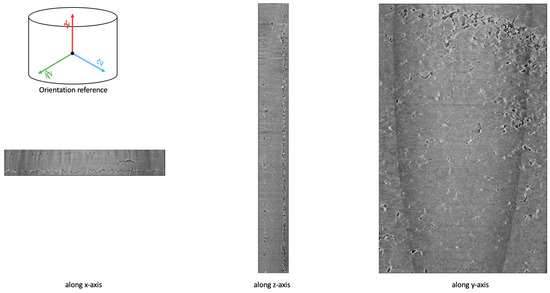
Figure 5.
Sample region of interest (RoI) data obtained after preprocessing TomoPy reconstruction of a CT scan.
2.4. Deep Learning: CNN and Vision Transformer
For a given volume stack, we apply 2D models due to their versatility. In doing so, we subdivide each training hand-labeled slice into patches, which were then separated into training, validation, and testing datasets. Based on their known performances over the years, we investigate CNN-based architectures, such as U-Net [10] and Y-Net [15]. In addition, we also compared their performance with TransforCNN, our proposed transformer encoder-based network, and E-Net, an ensemble network over U-Net, Y-Net, and TransforCNN. We train the networks in a weakly supervised fashion where a small subset of labeled data was used in conjunction with a much larger unlabeled sample size. Figure 6 shows a sample output of the model considered in this work.
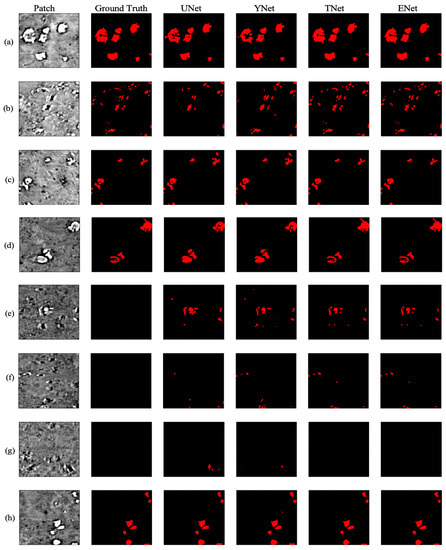
Figure 6.
XCT cross–sections and corresponding segmentation results for U-Net, Y-Net, T-Net (TransforCNN) with inputs in 1st column characterized by: (a) high concentration of large Li agglomerates, (b) moderate concentration of small Li agglomerates, (c) low concentration of small Li agglomerates, (d) low concentration of large Li agglomerates, (e–g) low concentration of small Li agglomerates that were not labeled by humans but detected by the deep learning algorithms, (h) low concentration of small Li agglomerates.
2.4.1. U-Net
Figure 7 shows a U-Net, a CNN architecture that was first introduced in 2015 by Ronneberger et al. for the semantic segmentation of biomedical images. The original work [10] proposes an architecture that consists of a contracting path to capture context and a symmetric expanding path that enables precise localization. In our work, the model was adapted to take images of size as input. For the encoder, we started with 16-channel kernels and double the number at each layer, followed by a ReLU activation and max pooling until a 256-channel resolution feature map is obtained. We reversed the operation with transposed convolutions operation on the decoder side and concatenate with corresponding size encoder feature maps until the desired output shape is obtained.
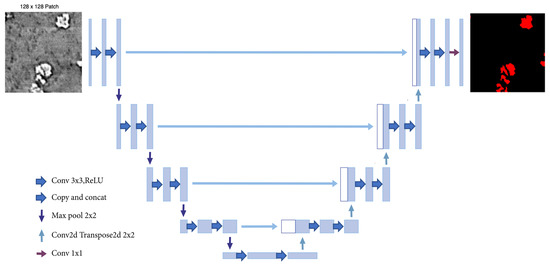
Figure 7.
U-Net architecture.
2.4.2. Y-Net
Figure 8 shows Y-Net, a CNN architecture originally introduced by Quenum et al. [15] to segment barcodes from ultra-high-resolution images. By leveraging Y-Net’s architecture, we have modified and adapted the Regular Convolution Module to take in images from training slices. As it consists of convolutional and pooling layers, we started with 24-channel kernels and doubled the number at each layer. We alternated between convolution and max pooling until we reached a feature map size of pixels. The Dilated Convolution Module here took advantage of the fact that dendrites are often shared out in the samples to learn sparse features in their structure. It also took input patches and we maintained 16-channel kernels throughout the module while the dimensions of the layers were gradually reduced using a stride of 2 until a feature map of pixels is obtained. Finally, the Pyramid Pooling Module, which allows the model to learn global information about potential locations of the dendrites at different scales, had its layers concatenated with the layers on the dilated convolution module to preserve the features extracted from both modules.
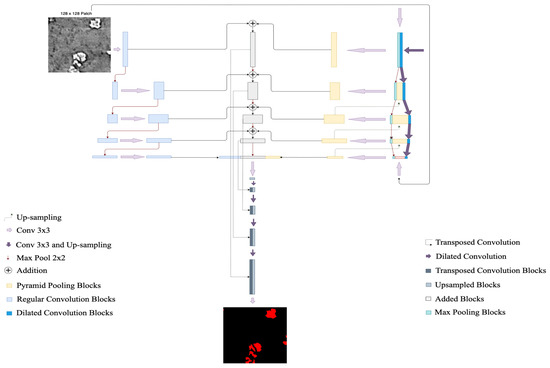
Figure 8.
Y-Net architecture.
2.4.3. TransforCNN
TransforCNN is a hybrid Transformer-CNN segmentation model that leverages the encoder model of Vision Transformers ViT [17] and the decoder architecture of CNNs. More specifically, its encoder model was first introduced in natural language processing (NLP) by Vaswani et al. [53] and its multi-headed self-attention was later shown (by ViT) to help remove the common inductive biases observed in CNN-only models by relating all input sequences with each other. As depicted in Figure 9, the proposed architecture is hybrid because it combines the Transformer Encoders Block with the CNN Decoder Block to deliver semantic segmentation.
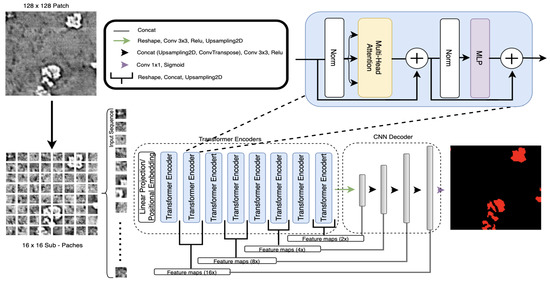
Figure 9.
TransforCNN architecture combines the encoder of Vision Transformers with the CNN decoder.
The Transformer Encoders Block takes inputs that are sub-patch sequences from the patches that were obtained from training slices. These patches are flattened and each is embedded into a 64-dimensional feature vector via a linear projection and is added to its corresponding Fourier features (FF) positional encoding. We used 8 transformer encoder units and the outputs of every 2 transformer encoders were reshaped into a 2-dimensional feature map representation, concatenated, up-sampled, and recombined with the layers from the CNN Decoder Block of corresponding dimension.
The CNN Decoder Block takes in the output of the last transformer encoder unit and reshapes it into a 2-dimension representation on which a set of kernels convolutions and max pooling is applied to obtain a feature map of pixels. The resulting feature maps are then concatenated with corresponding size feature maps coming from the Transformer Encoder Block and up-sampled continuously until the final output is obtained. This last step allows for the enhancement of the features in the CNN Decoder Block as we are progressively reconstructing the output dimension of .
2.4.4. E-Net
We have combined the results of different architectures, namely U-Net, Y-Net, and TransforCNN, to create an ensemble prediction scheme called E-Net. It was found that our best mean intersection over union (mIoU) is obtained when combining 20% of U-Net with 80% of TransforCNN, while the best mean Dice similarity coefficient (mDSC) is obtained using only a TransforCNN. This was achieved by weighing the predicted segments of each of the models with coefficients in the interval in increments of and evaluating all possible combinations against the available ground truth segments.
3. Results
In training the models (U-Net, Y-Net, and TransforCNN), we used one NVIDIA Tesla V100 GPU for each experiment. We obtained a total of 4433 samples of resolution with their corresponding hand-labeled ground truth that the models were trained on. We used 80% of the examples for the training set, 10% for the validation set, and 10% for the testing set. We used data augmentation schemes in training all models, which consist of random rotations in all directions, random flips (vertically and horizontally), random cropping (2%), random shifts, random zoom (range in [0.8, 1]), and a small range of random brightness and contrast variation (+/− 5%). We trained the U-Net for 450 epochs, while the Y-Net and TransforCNN models were trained for 130 and 300 epochs, respectively. The training process took an average of 1.5 GPU days for U-Net because it has slightly fewer parameters than Y-NET, which took about 2 GPU days. TransforCNN has significantly more parameters (∼3 × the size of U-Net) and it took about 3 GPU days to converge. We used the Adam optimizer for U-Net and Y-Net and used the AdamW optimizer for TransforCNN; AdamW is a stochastic optimization method that modifies the standard implementation of weight decay in Adam by decoupling weight decay from the gradient update.
As shown in Figure 10, Y-Net and TransforCNN converge faster than U-Net, with the initial loss of the TransforCNN model being significantly lower than that of the U-Net and Y-Net models. We have experimented with various loss functions, such as Tversky loss [54] described in Equation (1), the focal Tversky loss [55] described in Equation (2), the binary cross-entropy loss (Equation (3)), and the balanced cross-entropy loss described in Equation (4), out of which the binary cross-entropy loss yields the best results. One interesting observation is that, although the validation curve on U-Net exhibits characteristics of better generalization, the quantitative results show otherwise.
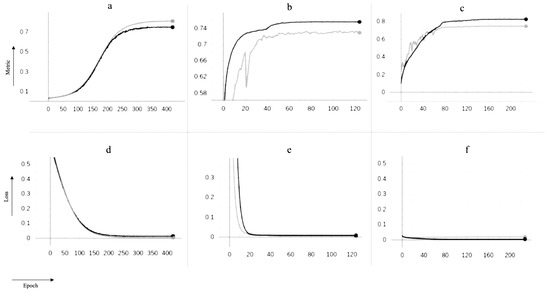
Figure 10.
Training curves for U-Net, Y-Net, and TransforCNN on the y-axis vs. numbers of epochs on the x-axis; the models were optimized over the binary cross-entropy function as loss and evaluated on the Dice similarity coefficient as evaluation metric during training. The gray curves depict behavior on the validation sets while the black curves show behavior on the training sets over increasing numbers of epochs; (a) training and validation Dice coefficient for U-Net; (b) training and validation dice coefficient for Y-Net; (c) training and validation Dice coefficient for TransforCNN; (d) training and validation loss for U-Net; (e) training and validation loss for Y-Net; (f) training and validation loss for U-Net; the use of dropout during only the training phase explains why the models tend to perform better on the validation set over time.
For evaluation, we have used the Dice similarity coefficient described in Equation (5) and the Jaccard index, also known as intersection over union (Equation (6)). In all the equations, y and are, respectively, the ground truth and prediction on patch i, and TP, FP, and FN represent the number of true positives, false positives, and false negatives, respectively. Note that Equation (6) could also be expressed as DSC/(2-DSC).
where .
where .
where .
4. Discussion
To assess the performance of all the semantic segmentation models, we use the mean Dice similarity coefficient (mDSC) and the mean intersection over union (mIoU) as metrics, as shown in Table 1. As indicated, our proposed pipeline outperforms U-Net [10] and Y-Net [15] by a mIoU of 8.13% and 10.3% and mDSC of 6.49% and 8.57%, respectively. Shown as well in Table 1 is a slight mIoU improvement of 0.03% by our ensemble network analysis (E-Net) on TransforCNN.

Table 1.
mIoU, mDSC, inference time, and patch size for Li–Li symmetric battery dataset; bold numbers emphasize best performance.
In addition, Table 1 displays that, while TransforCNN is successful in segmenting out dendrites, its latency is at least slower than U-Net, which has the fastest latency of all models evaluated at 65.36 milliseconds (ms). The slowest of all the models is observed to be E-Net, which performs slower than U-Net.
Qualitatively, Figure 11 shows the predictions on an unseen test slice, while Figure 6 shows sample predictions at the patch level from previously labeled images. As observed in the first and second rows (a; b), the TransforCNN and U-Net predictions are the closest to the ground truth. The third, fourth, and eighth rows (c; d; h) show that U-Net and Y-Net tend to generalize better as the unlabeled dendrite regions in the input patches are segmented out by these two models, while TransforCNN and E-Net still reflect the ground truth images. The fifth, sixth, and seventh rows (e; f; g) show the generalization potential of all the models, while the predictions of TransforCNN and E-Net overall tend to remain closer to the ground truth. In addition, Table 2 summarizes the absolute number of voxels corresponding to the segmented dendrite and redeposited Li volume as well as their volume fraction and Figure 12 shows the 3D rendering of stack using all methods.
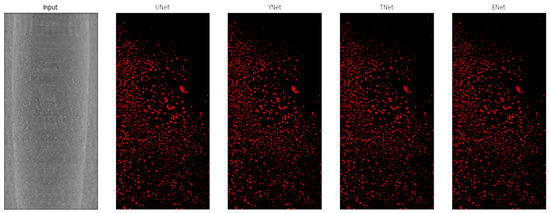
Figure 11.
XCT cross-section along the x–y plane and corresponding segmentation results for U-Net, Y-Net, T-Net (TransforCNN), and E-Net.

Table 2.
Volume and percentage volume occupied for U-Net, Y-Net, TransforCNN, and E-Net.
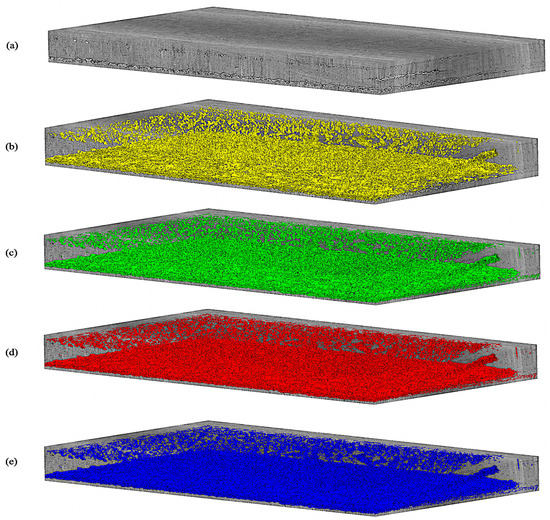
Figure 12.
3D rendering of U-Net, Y-Net, T-Net (TransforCNN), and E-Net on test volume; (a) grayscale test input volume; (b–e) are, respectively, U-Net, Y-Net, T-Net (TransforCNN), and E-Net predictions.
5. Conclusions
LMBs are promising candidates for next-generation batteries because of their high specific energy density. Currently, Li dendrites growth is an issue as it can lead to loss of Li (dead Li), shorting of cells, and other undesirable degradation phenomena.
More specifically, short-circuiting is a leading failure mechanism in LMBs due to the uncontrolled propagation of lithium protrusions that often present a dendritic morphology. The energy density benefits of using LMBs can only be harvested after scientists are able to detect and regulate the dendrite formation and control dendrite growth.
Uneven lithium ion distribution and dendrite formation can compromise battery performance and safety. For this reason, this paper introduced a semantic segmentation algorithm called TransforCNN that detects both dendrites and re-deposited Li accurately and compared it with traditional approaches.
Overall, it was observed that TransforCNN and E-Net tend to learn semantics in the ground truth images provided during training. In contrast, U-Net and Y-Net tend to simply generalize even to cases where segments in the ground truth were wrongly hand-labeled. We speculate that this may lead to U-Net and Y-Net being wrongly penalized during the evaluation process while TransforCNN and E-Net are rewarded since their predictions always appear to be the closest to the ground truth.
Experiments have also illustrated that our approach outperforms the existing methods, although it is slower than the fastest (U-Net) of all the considered models. In future work, we aim to extend this method to a multi-class segmentation task, differentiating dendrites from pits and other lithium deposits while improving the current latency in a weakly supervised fashion.
Author Contributions
J.Q. developed the computer vision and machine learning algorithms for XCT, starting from implementations by D.U.; J.Q. led algorithm validation; I.V.Z. led data selection and reconstruction of the XCT image stack. I.V.Z. and D.U. formulated the project and led the research activity planning, execution, and coordination. J.Q., I.V.Z. and D.U. contributed to writing the paper. All authors have read and agreed to the published version of the manuscript.
Funding
This work was supported by the US Department of Energy (DOE) Office of Science Advanced Scientific Computing Research (ASCR) and Basic Energy Sciences (BES) under Contract No. DE-AC02-05CH11231 to the Center for Advanced Mathematics for Energy Research Applications (CAMERA) program. It also included support from the DOE ASCR-funded project Analysis and Machine Learning Across Domains (AMLXD), and from the LBNL Bridges Fellowship 2021.
Institutional Review Board Statement
Not applicable since these studies do not involve humans or animals.
Informed Consent Statement
Not applicable.
Data Availability Statement
The image stacks corresponding to the XCT stack and the TransforCNN result are available at https://doi.org/10.6078/D1FM8J, and they are compressed to comply with storage footprint and public software for fast data visualization.
Acknowledgments
We thank Pavel Shevchenko and Francesco De Carlo for their work at the Advanced Photon Source, Argonne National Laboratory, a US Department of Energy (DOE) Office of Science User Facility operated for the US DOE Office of Science by Argonne National Laboratory under contract No. DE-AC02-06CH11357. In addition, we thank Ying Huang for data labeling, and for using a multi-class experimental version of TransforCNN trained by Jerome Quenum to render Figure 1. Moreover, we acknowledge Dula Parkinson from the Advanced Light Source, Lawrence Berkeley National Laboratory for sharing data storage resources deployed by the National Energy Research Scientific Computing (NERSC) facility.
Conflicts of Interest
The authors declare no competing interest.
Sample Availability
XCT image samples from the compounds are available from the authors.
Abbreviations
The following abbreviations are used in this manuscript:
| CNN | Convolutional Neural Network |
| E-Net | Ensemble Network |
| LMB | Lithium metal battery |
| mDSC | mean Dice Similarity Coefficient |
| mIoU | mean Intersection over Union |
| MOPS | Multi-Scale Oriented Patches |
| NLP | Natural Language Processing |
| SIFT | Scale-Invariant Feature Transform |
| TransforCNN | Transformer Convolutional Neural Network |
| XCT | X-ray Computed Tomography |
References
- Zenyuk, I.V. Bridging X-ray computed tomography and computational modeling for electrochemical energy-conversion and -storage. Curr. Opin. Electrochem. 2019, 13, 78–85. [Google Scholar] [CrossRef]
- Veeraraghavan, V.D.; Frenck, L.; Maslyn, J.A.; Loo, W.S.; Parkinson, D.Y.; Balsara, N.P. Evolution of Protrusions on Lithium Metal Anodes Stabilized by a Solid Block Copolymer Electrolyte Studied Using Time-Resolved X-ray Tomography. ACS Appl. Mater. Interfaces 2021, 13, 27006–27018. [Google Scholar] [CrossRef]
- Harry, K.J.; Liao, X.; Parkinson, D.Y.; Minor, A.M.; Balsara, N.P. Electrochemical deposition and stripping behavior of lithium metal across a rigid block copolymer electrolyte membrane. J. Electrochem. Soc. 2015, 162, A2699. [Google Scholar] [CrossRef]
- Ho, A.S.; Barai, P.; Maslyn, J.A.; Frenck, L.; Loo, W.S.; Parkinson, D.Y.; Srinivasan, V.; Balsara, N.P. Uncovering the Relationship between Diameter and Height of Electrodeposited Lithium Protrusions in a Rigid Electrolyte. ACS Appl. Energy Mater. 2020, 3, 9645–9655. [Google Scholar] [CrossRef]
- Lewis, J.A.; Cortes, F.J.Q.; Liu, Y.; Miers, J.C.; Verma, A.; Vishnugopi, B.S.; Tippens, J.; Prakash, D.; Marchese, T.S.; Han, S.Y.; et al. Linking void and interphase evolution to electrochemistry in solid-state batteries using operando X-ray tomography. Nat. Mater. 2021, 20, 503–510. [Google Scholar] [CrossRef]
- Ho, A.S.; Parkinson, D.Y.; Finegan, D.P.; Trask, S.E.; Jansen, A.N.; Tong, W.; Balsara, N.P. 3D Detection of Lithiation and Lithium Plating in Graphite Anodes during Fast Charging. ACS Nano 2021, 45, 10480–10487. [Google Scholar] [CrossRef]
- Fioravante de Siqueira, A.; Ushizima, D.M.; van der Walt, S.J. A reusable neural network pipeline for unidirectional fiber segmentation. Sci. Data 2022, 9, 32. [Google Scholar] [CrossRef]
- Ramalho, G.L.B.; Ferreira, D.S.; Bianchi, A.G.C.; Carneiro, C.M.; Medeiros, F.N.S.; Ushizima, D.M. Cell reconstruction under Voronoi and enclosing ellipses from 3D microscopy. In Proceedings of the IEEE International Symposium on Biomedical Imaging (ISBI), Brooklyn, NY, USA, 16–19 April 2015. [Google Scholar]
- Long, J.; Shelhamer, E.; Darrell, T. Fully convolutional networks for semantic segmentation. In Proceedings of the IEEE Conference on Computer Vision and Pattern Recognition, Boston, MA, USA, 7–12 June 2015; pp. 3431–3440. [Google Scholar]
- Ronneberger, O.; Fischer, P.; Brox, T. U-Net: Convolutional Networks for Biomedical Image Segmentation. arXiv 2015, arXiv:1505.04597. [Google Scholar]
- Badrinarayanan, V.; Kendall, A.; Cipolla, R. SegNet: A Deep Convolutional Encoder-Decoder Architecture for Image Segmentation. IEEE Trans. Pattern Anal. Mach. Intell. 2017, 39, 2481–2495. [Google Scholar] [CrossRef] [PubMed]
- Chen, L.C.; Zhu, Y.; Papandreou, G.; Schroff, F.; Adam, H. Encoder-decoder with atrous separable convolution for semantic image segmentation. In Proceedings of the European Conference on Computer Vision (ECCV), Munich, Germany, 8–14 September 2018; pp. 801–818. [Google Scholar]
- Yang, M.; Yu, K.; Zhang, C.; Li, Z.; Yang, K. DenseASPP for Semantic Segmentation in Street Scenes. In Proceedings of the 2018 IEEE/CVF Conference on Computer Vision and Pattern Recognition, Salt Lake City, UT, USA, 18–23 June 2018; pp. 3684–3692. [Google Scholar] [CrossRef]
- Zhao, H.; Shi, J.; Qi, X.; Wang, X.; Jia, J. Pyramid scene parsing network. In Proceedings of the IEEE Conference on Computer Vision and Pattern Recognition, Honolulu, HI, USA, 21–26 July 2017; pp. 2881–2890. [Google Scholar]
- Quenum, J.; Wang, K.; Zakhor, A. Fast, Accurate Barcode Detection in Ultra High-Resolution Images. In Proceedings of the 2021 IEEE International Conference on Image Processing (ICIP), Anchorage, AL, USA, 19–22 September 2021; pp. 1019–1023. [Google Scholar] [CrossRef]
- He, K.; Zhang, X.; Ren, S.; Sun, J. Deep residual learning. Image Recognit. 2015, 7. [Google Scholar]
- Dosovitskiy, A.; Beyer, L.; Kolesnikov, A.; Weissenborn, D.; Zhai, X.; Unterthiner, T.; Dehghani, M.; Minderer, M.; Heigold, G.; Gelly, S.; et al. An Image is Worth 16 × 16 Words: Transformers for Image Recognition at Scale. In Proceedings of the International Conference on Learning Representations (ICLR), Virtual, 3–5 May 2021; pp. 1–12. [Google Scholar]
- Hassani, A.; Walton, S.; Li, J.; Li, S.; Shi, H. Neighborhood attention transformer. arXiv 2022, arXiv:2204.07143. [Google Scholar]
- Liu, Z.; Lin, Y.; Cao, Y.; Hu, H.; Wei, Y.; Zhang, Z.; Lin, S.; Guo, B. Swin transformer: Hierarchical vision transformer using shifted windows. In Proceedings of the IEEE/CVF International Conference on Computer Vision, Montreal, BC, Canada, 11–17 October 2021; pp. 10012–10022. [Google Scholar]
- Zheng, S.; Lu, J.; Zhao, H.; Zhu, X.; Luo, Z.; Wang, Y.; Fu, Y.; Feng, J.; Xiang, T.; Torr, P.H.; et al. Rethinking semantic segmentation from a sequence-to-sequence perspective with transformers. In Proceedings of the IEEE/CVF Conference on Computer Vision and Pattern Recognition, Virtual, 19–25 June 2021; pp. 6881–6890. [Google Scholar]
- Xie, E.; Wang, W.; Yu, Z.; Anandkumar, A.; Alvarez, J.M.; Luo, P. SegFormer: Simple and efficient design for semantic segmentation with transformers. Adv. Neural Inf. Process. Syst. 2021, 34, 12077–12090. [Google Scholar]
- Gao, Y.; Zhou, M.; Metaxas, D.N. UTNet: A hybrid transformer architecture for medical image segmentation. In Proceedings of the Medical Image Computing and Computer Assisted Intervention—MICCAI 2021: 24th International Conference, Strasbourg, France, September 27–October 1, 2021, Proceedings, Part III 24; Springer: Berlin/Heidelberg, Germany, 2021; pp. 61–71. [Google Scholar]
- Park, K.B.; Lee, J.Y. SwinE-Net: Hybrid deep learning approach to novel polyp segmentation using convolutional neural network and Swin Transformer. J. Comput. Des. Eng. 2022, 9, 616–632. [Google Scholar] [CrossRef]
- Yuan, Y.; Chen, X.; Wang, J. Object-contextual representations for semantic segmentation. In Proceedings of the Computer Vision–ECCV 2020: 16th European Conference, Glasgow, UK, 23–28 August 2020, Proceedings, Part VI 16; Springer: Berlin/Heidelberg, Germany, 2020; pp. 173–190. [Google Scholar]
- Chakraborty, S.; Sethi, G.K.; Frenck, L.; Ho, A.S.; Villaluenga, I.; Wantanabe, H.; Balsara, N.P. Effect of Yield Stress on Stability of Block Copolymer Electrolytes against Lithium Metal Electrodes. ACS Appl. Energy Mater. 2022, 5, 852–861. [Google Scholar] [CrossRef]
- Monroe, C.; Newman, J. Dendrite growth in lithium/polymer systems: A propagation model for liquid electrolytes under galvanostatic conditions. J. Electrochem. Soc. 2003, 150, A1377. [Google Scholar] [CrossRef]
- Monroe, C.; Newman, J. The effect of interfacial deformation on electrodeposition kinetics. J. Electrochem. Soc. 2004, 151, A880. [Google Scholar] [CrossRef]
- Yu, S.; Siegel, D.J. Grain boundary softening: A potential mechanism for lithium metal penetration through stiff solid electrolytes. ACS Appl. Mater. Interfaces 2018, 10, 38151–38158. [Google Scholar] [CrossRef]
- Badran, A.; Parkinson, D.; Ushizima, D.; Marshall, D.; Maillet, E. Validation of Deep Learning Segmentation of CT Images of Fiber-Reinforced Composites. J. Compos. Sci. 2022, 6, 60. [Google Scholar] [CrossRef]
- Sadre, R.; Sundaram, B.; Majumdar, S.; Ushizima, D. Validating deep learning inference during chest X-ray classification for COVID-19 screening. Sci. Rep. 2021, 11, 16075. [Google Scholar] [CrossRef]
- Ushizima, D.; Chen, Y.; Alegro, M.; Ovando, D.; Eser, R.; Lee, W.; Poon, K.; Shankar, A.; Kantamneni, N.; Satrawada, S.; et al. Deep learning for Alzheimer’s disease: Mapping large-scale histological tau protein for neuroimaging biomarker validation. NeuroImage 2022, 248, 118790. [Google Scholar] [CrossRef] [PubMed]
- Kodama, M.; Ohashi, A.; Adachi, H.; Miyuki, T.; Takeuchi, A.; Yasutake, M.; Uesugi, K.; Kaburagi, T.; Hirai, S. Three-dimensional structural measurement and material identification of an all-solid-state lithium-ion battery by X-Ray nanotomography and deep learning. J. Power Sources Adv. 2021, 8, 100048. [Google Scholar] [CrossRef]
- Müller, S.; Sauter, C.; Shunmugasundaram, R.; Wenzler, N.; De Andrade, V.; De Carlo, F.; Konukoglu, E.; Wood, V. Deep learning-based segmentation of lithium-ion battery microstructures enhanced by artificially generated electrodes. Nat. Commun. 2021, 12, 6205. [Google Scholar] [CrossRef] [PubMed]
- Zhang, K.; Nguyen, T.T.; Su, Z.; Demortière, A. Self-supervised image quality assessment for X-ray tomographic images of Li-ion battery. Npj Comput. Mater. 2022, 8, 194. [Google Scholar] [CrossRef]
- Su, Z.; Decencière, E.; Nguyen, T.T.; El-Amiry, K.; De Andrade, V.; Franco, A.A.; Demortière, A. Artificial neural network approach for multiphase segmentation of battery electrode nano-CT images. Npj Comput. Mater. 2022, 8, 30. [Google Scholar] [CrossRef]
- Wood, K.N.; Kazyak, E.; Chadwick, A.F.; Chen, K.H.; Zhang, J.G.; Thornton, K.; Dasgupta, N.P. Dendrites and Pits: Untangling the Complex Behavior of Lithium Metal Anodes through Operando Video Microscopy. ACS Cent. Sci. 2016, 2, 790–801. [Google Scholar] [CrossRef]
- Cao, D.; Sun, X.; Li, Q.; Natan, A.; Xiang, P.; Zhu, H. Lithium Dendrite in All-Solid-State Batteries: Growth Mechanisms, Suppression Strategies, and Characterizations. Matter 2020, 3, 57–94. [Google Scholar] [CrossRef]
- Zhu, J.; Zhang, Z.; Zhao, S.; Westover, A.S.; Belharouak, I.; Cao, P.F. Single-Ion Conducting Polymer Electrolytes for Solid-State Lithium–Metal Batteries: Design, Performance, and Challenges. Adv. Energy Mater. 2021, 11, 2003836. [Google Scholar] [CrossRef]
- Huang, C.; Leung, C.L.A.; Leung, P.; Grant, P.S. A Solid-State Battery Cathode with a Polymer Composite Electrolyte and Low Tortuosity Microstructure by Directional Freezing and Polymerization. Adv. Energy Mater. 2021, 11, 2002387. [Google Scholar] [CrossRef]
- Ushizima, D.; Xu, K.; Monteiro, P. Materials Data Science for Microstructural Characterization of Archaeological Concrete. MRS Adv. 2020, 5, 305–318. [Google Scholar] [CrossRef]
- Hatzell, K.B.; Chen, X.C.; Cobb, C.L.; Dasgupta, N.P.; Dixit, M.B.; Marbella, L.E.; McDowell, M.T.; Mukherjee, P.P.; Verma, A.; Viswanathan, V.; et al. Challenges in Lithium Metal Anodes for Solid-State Batteries. ACS Energy Lett. 2020, 5, 922–934. [Google Scholar] [CrossRef]
- Ji, Y.; Li, J.; Li, J. Recent Development of Electrolyte Engineering for Sodium Metal Batteries. Batteries 2022, 8, 157. [Google Scholar] [CrossRef]
- Knudsen, E.; Albertus, P.; Cho, K.; Weber, A.; Kojic, A. Flow simulation and analysis of high-power flow batteries. J. Power Sources 2015, 299, 617–628. [Google Scholar] [CrossRef]
- Gao, Y.; Zhao, Y.; Li, Y.C.; Huang, Q.; Mallouk, T.E.; Wang, D. Interfacial chemistry regulation via a skin-grafting strategy enables high-performance lithium-metal batteries. J. Am. Chem. Soc. 2017, 139, 15288–15291. [Google Scholar] [CrossRef] [PubMed]
- Zhou, W.; Wang, S.; Li, Y.; Xin, S.; Manthiram, A.; Goodenough, J.B. Plating a dendrite-free lithium anode with a polymer/ceramic/polymer sandwich electrolyte. J. Am. Chem. Soc. 2016, 138, 9385–9388. [Google Scholar] [CrossRef]
- Ates, T.; Keller, M.; Kulisch, J.; Adermann, T.; Passerini, S. Development of an all-solid-state lithium battery by slurry-coating procedures using a sulfidic electrolyte. Energy Storage Mater. 2019, 17, 204–210. [Google Scholar] [CrossRef]
- Weber, A.Z.; Borup, R.L.; Darling, R.M.; Das, P.K.; Dursch, T.J.; Gu, W.; Harvey, D.; Kusoglu, A.; Litster, S.; Mench, M.M.; et al. A Critical Review of Modeling Transport Phenomena in Polymer-Electrolyte Fuel Cells. J. Electrochem. Soc. 2014, 161, F1254. [Google Scholar] [CrossRef]
- De Carlo, F.; Xiao, X.; Jacobsen, C. TomoPy: A framework for the analysis of synchrotron tomographic data. J. Synchrotron Radiat. 2014, 21, 1188–1193. [Google Scholar]
- Pelt, D.M.; Gürsoy, D.; Palenstijn, W.J.; Sijbers, J.; De Carlo, F.; Batenburg, K.J. Integration of TomoPy and the ASTRA toolbox for advanced processing and reconstruction of tomographic synchrotron data. J. Synchrotron Radiat. 2016, 23, 842–849. [Google Scholar] [CrossRef]
- De Carlo, F.; Gürsoy, D.; Marone, F.; Rivers, M.; Parkinson, D.Y.; Khan, F.; Schwarz, N.; Vine, D.J.; Vogt, S.; Gleber, S.C.; et al. Scientific data exchange: A schema for HDF5-based storage of raw and analyzed data. J. Synchrotron Radiat. 2014, 21, 1224–1230. [Google Scholar] [CrossRef]
- Brown, M.; Szeliski, R.; Winder, S. Multi-image matching using multi-scale oriented patches. In Proceedings of the 2005 IEEE Computer Society Conference on Computer Vision and Pattern Recognition (CVPR’05), IEEE, San Diego, CA, USA, 20–25 June 2005; Volume 1, pp. 510–517. [Google Scholar]
- Lowe, D.G. Object recognition from local scale-invariant features. In Proceedings of the Seventh IEEE International Conference on Computer Vision, Corfu, Greece, 20–27 September 1999; Volume 2, pp. 1150–1157. [Google Scholar]
- Vaswani, A.; Shazeer, N.; Parmar, N.; Uszkoreit, J.; Jones, L.; Gomez, A.N.; Kaiser, L.; Polosukhin, I. Attention Is All You Need. arXiv 2017, arXiv:cs.CL/1706.03762. [Google Scholar]
- Salehi, S.S.M.; Erdogmus, D.; Gholipour, A. Tversky loss function for image segmentation using 3D fully convolutional deep networks. arXiv 2017, arXiv:cs.CV/1706.05721. [Google Scholar]
- Abraham, N.; Khan, N.M. A Novel Focal Tversky loss function with improved Attention U-Net for lesion segmentation. arXiv 2018, arXiv:cs.CV/1810.07842. [Google Scholar]
Disclaimer/Publisher’s Note: The statements, opinions and data contained in all publications are solely those of the individual author(s) and contributor(s) and not of MDPI and/or the editor(s). MDPI and/or the editor(s) disclaim responsibility for any injury to people or property resulting from any ideas, methods, instructions or products referred to in the content. |
© 2023 by the authors. Licensee MDPI, Basel, Switzerland. This article is an open access article distributed under the terms and conditions of the Creative Commons Attribution (CC BY) license (https://creativecommons.org/licenses/by/4.0/).