
Lesion Detection in Optical Coherence Tomography with Transformer-Enhanced Detector


Abstract
:1. Introduction
- A novel TED framework is developed, focusing on detecting relevant lesions in noisy OCT images of different organs.
- In TED, the transformer is adapted to take in images and slide across Regions of Interest (ROIs) provided by AGs. This design aims to adaptively deal with different types of noise artifacts and thus effectively detect a variety of anomalies including tooth decay and numerous lesions across two modalities.
- A new loss function is proposed along with TED, which combines a sliding box, Intersection Over Union (IOU), and Mean Squared Error (MSE). It compares the IOU and MSE between the predicted and real bounding boxes to evaluate the regions of focus chosen by the AGs.
1.1. Related Work
1.1.1. Detection Methods
1.1.2. Attention Gates and Transformers
2. Materials and Methods
2.1. Data Preparation and Augmentation
2.2. Attention Gated Patch Encoder
2.3. Transformer-Enhanced Detection
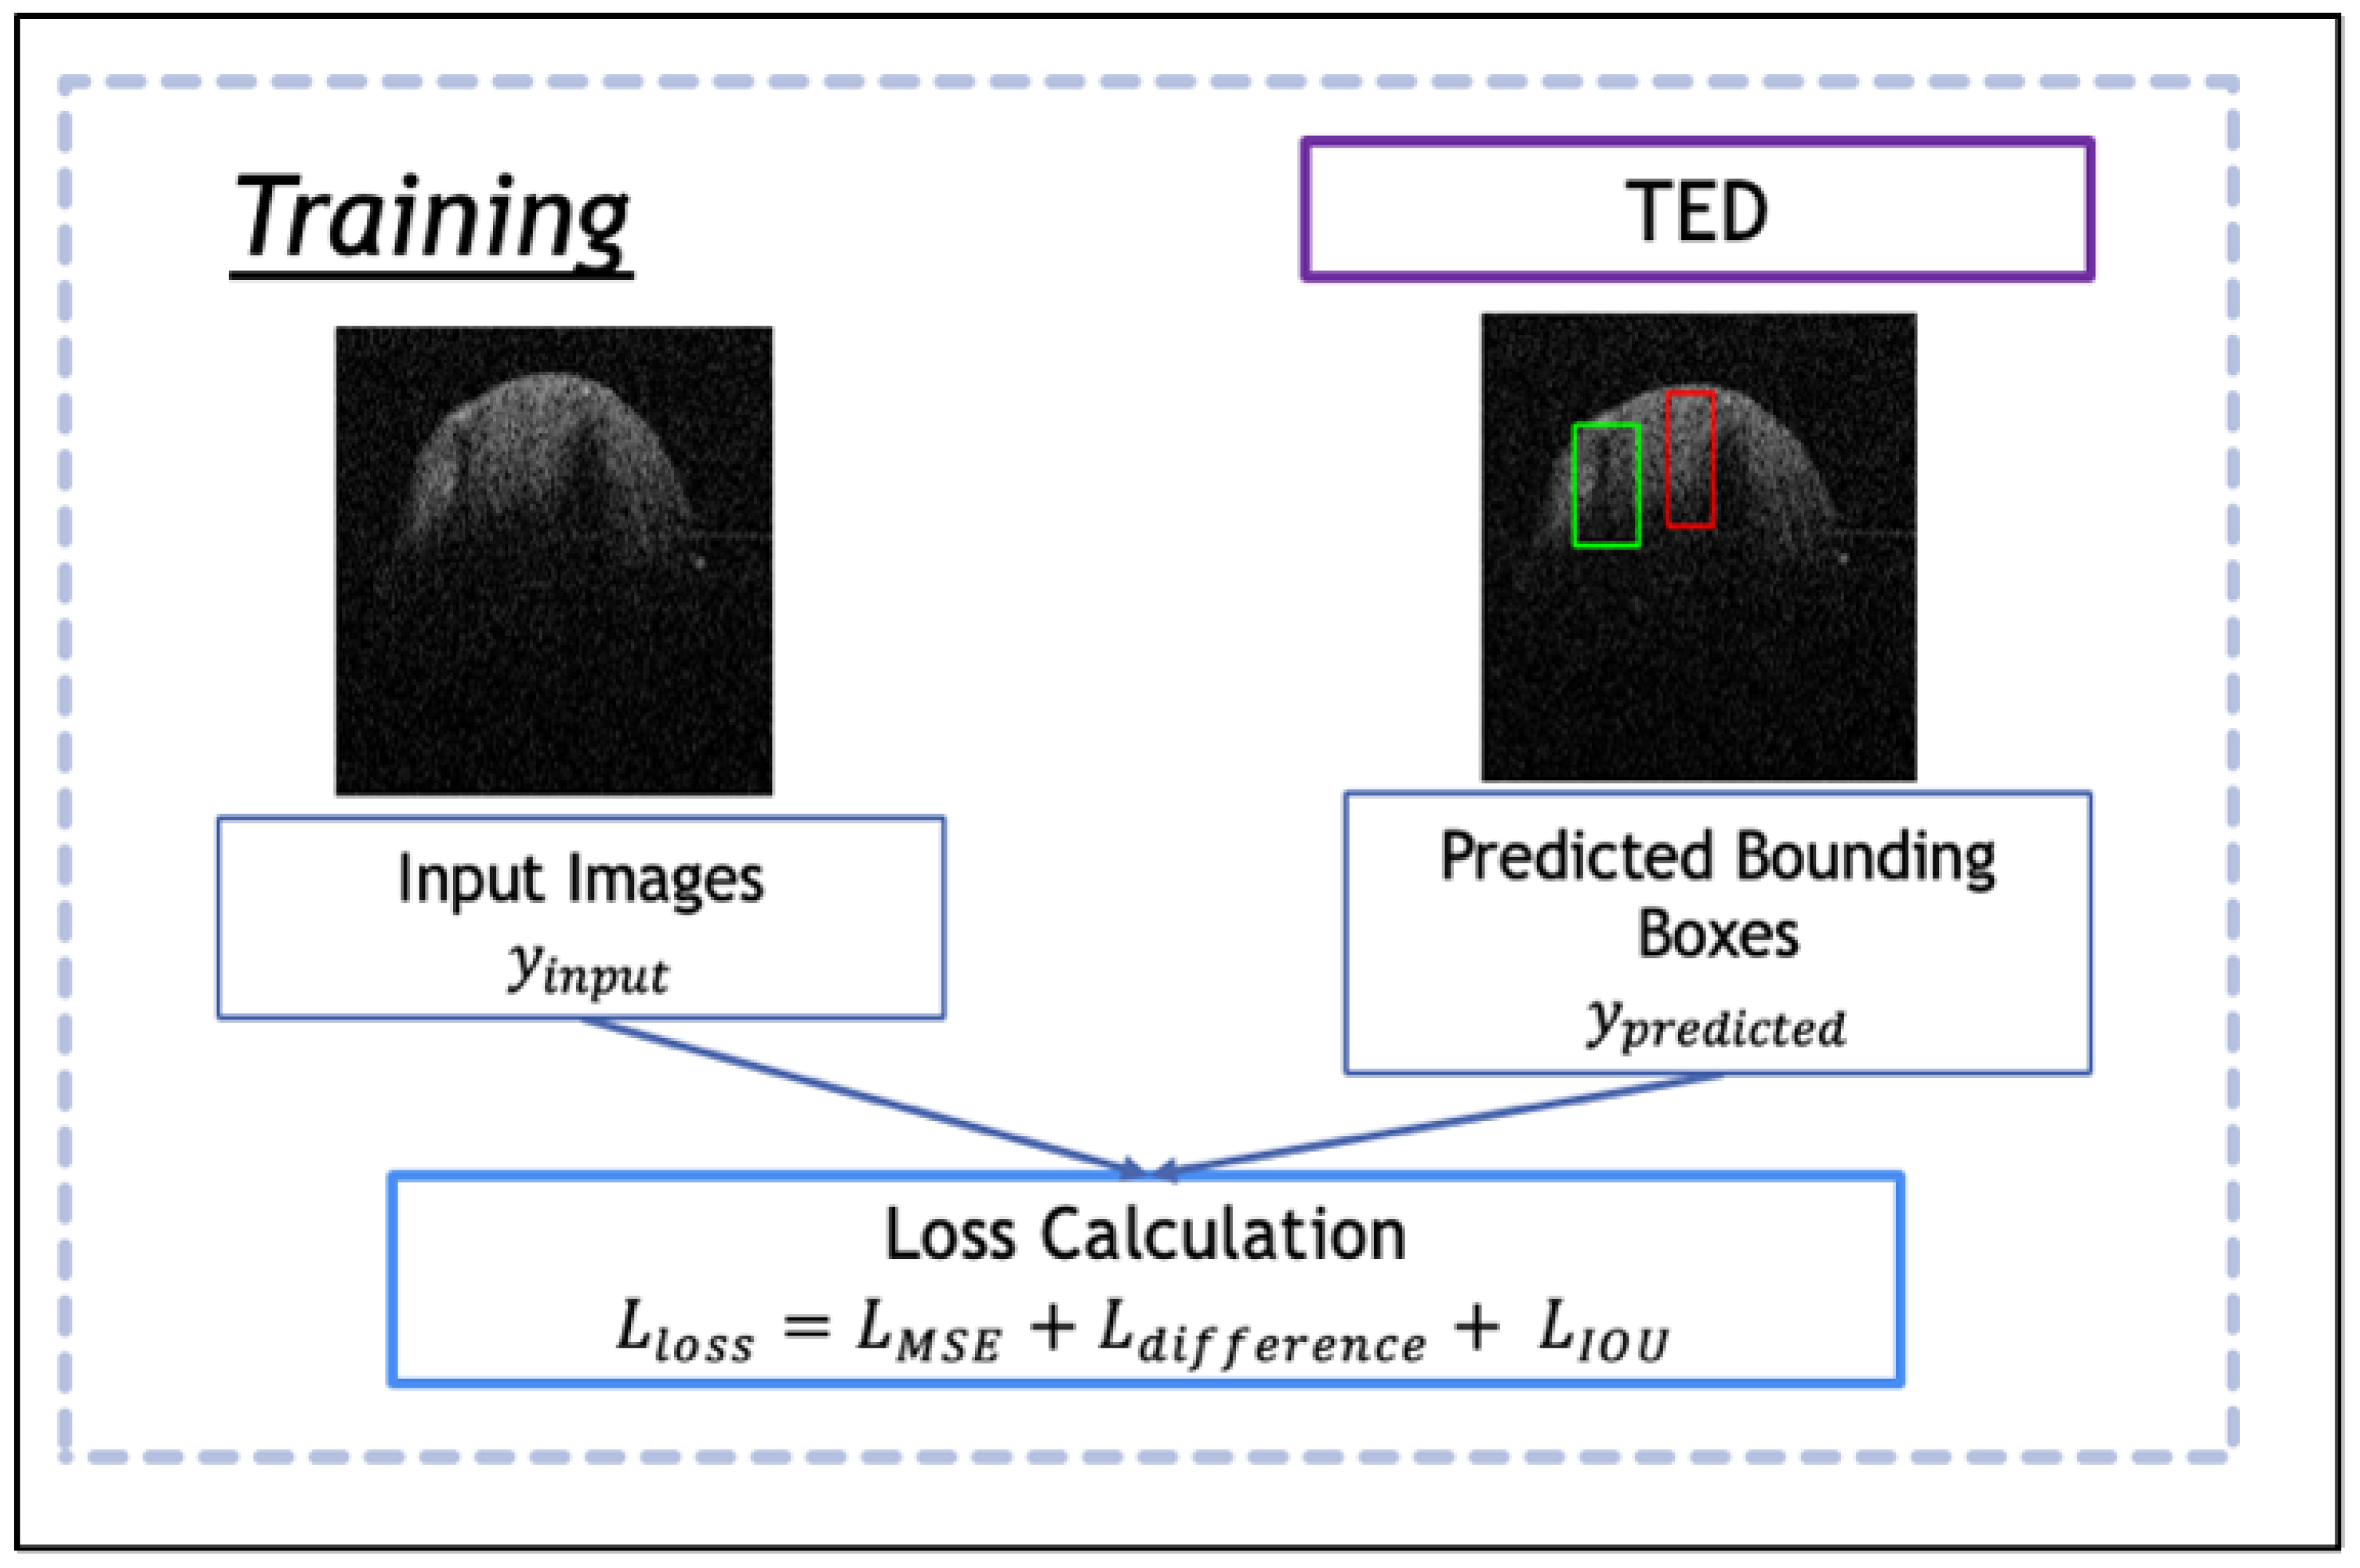
2.4. Loss Function
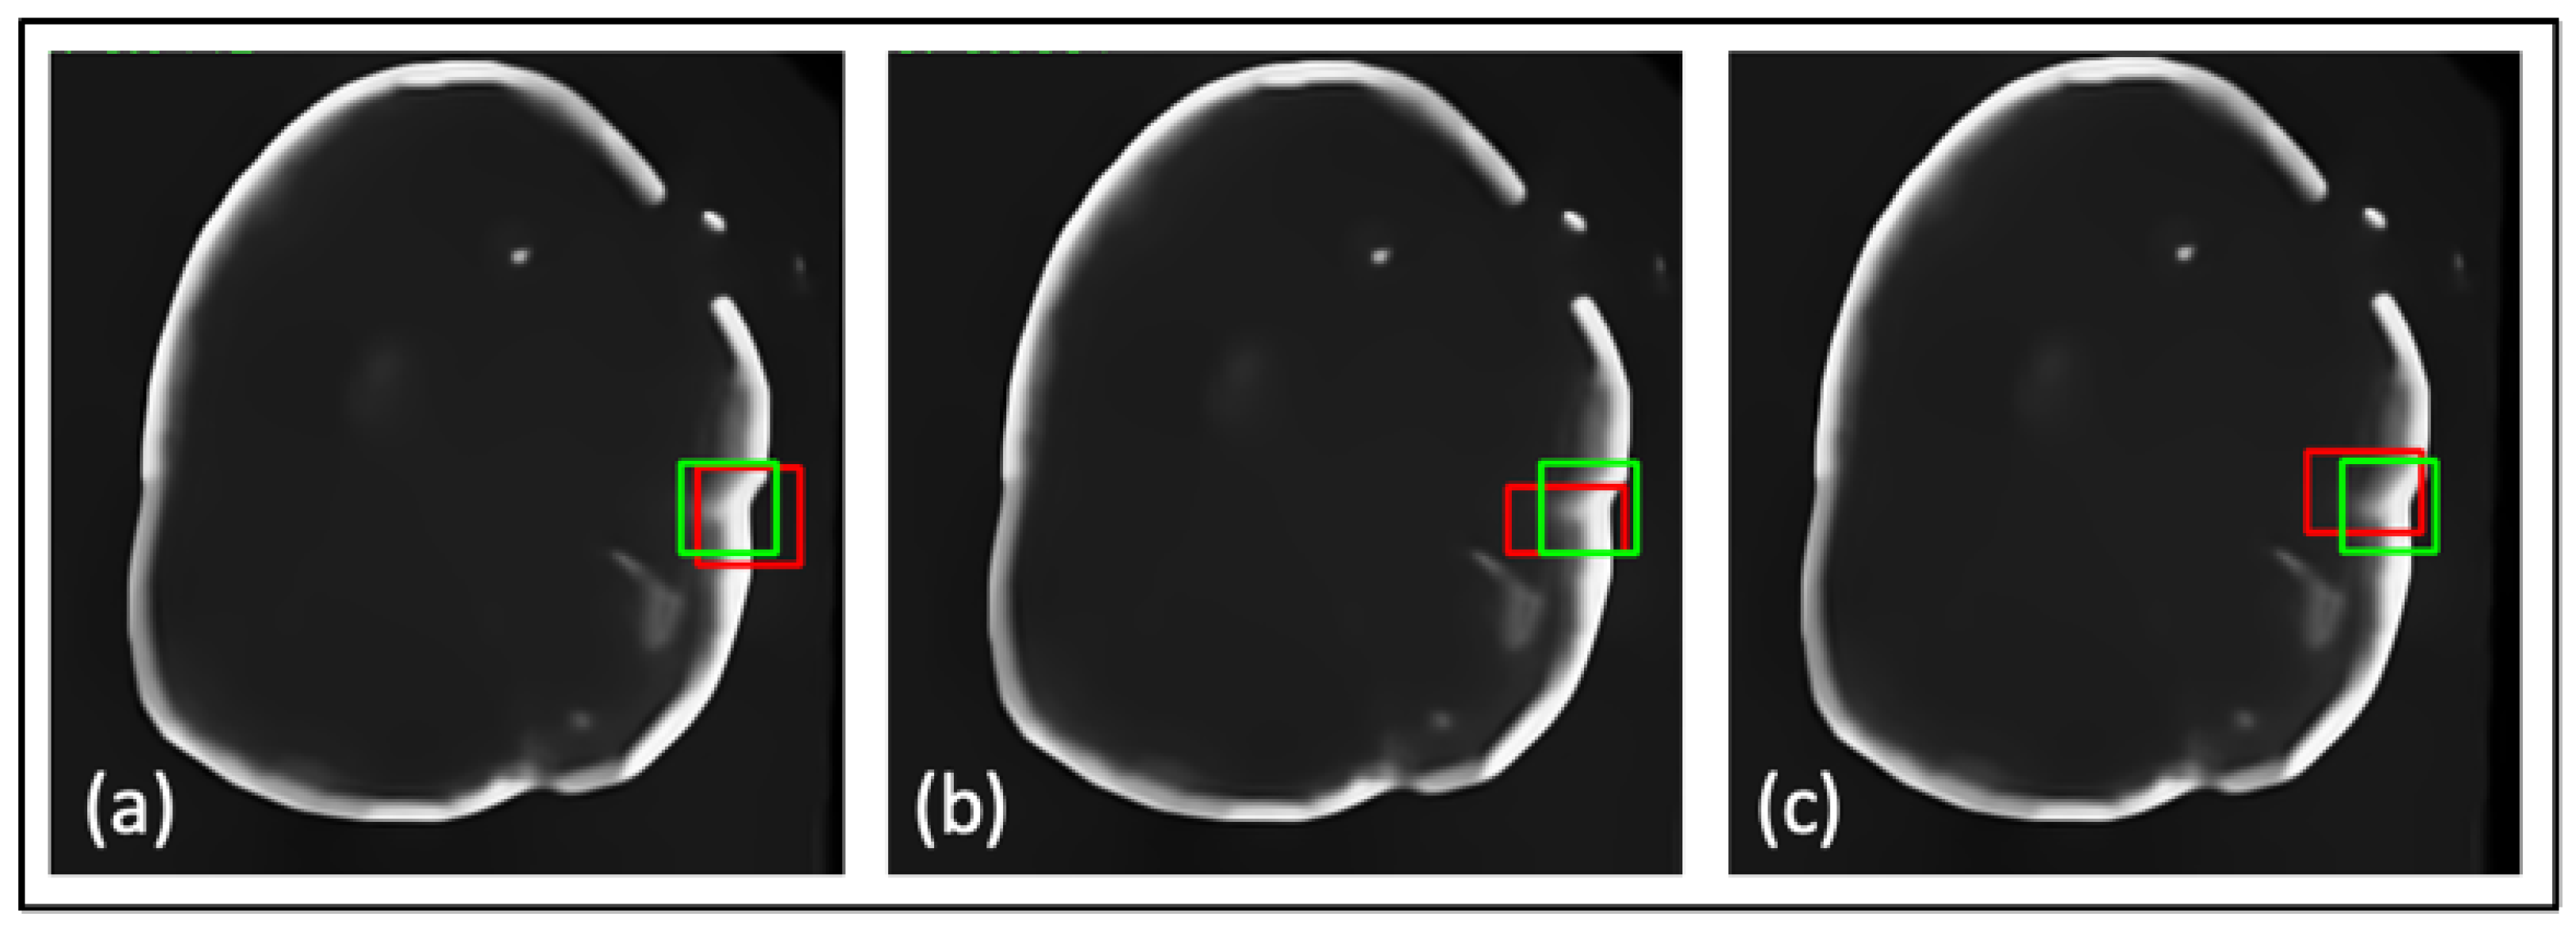
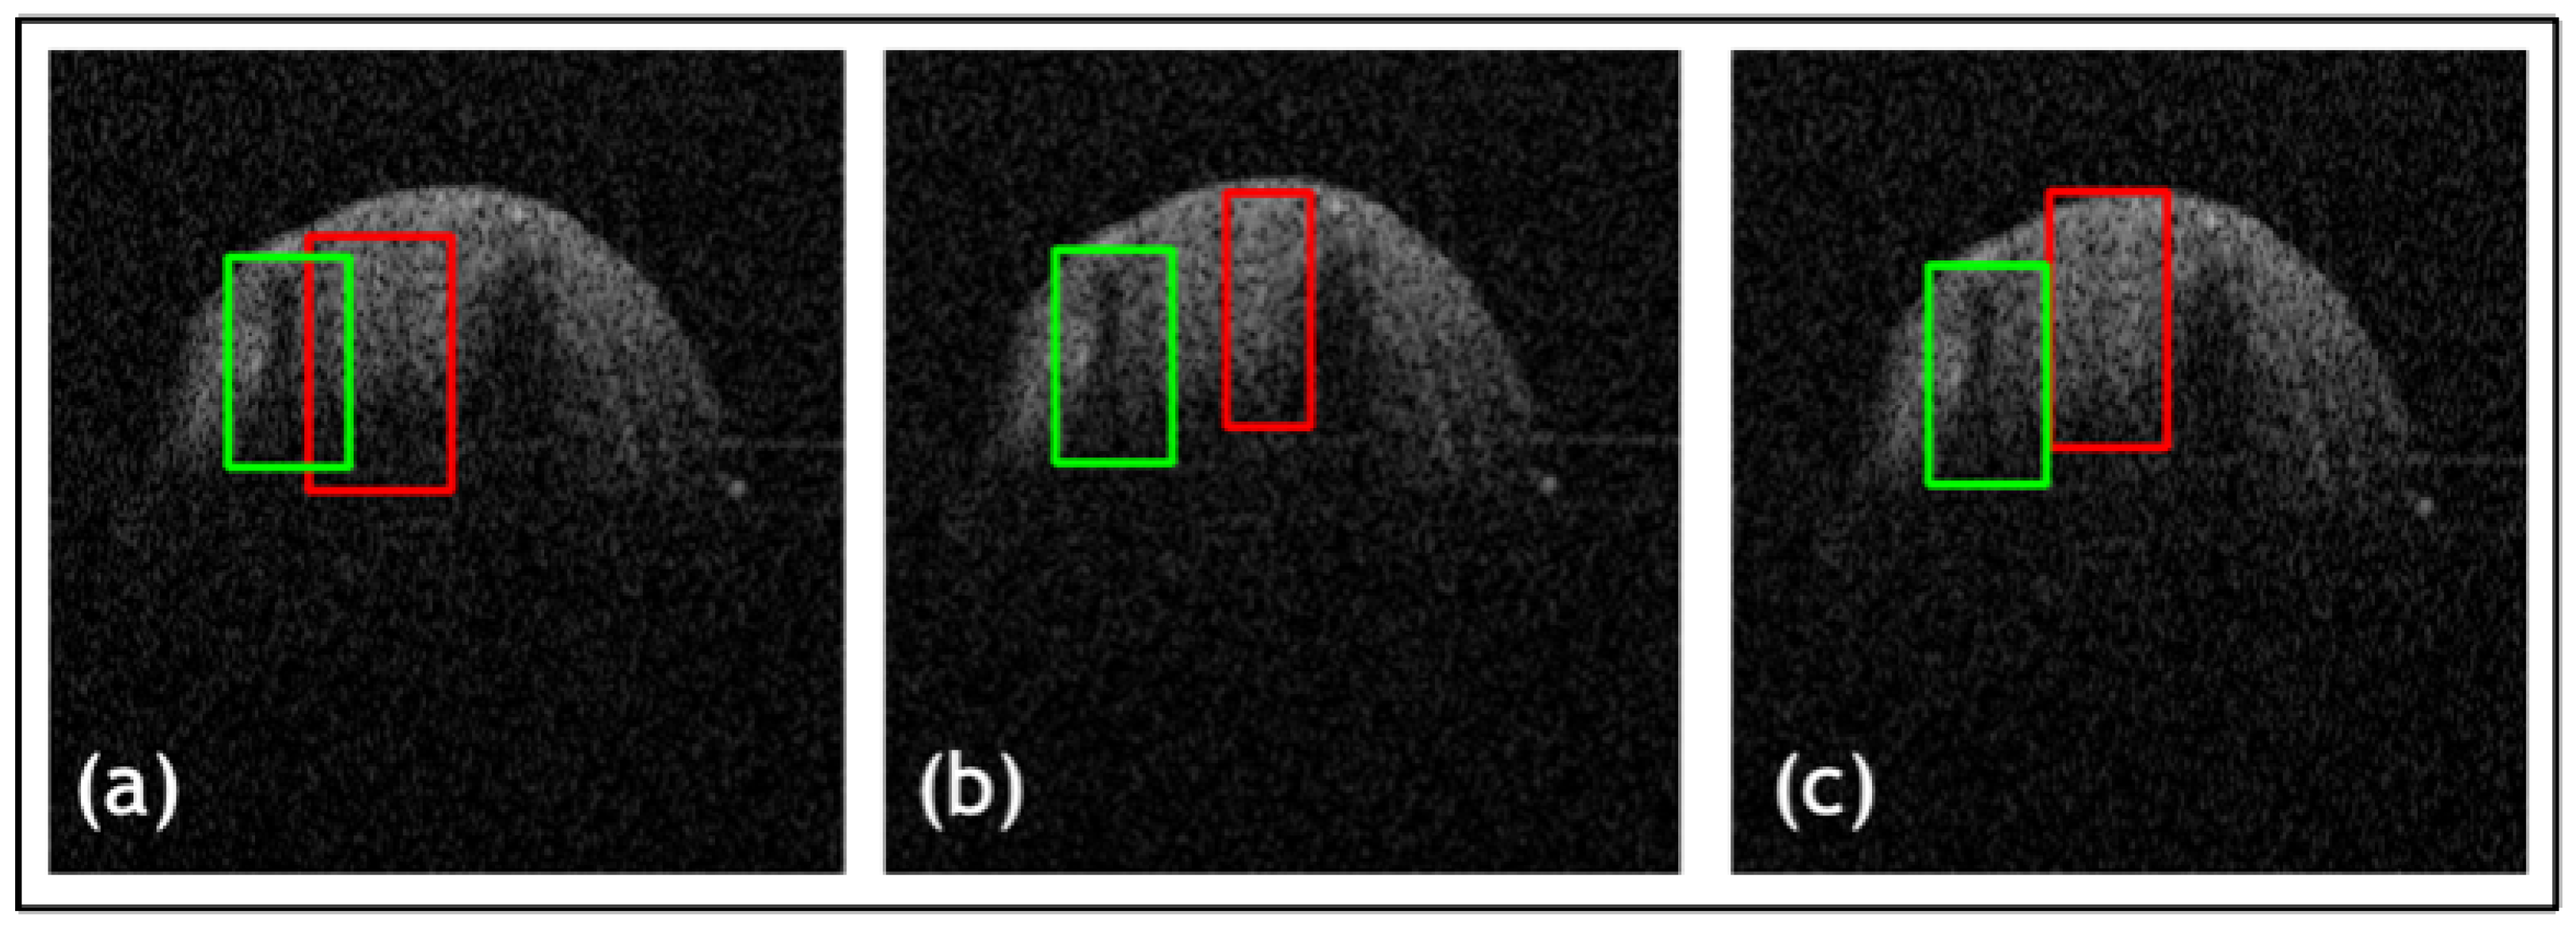
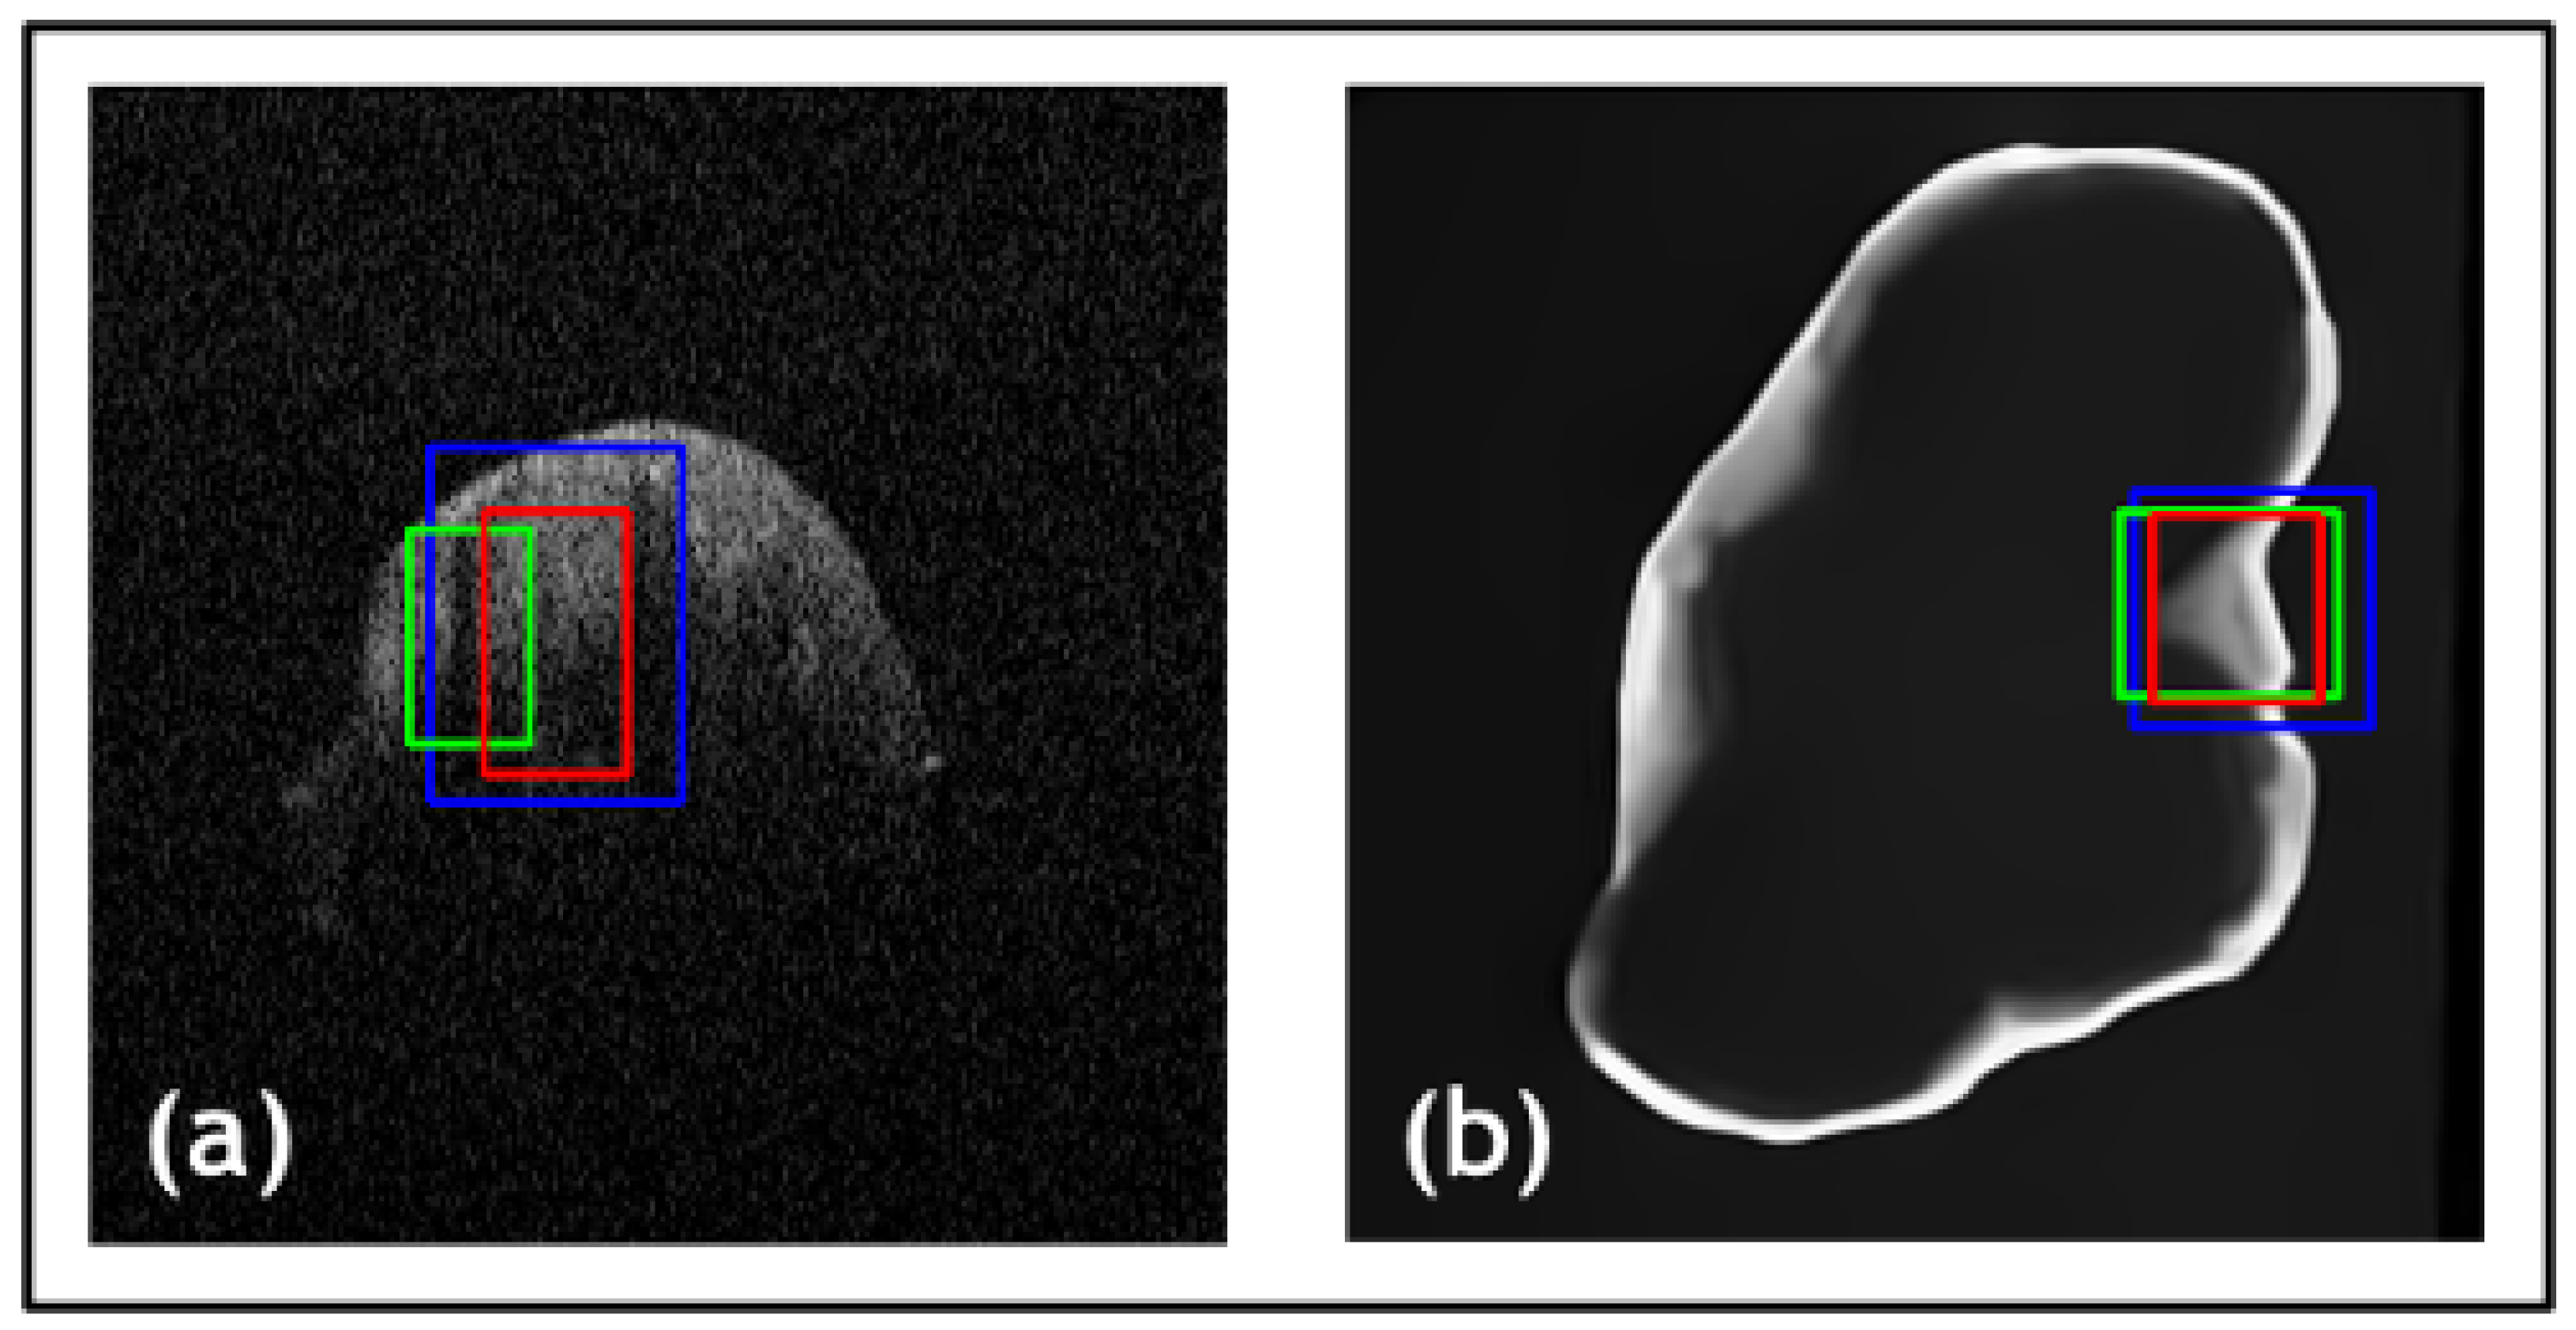
3. Results
3.1. Datasets
3.2. Evaluation Metrics
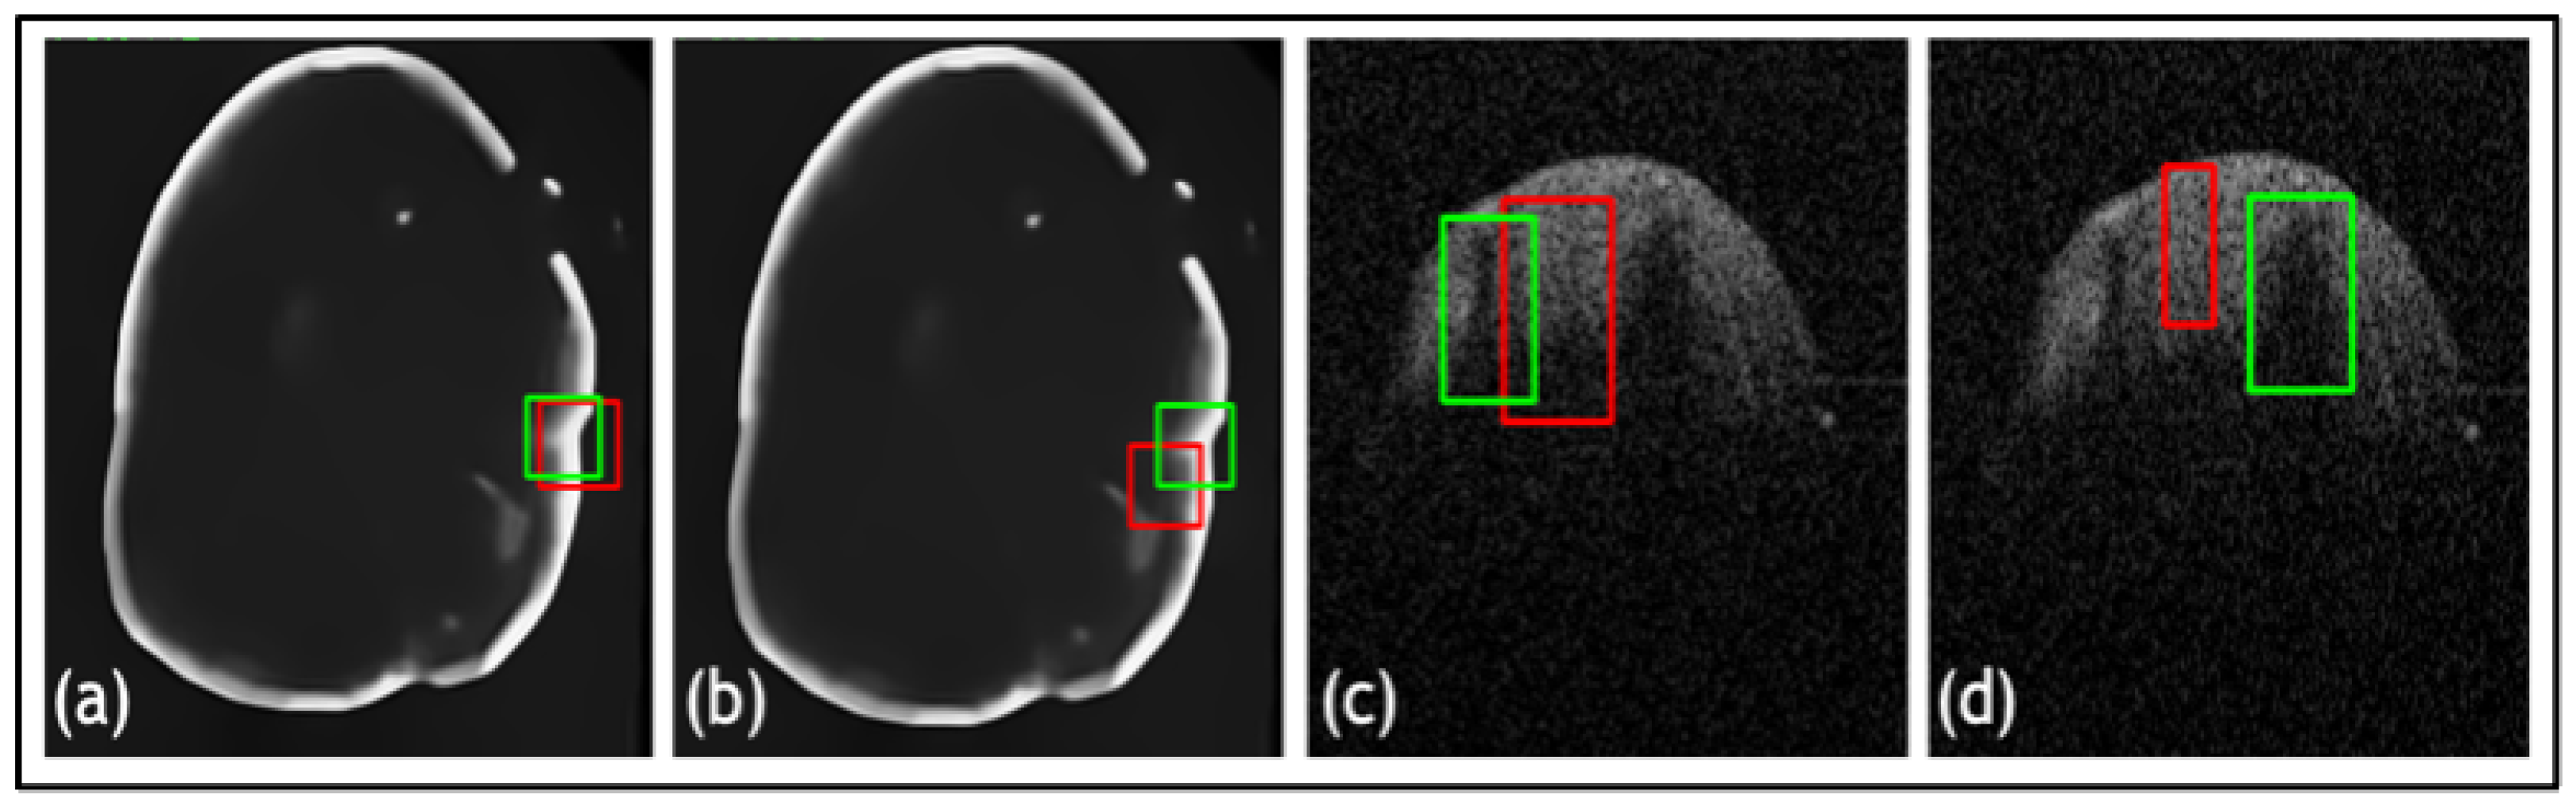
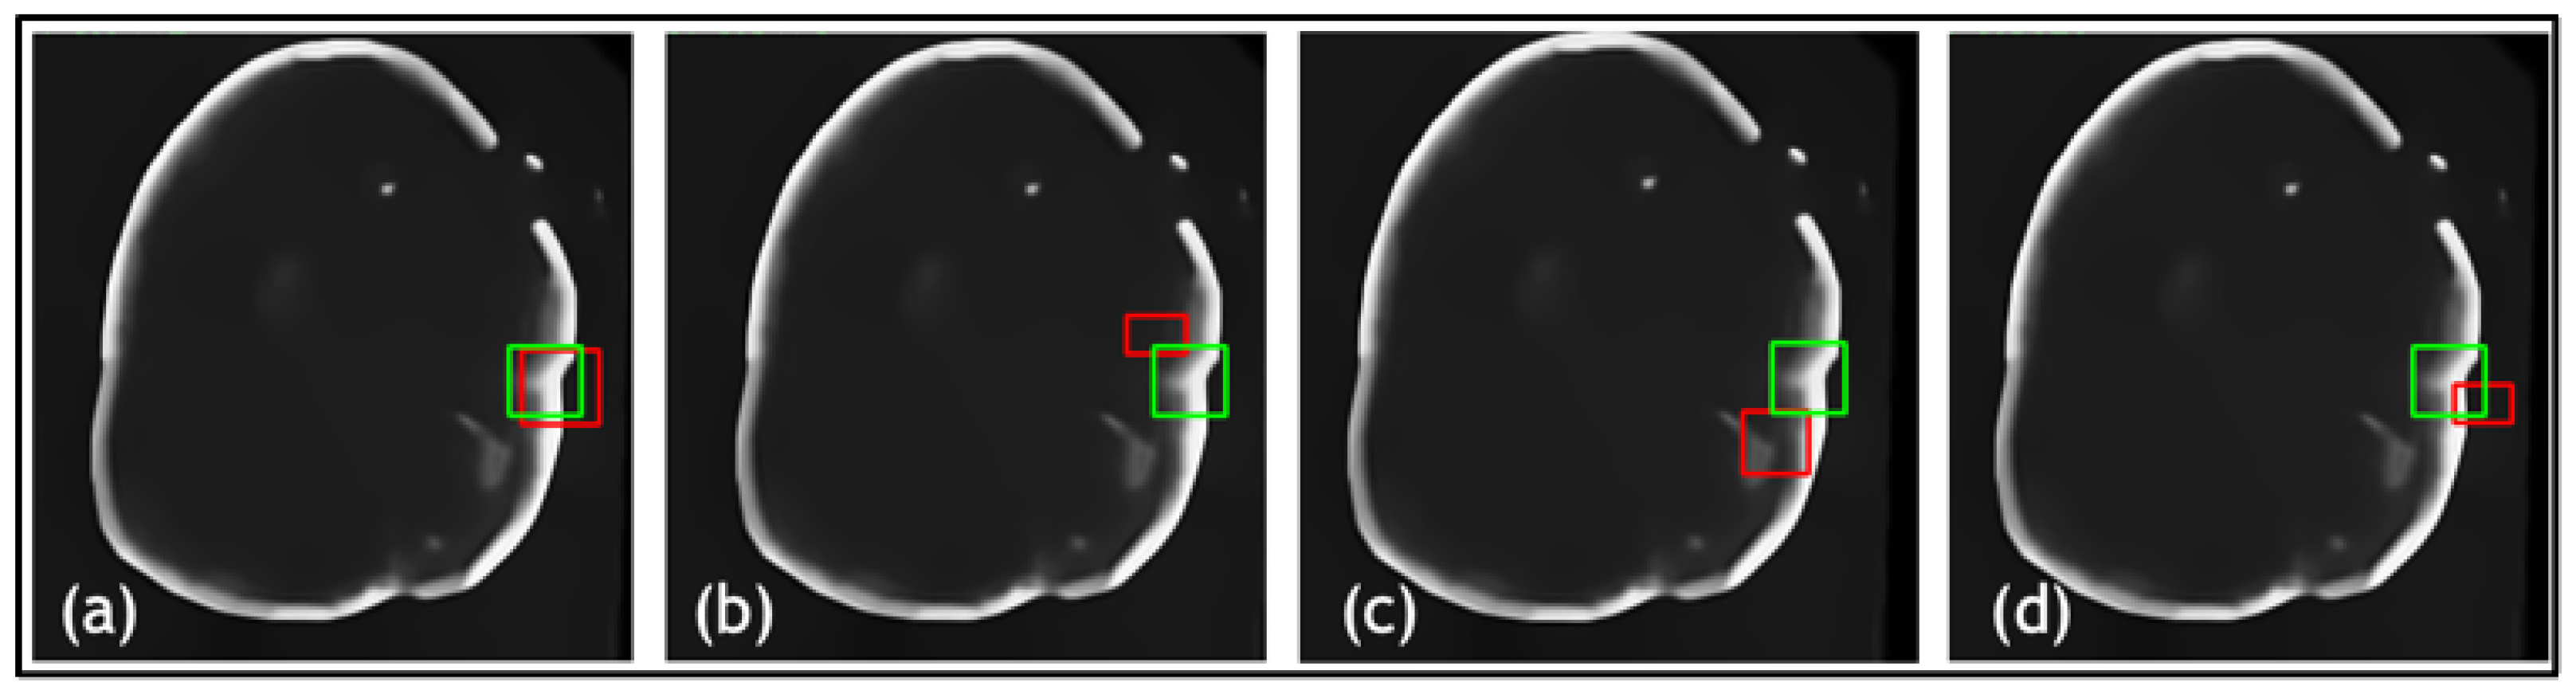
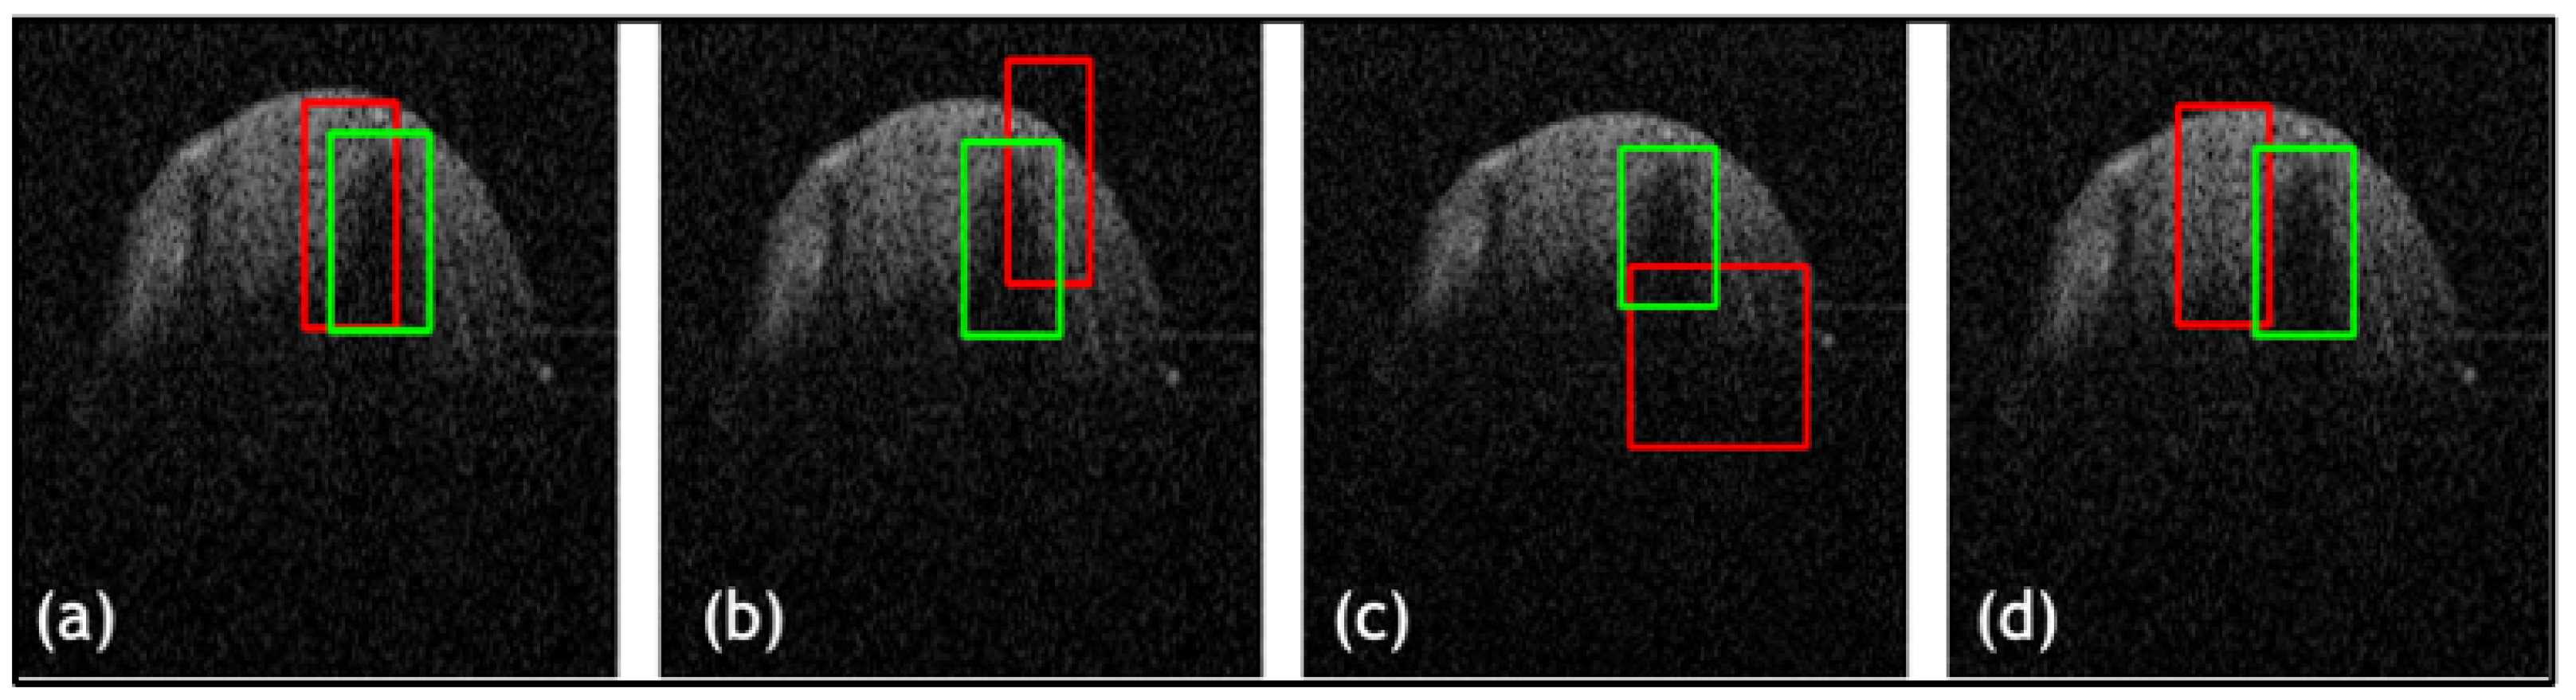
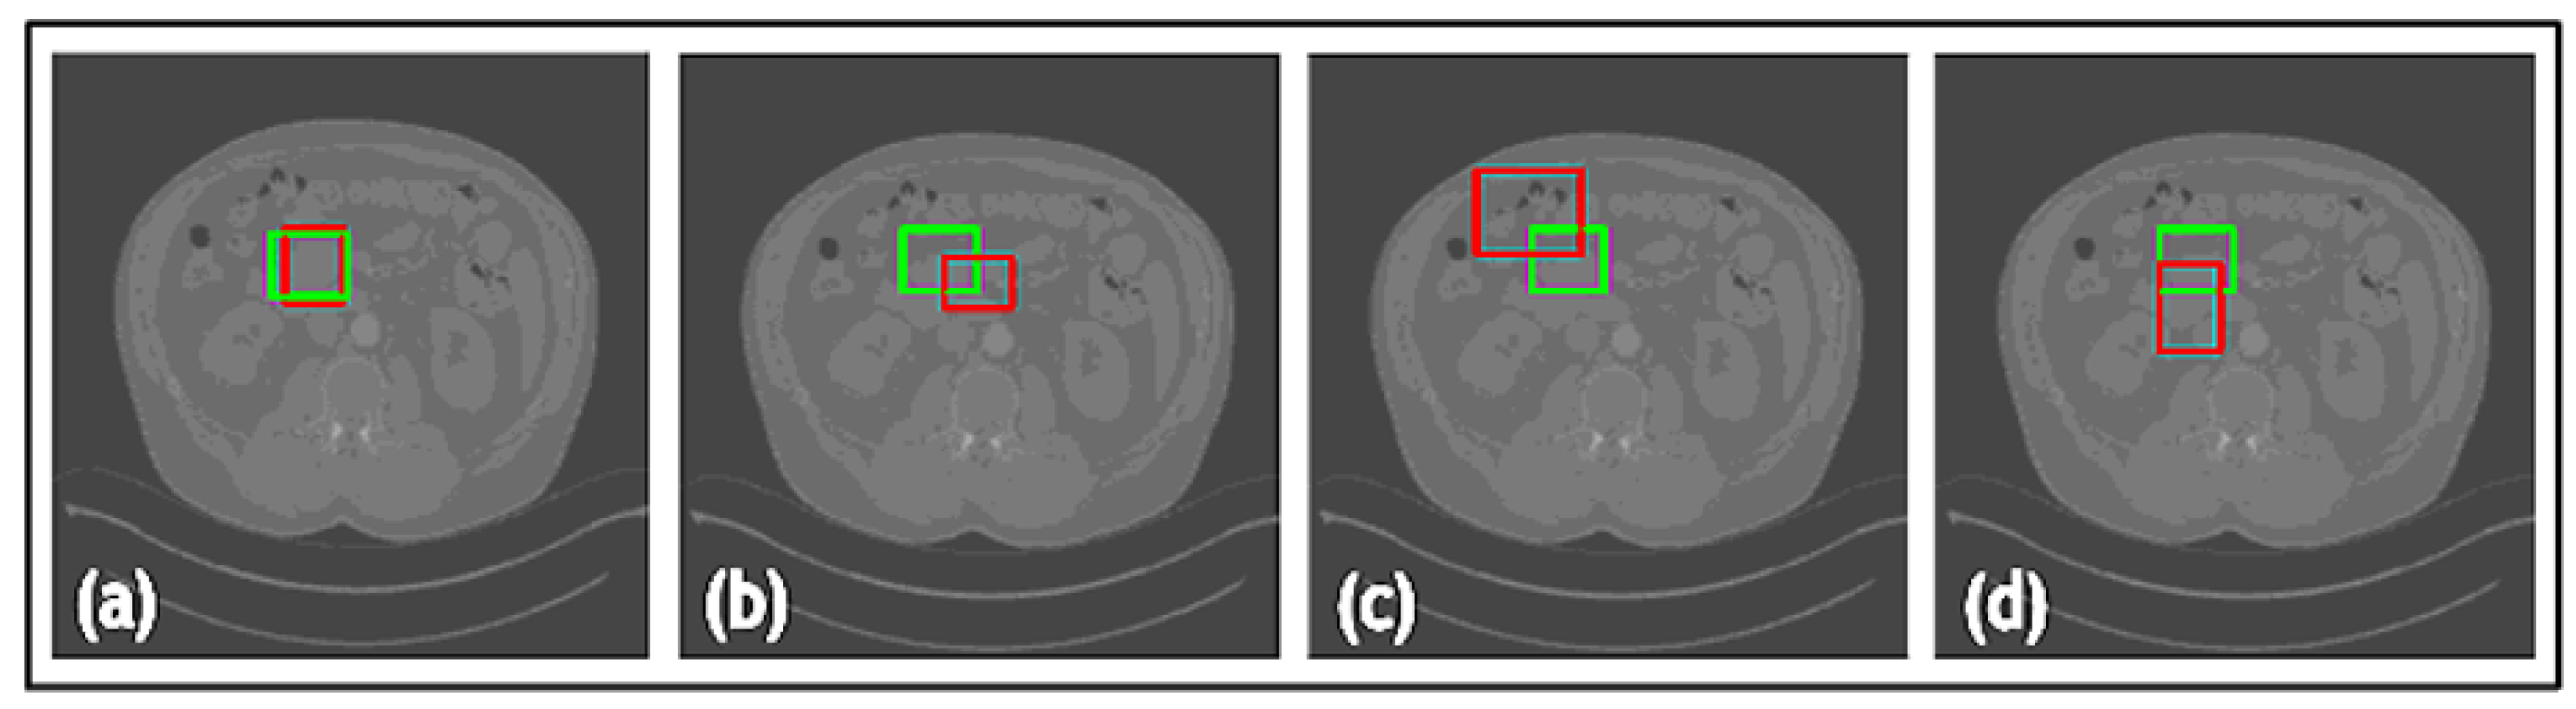
3.3. Ablation Study
3.4. Results and Comparison
4. Discussion
5. Conclusions
Author Contributions
Funding
Institutional Review Board Statement
Informed Consent Statement
Data Availability Statement
Conflicts of Interest
References
- Aumann, S.; Donner, S.; Fischer, J.; Müller, F. Optical Coherence Tomography (OCT): Principle and Technical Realization. In High Resolution Imaging in Microscopy and Ophthalmology; Springer: Berlin/Heidelberg, Germany, 2019; pp. 59–85. [Google Scholar]
- Huang, S.; Tang, C.; Xu, M.; Qiu, Y.; Lei, Z. BM3D-based total variation algorithm for speckle removal with structure-preserving in OCT images. Appl. Opt. 2019, 58, 6233–6243. [Google Scholar] [CrossRef] [PubMed]
- Tey, K.Y.; Teo, K.; Tan, A.C.S.; Devarajan, K.; Tan, B.; Tan, J.; Schmetterer, L.; Ang, M. Optical coherence tomography angiography in diabetic retinopathy: A review of current applications. Eye Vis. 2019, 6, 37. [Google Scholar] [CrossRef] [PubMed]
- Müller, P.L.; Liefers, B.; Treis, T.; Rodrigues, F.G.; Olvera-Barrios, A.; Paul, B.; Dhingra, N.; Lotery, A.; Bailey, C.; Taylor, P.; et al. Reliability of Retinal Pathology Quantification in Age-Related Macular Degeneration: Implications for Clinical Trials and Machine Learning Applications. Transl. Vis. Sci. Technol. 2021, 10, 4. [Google Scholar] [CrossRef] [PubMed]
- Ahmed, H.; Zhanga, Q.; Donnan, R.; Alomainy, A. TEAR cleaning of noisy Optical Coherence Tomography Images. J. Med. Imaging, 2023; submitted. [Google Scholar]
- Ker, J.; Wang, L.; Rao, J.; Lim, T. Deep Learning Applications in Medical Image Analysis. IEEE Access 2017, 6, 9375–9389. [Google Scholar] [CrossRef]
- Li, D.; Fu, Z.; Xu, J. Stacked-autoencoder-based model for COVID-19 diagnosis on CT images. Appl. Intell. 2021, 51, 2805–2817. [Google Scholar] [CrossRef]
- Horry, M.J.; Chakraborty, S.; Paul, M.; Ulhaq, A.; Pradhan, B.; Saha, M.; Shukla, N. COVID-19 Detection through Transfer Learning Using Multimodal Imaging Data. IEEE Access 2020, 8, 149808–149824. [Google Scholar] [CrossRef]
- Roy, K.; Chaudhuri, S.S.; Roy, P.; Chatterjee, S.; Banerjee, S. Transfer learning coupled convolution neural networks in detecting retinal diseases using OCT images. In Intelligent Computing: Image Processing Based Applications; Springer: Singapore, 2020; pp. 153–173. [Google Scholar]
- Ahmad, M.; Kasukurthi, N.; Pande, H. Deep Learning for Weak Supervision of Diabetic Retinopathy Abnormalities. In Proceedings of the IEEE 16th International Symposium on Biomedical Imaging (ISBI 2019), Venice, Italy, 8–11 April 2019. [Google Scholar]
- Prajapati, S.A.; Nagaraj, R.; Mitra, S. Classification of dental diseases using CNN and transfer learning. In Proceedings of the International Symposium on Computational and Business Intelligence (ISCBI), Dubai, United Arab Emirates, 11–14 August 2017. [Google Scholar]
- Holtkamp, A.; Elhennawy, K.; de Oro, J.E.C.G.; Krois, J.; Paris, S.; Schwendicke, F. Generalizability of deep learning models for caries detection in near-infrared light transillumination images. J. Clin. Med. 2021, 10, 961. [Google Scholar] [CrossRef]
- Tripathi, P.; Malathy, C.; Prabhakaran, M. Genetic algorithms based approach for dental caries detection using back propagation neural network. Int. J. Recent Tech. Eng. 2019, 8, 317–319. [Google Scholar]
- Rahimi, H.M.; Motamedian, S.R.; Rohban, M.H.; Krois, J.; Schwendicke, F. Deep learning for caries detection: A systematic review. J. Dent. 2022, 122, 104115. [Google Scholar] [CrossRef]
- Asgari, R.; Waldstein, S.; Schlanitz, F.; Baratsits, M.; Erfurth, U.S.; Bogunovic, H. U-Net with Spatial Pyramid Pooling for Drusen Segmentation in Optical Coherence Tomography. In Ophthalmic Medical Image Analysis; Springer: Cham, Switzerland, 2019; pp. 77–85. [Google Scholar]
- Cantu, A.G.; Gehrung, S.; Krois, J.; Schwendicke, F. Detecting caries lesions of different radiographic extension on bitewings using deep learning. J. Dent. 2020, 100, 103425. [Google Scholar] [CrossRef]
- Roy, A.G.; Conjeti, S.; Carlier, S.G.; Houissa, K.; Sheet, D. Multiscale distribution preserving autoencoders for plaque detection in intravascular optical coherence tomography. In Proceedings of the IEEE 13th International Symposium on Biomedical Imaging (ISBI), Prague, Czech Republic, 13–16 April 2016. [Google Scholar]
- Zhang, X.; Liang, Y.; Li, W.; Liu, C.; Gu, D.; Sun, W.; Miao, L. Development and evaluation of deep learning for screening dental caries from oral photographs. Oral Dis. 2020, 28, 173–181. [Google Scholar] [CrossRef]
- Javid, A.; Rashid, U.; Khattak, A.S. Marking Early Lesions in Labial Colored Dental Images using a Transfer Learning Approach. In Proceedings of the IEEE 23rd International Multitopic Conference (INMIC), Bahawalpur, Pakistan, 5–7 November 2020. [Google Scholar]
- Zhao, L.; Wan, Y. A New Deep Learning Architecture for Person Detection. In Proceedings of the IEEE 5th International Conference on Computer and Communications (ICCC), Chengdu, China, 6–9 December 2019. [Google Scholar]
- Bahdanau, D.; Cho, K.; Bengio, Y. Neural Machine Translation by Jointly Learning to Align and Translate. arXiv 2014, arXiv:1409.0473. [Google Scholar]
- Thirusangu, N.; Almekkawy, M. Segmentation of Breast Ultrasound Images using Densely Connected Deep Convolutional Neural Network and Attention Gates. In Proceedings of the 2021 IEEE UFFC Latin America Ultrasonics Symposium (LAUS), Gainesville, FL, USA, 4–5 October 2021; pp. 1–4. [Google Scholar]
- Liu, X.; Wang, S.; Zhang, Y.; Liu, D.; Hu, W. Automatic fluid segmentation in retinal optical coherence tomography images using attention based deep learning. Neurocomputing 2021, 452, 576–591. [Google Scholar] [CrossRef]
- Dosovitskiy, A.; Beyer, L.; Kolesnikov, A.; Weissenborn, D.; Zhai, X.; Unterthiner, T.; Dehghani, M.; Minderer, M.; Heigold, G.; Gelly, S.; et al. An image is worth 16 × 16 words: Transformers for image recognition at scale. arXiv 2020, arXiv:2010.11929. [Google Scholar]
- Yang, D.; Myronenko, A.; Wang, X.; Xu, Z.; Roth, H.R.; Xu, D. T-AutoML: Automated Machine Learning for Lesion Segmentation Using Transformers in 3D Medical Imaging. In Proceedings of the IEEE/CVF International Conference on Computer Vision (ICCV), Montreal, BC, Canada, 11–17 October 2021; pp. 3962–3974. [Google Scholar]
- Ravishankar, H.; Venkataramani, R.; Anamandra, S.; Sudhakar, P.; Annangi, P. Feature Transformers: Privacy Preserving Lifelong Learners for Medical Imaging. In Proceedings of the MICCAI, Shenzhen, China, 13–17 October 2019; pp. 347–355. [Google Scholar]
- Korkmaz, Y.; Dar, S.U.H.; Yurt, M.; Özbey, M.; Çukur, T. Unsupervised MRI Reconstruction via Zero-Shot Learned Adversarial Transformers. IEEE Trans. Med. Imaging 2022, 41, 1747–1763. [Google Scholar] [CrossRef] [PubMed]
- Hendrycks, D.; Gimpel, K. Gaussian error linear units (gelus). arXiv 2016, arXiv:1606.08415. [Google Scholar]
- Yan, K.; Wang, X.; Lu, L.; Summer, R.M. DeepLesion: Automated Mining of Large-Scale Lesion Annotations and Universal Lesion Detection with Deep Learning. J. Med. Imaging 2018, 5, 036501. [Google Scholar] [CrossRef] [PubMed]
- Redmon, J.; Divvala, S.; Girshick, R.; Farhadi, A. You Only Look Once: Unified, Real-Time Object Detection. In Proceedings of the IEEE CVPR, Las Vegas, NV, USA, 27–30 June 2016; pp. 779–788. [Google Scholar]
- Redmon, J.; Farhadi, A. YOLOv3: An Incremental Improvement. arXiv 2018, arXiv:1804.02767. [Google Scholar]
- Girshick, R.; Donahue, J.; Darrell, T.; Malik, J. Rich feature hierarchies for accurate object detection and semantic segmentation. In Proceedings of the IEEE CVPR, Columbus, OH, USA, 23–28 June 2014; pp. 580–587. [Google Scholar]
- Min, L.S.; Beom, S.J.; Jihye, Y.; Young-Hoon, C.; Jens, V.; Mark, L.S.; Warren, B.G.; Namkug, K. Deep Learning Applications in Chest Radiography and Computed Tomography. J. Thorac. Imaging 2019, 34, 75–85. [Google Scholar]
- Mazurowski, M.A.; Buda, M.; Saha, A.; Bashir, M.R. Deep learning in radiology: An overview of the concepts and a survey of the state of the art with focus on MRI. J. Magn. Reson. Imaging 2019, 49, 939–954. [Google Scholar] [CrossRef]


| Net | Accuracy | Precision | F1 Score | IOU |
|---|---|---|---|---|
| Dentistry Dataset 1 | ||||
| TED-MSE | 0.72 | 0.72 | 0.76 | 0.66 |
| TED-MAE | 0.68 | 0.68 | 0.78 | 0.68 |
| TED- | 0.89 | 0.89 | 0.84 | 0.83 |
| Dentistry Dataset 2 | ||||
| TED-MSE | 0.80 | 0.80 | 0.84 | 0.81 |
| TED-MAE | 0.92 | 0.92 | 0.90 | 0.71 |
| TED- | 0.96 | 0.96 | 0.98 | 0.84 |
| NIH DeepLesion Dataset | ||||
| TED-MSE | 0.87 | 0.87 | 0.83 | 0.70 |
| TED-MAE | 0.90 | 0.90 | 0.85 | 0.73 |
| TED- | 0.97 | 0.97 | 0.98 | 0.81 |
| Net | Accuracy | Precision | F1 Score | IOU |
|---|---|---|---|---|
| Dentistry Dataset 1 | ||||
| TED—without AG | 0.82 | 0.82 | 0.78 | 0.73 |
| TED—with AG | 0.89 | 0.89 | 0.84 | 0.83 |
| Dentistry Dataset 2 | ||||
| TED—without AG | 0.88 | 0.88 | 0.84 | 0.74 |
| TED—with AG | 0.96 | 0.96 | 0.98 | 0.84 |
| Net | Accuracy | Precision | F1 Score | IOU |
|---|---|---|---|---|
| Dentistry Dataset 1 | ||||
| YOLOv1 [30] | 0.73 | 0.73 | 0.84 | 0.67 |
| YOLOv3 [31] | 0.74 | 0.74 | 0.85 | 0.69 |
| Mask-RCNN [32] | 0.76 | 0.76 | 0.86 | 0.79 |
| TED- | 0.89 | 0.89 | 0.84 | 0.83 |
| Dentistry Dataset 2 | ||||
| YOLOv1 [30] | 0.93 | 0.93 | 0.96 | 0.77 |
| YOLOv3 [31] | 0.87 | 0.87 | 0.93 | 0.79 |
| Mask-RCNN [32] | 0.74 | 0.74 | 0.86 | 0.73 |
| TED- | 0.96 | 0.96 | 0.98 | 0.84 |
| NIH DeepLesion Dataset | ||||
| YOLOv1 [30] | 0.88 | 0.88 | 0.94 | 0.54 |
| YOLOv3 [31] | 0.94 | 0.94 | 0.96 | 0.61 |
| Mask-RCNN [32] | 0.71 | 0.71 | 0.83 | 0.53 |
| TED- | 0.97 | 0.97 | 0.98 | 0.81 |
| Net | Time Taken (Min s) |
|---|---|
| Dentistry Dataset 1 | |
| YOLOv1 [30] | 10 m 36 s |
| YOLOv3 [31] | 20 m 3 s |
| Mask-RCNN [32] | 9 m 25 s |
| TED- | 9 m 51 s |
| Dentistry Dataset 2 | |
| YOLOv1 [30] | 10 m 33 s |
| YOLOv3 [31] | 20 m 13 s |
| Mask-RCNN [32] | 10 m 46 s |
| TED- | 10 m 2 s |
| NIH DeepLesion Dataset | |
| YOLOv1 [30] | 6 m 32 s |
| YOLOv3 [31] | 7 m 44 s |
| Mask-RCNN [32] | 4 m 25 s |
| TED- | 3 m 59 s |
Disclaimer/Publisher’s Note: The statements, opinions and data contained in all publications are solely those of the individual author(s) and contributor(s) and not of MDPI and/or the editor(s). MDPI and/or the editor(s) disclaim responsibility for any injury to people or property resulting from any ideas, methods, instructions or products referred to in the content. |
© 2023 by the authors. Licensee MDPI, Basel, Switzerland. This article is an open access article distributed under the terms and conditions of the Creative Commons Attribution (CC BY) license (https://creativecommons.org/licenses/by/4.0/).
Share and Cite
Ahmed, H.; Zhang, Q.; Wong, F.; Donnan, R.; Alomainy, A. Lesion Detection in Optical Coherence Tomography with Transformer-Enhanced Detector. J. Imaging 2023, 9, 244. https://doi.org/10.3390/jimaging9110244
Ahmed H, Zhang Q, Wong F, Donnan R, Alomainy A. Lesion Detection in Optical Coherence Tomography with Transformer-Enhanced Detector. Journal of Imaging. 2023; 9(11):244. https://doi.org/10.3390/jimaging9110244
Chicago/Turabian StyleAhmed, Hanya, Qianni Zhang, Ferranti Wong, Robert Donnan, and Akram Alomainy. 2023. "Lesion Detection in Optical Coherence Tomography with Transformer-Enhanced Detector" Journal of Imaging 9, no. 11: 244. https://doi.org/10.3390/jimaging9110244
APA StyleAhmed, H., Zhang, Q., Wong, F., Donnan, R., & Alomainy, A. (2023). Lesion Detection in Optical Coherence Tomography with Transformer-Enhanced Detector. Journal of Imaging, 9(11), 244. https://doi.org/10.3390/jimaging9110244