


A Feature Extraction Using Probabilistic Neural Network and BTFSC-Net Model with Deep Learning for Brain Tumor Classification

 ,
,  , , ,
, , ,  , ,
, ,  ,
,
Abstract
1. Introduction
- Preprocessing, fusion, segmentation, and classification steps were combined to create a brand-new BTFSC-Net model that no other authors have yet created.
- The original purpose of HPWF was to improve the contrast, brightness, and color qualities of MRI and CT medical images by removing various noises from them.
- The REA analysis is combined with the input data MRI and CT images using DLCNN-based fusion network, which identified the tumor region.
- For the separation of a tumor region from a fused image, the HFCMIK method is used to further characterize the major region of the brain tumor.
- Using the gray-level cooccurrence matrix (GLCM), redundant discrete wavelet transform (RDWT) trained features, the classification of benign and malignant tumors is achieved using DLPNN.
- Data from simulations illustrate that the designed approach outperformed state-of-the-art methodology.
2. Proposed Methodology
2.1. Hybrid Probabilistic Wiener Filter Method (HPWF)
2.2. Proposed Fusion Strategy
2.2.1. Robust Edge Analysis
2.2.2. DLCNN-based Fusion Network
2.3. Proposed Hybrid Fuzzy Segmentation Model
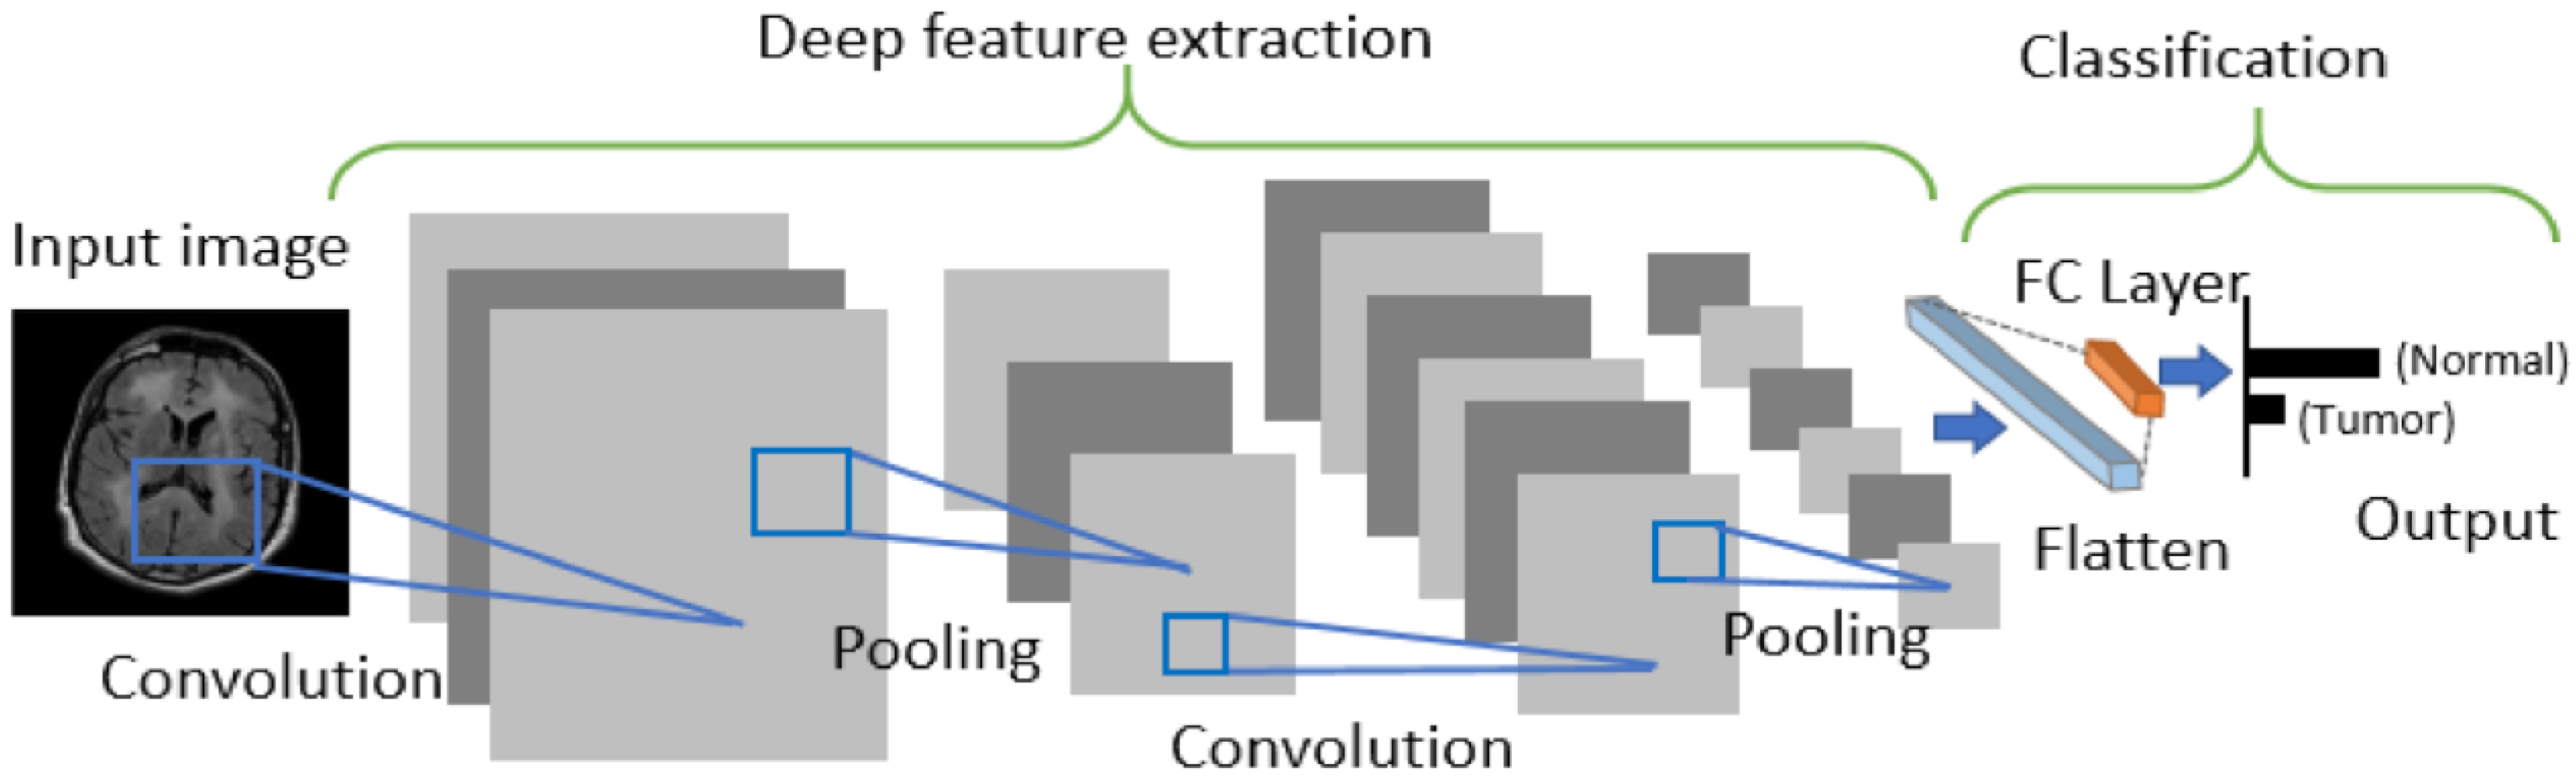
2.4. Proposed Hybrid Feature Extraction
2.5. Proposed DLPNN Classification
3. Results and Discussion
3.1. Data Set
3.2. Fusion Process’s Performance Measurement
3.3. Proposed Segmentation Method
3.4. Proposed Classification Methodology
4. Discussion
5. Conclusions
Author Contributions
Funding
Institutional Review Board Statement
Informed Consent Statement
Data Availability Statement
Conflicts of Interest
Abbreviation
| Abbreviations | Specification | Abbreviations | Specification |
| BTFSC-Net | Brain Tumor Fusion-Based Segments and Classification–Non-Enhancing Tumor | FTTL | Fine-Tuning-Based Transfer Learning |
| HPWF | Hybrid Probabilistic Wiener Filter | GAN-VE | Generative Adversarial Networks Based on Variational Autoencoders |
| REA | Robust Edge Analysis | HDNN | Hybrid Deep Neural Network |
| DLCNN | Deep Learning Convolutional Neural Networks | AKMC | Adaptive k-means Clustering |
| HFCMIK | Hybrid Fuzzy C-Means Integrated K-Means | FKCM | Fuzzy Kernel C Means |
| RDWT | Redundant Discrete Wavelet Transform | MRI-MRA | Magnetic Resonance Angiography |
| GLCM | Gray-Level Cooccurrence Matrix | SACC | Segmentation Accuracy |
| DLPNN | Deep Learning Probabilistic Neural Network | SSEN | Sensitivity |
| MIF | Medical Image Fusion | SPEC | Specificity |
| MRI | Magnetic Resonance Imaging | SPR | Precision |
| CT | Computed Tomography | SNPV | Negative Predictive Value |
| PSO | Particle Swarm Optimization | SPVR | Segmentation False Positive Rate |
| MSD | Multi-Scale Decomposition | SFDR | Segmentation False Discovery Rate |
| MMIF | Multimodal Medical Images Fusion | SFNR | Segmentation False Negative Rate |
| MRI-SPECT | Single Photon Emission Computed Tomography | SF1 | Segmentation F1-Score |
| MRI-PET | Positron Emission Tomography | SMCC | Segmentation Matthew’s Correlation Coefficient |
| NSST | Nonsubsampled Shearlet Transform Domain | CACC | Classification Accuracy |
| MCA-CS | Morphological Component Analysis-Based Convolutional Sparsity | CSEN | Sensitivity |
| LTEM | Laws Of Texture Energy Measures | CPEC | Specificity |
| GFSR | Raph Filter And Sparse Representation | CPR | Precision |
| PCA | Principal Component Analysis | CNPV | Negative Predictive Value |
| NSCT | Non-Subsampled Contourlet Transform | CPVR | False Positive Rate |
| CNP | Coupled Neural P | CFDR | False Discovery Rate |
| FLS-CNN | Fast Level Set-Based CNN | CFNR | False Negative Rate |
| BFC-HDA | Bayesian Fuzzy Clustering With Hybrid Deep Autoencoder | CF1 | Classification F1-Score |
| SDAN | Symmetric-Driven Adversarial Network | CMCC | Classification Matthew’s Correlation Coefficient |
| DLSDA | Deep Learning With Synthetic Data Augmentation |
References
- Rao, C.S.; Karunakara, K. A comprehensive review on brain tumor segmentation and classification of MRI images. Multimed. Tools Appl. 2021, 80, 17611–17643. [Google Scholar] [CrossRef]
- Rasool, M.; Ismail, N.A.; Boulila, W.; Ammar, A.; Samma, H.; Yafooz, W.; Emara, A.H.M. A Hybrid Deep Learning Model for Brain Tumor Classification. Entropy 2022, 24, 799. [Google Scholar] [CrossRef]
- Maqsood, S.; Javed, U. Multi-modal medical image fusion based on two-scale image decomposition and sparse representation. Biomed. Signal Process. Control 2020, 57, 01810. [Google Scholar] [CrossRef]
- Dian, R.; Li, S.; Fang, L.; Lu, T.; Bioucas-Dias, J.M. Nonlocal sparse tensor factorization for semiblind hyperspectral and multispectral image fusion. IEEE Trans. Cybern. 2019, 50, 4469–4480. [Google Scholar] [CrossRef] [PubMed]
- Jose, J.; Gautam, N.; Tiwari, M.; Tiwari, T.; Suresh, A.; Sundararaj, V.; Rejeesh, M.R. An image quality enhancement scheme employing adolescent identity search algorithm in the NSST domain for multimodal medical image fusion. Biomed. Signal Process. Control. 2021, 66, 102480. [Google Scholar] [CrossRef]
- Daniel, E. Optimum wavelet-based homomorphic medical image fusion using hybrid genetic–grey wolf optimization algorithm. IEEE Sens. J. 2018, 18, 6804–6811. [Google Scholar] [CrossRef]
- Shehanaz, S.; Daniel, E.; Guntur, S.R.; Satrasupalli, S. Optimum weighted multimodal medical image fusion using particle swarm optimization. Optik 2021, 231, 1–12. [Google Scholar] [CrossRef]
- Padmavathi, K.; Asha, C.S.; Maya, V.K. A novel medical image fusion by combining TV-L1 decomposed textures based on adaptive weighting scheme. Eng. Sci. Technol. Int. J. 2020, 23, 225–239. [Google Scholar] [CrossRef]
- Tirupal, T.; Mohan, B.C.; Kumar, S.S. Multimodal medical image fusion techniques—A review. Curr. Signal Transduct. Ther. 2021, 16, 142–163. [Google Scholar] [CrossRef]
- Li, B.; Luo, X.; Wang, J.; Song, X.; Pérez-Jiménez, M.J.; Riscos-Núñez, A. Medical image fusion method based on coupled neural p systems in nonsubsampled shearlet transform domain. Int. J. Neural Syst. 2020, 31, 2050050. [Google Scholar] [CrossRef]
- Zhu, Z.; Zheng, M.; Qi, G.; Wang, D.; Xiang, Y. A phase congruency and local Laplacian energy based multi-modality medical image fusion method in NSCT domain. IEEE Access 2019, 7, 20811–20824. [Google Scholar] [CrossRef]
- Yin, M.; Li, X.; Liu, Y.; Chen, X. Medical image fusion with parameter-adaptive pulse coupled neural network in nonsubsampled shearlet transform domain. IEEE Trans. Inst. Meas. 2019, 68, 49–64. [Google Scholar] [CrossRef]
- Dutta, S.; Banerjee, A. Highly precise modified blue whale method framed by blending bat and local search algorithm for the optimality of image fusion algorithm. J. Soft Comput. Paradig. 2020, 2, 195–208. [Google Scholar] [CrossRef]
- Liu, Y.; Chen, X.; Ward, R.K.; Wang, Z.J. Medical image fusion via convolutional sparsity based morphological component analysis. IEEE Signal Process. Lett. 2019, 26, 485–489. [Google Scholar] [CrossRef]
- Padma, G.; Prasad, A.D. Medical image fusion based on laws of texture energy measures in stationary wavelet transform domain. Int. J. Imaging Syst. Technol. 2020, 30, 544–557. [Google Scholar]
- Li, Q.; Wang, W.; Chen, G.; Zhao, D. Medical image fusion using segment graph filter and sparse representation. Comput. Biol. Med. 2021, 131, 104239. [Google Scholar] [CrossRef]
- Ding, Z.; Zhou, D.; Nie, R.; Hou, R.; Liu, Y. Brain medical image fusion based on dual-branch CNNs in NSST domain. BioMed Res. Int. 2020, 2020, 1–15. [Google Scholar] [CrossRef]
- Hu, Q.; Hu, S.; Zhang, F. Multi-modality medical image fusion based on separable dictionary learning and Gabor filtering. Signal Process. Image Commun. 2020, 83, 115758. [Google Scholar] [CrossRef]
- Kong, W.; Miao., Q.; Lei, Y. Multimodal sensor medical image fusion based on local difference in non-subsampled domain. IEEE Trans. Inst. Meas. 2019, 68, 938–951. [Google Scholar] [CrossRef]
- Li, X.; Guo, X.; Han, P.; Wang, X.; Li, H.; Luo, T. Laplacian redecomposition for multimodal medical image fusion. IEEE Trans. Instrum. Meas. 2020, 69, 6880–6890. [Google Scholar] [CrossRef]
- Li, Y.; Zhao, J.; Lv, Z.; Li, J. Medical image fusion method by deep learning. Int. J. Cogn. Comput. Eng. 2021, 2, 21–29. [Google Scholar] [CrossRef]
- Faragallah, O.S.; El-Hoseny, H.; El-Shafai, W.; Abd El-Rahman, W.; El-Sayed, H.S.; El-Rabaie, E.S.M.; Abd El-Samie, F.E.; Geweid, G.G. A comprehensive survey analysis for present solutions of medical image fusion and future directions. IEEE Access 2020, 9, 11358–11371. [Google Scholar] [CrossRef]
- Azam, M.A.; Khan, K.B.; Salahuddin, S.; Rehman, E.; Khan, S.A.; Khan, M.A.; Kadry, S.; Gandomi, A.H. A review on multimodal medical image fusion: Compendious analysis of medical modalities, multimodal databases, fusion techniques and quality metrics. Comput. Biol. Med. 2022, 144, 105253. [Google Scholar] [CrossRef]
- Wang, K.; Zheng, M.; Wei, H.; Qi, G.; Li, Y. Multi-modality medical image fusion using convolutional neural network and contrast pyramid. Sensors 2020, 20, 2169. [Google Scholar] [CrossRef]
- Kaur, M.; Singh, D. Multi-modality medical image fusion technique using multi-objective differential evolution based deep neural networks. J. Ambient. Intell. Humaniz. Comput. 2021, 12, 2483–2493. [Google Scholar] [CrossRef]
- Zhao, C.; Wang, T.; Lei, B. Medical image fusion method based on dense block and deep convolutional generative adversarial network. Neural Comput. Appl. 2021, 33, 6595–6610. [Google Scholar] [CrossRef]
- Raja, P.M.S.; Rani, A.V. Brain tumor classification using a hybrid deep autoencoder with Bayesian fuzzy clustering-based segmentation approach. Biocybern. Biomed. Eng. 2020, 40, 440–453. [Google Scholar] [CrossRef]
- Wu, X.; Bi, L.; Fulham, M.; Feng, D.D.; Zhou, L.; Kim, J. Unsupervised brain tumor segmentation using a symmetric-driven adversarial network. Neurocomputing 2021, 455, 242–254. [Google Scholar] [CrossRef]
- Díaz-Pernas, F.J.; Martínez-Zarzuela, M.; Antón-Rodríguez, M.; González-Ortega, D. A deep learning approach for brain tumor classification and segmentation using a multiscale convolutional neural network. Healthc. Multidiscip. Digit. Publ. Inst. 2021, 9, 153. [Google Scholar] [CrossRef]
- Khan, A.; RKhan, S.; Harouni, M.; Abbasi, R.; Iqbal, S.; Mehmood, Z. Brain tumor segmentation using K-means clustering and deep learning with synthetic data augmentation for classification. Microsc. Res. Tech. 2021, 84, 1389–1399. [Google Scholar] [CrossRef]
- Swati, Z.N.K.; Zhao, Q.; Kabir, M.; Ali, F.; Ali, Z.; Ahmed, S.; Lu, J. Brain tumor classification for MR images using transfer learning and fine-tuning. Comput. Med. Imaging Graph. 2019, 75, 34–46. [Google Scholar] [CrossRef] [PubMed]
- Gumaei, A.; Hassan, M.M.; Hassan, M.R.; Alelaiwi, A.; Fortino, G. A hybrid feature extraction method with regularized extreme learning machine for brain tumor classification. IEEE Access 2019, 7, 36266–36273. [Google Scholar] [CrossRef]
- Deepak, S.; Ameer, P.M. Brain tumor classification using deep CNN features via transfer learning. Comput. Biol. Med. 2019, 111, 103345. [Google Scholar] [CrossRef]
- Polat, Ö.; Cahfer, G. Classification of brain tumors from MR images using deep transfer learning. J. Supercomput. 2021, 77, 7236–7252. [Google Scholar] [CrossRef]
- Naik, N.; Rallapalli, Y.; Krishna, M.; Vellara, A.S.; KShetty, D.; Patil, V.; Hameed, B.Z.; Paul, R.; Prabhu, N.; Rai, B.P.; et al. Demystifying the Advancements of Big Data Analytics in Medical Diagnosis: An Overview. Eng. Sci. 2021, 19, 42–58. [Google Scholar] [CrossRef]
- Sharma, D.; Kudva, V.; Patil, V.; Kudva, A.; Bhat, R.S. A Convolutional Neural Network Based Deep Learning Algorithm for Identification of Oral Precancerous and Cancerous Lesion and Differentiation from Normal Mucosa: A Retrospective Study. Eng. Sci. 2022, 18, 278–287. [Google Scholar] [CrossRef]
- Maqsood, S.; Damaševičius, R.; Maskeliūnas, R. Multi-modal brain tumor detection using deep neural network and multiclass SVM. Medicina 2022, 58, 1090. [Google Scholar] [CrossRef]
- Abd El Kader, I.; Xu, G.; Shuai, Z.; Saminu, S.; Javaid, I.; Ahmad, I.S. Differential deep convolutional neural network model for brain tumor classification. Brain Sci. 2021, 11, 352. [Google Scholar] [CrossRef]
- Mzoughi, H.; Njeh, I.; Wali, A.; Slima, M.B.; BenHamida, A.; Mhiri, C.; Mahfoudhe, K.B. Deep multi-scale 3D convolutional neural network (CNN) for MRI gliomas brain tumor classification. J. Digit. Imaging 2020, 33, 903–915. [Google Scholar] [CrossRef]
- Ahmad, B.; Sun, J.; You, Q.; Palade, V.; Mao, Z. Brain Tumor Classification Using a Combination of Variational Autoencoders and Generative Adversarial Networks. Biomedicines 2022, 10, 223. [Google Scholar] [CrossRef]
- Sasank, V.V.S.; Venkateswarlu, S. Hybrid deep neural network with adaptive rain optimizer algorithm for multi-grade brain tumor classification of MRI images. Multimed. Tools Appl. 2022, 81, 8021–8057. [Google Scholar] [CrossRef]
- Modi, A.; Kishore, B.; Shetty, D.K.; Sharma, V.P.; Ibrahim, S.; Hunain, R.; Usman, N.; Nayak, S.G.; Kumar, S.; Paul, R. Role of Artificial Intelligence in Detecting Colonic Polyps during Intestinal Endoscopy. Eng. Sci. 2022, 20, 25–33. [Google Scholar] [CrossRef]
- Devnath, L.; Summons, P.; Luo, S.; Wang, D.; Shaukat, K.; Hameed, I.A.; Aljuaid, H. Computer-Aided Diagnosis of Coal Workers’ Pneumoconiosis in Chest X-ray Radiographs Using Machine Learning: A Systematic Literature Review. Int. J. Environ. Res. Public Health 2022, 19, 6439. [Google Scholar] [CrossRef] [PubMed]
- Armi, L.; Fekri-Ershad, S. Texture image analysis and texture classification methods-A review. Int. Online J. Image Process. Pattern Recognit. 2019, 2, 1–29. [Google Scholar]
- Khan, M.A.; Ashraf, I.; Alhaisoni, M.; Damaševičius, R.; Scherer, R.; Rehman, A.; Bukhari, S.A.C. Multimodal Brain Tumor Classification Using Deep Learning and Robust Feature Selection: A Machine Learning Application for Radiologists. Diagnostics 2020, 10, 565. [Google Scholar] [CrossRef]
- Gab Allah, A.M.; Sarhan, A.M.; Elshennawy, N.M. Classification of Brain MRI Tumor Images Based on Deep Learning PGGAN Augmentation. Diagnostics 2021, 11, 2343. [Google Scholar] [CrossRef] [PubMed]


| Input: MRI and CT brain images Output: Classified outcome Intermediate outcomes: Fused and Segmented outcomes Objective Evaluation-Set 1: Entropy, MI, UQI, STD, PSNR. Objective Evaluation-Set 2: SACC, SSEN, SPEC, SPR, SNPV, SFPR, SFDR, SFNR, SF1, SMCC. Objective Evaluation-Set 3: CACC, CSEN, CPEC, CPR, CNPV, CFPR, CFDR, CFNR, CF1, CMCC |
|
| Input: Noisy image Xij Output: Denoised image Yij |
| Step 1: Consider Xij image with M × N sizes. |
| Step 2: Estimate σGN of as follows:
|
| Step 3: Change the size of the mask based on σGN factor as follows:
|
| Step 4: Apply Xij input to the mean filtering for low-level noise removal.
|
| Step 5: Calculate the absolute difference between the mean filtered outcome to Xij.
|
| Step 6: Eliminate pixels more than the mean value (µ). Choose the pixels in
or Dij as follows:
|
| Step 7: Apply the weighted average on V, and it generates the denoised outcome (Yij).
|
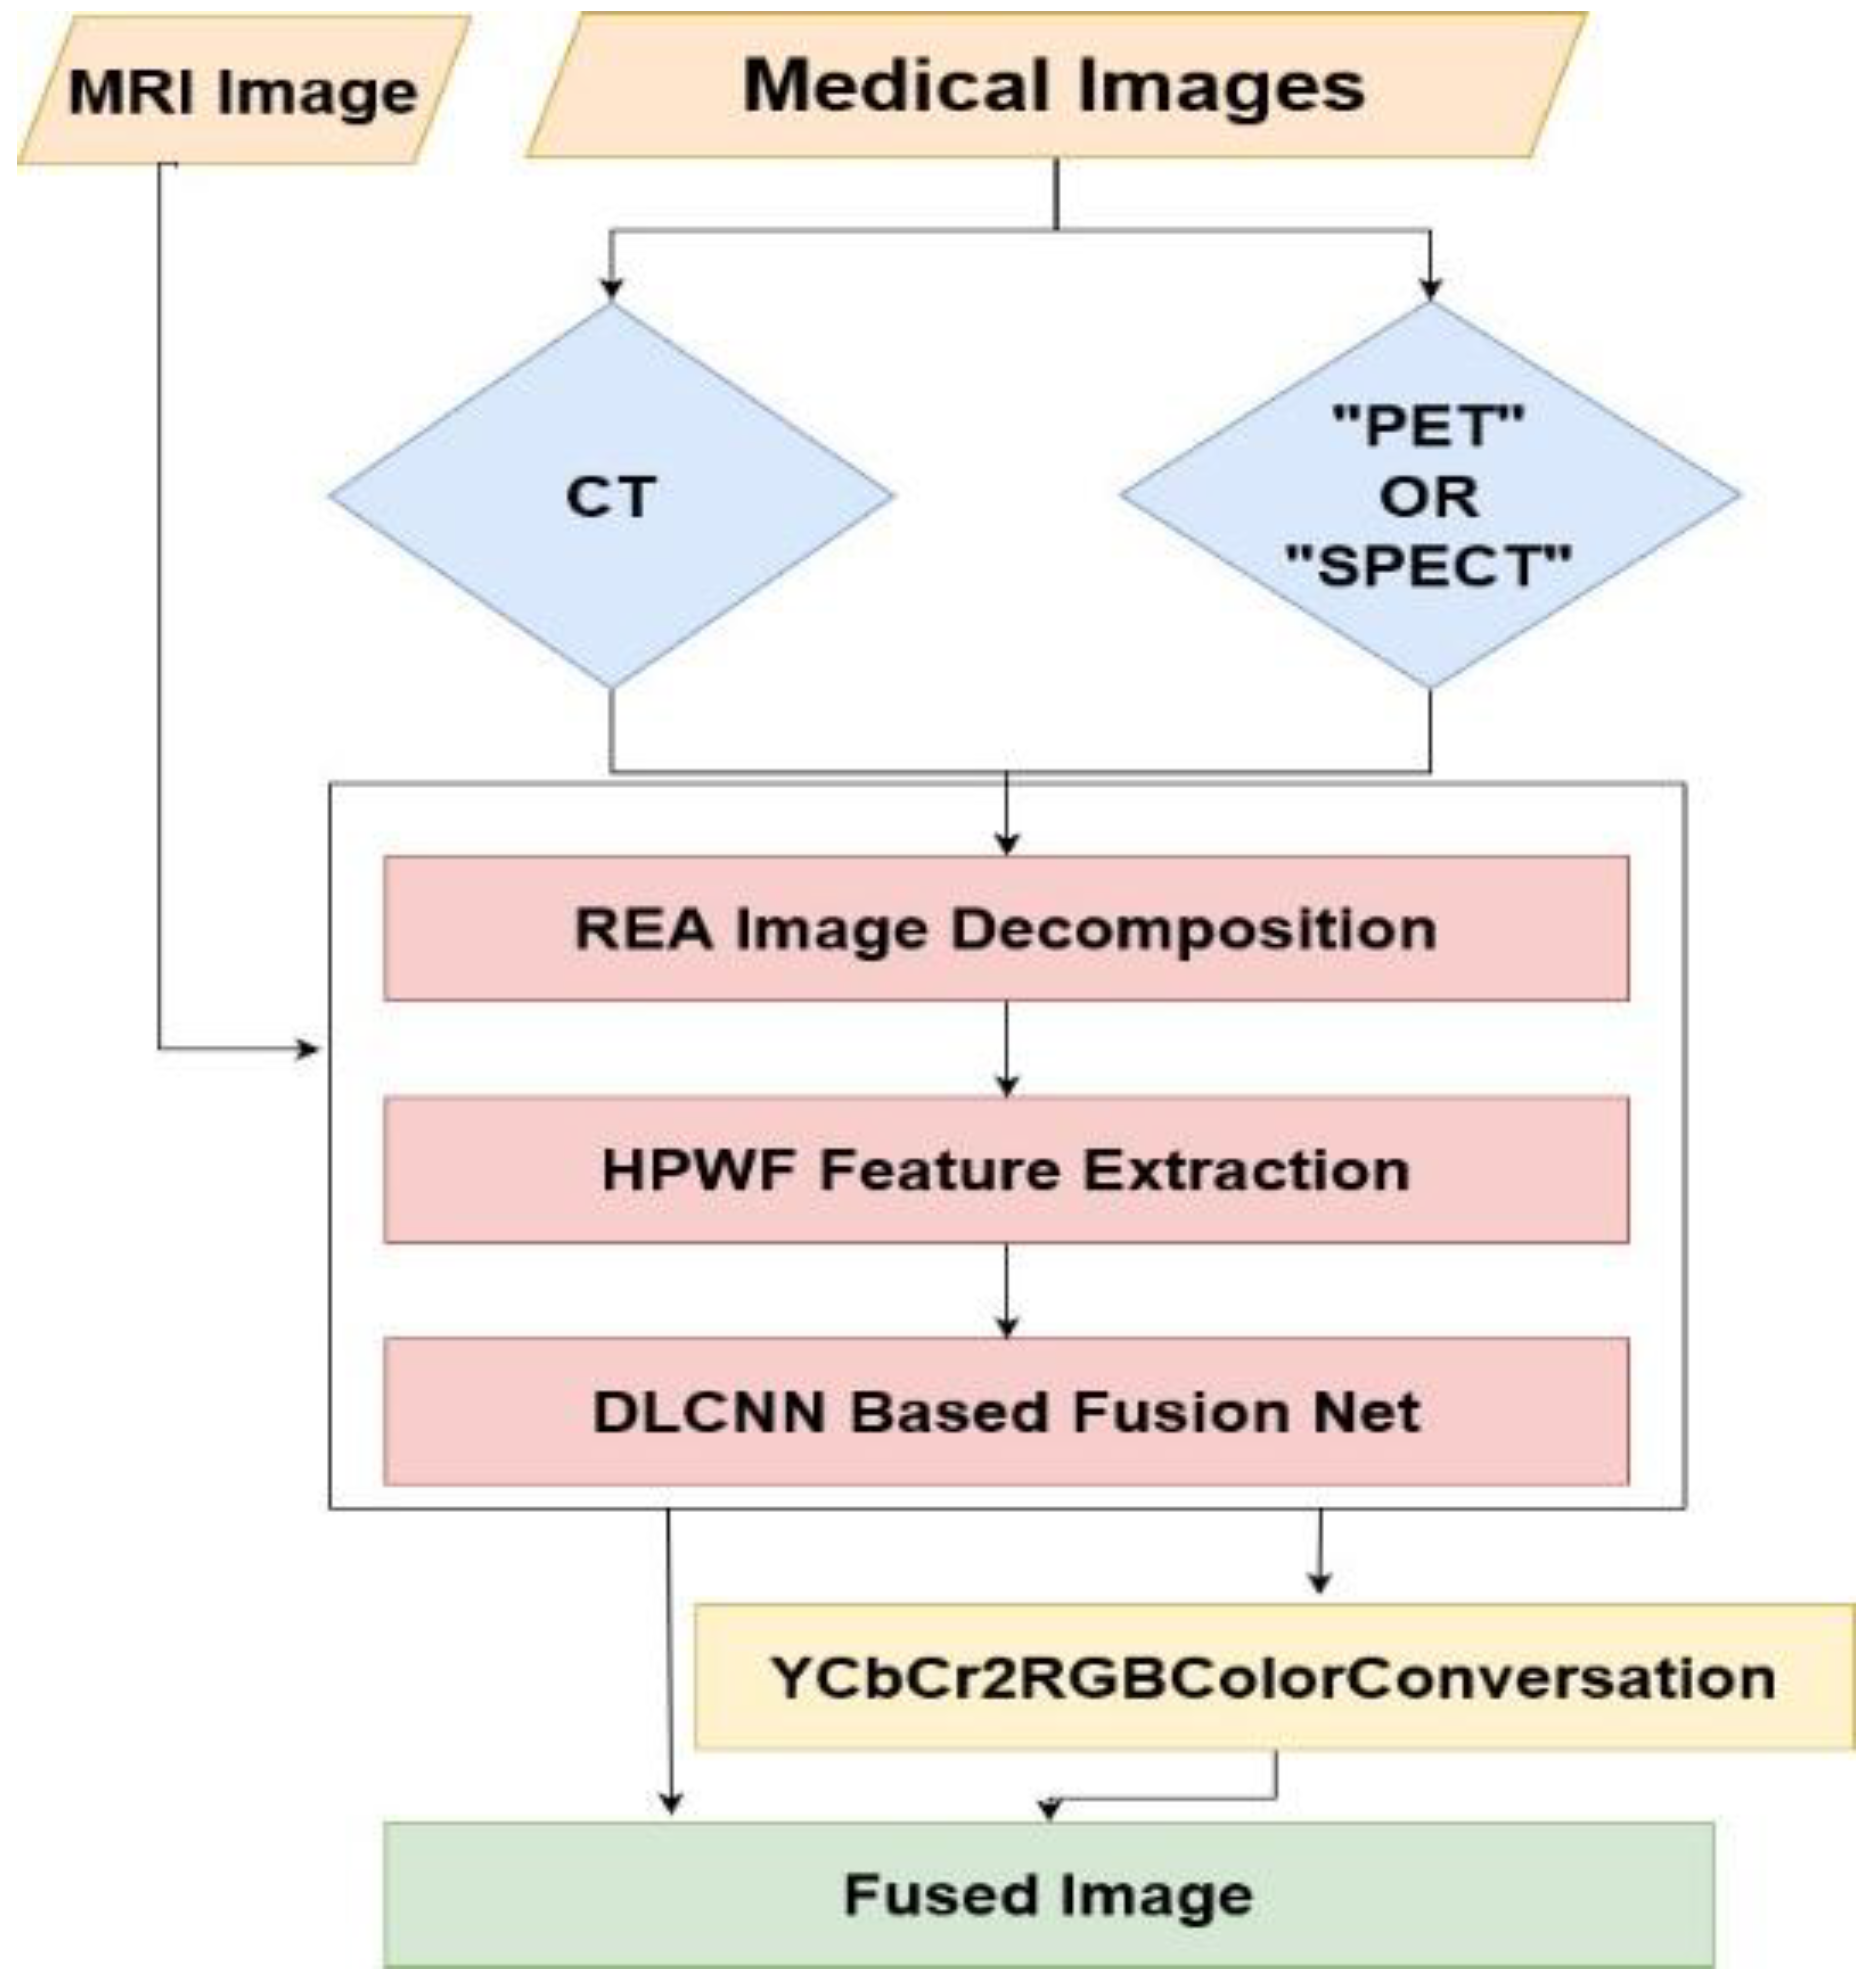
| INPUT OUTPUT | MRI Medical Images, PET/SPECT/CT Image Types Fused Image |
| Step 1 | XCT ← MRI CT Images |
| XPET ← MRI PET Images | |
| XSPECT ← MRI SPECT Images | |
| //Input MRI Greyscale medical images | |
| Step 2 | if (XCT) then //compare image type EedgeSlopeImg ← REA (XCT) |
| //apply Robust Edge Analysis (REA) to generate edge-slope-analysed images Else if (XPETORXSPECT) then Cb, Y, Cr ← RGB2YCbCrColorCon (XPET, XSPECT) | |
| //the above function converts EedgeSlopeImg ← REA (XCT) | |
| //Convert all the images I into data vectors | |
| Step 3 | Ffeatures ← HPWF (EedgeSlopeImg) |
| //calculate weighted data points of the image vector I | |
| Step 4 | if (XCT) then XFO ← FusionNetFeatureFusion (Ffeatures) |
| Else if (XPET ORXSPECT) then FOfusedOutcome ← FusionNetFeatureFusion (Ffeatures) | |
| XF ← YCbCr2RGBColorCon (FOfusedOutcome) |
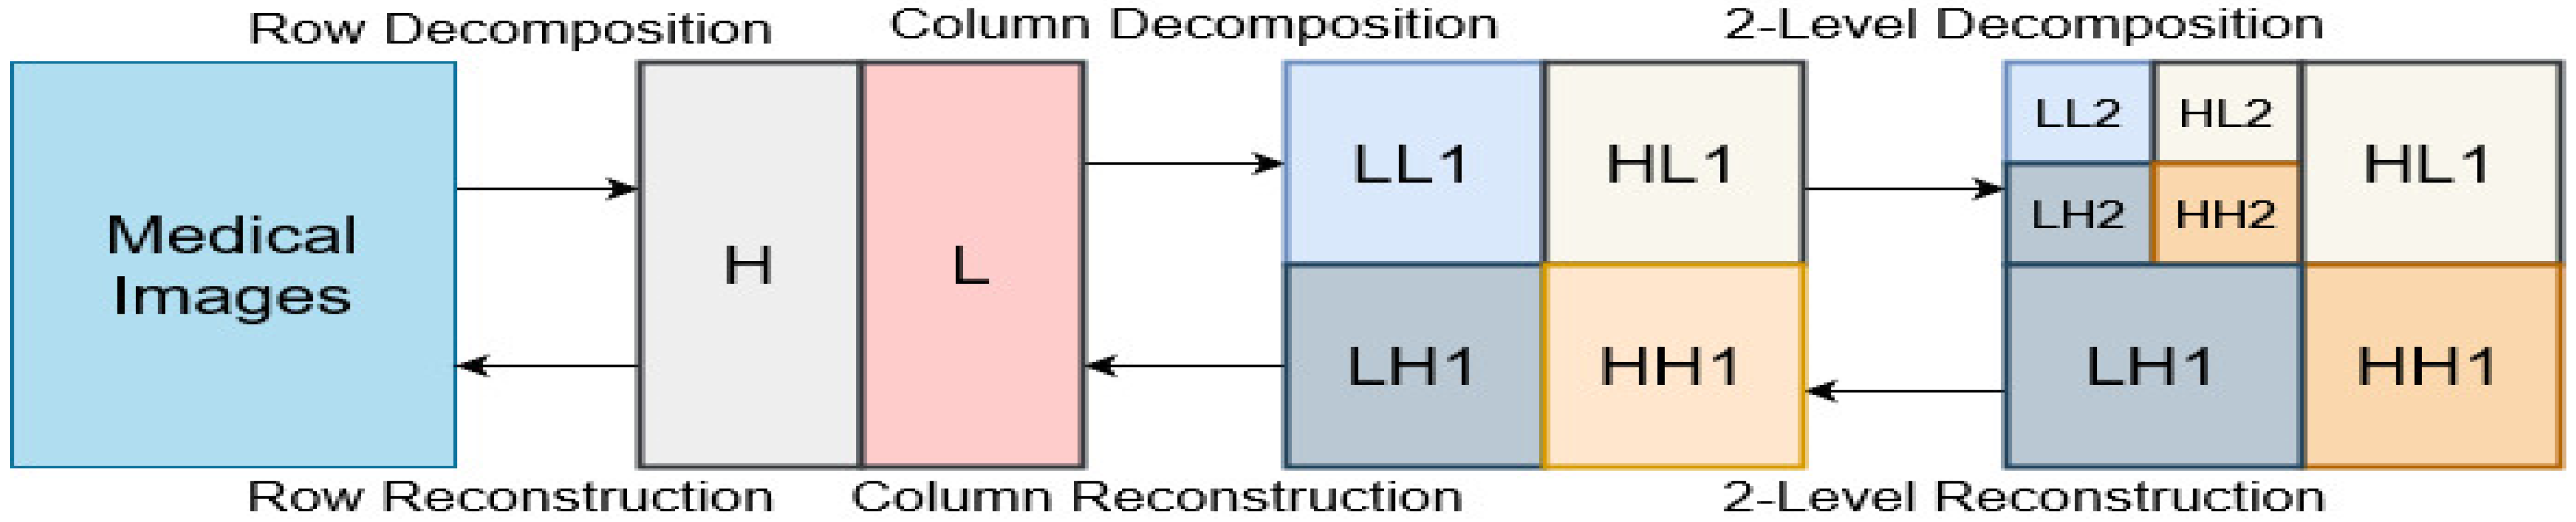
| INPUT: OUTPUT: | Medical Images (I) Edge Based slope analyzed images |
| Phase 1: | X ← Medical Images |
| //input of medical images XTest ← TrainTest (X) | |
| //extract the test images from the medical images X | |
| Phase 2: | YNoiseFree ← GaussianFiltering (XTest) |
| //Noise-free medical images using the gaussian approach | |
| Phase 3: | DDecomposedImages ← CannyEdgeDetection (YNoiseFree) |
| //decomposed images, extracted with perfect shapes, edges, textures, and spatial regions | |
| Phase 4: | IFinedImages ← EdgeRemovalAverageThresholdWeight (DDecomposedImages) |
| //This removes unnecessary edges & detailed layers of each image are generated using the above method | |
| Phase 5: | EEnergyDetails ← LayerWiseEnergyCal (IFinedImages) |
| //The above function will calculate & generate energy details with Equation (1), & variations present in the energy level of an image then subproblems of test images will be developed | |
| Phase 6: | EPerfectEnergyLevels ← (PerfectEnergyCal (EEnergyDetails)) |
| //The above function develops the perfect energy levels using slope parameter ε | |
| Phase 7: | IEnergyOptimizedImage ← EnergyOptimizedImages (EPerfectEnergyLevels) |
| //Apply formula to remove irrelevant energy levels for smooth and non-smooth regions | |
| Phase 7: | if (IenergyOptimizedImage = smooth) then IOptimizedImage = EdgeBasedSlopeImage (IenergyOptimizedImage) else if (IenergyOptimizedImage = non-smooth) then IOptimizedImage = EnergyMap (IenergyOptimizedImage) |
| Phase 8: | Output the IoptimizedImage for further image analysis |
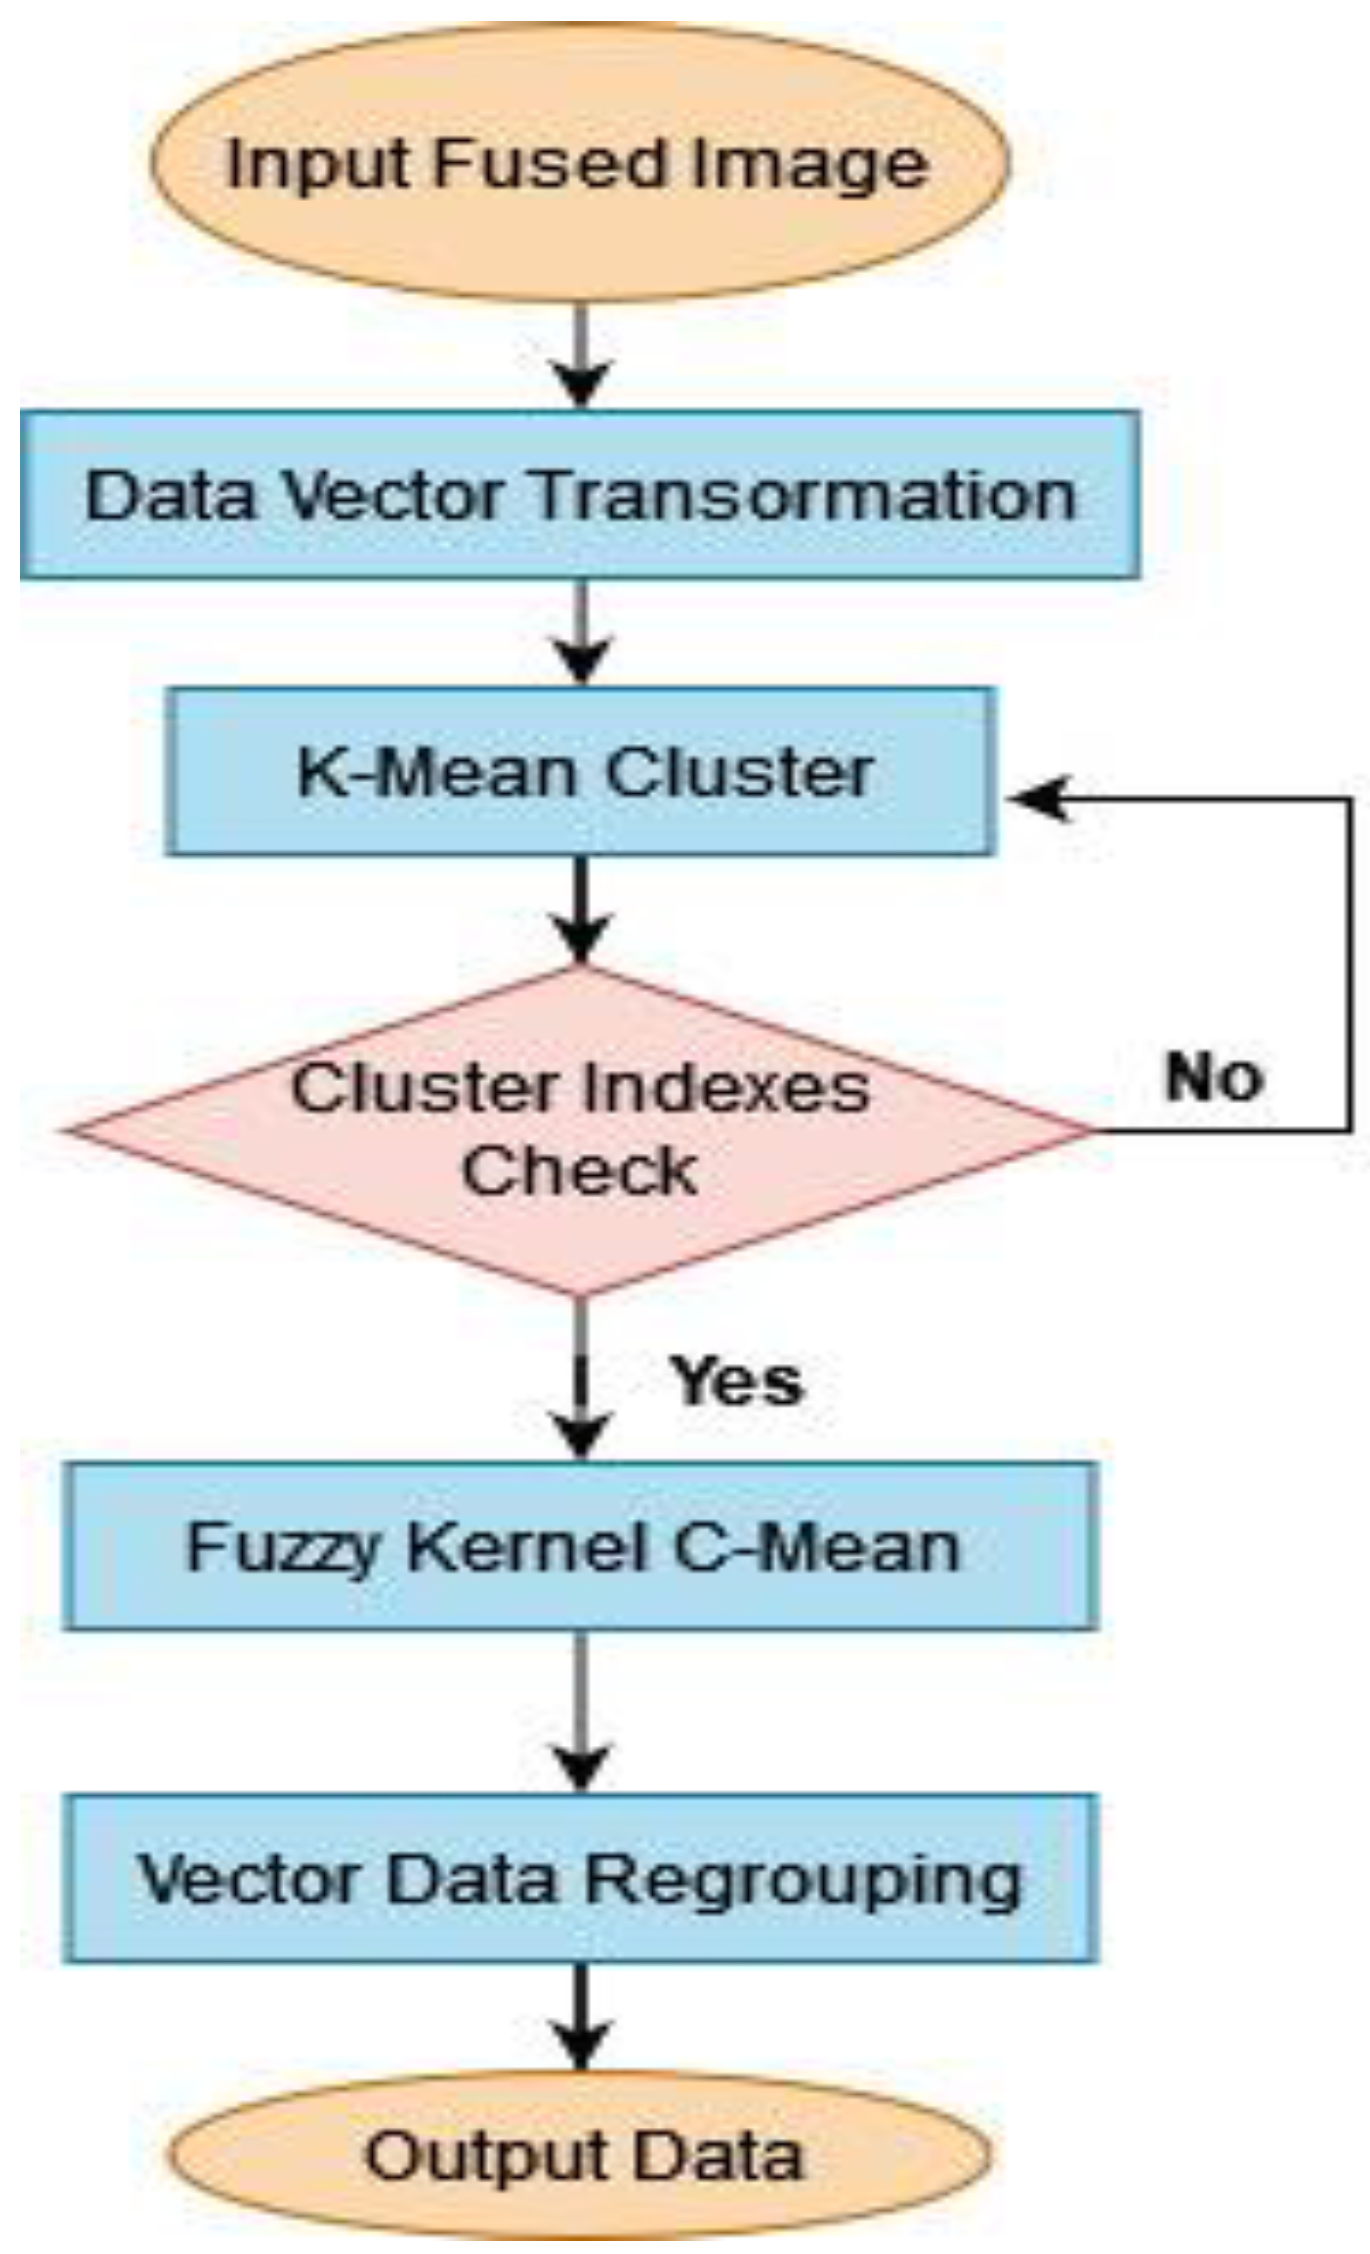
| INPUT OUTPUT | Fused Medical Images(I) Segmented Medical Image(S) |
| Step 1 | I ← FusedImages |
| //Initialize the I variable with fused medical images | |
| Step 2 | X[I] ← ImgToVectorConvert (I) |
| //Convert all the images I into data vectors | |
| Step 3 | U[i] ← W[i]*X[i] |
| //calculate weighted data points of the image vector I | |
| Step 4 | Repeat step 2,3 until all the images are converted to vectors and weighted data points calculated |
| Step 5 | Ccentroid ← AKMC (U,K) |
| //calculated and identify the initial centroids(cluster centers) with k data points by//Adaptive k-Means Clustering (AKMC) | |
| Step 6 | Ssort ← WeightedSorting (U) |
| //perform the sorting operation on weighted data points U | |
| Step 7 | D ← FKMC (U, Ccentroid) |
| //calculate the Euclidian distance from weighted data points (U) to the centroids Ccentroid using fuzzy Kernel c-Means (FKMC) & initialize to distance D | |
| Step 8 | CSClusterSegment ← FindOptimalCentroid (MIN (D)) |
| //fetches the optimal centroid with minimum distance and assigned as cluster segment CS | |
| Step 9 | Repeat steps 5 to 7 until all clusters traversed |
| Step 10 | S ← CombineAllSegments (CS) |
| //combine all the cluster segments and produce the calculated segment output S |
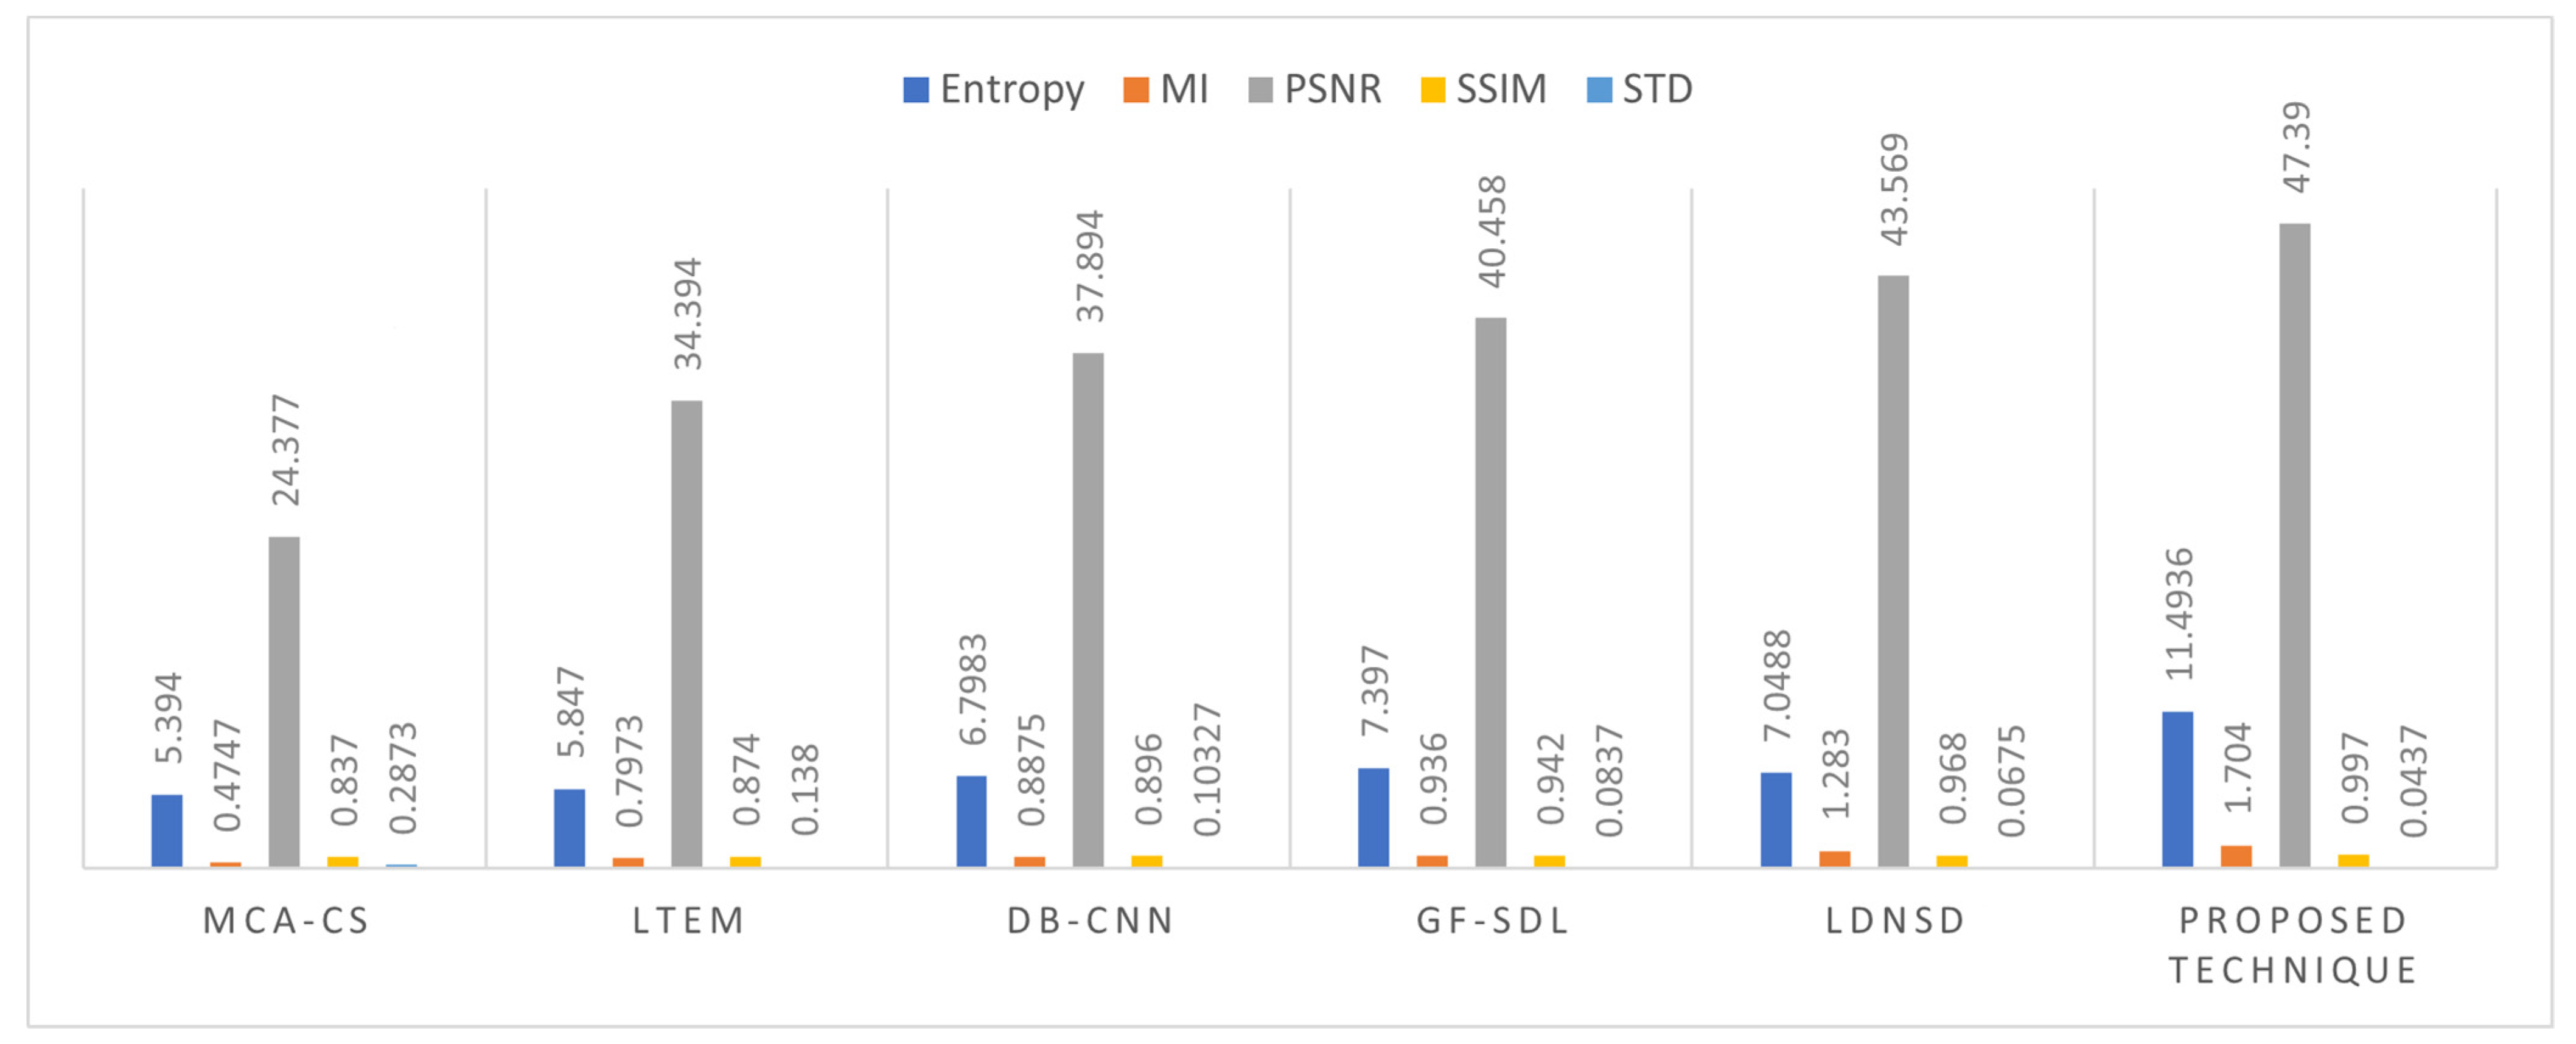
| MCA-CS [14] | LTEM [15] | DB-CNN [17] | GF-SDL [18] | LDNSD [19] | Proposed | |
|---|---|---|---|---|---|---|
| Entropy | 5.394 | 5.847 | 6.7983 | 7.397 | 7.0488 | 11.4936 |
| MI | 0.4747 | 0.7973 | 0.8875 | 0.936 | 1.283 | 1.704 |
| PSNR | 24.377 | 34.394 | 37.894 | 40.458 | 43.569 | 47.390 |
| SSIM | 0.837 | 0.874 | 0.896 | 0.942 | 0.968 | 0.997 |
| STD | 0.2873 | 0.138 | 0.10327 | 0.0837 | 0.0675 | 0.0437 |
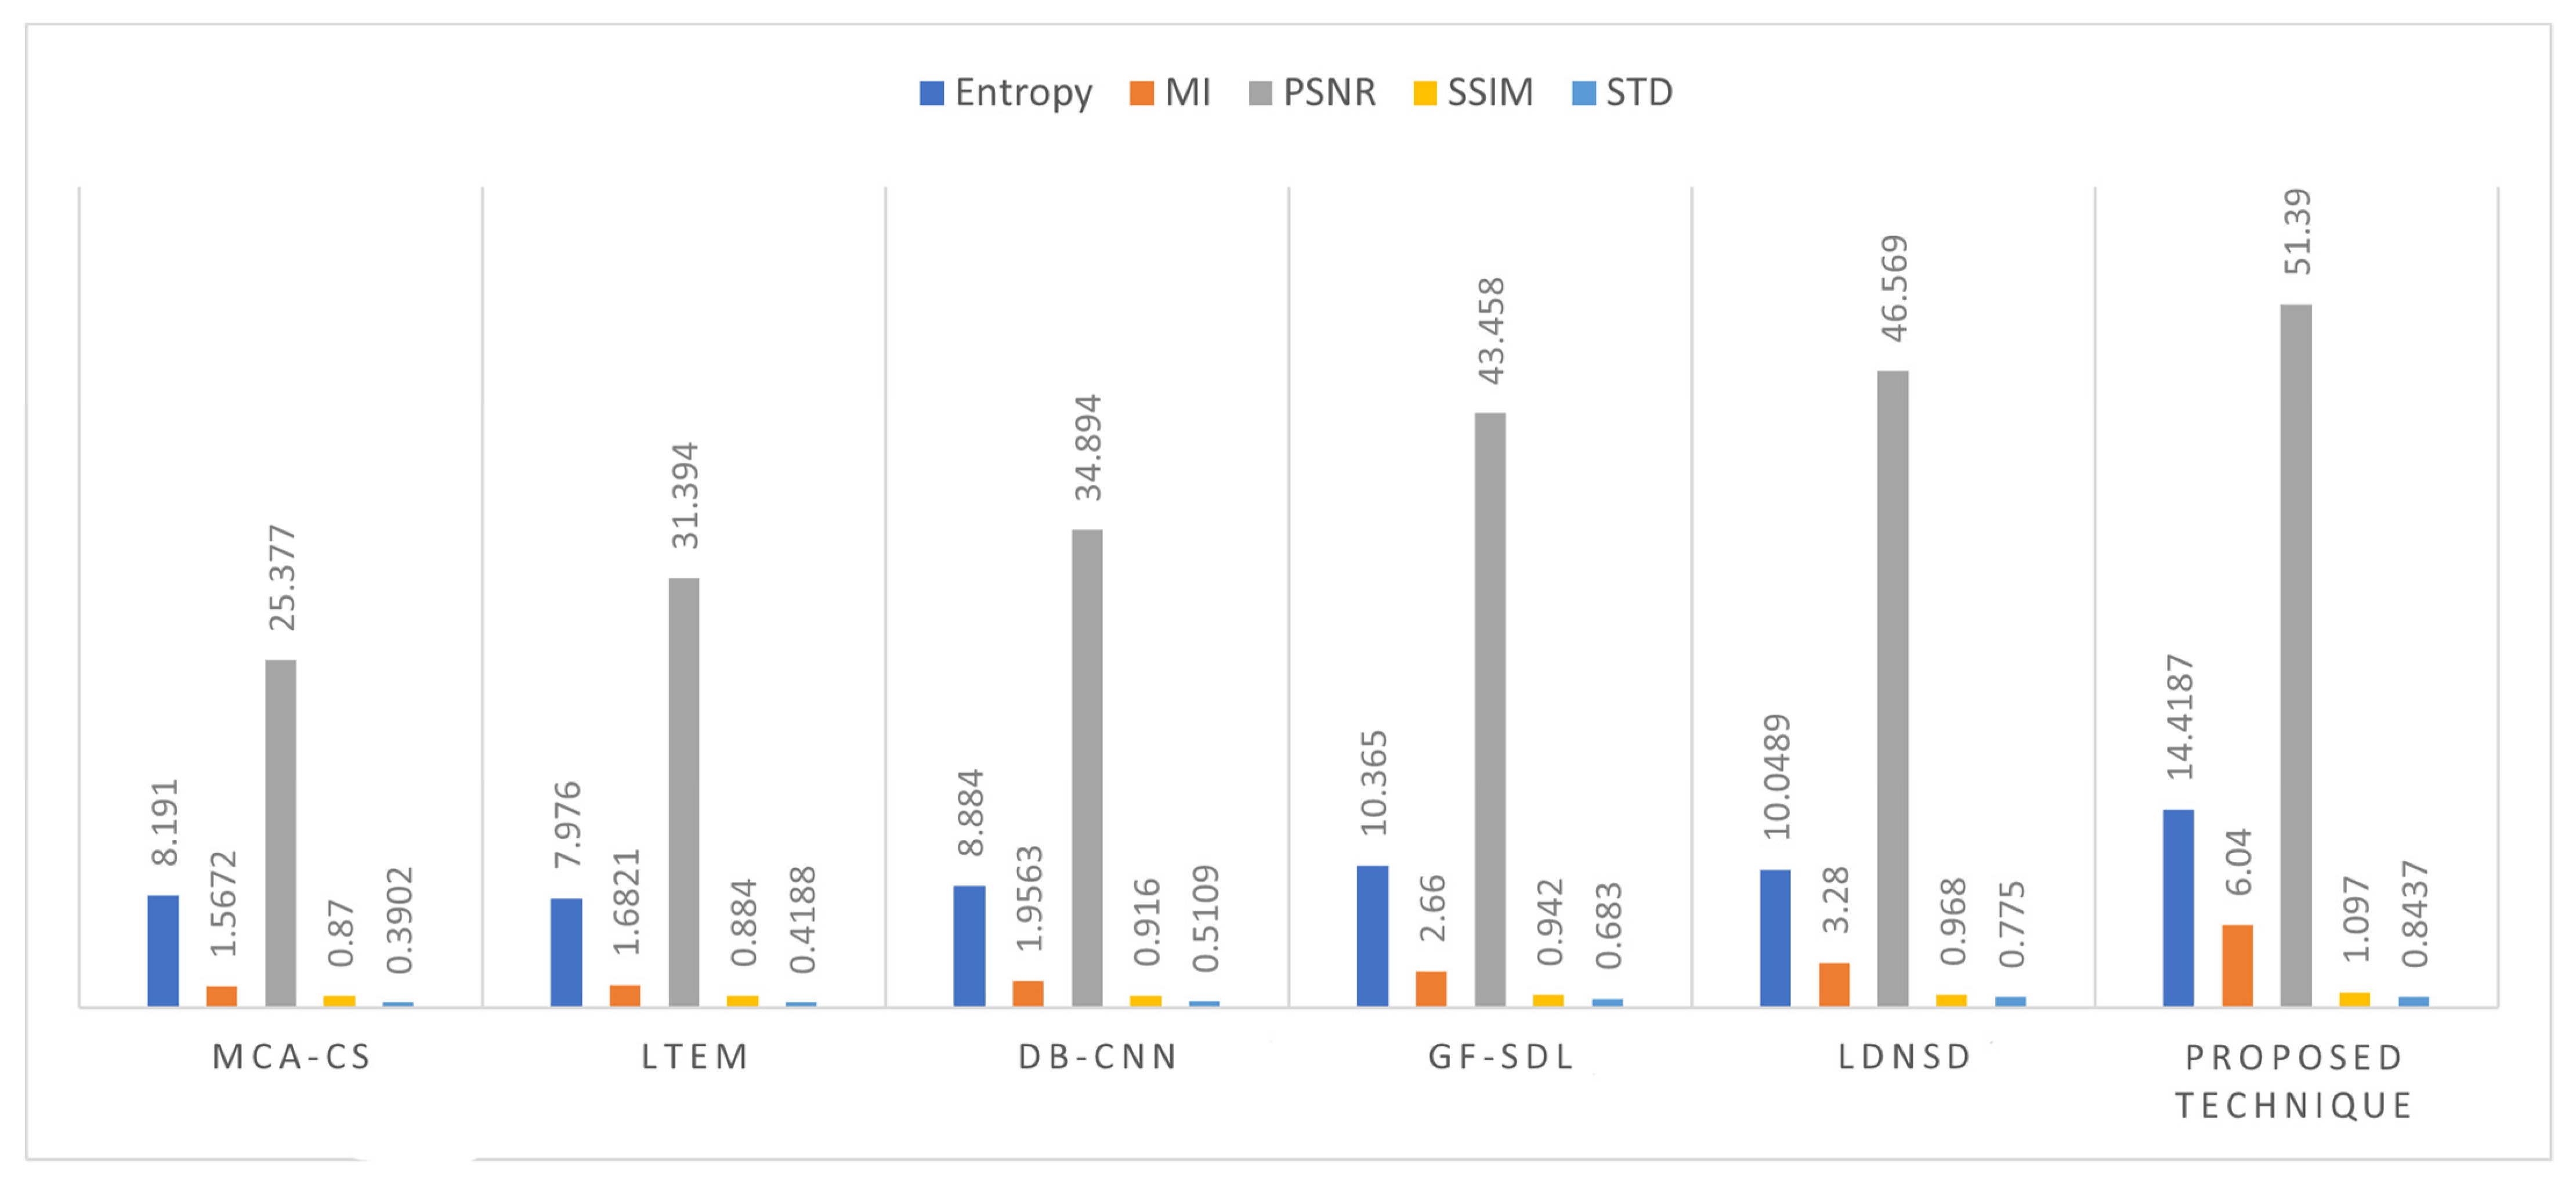
| Metric | MCA-CS [14] | LTEM [15] | DB-CNN [17] | GF-SDL [18] | LDNSD [19] | Proposed |
|---|---|---|---|---|---|---|
| Entropy | 8.191 | 7.976 | 8.884 | 10.365 | 10.0489 | 14.4187 |
| MI | 1.5672 | 1.6821 | 1.9563 | 2.66 | 3.28 | 6.04 |
| PSNR | 25.377 | 31.394 | 34.894 | 43.458 | 46.569 | 51.39 |
| SSIM | 0.87 | 0.884 | 0.916 | 0.942 | 0.968 | 1.097 |
| STD | 0.3902 | 0.4188 | 0.5109 | 0.683 | 0.775 | 0.8437 |
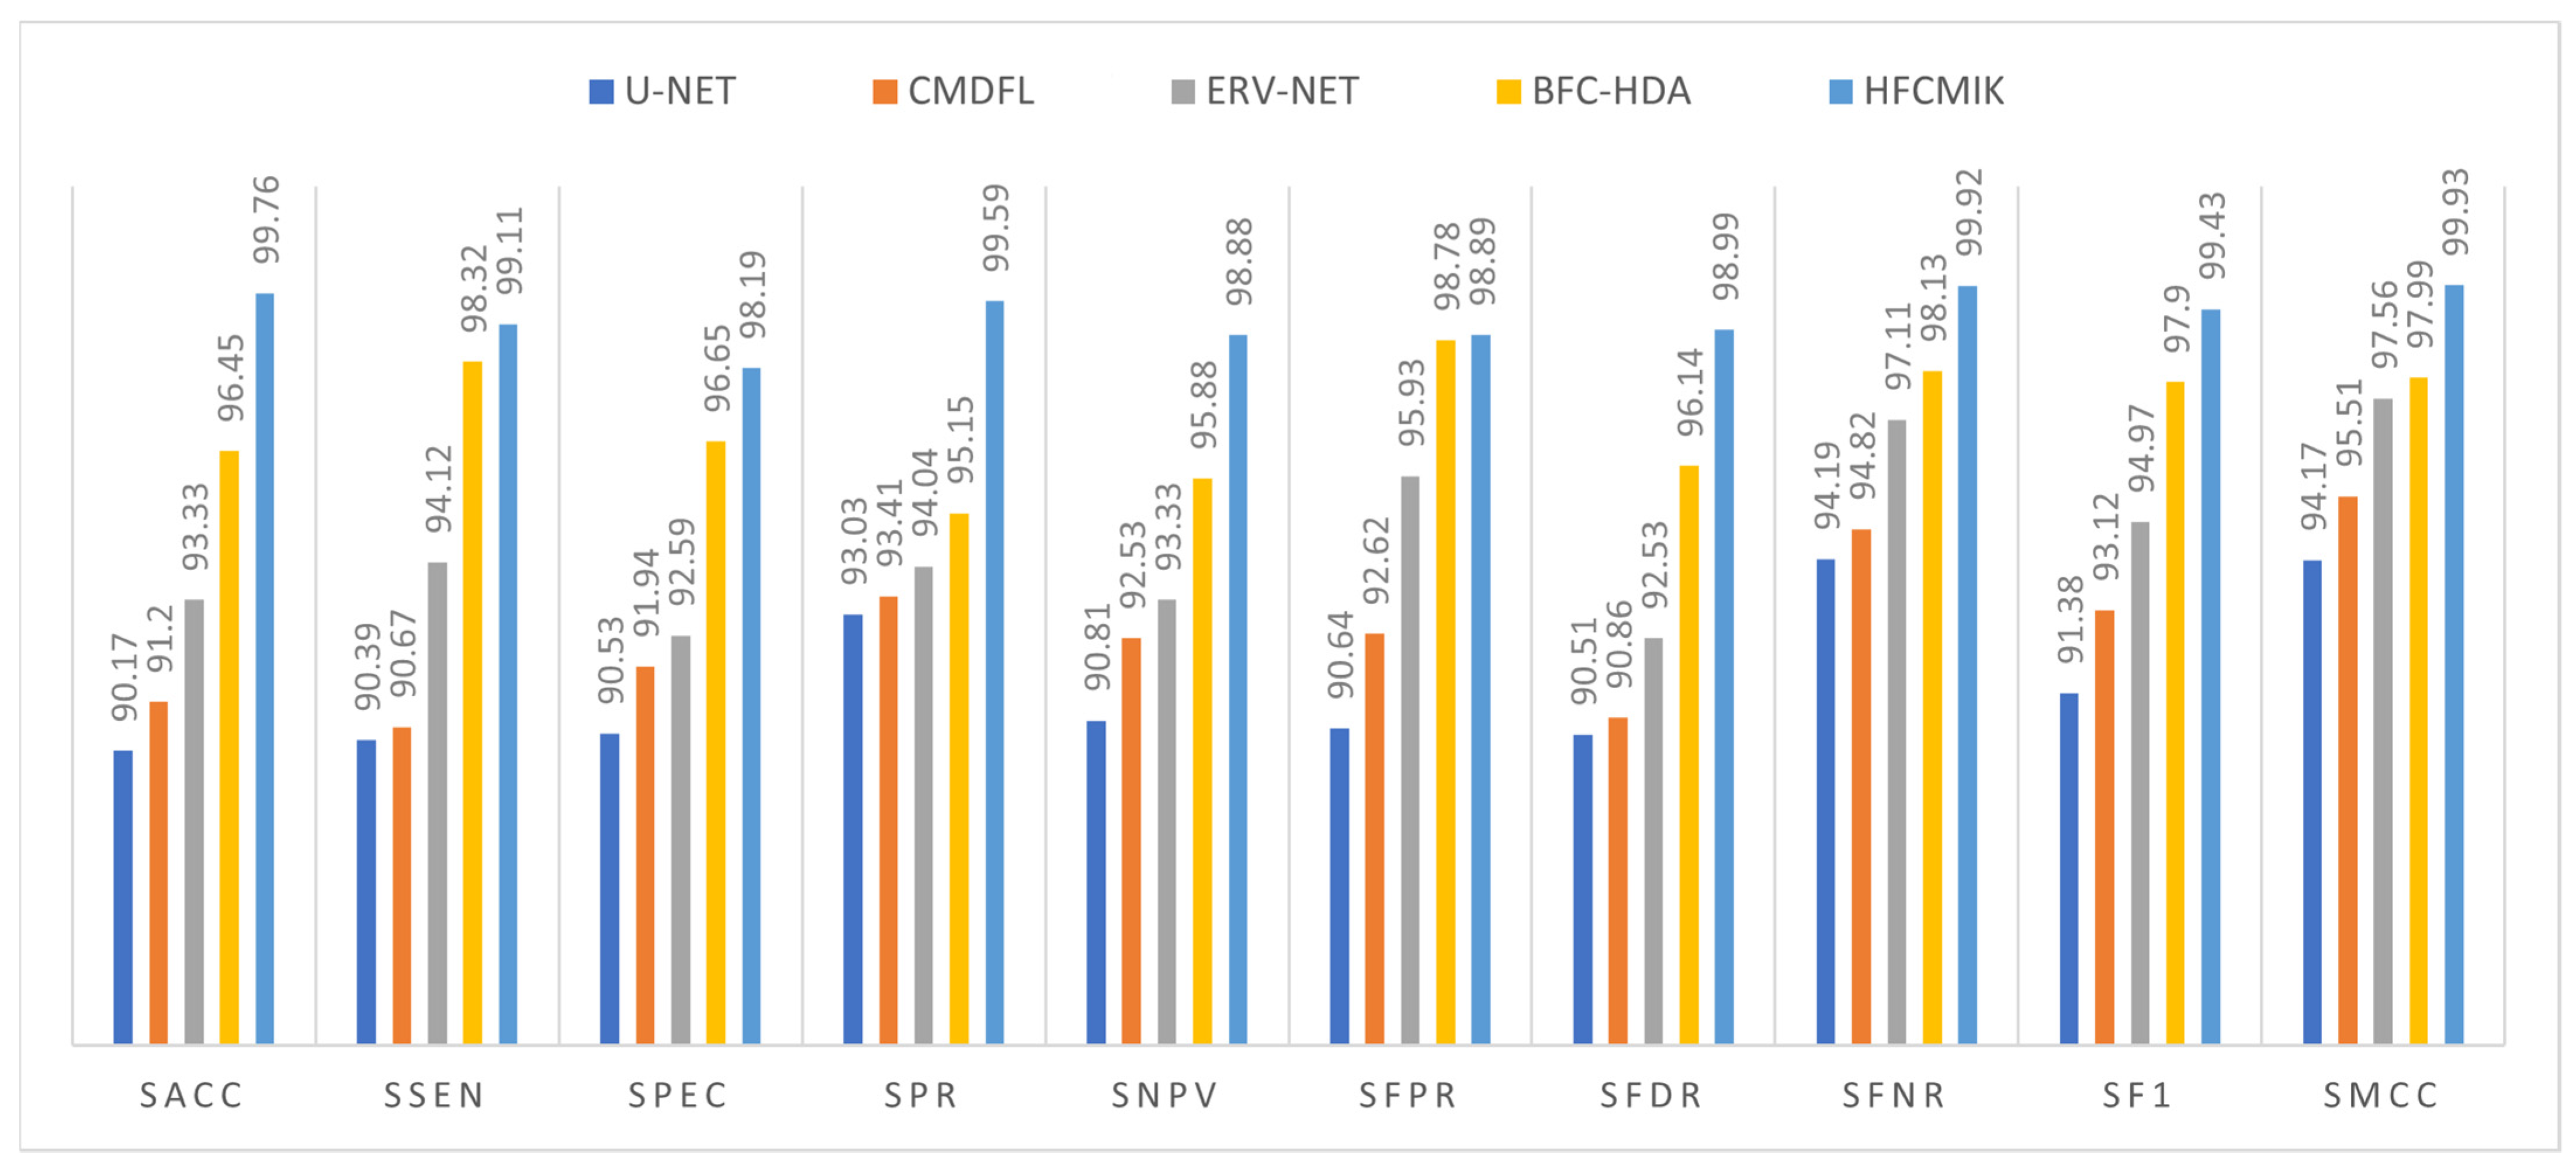
| Method | SACC | SSEN | SPEC | SPR | SNPV | SFPR | SFDR | SFNR | SF1 | SMCC |
|---|---|---|---|---|---|---|---|---|---|---|
| U-NET [20] | 90.17 | 90.39 | 90.53 | 93.03 | 90.81 | 90.64 | 90.51 | 94.19 | 91.38 | 94.17 |
| CMDFL [22] | 91.2 | 90.67 | 91.94 | 93.41 | 92.53 | 92.62 | 90.86 | 94.82 | 93.12 | 95.51 |
| ERV-NET [23] | 93.33 | 94.12 | 92.59 | 94.04 | 93.33 | 95.93 | 92.53 | 97.11 | 94.97 | 97.56 |
| BFC-HDA [27] | 96.45 | 98.32 | 96.65 | 95.15 | 95.88 | 98.78 | 96.14 | 98.13 | 97.9 | 97.99 |
| HFCMIK | 99.76 | 99.11 | 98.19 | 99.59 | 98.88 | 98.89 | 98.99 | 99.92 | 99.43 | 99.93 |
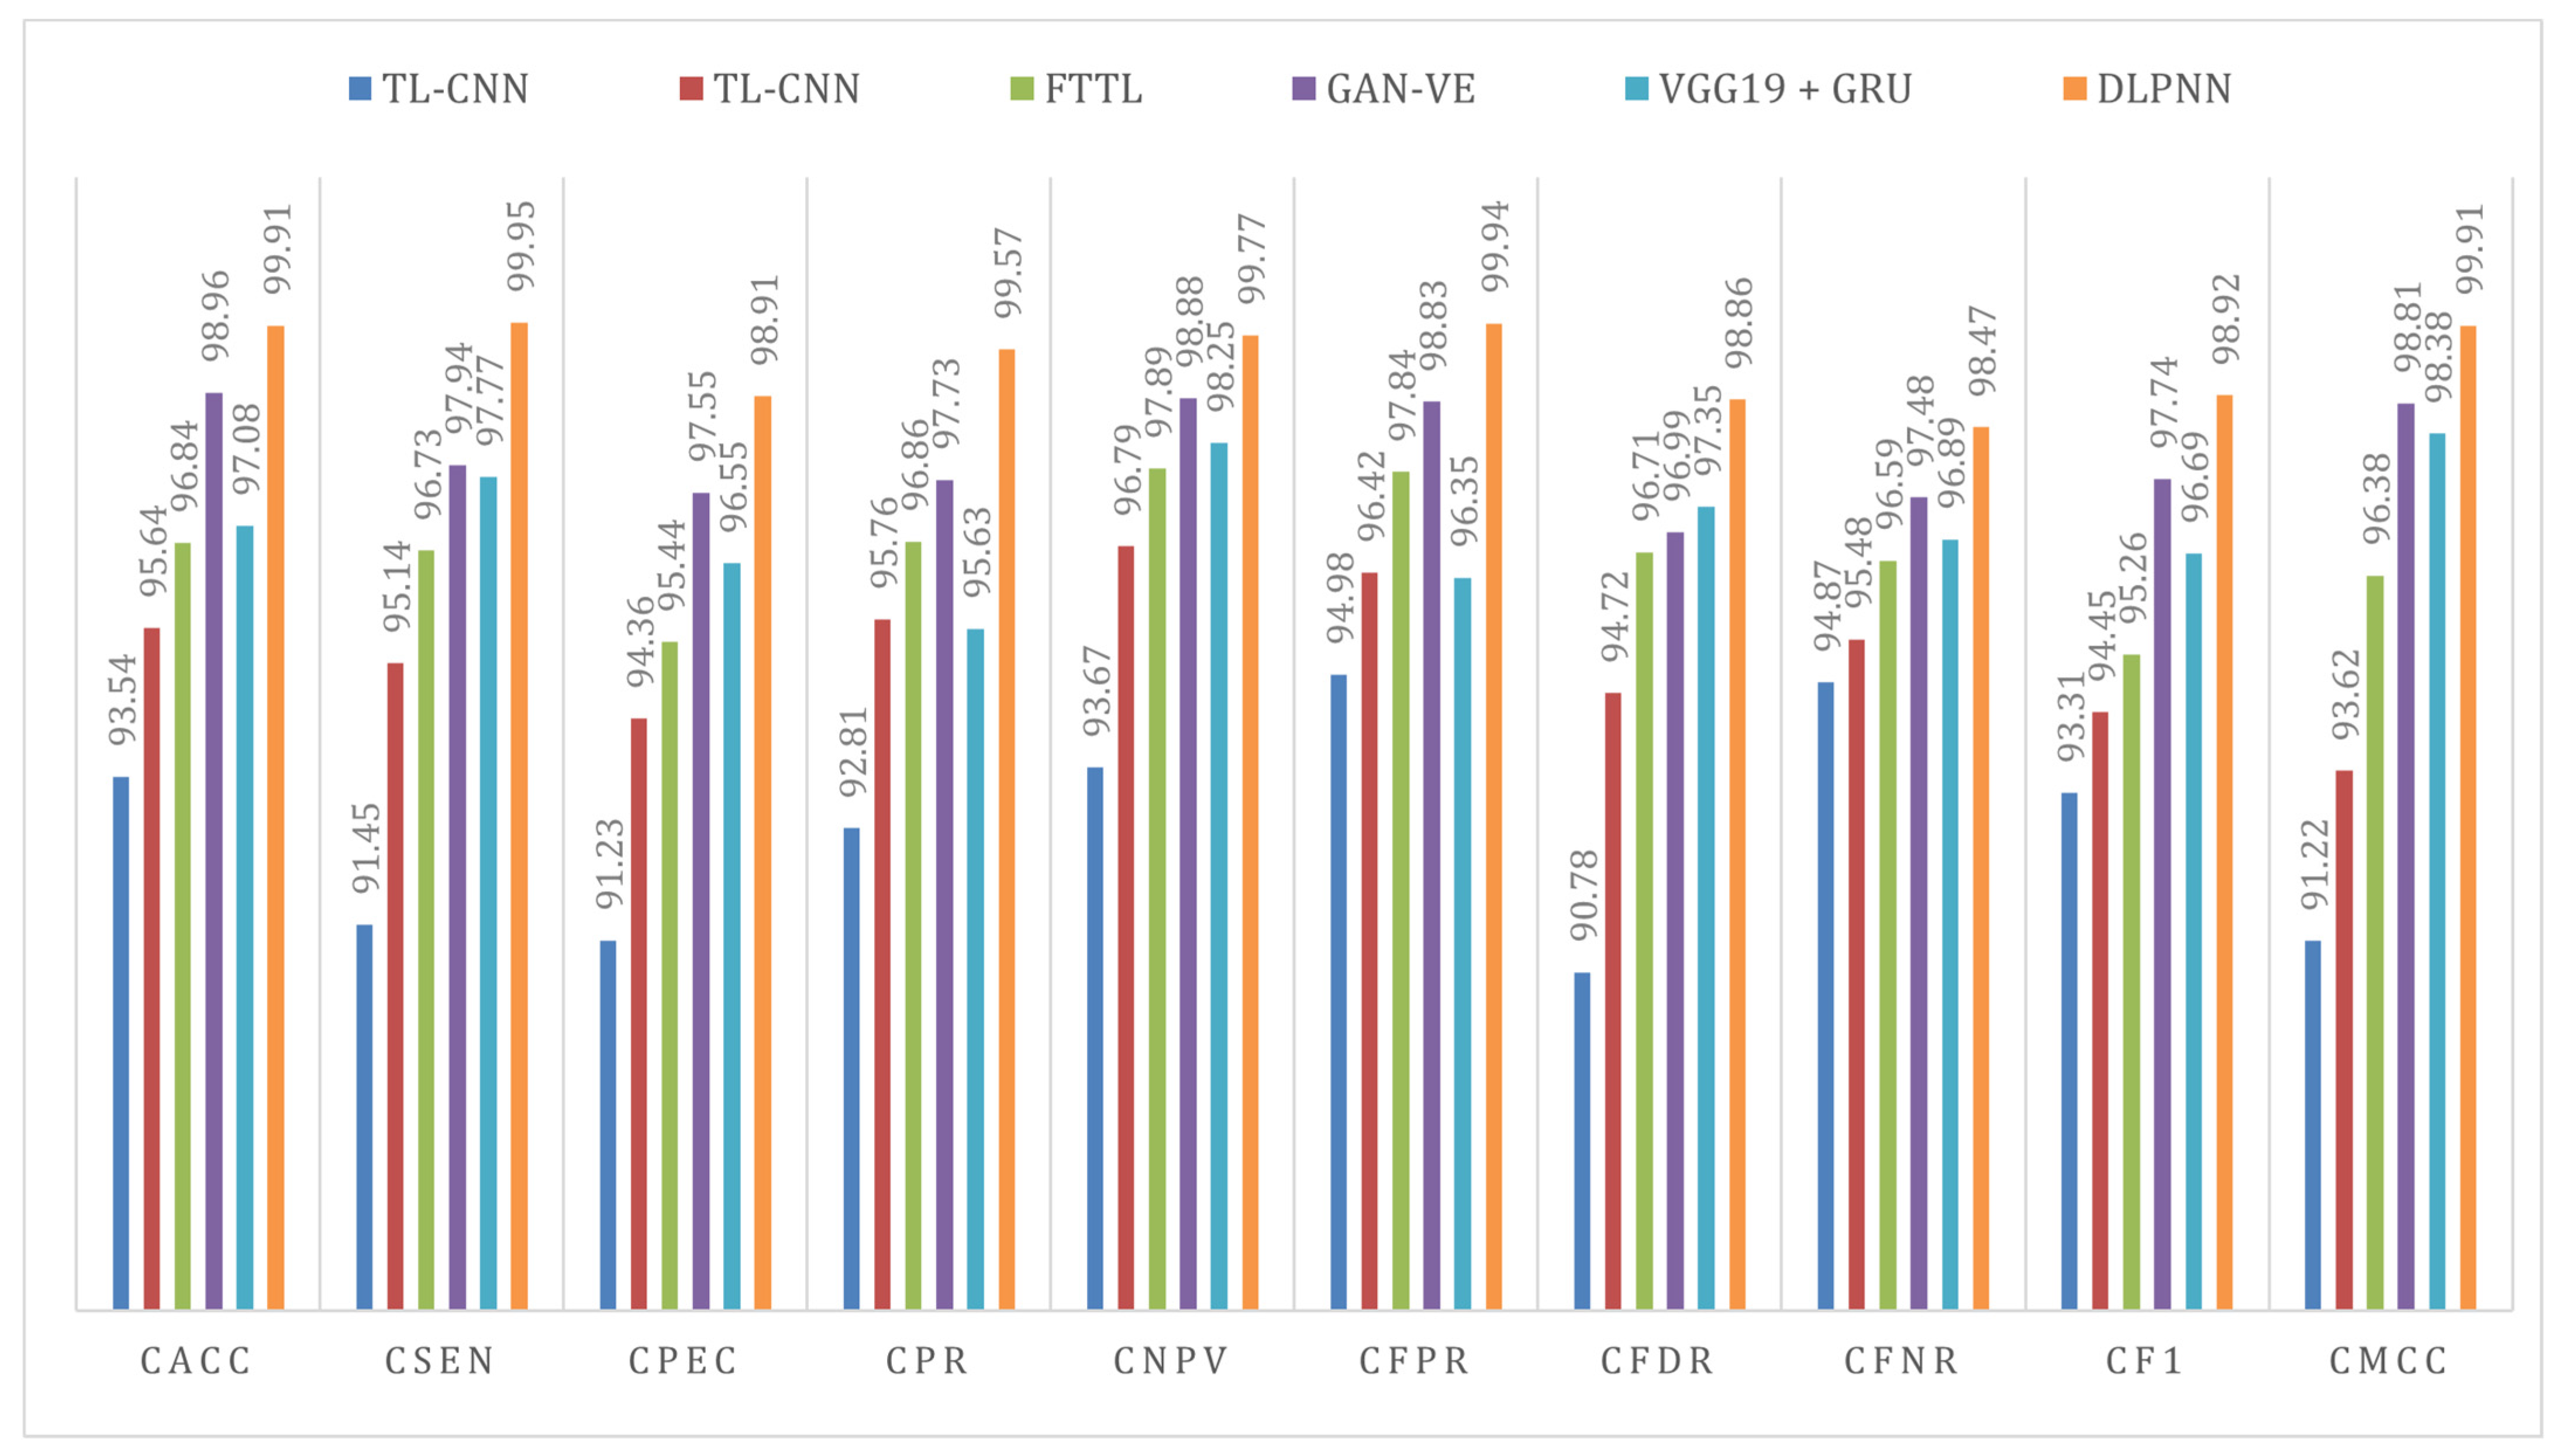
| Method | CACC | CSEN | CPEC | CPR | CNPV | CFPR | CFDR | CFNR | CF1 | CMCC |
|---|---|---|---|---|---|---|---|---|---|---|
| TL-CNN [33] | 93.54 | 91.45 | 91.23 | 92.81 | 93.67 | 94.98 | 90.78 | 94.87 | 93.31 | 91.22 |
| TL-CNN [38] | 95.64 | 95.14 | 94.36 | 95.76 | 96.79 | 96.42 | 94.72 | 95.48 | 94.45 | 93.62 |
| FTTL [31] | 96.84 | 96.73 | 95.44 | 96.86 | 97.89 | 97.84 | 96.71 | 96.59 | 95.26 | 96.38 |
| GAN-VE [36] | 98.96 | 97.94 | 97.55 | 97.73 | 98.88 | 98.83 | 96.99 | 97.48 | 97.74 | 98.81 |
| VGG19 + GRU [46] | 97.08 | 97.77 | 96.55 | 95.63 | 98.25 | 96.35 | 97.35 | 96.89 | 96.69 | 98.38 |
| DLPNN | 99.91 | 99.95 | 98.91 | 99.57 | 99.77 | 99.94 | 98.86 | 98.47 | 98.92 | 99.91 |
Disclaimer/Publisher’s Note: The statements, opinions and data contained in all publications are solely those of the individual author(s) and contributor(s) and not of MDPI and/or the editor(s). MDPI and/or the editor(s) disclaim responsibility for any injury to people or property resulting from any ideas, methods, instructions or products referred to in the content. |
© 2022 by the authors. Licensee MDPI, Basel, Switzerland. This article is an open access article distributed under the terms and conditions of the Creative Commons Attribution (CC BY) license (https://creativecommons.org/licenses/by/4.0/).
Share and Cite
Yadav, A.S.; Kumar, S.; Karetla, G.R.; Cotrina-Aliaga, J.C.; Arias-Gonzáles, J.L.; Kumar, V.; Srivastava, S.; Gupta, R.; Ibrahim, S.; Paul, R.; et al. A Feature Extraction Using Probabilistic Neural Network and BTFSC-Net Model with Deep Learning for Brain Tumor Classification. J. Imaging 2023, 9, 10. https://doi.org/10.3390/jimaging9010010
Yadav AS, Kumar S, Karetla GR, Cotrina-Aliaga JC, Arias-Gonzáles JL, Kumar V, Srivastava S, Gupta R, Ibrahim S, Paul R, et al. A Feature Extraction Using Probabilistic Neural Network and BTFSC-Net Model with Deep Learning for Brain Tumor Classification. Journal of Imaging. 2023; 9(1):10. https://doi.org/10.3390/jimaging9010010
Chicago/Turabian StyleYadav, Arun Singh, Surendra Kumar, Girija Rani Karetla, Juan Carlos Cotrina-Aliaga, José Luis Arias-Gonzáles, Vinod Kumar, Satyajee Srivastava, Reena Gupta, Sufyan Ibrahim, Rahul Paul, and et al. 2023. "A Feature Extraction Using Probabilistic Neural Network and BTFSC-Net Model with Deep Learning for Brain Tumor Classification" Journal of Imaging 9, no. 1: 10. https://doi.org/10.3390/jimaging9010010
APA StyleYadav, A. S., Kumar, S., Karetla, G. R., Cotrina-Aliaga, J. C., Arias-Gonzáles, J. L., Kumar, V., Srivastava, S., Gupta, R., Ibrahim, S., Paul, R., Naik, N., Singla, B., & Tatkar, N. S. (2023). A Feature Extraction Using Probabilistic Neural Network and BTFSC-Net Model with Deep Learning for Brain Tumor Classification. Journal of Imaging, 9(1), 10. https://doi.org/10.3390/jimaging9010010