
Image Quality Comparison between Digital Breast Tomosynthesis Images and 2D Mammographic Images Using the CDMAM Test Object


Abstract: Purpose
1. Introduction
2. Materials and Methods
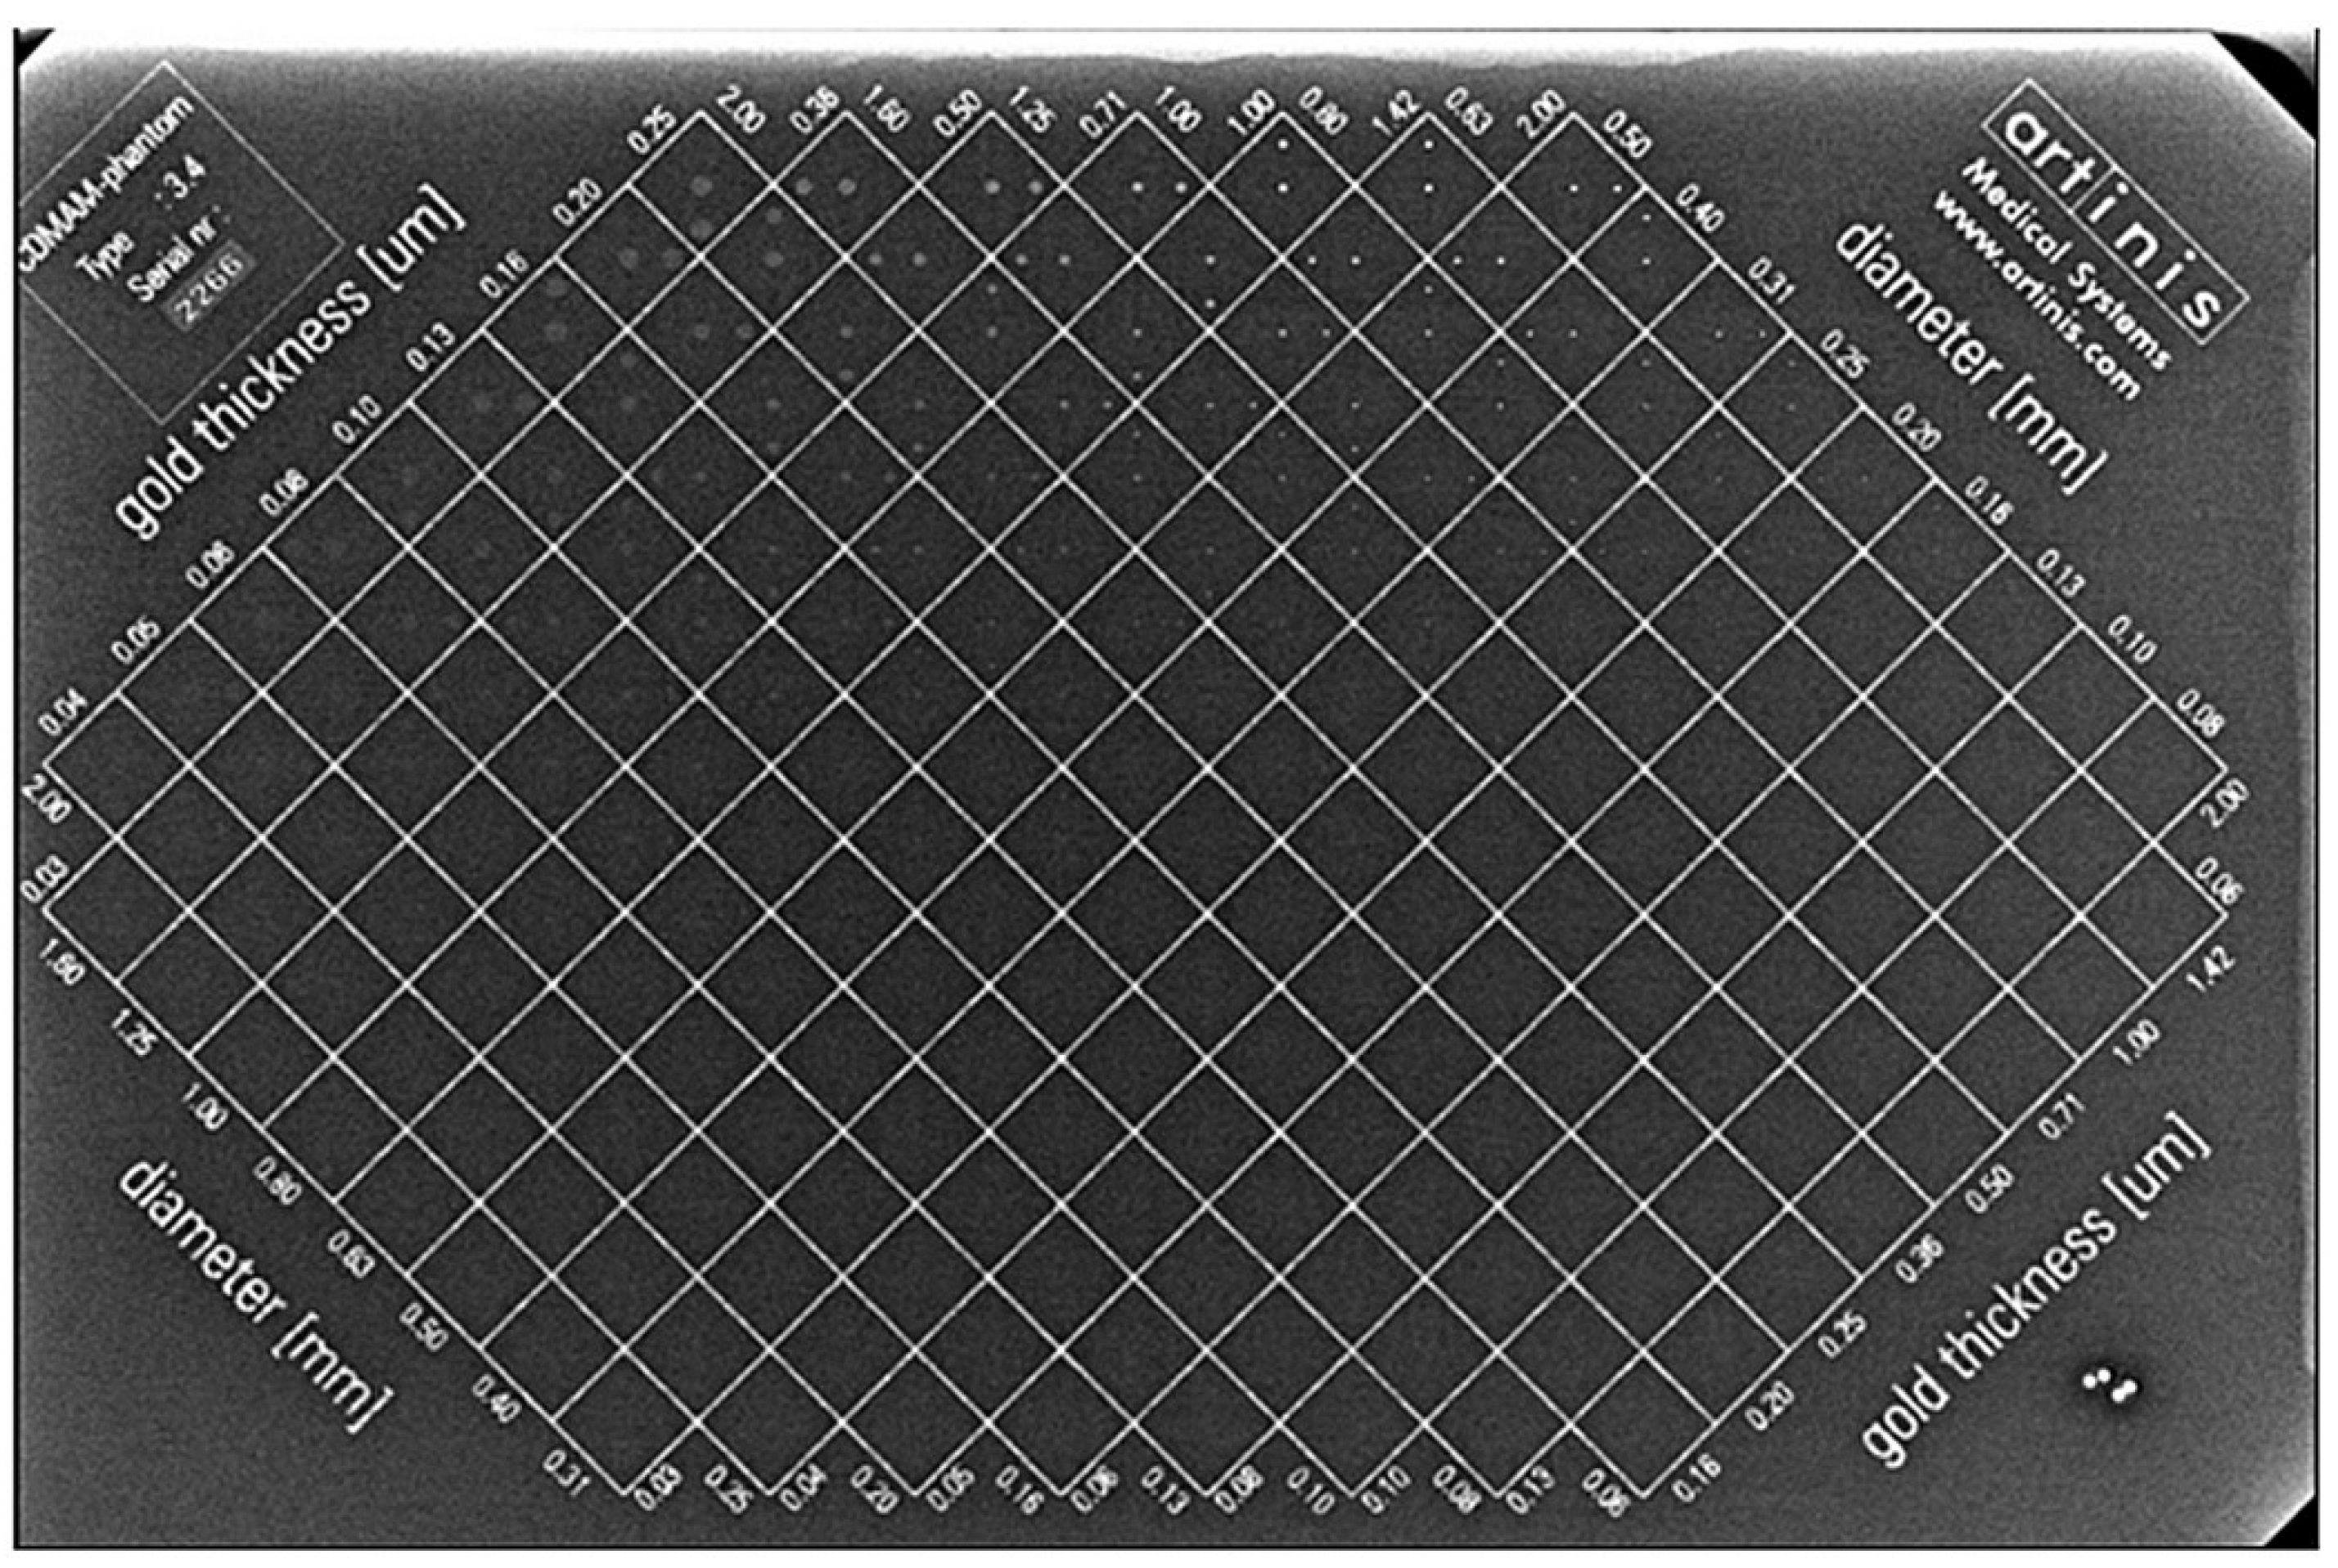
2.1. CDMAM Phantom Description
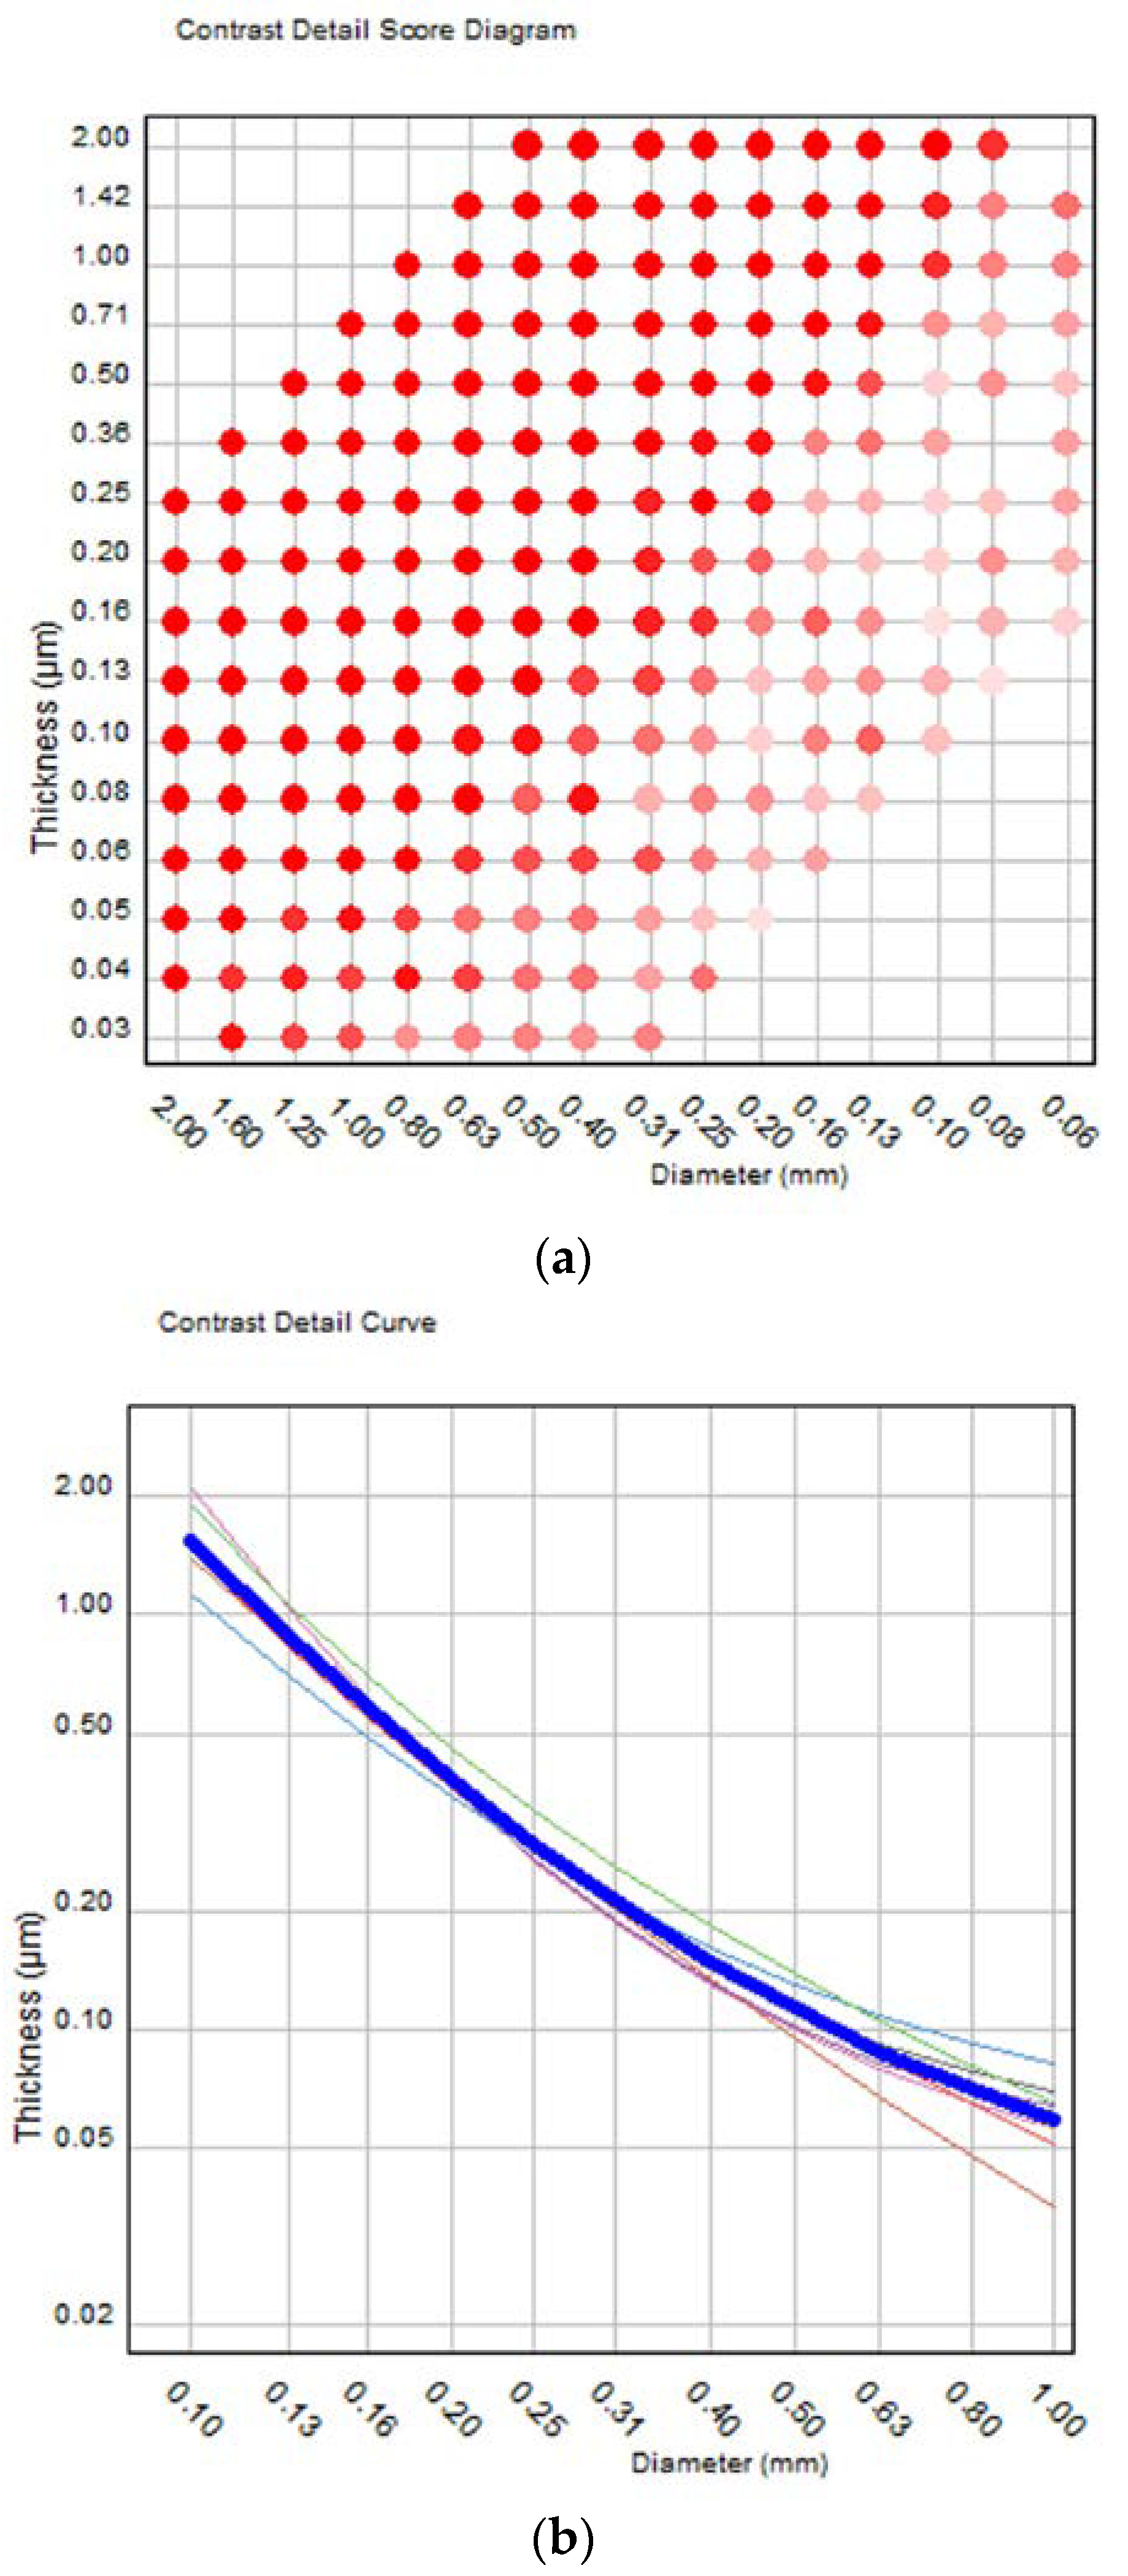
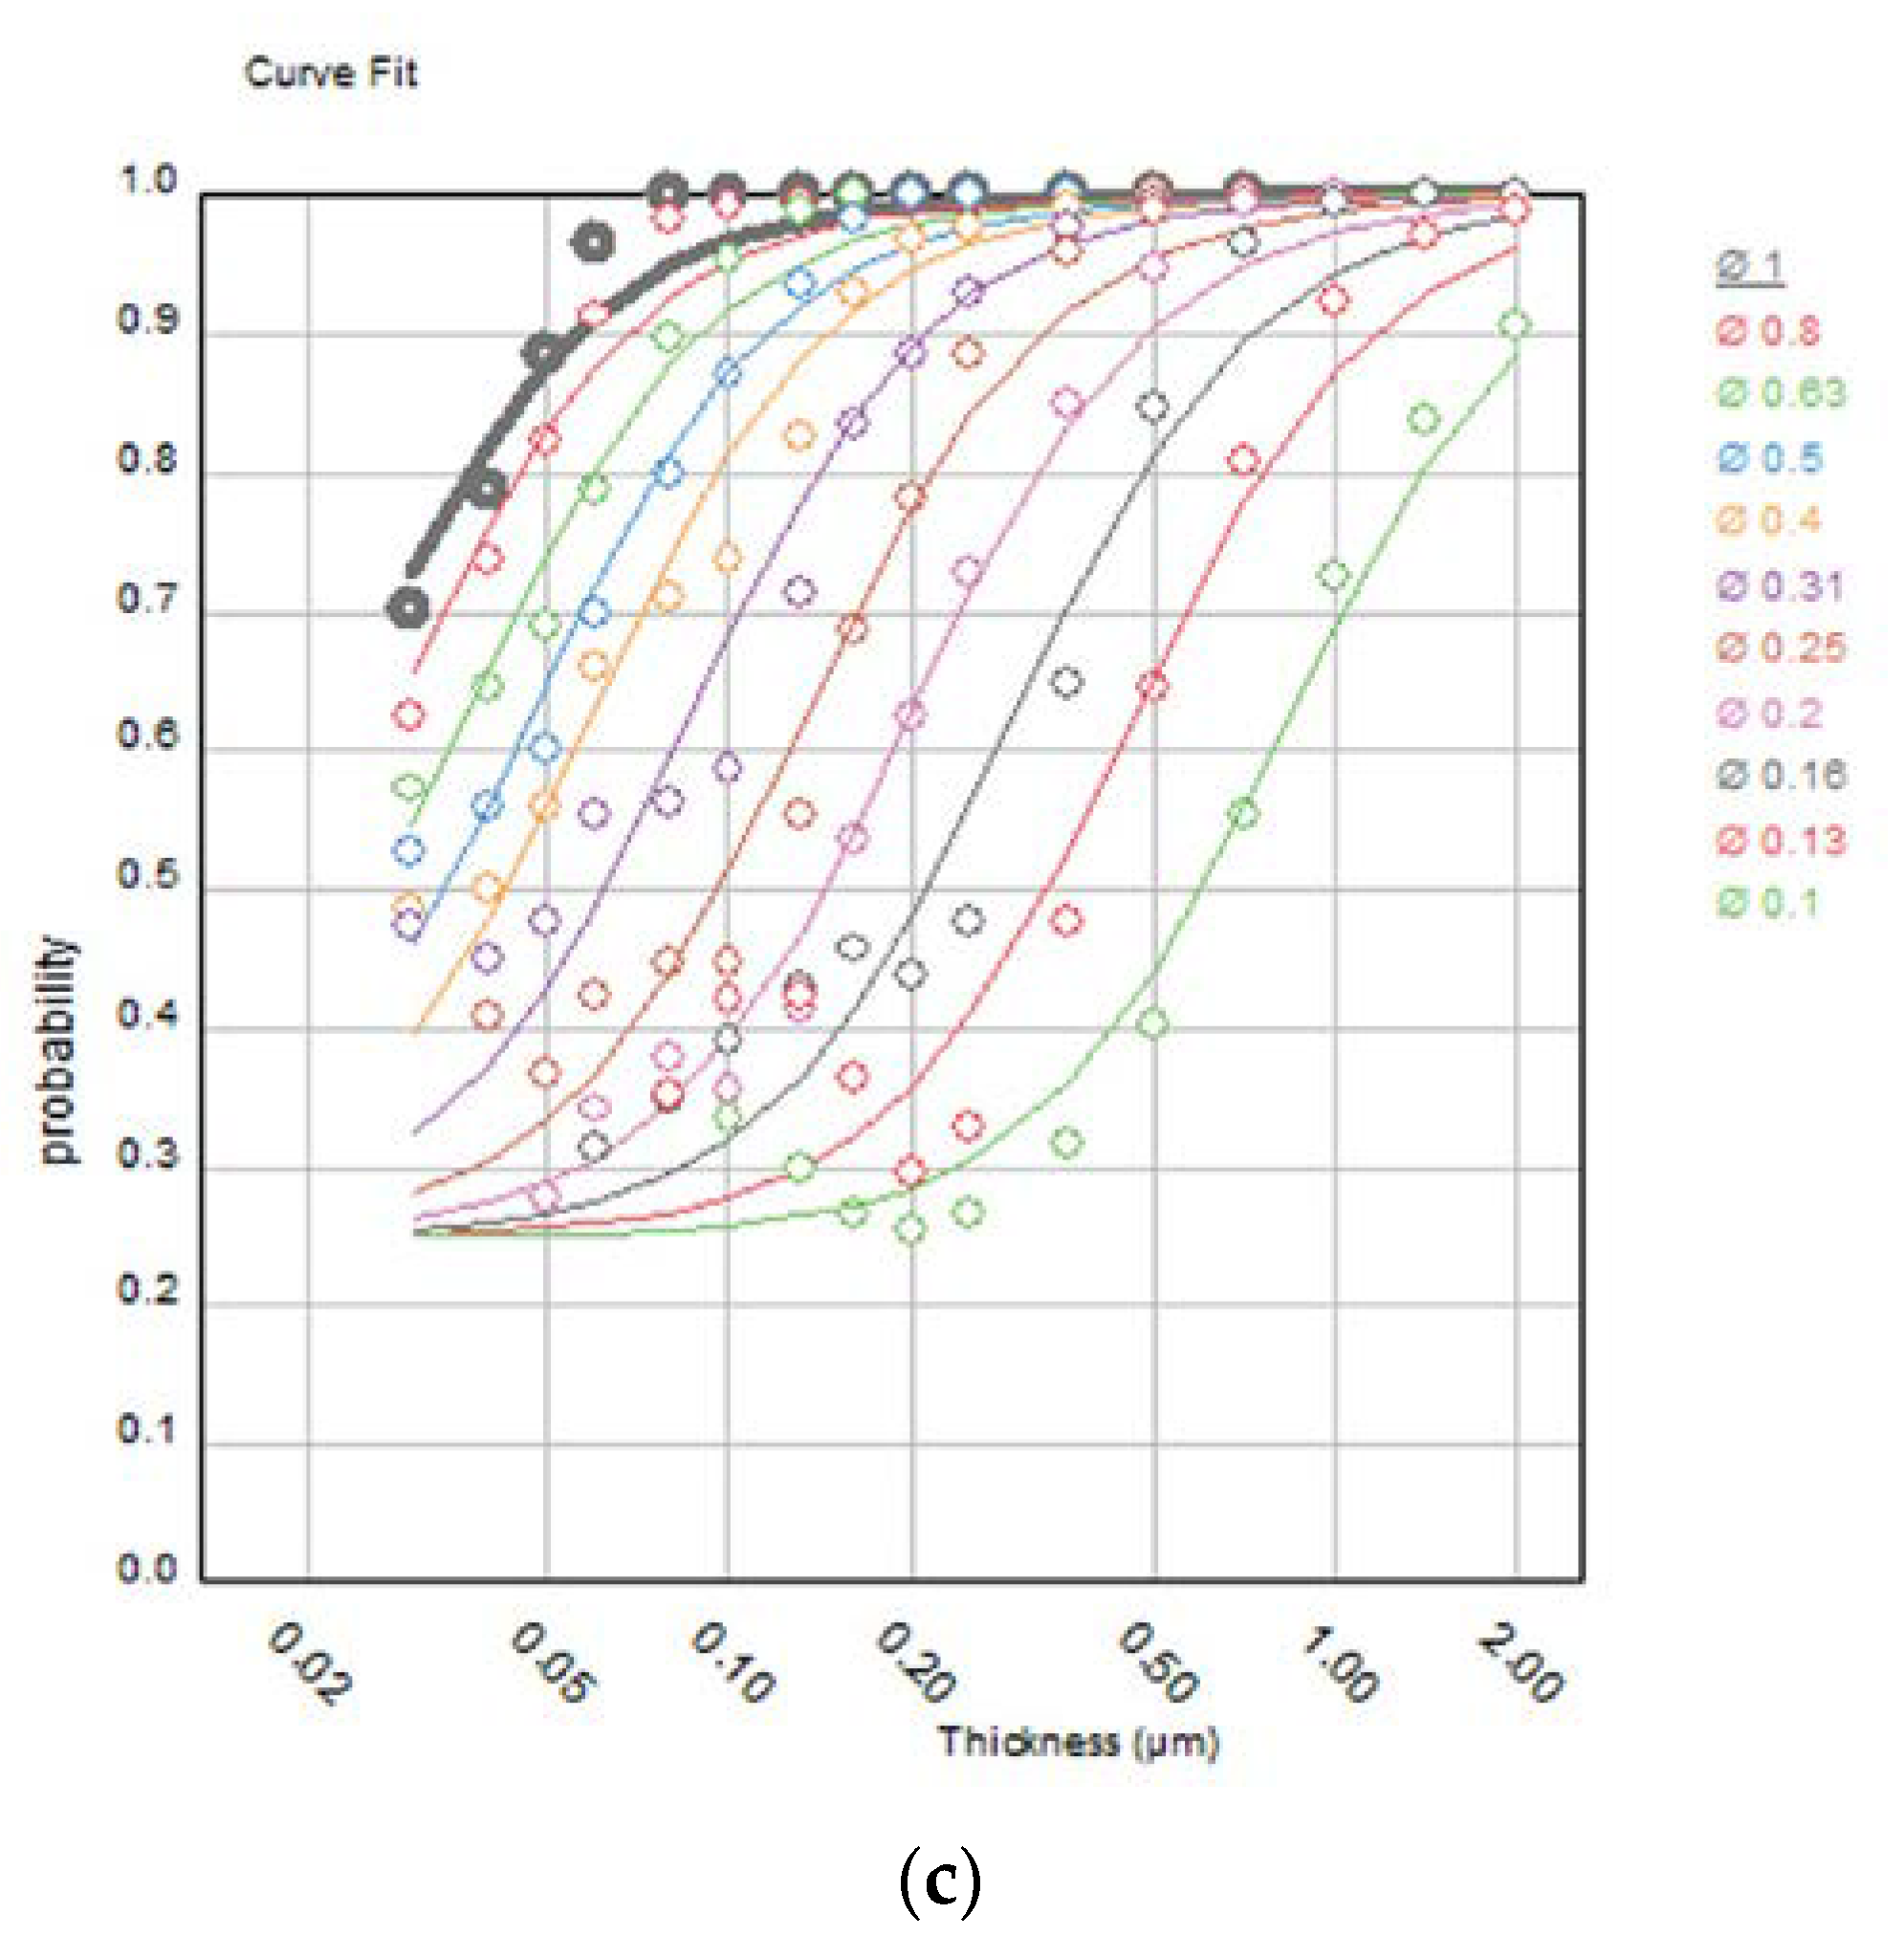
2.2. Image Quality Evaluation Using the CDMAM Phantom
2.3. Mammography System and Acquisition Modes
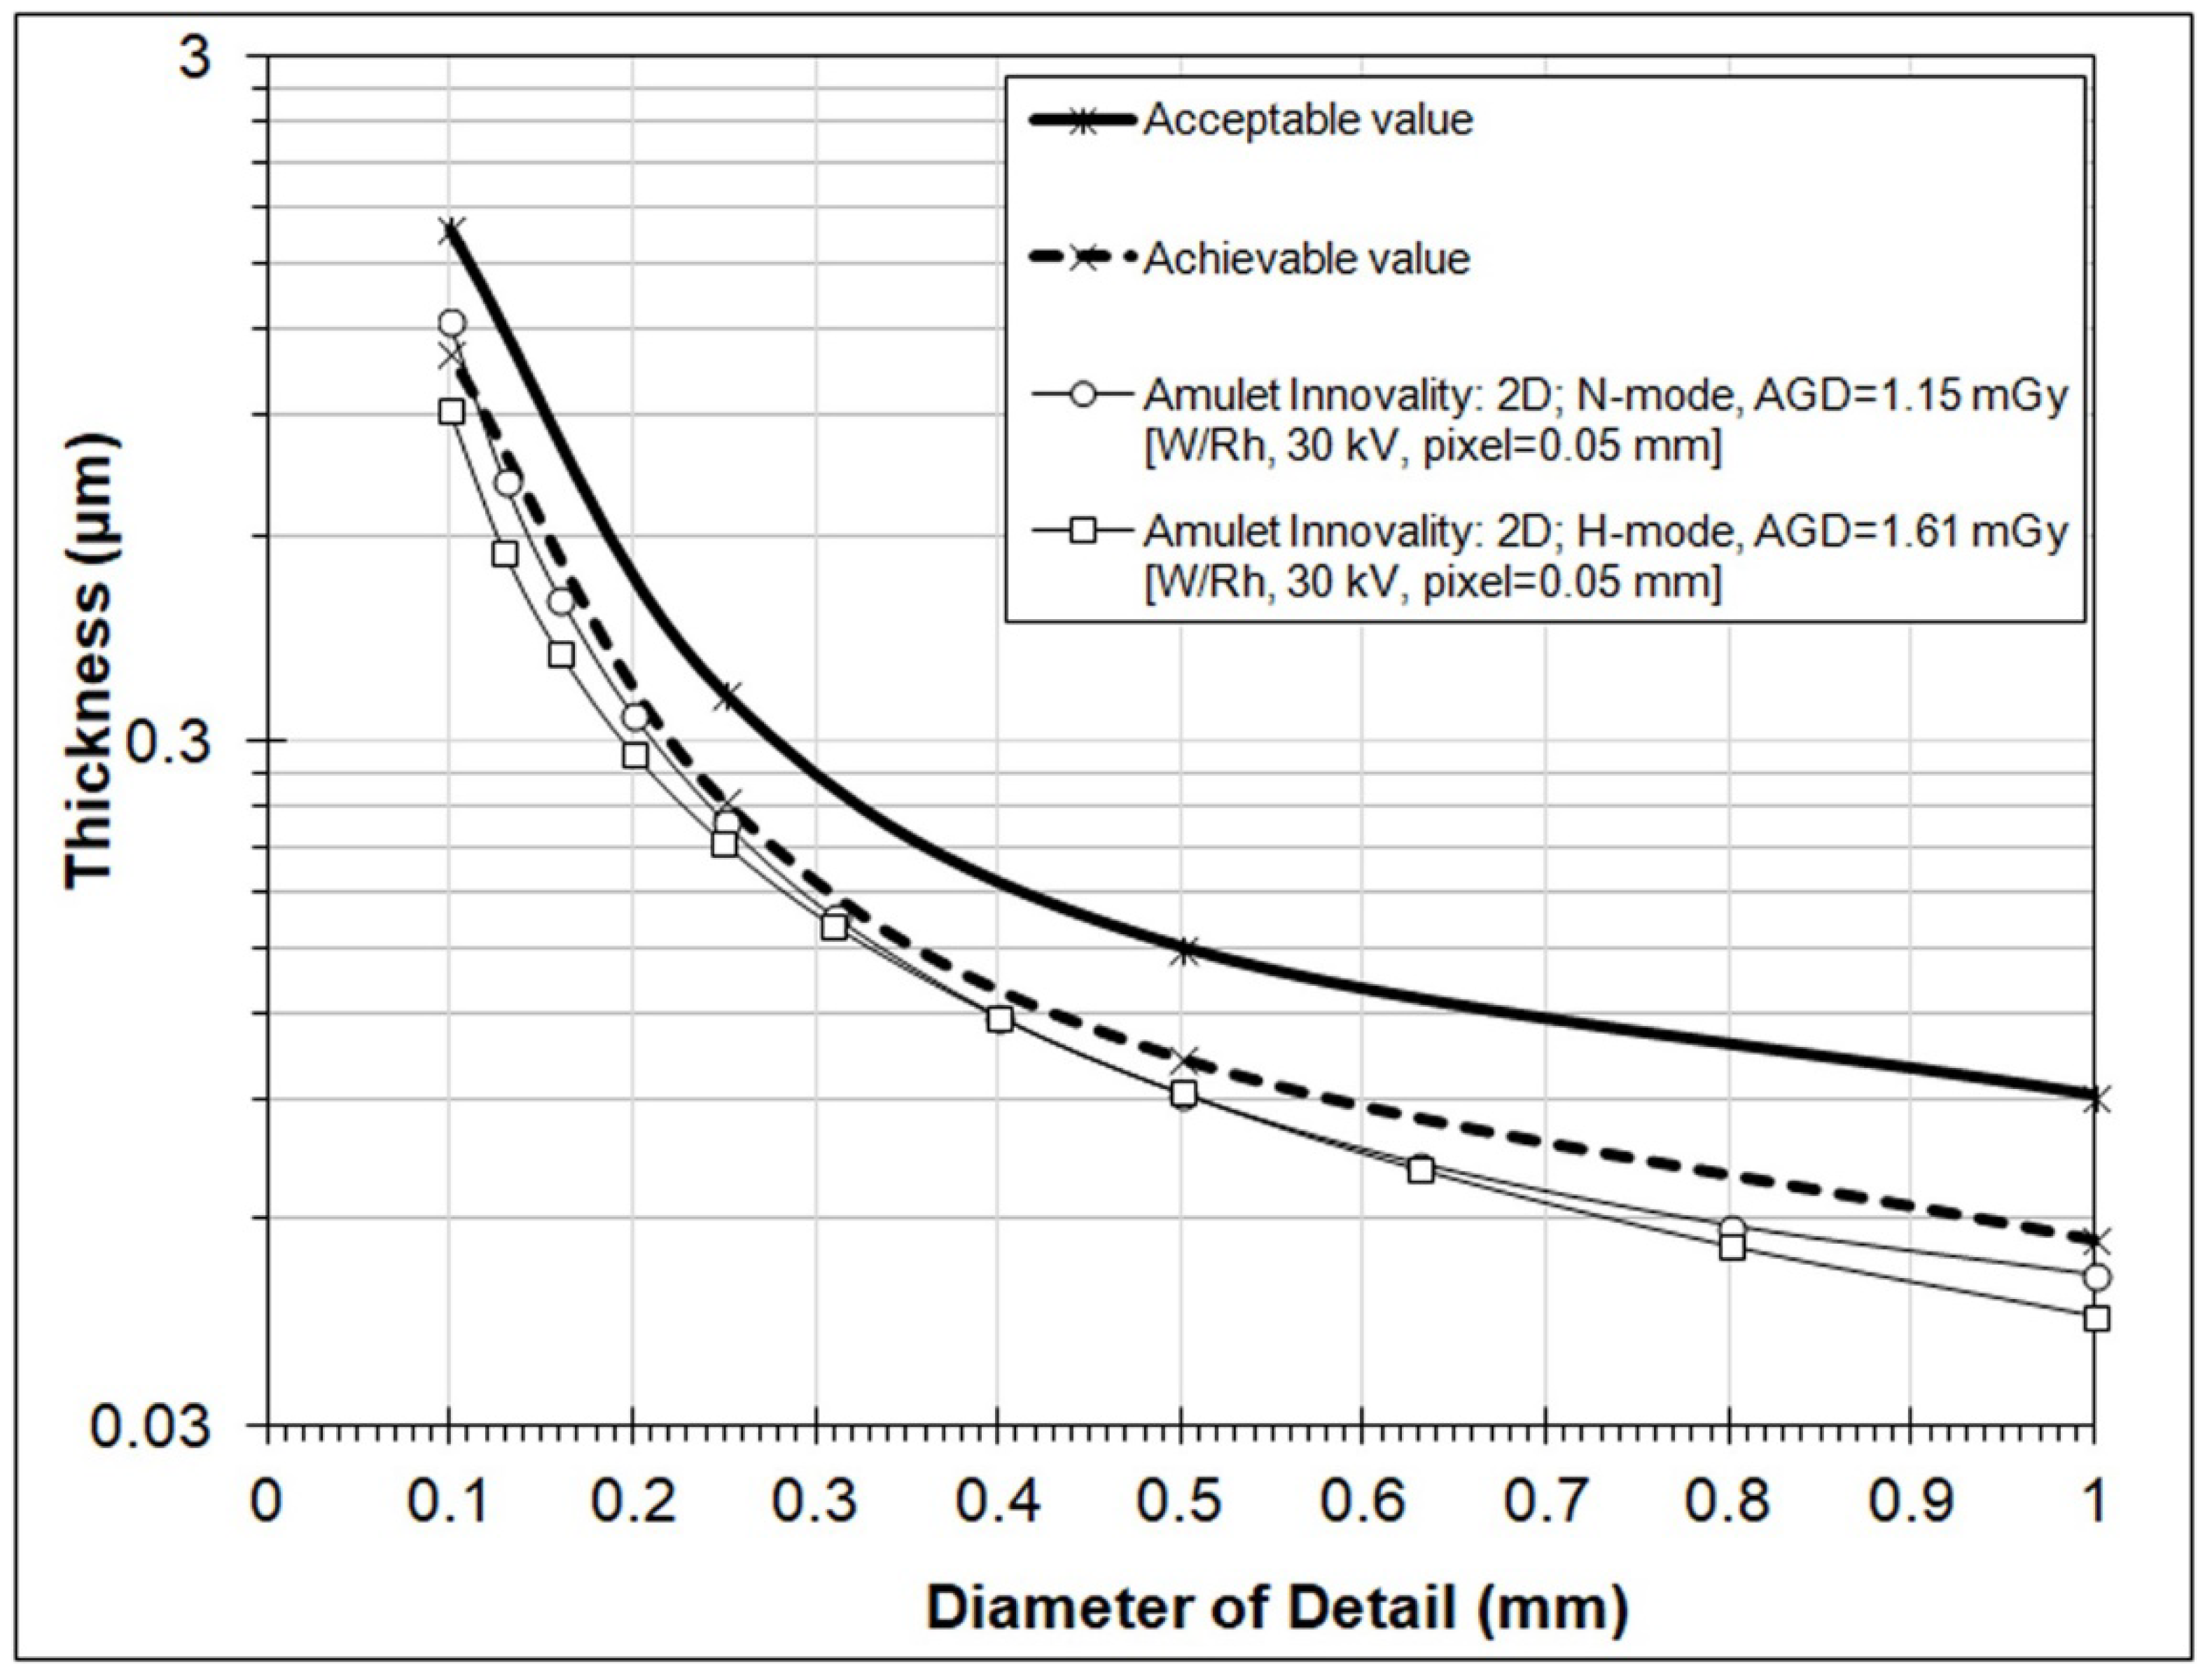
3. Results
4. Discussion
5. Conclusions
Author Contributions
Funding
Institutional Review Board Statement
Informed Consent Statement
Data Availability Statement
Conflicts of Interest
References
- Pisano, E.D.; Gatsonis, C.; Hendrick, E.; Yaffe, M.; Baum, J.K.; Acharyya, S.; Conant, E.F.; Fajardo, L.L.; Bassett, L.; D’Orsi, C.; et al. Diagnostic performance of digital versus film mammography for breast-cancer screening. N. Engl. J. Med. 2005, 353, 1773–1783. [Google Scholar] [CrossRef] [PubMed]
- Durand, M.A. Synthesized Mammography: Clinical Evidence, Appearance, and Implementation. Diagnostics 2018, 8, 22. [Google Scholar] [CrossRef] [PubMed] [Green Version]
- Hovda, T.; Holen, Å.S.; Lång, K.; Albertsen, J.L.; Bjørndal, H.; Brandal, S.H.; Sahlberg, K.K.; Skaane, P.; Suhrke, P.; Hofvind, S. Interval and Consecutive Round Breast Cancer after Digital Breast Tomosynthesis and Synthetic 2D Mammography versus Standard 2D Digital Mammography in BreastScreen Norway. Radiology 2020, 294, 256–264. [Google Scholar] [CrossRef] [PubMed]
- Hofvind, S.; Holen, Å.S.; Aase, H.S.; Houssami, N.; Sebuødegård, S.; Moger, T.A.; Haldorsen, I.S.; Akslen, L.A. Two-view digital breast tomosynthesis versus digital mammography in a population-based breast cancer screening programme (To-Be): A randomised, controlled trial. Lancet Oncol. 2019, 20, 795–805. [Google Scholar] [CrossRef]
- Bahl, M.; Mercaldo, S.; Vijapura, C.A.; McCarthy, M.A.; Lehman, C.D. Comparison of performance metrics with digital 2D versus tomosynthesis mammography in the diagnostic setting. Eur. Radiol. 2019, 29, 477–484. [Google Scholar] [CrossRef] [PubMed]
- Alshafeiy, T.I.; Nguyen, J.V.; Rochman, C.M.; Nicholson, B.T.; Patrie, J.T.; Harvey, J.A. Outcome of Architectural Distortion Detected Only at Breast Tomosynthesis versus 2D Mammography. Radiology 2018, 288, 38–46. [Google Scholar] [CrossRef] [PubMed] [Green Version]
- Romero Martín, S.; Raya Povedano, J.L.; Cara García, M.; Santos Romero, A.L.; Pedrosa Garriguet, M.; Álvarez Benito, M. Prospective study aiming to compare 2D mammography and tomosynthesis + synthesized mammography in terms of cancer detection and recall. From double reading of 2D mammography to single reading of tomosynthesis. Eur. Radiol. 2018, 28, 2484–2491. [Google Scholar] [CrossRef] [PubMed]
- Tagliafico, A.S.; Calabrese, M.; Bignotti, B.; Signori, A.; Fisci, E.; Rossi, F.; Valdora, F.; Houssami, N. Accuracy and reading time for six strategies using digital breast tomosynthesis in women with mammographically negative dense breasts. Eur. Radiol. 2017, 27, 5179–5184. [Google Scholar] [CrossRef] [PubMed]
- Kang, H.-J.; Chang, J.M.; Lee, J.; Song, S.E.; Shin, S.U.; Kim, W.H.; Bae, M.S.; Moon, W.K. Replacing single-view mediolateral oblique (MLO) digital mammography (DM) with synthesized mammography (SM) with digital breast tomosynthesis (DBT) images: Comparison of the diagnostic performance and radiation dose with two-view DM with or without MLO-DBT. Eur. J. Radiol. 2016, 85, 2042–2048. [Google Scholar] [CrossRef] [PubMed]
- ACR. Mammography Quality Control Manual; ACR: Fort Lauderdale, FL, USA, 1999. [Google Scholar]
- ACR. Digital Mammography Quality Control Manual; ACR: Fort Lauderdale, FL, USA, 2018. [Google Scholar]
- EUREF. European Protocol for the Quality Control of the physical and technical aspects of mammography screening. In European Guidelines for Quality Assurance in Mammography Screening, 4th ed.; European Union: Maastricht, The Netherlands, 2006; Chapter 2. [Google Scholar]
- EUREF. European Guidelines for Quality Assurance in Mammography Screening, 4th ed.; Supplements; European Union: Maastricht, The Netherlands, 2013. [Google Scholar]
- Mackenzie, A.; Warren, L.M.; Wallis, M.G.; Given-Wilson, R.M.; Cooke, J.; Dance, D.R.; Chakraborty, D.P.; Halling-Brown, M.D.; Looney, P.T.; Young, K.C. The relationship between cancer detection in mammography and image quality measurements. Phys. Med. 2016, 32, 568–574. [Google Scholar] [CrossRef] [PubMed] [Green Version]
- van Engen, R.E.; Bosmans, H.; Bouwman, R.W.; Dance, D.R.; Heid, P.; Lazzari, B.; Marshall, N.; Phelan, N.; Schopphoven, S.; Strudley, C.; et al. Protocol for the Quality Control of the Physical and Technical Aspects of Digital Breast Tomosynthesis Systems, Version 1.03; EUREF: Berlin, Germany, 2018. [Google Scholar]
- Artinis. Manual Contrast-Detail Phantom CDMAM 3.4 & CDMAM 3.4 Analyser Software V2.3, Version 1.3; Artinis Medical Systems: Einsteinweg, The Netherlands, 2017. [Google Scholar]
- Young, K.; Alsagera, A.; Oduko, J.M.; Bosmans, H.; Verbrugge, B.; Geertse, T.; van Engen, R. Evaluation of software for reading images of the CDMAM test object to assess digital mammography systems. In Proceedings Volume 6913, Medical Imaging 2008: Physics of Medical Imaging 69131C; SPIE: Bellingham, WA, USA, 2008. [Google Scholar]
- Veldkamp, W.J.; Thijssen, M.A.; Karssemeijer, N. The value of scatter removal by a grid in full field digital mammography. Med. Phys. 2003, 30, 1712–1718. [Google Scholar] [CrossRef] [PubMed]
- Figl, M.; Hoffmann, R.; Kaar, M.; Semturs, F.; Brasik, N.; Birkfellner, W.; Homolka, P.; Hummel, J. Factors for conversion between human and automatic read-outs of CDMAM images. Med. Phys. 2011, 38, 5090–5093. [Google Scholar] [CrossRef] [PubMed]
- Figl, M.; Homolka, P.; Osanna-Elliott, A.; Semturs, F.; Kaar, M.; Hummel, J. Conversion factors between human and automatic readouts of CDMAM phantom images of CR mammography systems. Phys. Med. Biol. 2016, 61, N514–N521. [Google Scholar] [CrossRef] [PubMed]
- Tsalafoutas, I.A.; Metallidis, S. A method for calculating the dose length product from CT DICOM images. Br. J. Radiol. 2011, 84, 236–243. [Google Scholar] [CrossRef] [PubMed] [Green Version]
- Stancampiano, C.; Boschiroli, L.; Campoleonic, M.; Vismarab, L.O. Comparison of 2D synthesized mammography versus standard full-field digital mammography: Quantitative and qualitative image analysis. Phys. Med. 2018, 56 (Suppl. S2), 226–227. [Google Scholar] [CrossRef]
- Nelson, J.S.; Wells, J.R.; Baker, J.A.; Samei, E. How does c-view image quality compare with conventional 2D FFDM? Med. Phys. 2016, 43, 2538. [Google Scholar] [CrossRef] [PubMed]
- Wahab, R.A.; Lee, S.J.; Zhang, B.; Sobel, L.; Mahoney, M.C. A comparison of full-field digital mammograms versus 2D synthesized mammograms for detection of microcalcifications on screening. Eur. J. Radiol. 2018, 107, 14–19. [Google Scholar] [CrossRef] [PubMed]
- Liu, H.; Rashid, T.; Ware, J.; Jensen, P.; Austin, T.; Nasrallah, I.; Bryan, R.; Heckbert, S.; Habes, M. Adaptive Squeeze-and-Shrink Image Denoising for Improving Deep Detection of Cerebral Microbleeds. In International Conference on Medical Image Computing and Computer-Assisted Intervention; Springer: Cham, Switzerland, 2021; pp. 265–275. [Google Scholar]

| Image Number | IQFinv | Total Detected (%) |
|---|---|---|
| 1 | 148.19 | 67.61 |
| 2 | 118.69 | 65.34 |
| 3 | 144.99 | 67.61 |
| 4 | 143.48 | 68.18 |
| 5 | 144.94 | 69.32 |
| 6 | 159.34 | 69.89 |
| 7 | 135.80 | 68.47 |
| 8 | 141.95 | 67.61 |
| Group Score | 141.59 | 68.00 |
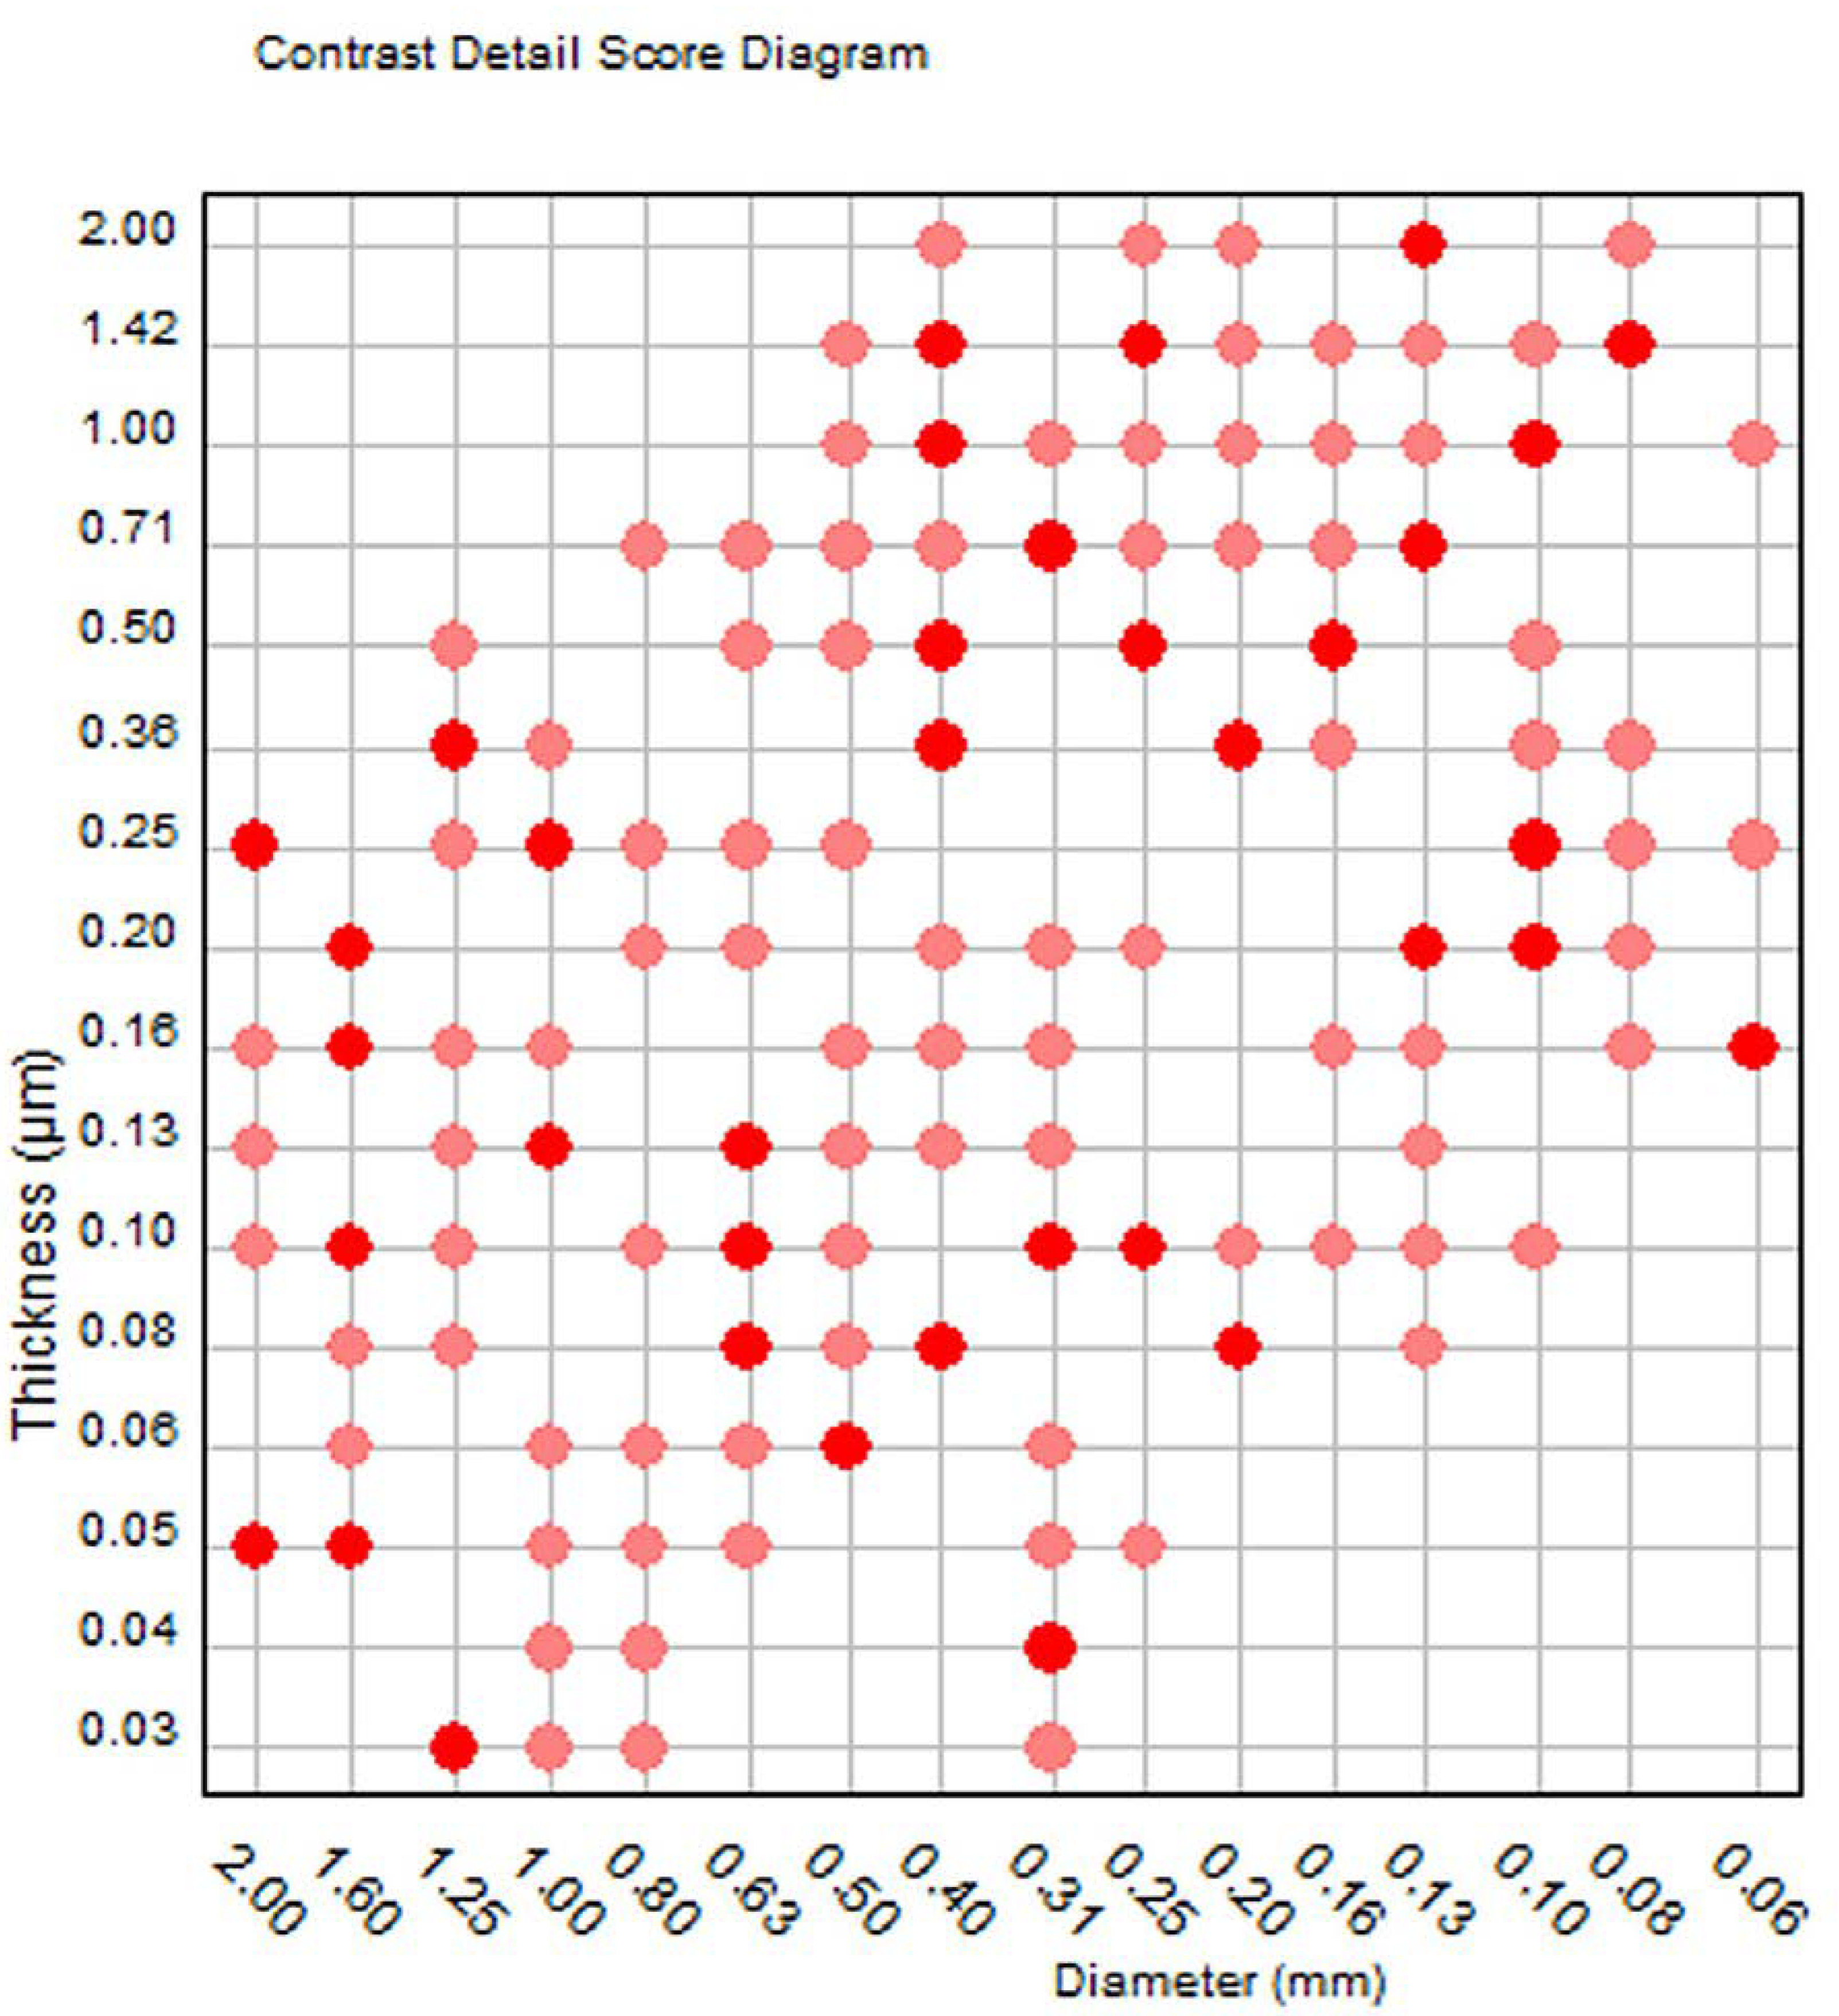
| Gold Disk Diameters (mm) | |||||||||||
|---|---|---|---|---|---|---|---|---|---|---|---|
| Score | 0.10 | 0.13 | 0.16 | 0.20 | 0.25 | 0.31 | 0.40 | 0.50 | 0.63 | 0.80 | 1 |
| Tauto 1 | 0.839 | 0.463 | 0.292 | 0.197 | 1.133 | 0.086 | 0.059 | 0.047 | 0.037 | 0.028 | 0.023 |
| Tpred 2 | 1.231 | 0.723 | 0.479 | 0.337 | 0.237 | 0.160 | 0.114 | 0.094 | 0.075 | 0.585 | 0.049 |
| TFit 3 | 1.240 | 0.723 | 0.488 | 0.329 | 0.229 | 0.167 | 0.119 | 0.092 | 0.072 | 0.590 | 0.050 |
| Gold Disk Diameter (mm) | Acceptable (μm) | Achievable (μm) |
|---|---|---|
| 1 | 0.091 | 0.056 |
| 0.5 | 0.15 | 0.103 |
| 0.25 | 0.352 | 0.244 |
| 0.1 | 1.68 | 1.1 |
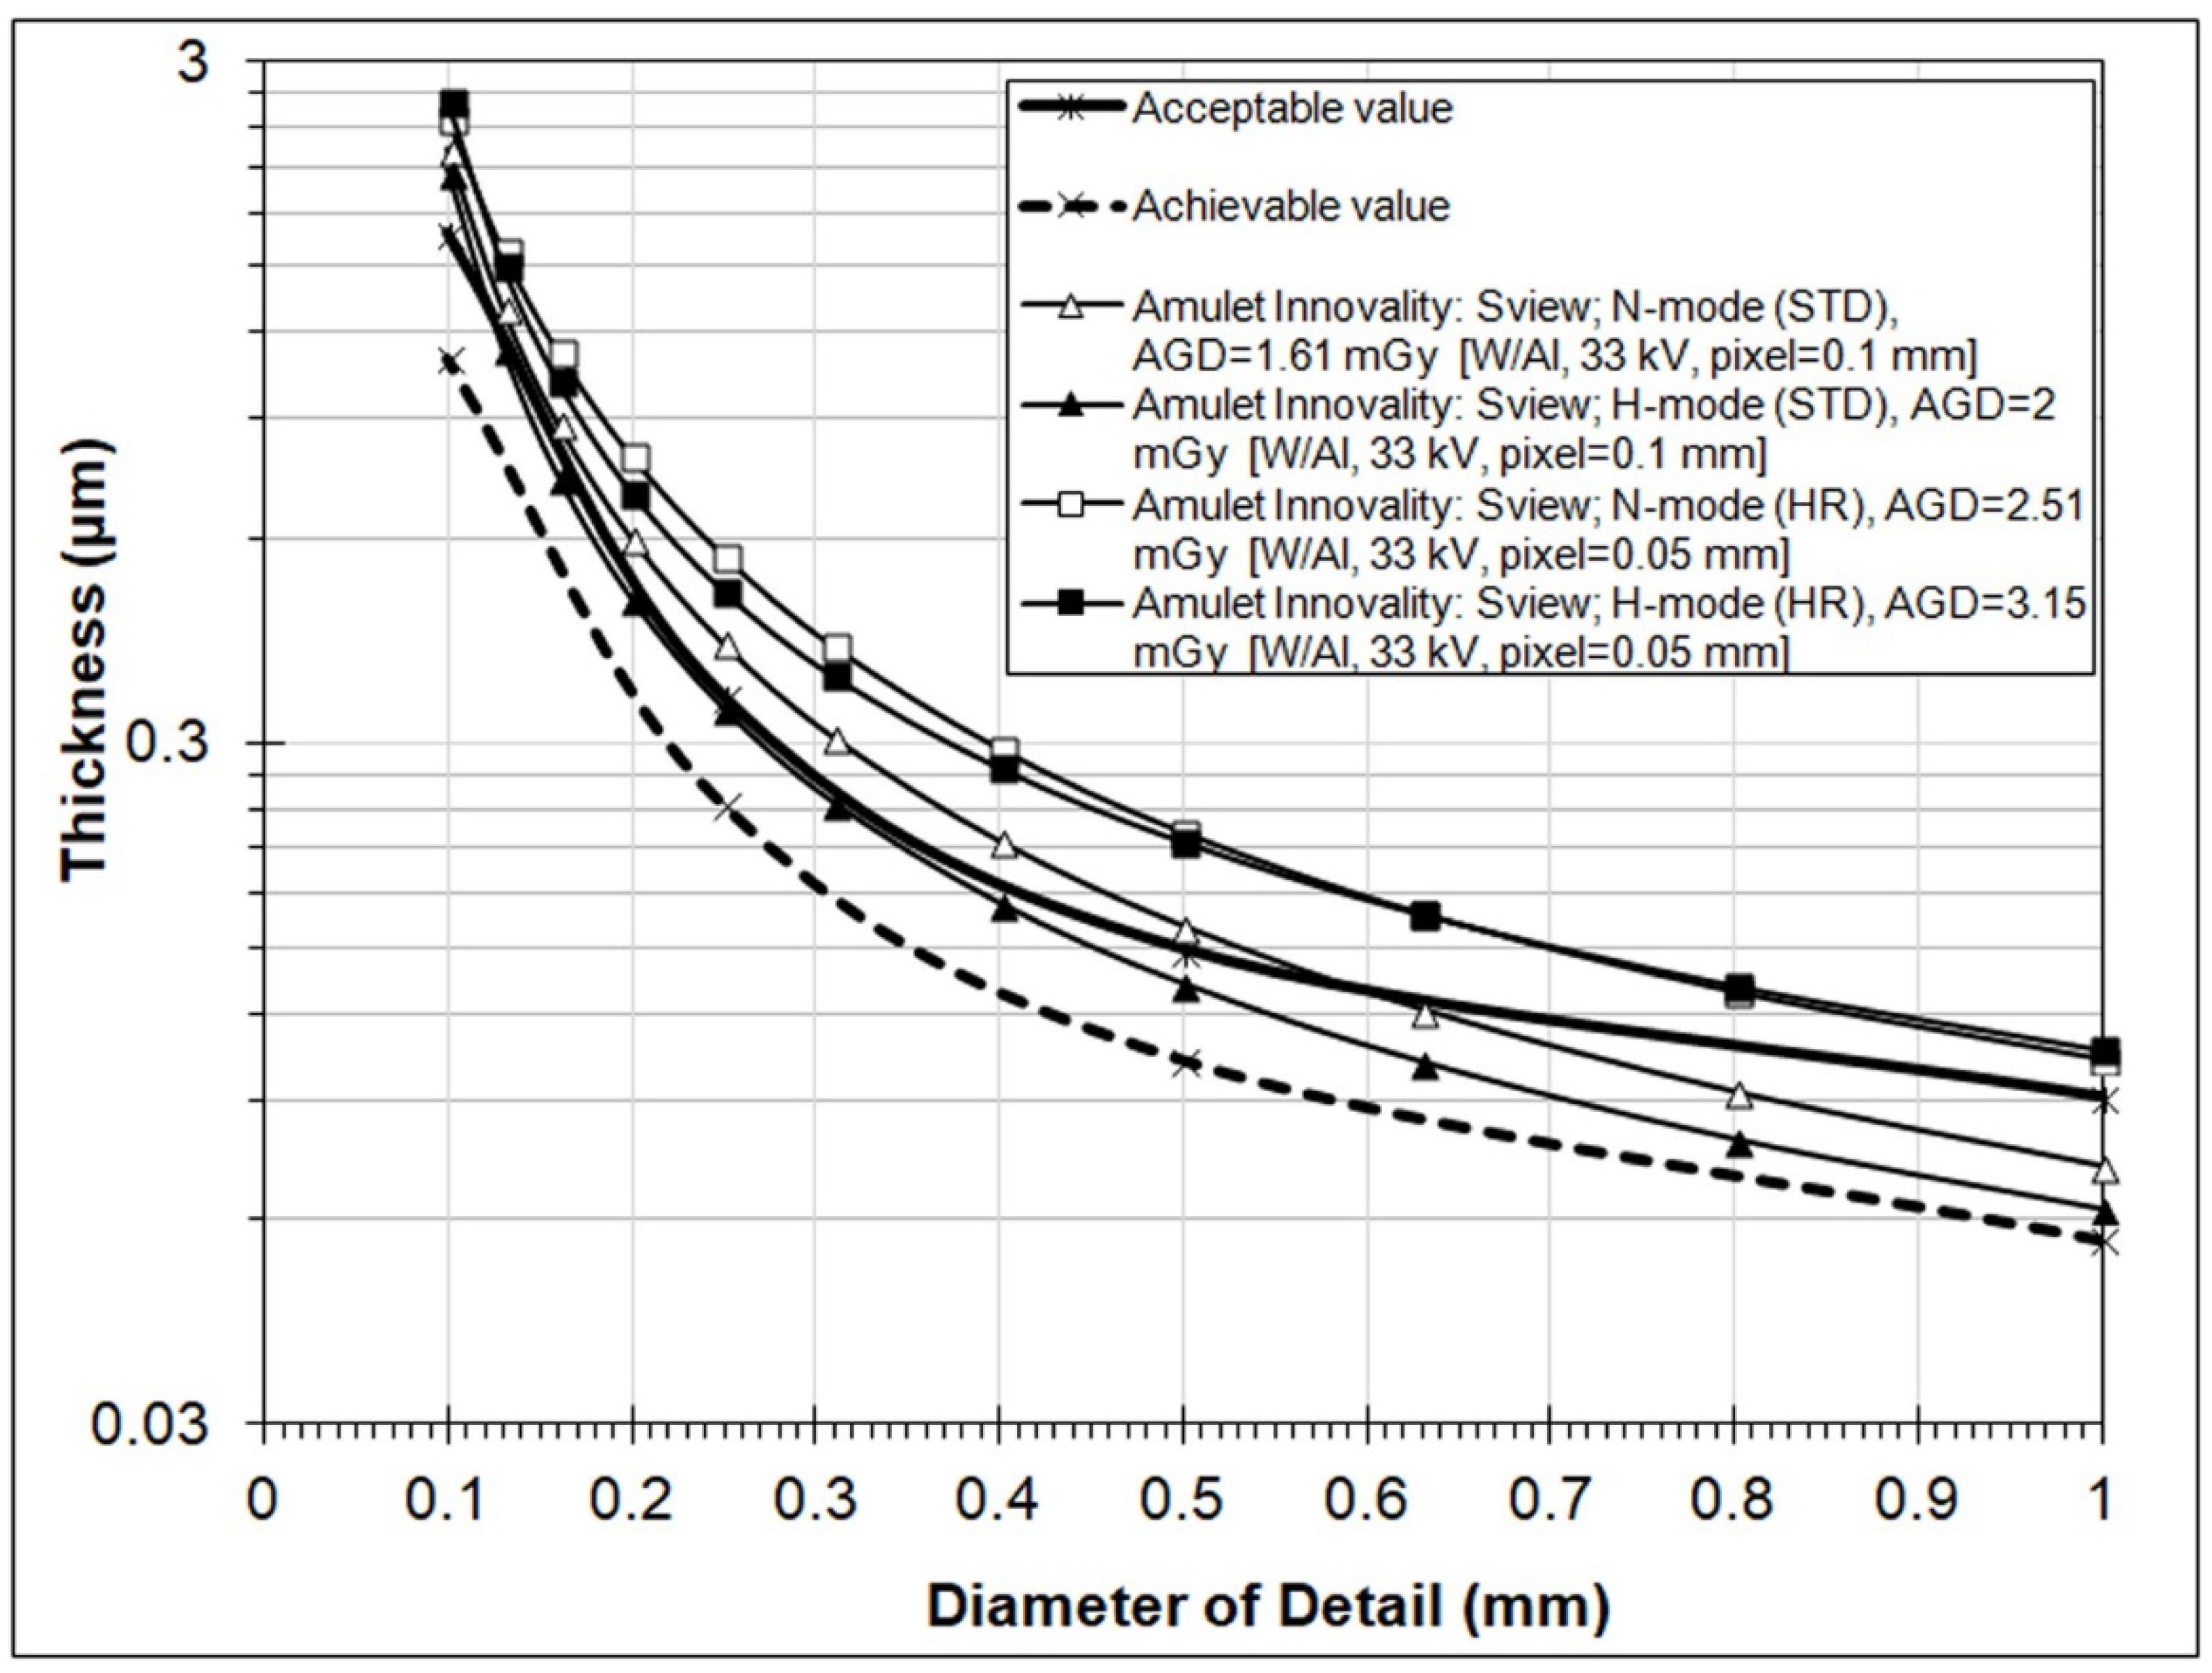
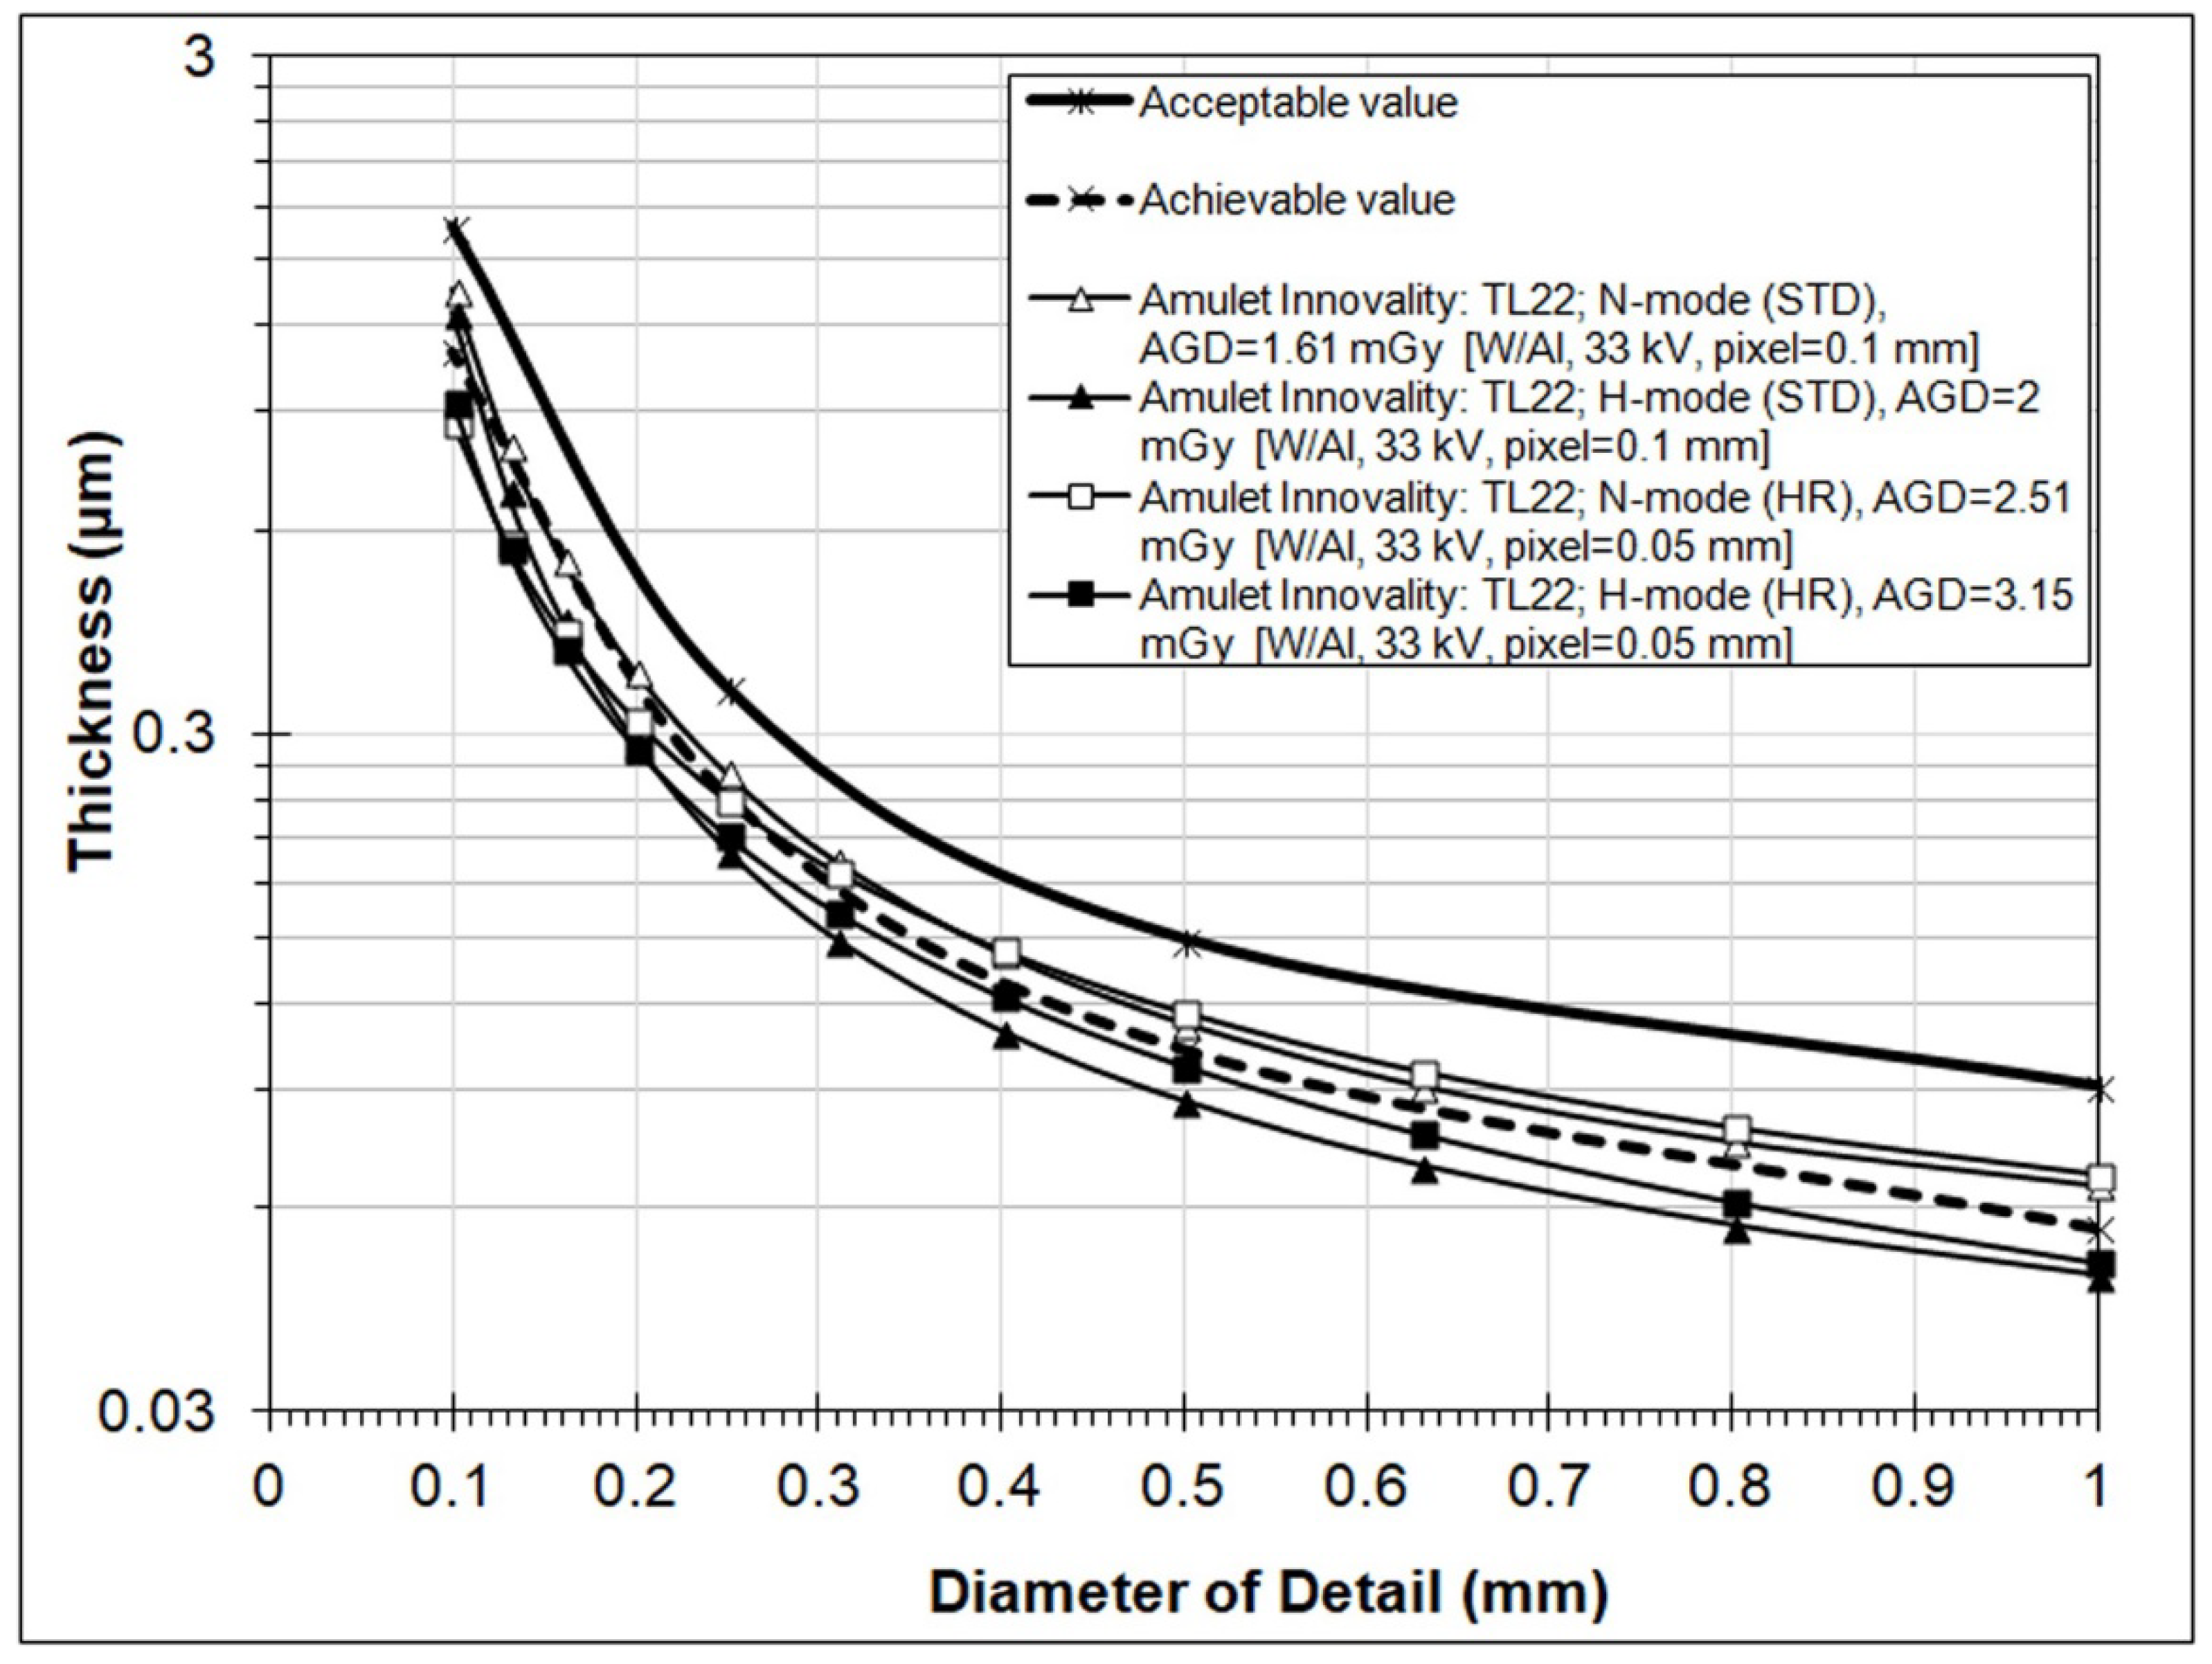
| Data Source | Pixel (mm) | AGD (mGy) | Anode/Filter, kVp, mAs | Fit to Predicted Human Threshold Gold Thickness (in μm) for Detail Diameters (mm) | IQFInv | Total Detected (%) | |||
|---|---|---|---|---|---|---|---|---|---|
| 0.1 | 0.25 | 0.5 | 1 | ||||||
| 2D: N-mode | 0.05 | 1.15 | W/Rh, 30, 71 | 1.23 | 0.23 | 0.09 | 0.05 | 141.59 | 68 |
| 2D: H-mode | 0.05 | 1.61 | W/Rh, 30, 100 | 0.91 | 0.21 | 0.09 | 0.04 | 162.24 | 69.7 |
| Sview: N-mode (ST) | 0.1 | 1.61 | W/Al, 33, 32 | 2.24 | 0.42 | 0.16 | 0.07 | 80.26 | 58.84 |
| Sview: H-mode (ST) | 0.1 | 2 | W/Al, 33, 40 | 2.08 | 0.34 | 0.13 | 0.06 | 94.28 | 61.65 |
| Sview: N-mode (HR) | 0.05 | 2.51 | W/Al, 33, 50 | 2.49 | 0.57 | 0.22 | 0.1 | 62.16 | 53.44 |
| Sview: H-mode (HR) | 0.05 | 3.15 | W/Al, 33, 63 | 2.63 | 0.5 | 0.22 | 0.11 | 64.92 | 54.08 |
| TL22: N-mode (ST) | 0.1 | 1.61 | W/Al, 33, 32 | 1.36 | 0.26 | 0.11 | 0.06 | 121.43 | 65.48 |
| TL22: H-mode (ST) | 0.1 | 2 | W/Al, 33, 40 | 1.26 | 0.2 | 0.09 | 0.05 | 150.45 | 68.61 |
| TL22: N-mode (HR) | 0.05 | 2.51 | W/Al, 33, 50 | 0.87 | 0.24 | 0.12 | 0.07 | 139.56 | 67.22 |
| TL22: H-mode (HR) * | 0.05 | 3.15 | W/Al, 33, 63 | 0.93 | 0.21 | 0.1 | 0.05 | 157.32 | 69.32 |
Publisher’s Note: MDPI stays neutral with regard to jurisdictional claims in published maps and institutional affiliations. |
© 2022 by the authors. Licensee MDPI, Basel, Switzerland. This article is an open access article distributed under the terms and conditions of the Creative Commons Attribution (CC BY) license (https://creativecommons.org/licenses/by/4.0/).
Share and Cite
Tsalafoutas, I.A.; Epistatou, A.C.; Delibasis, K.K. Image Quality Comparison between Digital Breast Tomosynthesis Images and 2D Mammographic Images Using the CDMAM Test Object. J. Imaging 2022, 8, 223. https://doi.org/10.3390/jimaging8080223
Tsalafoutas IA, Epistatou AC, Delibasis KK. Image Quality Comparison between Digital Breast Tomosynthesis Images and 2D Mammographic Images Using the CDMAM Test Object. Journal of Imaging. 2022; 8(8):223. https://doi.org/10.3390/jimaging8080223
Chicago/Turabian StyleTsalafoutas, Ioannis A., Angeliki C. Epistatou, and Konstantinos K. Delibasis. 2022. "Image Quality Comparison between Digital Breast Tomosynthesis Images and 2D Mammographic Images Using the CDMAM Test Object" Journal of Imaging 8, no. 8: 223. https://doi.org/10.3390/jimaging8080223
APA StyleTsalafoutas, I. A., Epistatou, A. C., & Delibasis, K. K. (2022). Image Quality Comparison between Digital Breast Tomosynthesis Images and 2D Mammographic Images Using the CDMAM Test Object. Journal of Imaging, 8(8), 223. https://doi.org/10.3390/jimaging8080223