1. Introduction
Nowadays, people increasingly communicate through media in form of audio, video, and digital images. Therefore, image quality assessment (IQA) has found many applications and become a hot research topic in the research community [
1]. Namely, IQA methods evaluate the perceptual quality of digital images and support, among others, image enhancement [
2], restoration [
3], steganography [
4], or denoising algorithms [
5]. Further, IQA is also necessary in the benchmarking of many image processing or computer-vision algorithms [
6,
7,
8]. In the literature, IQA is classified into two groups, i.e., subjective and objective IQA. Specifically, subjective IQA deals with the collection of users’ quality ratings for a set of digital images either in a laboratory [
1] or in an online crowd-sourcing experiment [
9]. Moreover, images’ perceptual quality is expressed as a mean opinion score (MOS), which is the arithmetic mean of individual quality scores. As a result, subjective IQA provides quality labelled images with objective IQA as training or test data [
10]. Namely, objective IQA deals with algorithms and mathematical models that are able to predict the quality of a given image. Conventionally, objective IQA is divided into three classes [
11]—full-reference (FR) [
12], reduced-reference (RR) [
13], and no-reference (NR) [
14]—with respect to the availability of the reference (distortion-free) images. As the names indicate, FR-IQA methods have full access to the reference images. In contrast, NR-IQA algorithms evaluate image quality without any information about the reference images [
15], and RR-IQA algorithms have partial information about them.
1.1. Contribution
The development of objective FR-IQA algorithms can also involve fusion-based strategies that already take existing FR-IQA metrics and try to create a “super evaluator”. Recently, many complex fusion-based approaches have been published in the literature [
16,
17,
18,
19]. The main contribution to this paper is also a fusion-based approach. Namely, we demonstrate a solution based on a linear combination of several already existing FR-IQA metrics optimized with a simulated annealing (SA) algorithm using a root mean square error (RMSE) objective, which is able to produce well-performing fusion-based FR-IQA metrics. To be more specific, a linear combination of 16 FR-IQA metrics is used in an optimization problem to select FR-IQA metrics and find their weights via an SA algorithm that minimizes the RMSE of the prediction. Unlike the approach of Oszust [
20], we apply simulated annealing instead of a genetic algorithm for performing the fusion of FR-IQA metrics. Namely, simulated annealing usually achieves better results in the case of continuous function approximation than basic genetic algorithms because they choose one or two genes at a given location [
21]. The proposed fusion-based metrics was evaluated on large, popular, and widely accepted IQA benchmark databases, such as LIVE [
22], TID2013 [
23], TID2008 [
24], and CSIQ [
25].
1.2. Organization
The rest of this paper is organized as follows. In
Section 2, an overview about the current state of FR-IQA is given. Next, the proposed fusion-based metric is introduced in
Section 3. Our experimental results, together with the description of the applied benchmark IQA databases, evaluation environment, and performance indices, are given in
Section 4. Finally, a conclusion is drawn in
Section 5.
2. Literature Review
In this paper, we follow the classification of FR-IQA algorithms presented in [
26]. To be specific, Ding et al. [
26] categorized existing FR-IQA algorithms into five distinct classes, i.e., error visibility, structural similarity, information theoretic, learning-based, and fusion-based methods.
Error visibility methods measure a distance between the pixels of the distorted and the reference images to quantify perceptual quality degradation. The representative method of this class of FR-IQA is the mean squared error (MSE) method, which measures the average of the squares of the errors. In other words, it is the average squared difference between the reference and the distorted images in the context of FR-IQA [
27]. Another well-known example is the peak signal-to-noise ratio (PSNR), which is commonly applied to assess the quality of the reconstruction of lossy compression codecs [
28]. Although both MSE and PSNR have low computational costs and their physical meaning is clear and well understood, they often mismatch with subjective perceptions of visual quality.
Structural similarity methods measure the similarity between the corresponding regions of the distorted and reference images using sliding-windows in the images and correlation measures. The representative and first published method of this class is the structural similarity index (SSIM) [
29], which has become extremely popular in the field with many extensions and applications [
30]. The theorem of SSIM has become extremely popular in the research community and inspired many variants. For example, the wavelet domain structural similarity [
31] carries out SSIM in the wavelet domain to quantify perceptual quality. This work was extended by Sampat et al. [
32] into the complex wavelet domain. In [
33], information content was utilized as weights in the pooling process of local image quality scores. In contrast, Wang et al. [
34] extended SSIM to multi-scale processing to improve perceptual quality estimation. Li and Bovik [
35] elaborated an FR-IQA metric by taking the average of SSIMs computed over three different regions of an image, such as edges, textures, and smooth regions. Kolaman and Yadid-Pecht [
36] found an extension of SSIM to color images by representing red, green, and blue color channels with quaternions. Later, SSIM was also extended to hyperspectral images [
37].
Information theoretic methods approach the FR-IQA task from the point of view of information communication. For example, Sheikh et al. [
38,
39] compared the information content of the reference and distorted images. Namely, perceptual quality was quantified by how much information is similar between the reference and distorted images. In contrast, Larson and Chandler [
25] classified image distortions as near-threshold and supra-threshold. The authors elaborated two quality indexes for both distortion types. Finally, the overall perceptual quality was determined based on the quality scores of near-threshold and supra-threshold distortions.
As the terminology suggests, learning-based methods rely on a specific machine learning algorithm to create a quality model from training images. Next, the obtained quality model is tested on previously unseen images. For instance, Liang et al. [
40] implemented a special convolutional neural network containing two paths, one for the reference image and the other for the distorted image. Further, this network was trained on
-sized image patches sampled simultaneously from the reference and distorted images. As a consequence, the perceptual quality of a distorted image was estimated by the average score of the considered patches. Kim and Lee [
41] devised a similar network, but it predicts a visual sensitivity map that is multiplied by an error map calculated directly from the reference and the distorted images to estimate perceptual image quality. Ahn et al. [
42] further improved the idea of Kim and Lee [
41] by implementing an end-to-end trained convolutional neural network with three inputs, i.e., reference image, distorted image, and spatial error map. Similar to [
41], a distortion-sensitivity map was predicted from the inputs and was later multiplied by the spatial error map to give an estimation for the perceptual image quality. In contrast to the previously mentioned methods, Ding et al. [
43] extracted a set of feature maps from the reference and the distorted images using the Sobel operator, log Gabor filter, and local pattern analysis. Subsequently, the extracted feature maps were compared, and from the resulting similarity scores a feature vector was compiled that was mapped onto perceptual quality scores with a trained support vector regressor. Tang et al. [
44] took a similar approach, but the authors employed a different set of features (phase congruency maps [
45], gradient magnitude maps, and log Gabor maps). Further, the similarity scores of the feature maps were mapped onto perceptual quality with a trained random forest regressor.
Fusion-based FR-IQA methods utilize existing FR-IQA metrics to create a new FR-IQA algorithm. First, Okarma [
46] suggested the idea of combined methods. Namely, the author proposed a combined metric using the product and power of MS-SSIM [
34], VIF [
38], and R-SVD [
47]. This approach was developed further in [
19], where the optimal exponents in the product were determined by using MATLAB’s fminsearch command. In [
48], Oszust took a similar approach, but the author applied the scores of traditional FR-IQA metrics as predictor variables in a lasso regression. Instead of lasso regression, Yuan et al. [
49] used kernel ridge regression in a similar layout. The work of Lukin et al. [
50] exhibits the properties of both learning-based and fusion-based methods. Specifically, the authors created a training and a test set from the images of an IQA benchmark database. Next, the scores of several traditional FR-IQA metrics were used as image features, and a neural network was trained to estimate perceptual image quality. Amirshahi et al. [
51] elaborated a special fusion-based FR-IQA metric relying on a pretrained convolutional neural network. Namely, the authors ran a reference-distorted image pair through an AlexNet [
52] network and compared the activation maps with the help of a traditional FR-IQA metric. Next, the resulted scores were aggregated to obtain a single score for the perceptual image quality. Bakurov et al. [
53] revisited the classical SSIM [
29] and MS-SSIM [
34] metrics by applying evolutionary and swarm intelligence optimization methods to find optimal hyperparameters for SSIM and MS-SSIM instead of the original settings. Fusion-based metrics were also proposed for remote sensing images [
54], stitched panoramic images [
55], and 3D image quality assessment [
18].
For more detailed studies about FR-IQA, we refer readers to the book of Xu et al.’s [
56] and to the study of Pedersen and Hardeberg [
57]. Further, Zhang et al. [
58] provide an evaluation of several state-of-the-art FR-IQA algorithms on various IQA benchmark databases. Zhai and Min provided an comprehensive overview of classical algorithms in [
59]. For the quality assessment of screen content images [
60], Min et al. gave an overview in [
61].
3. Proposed Method
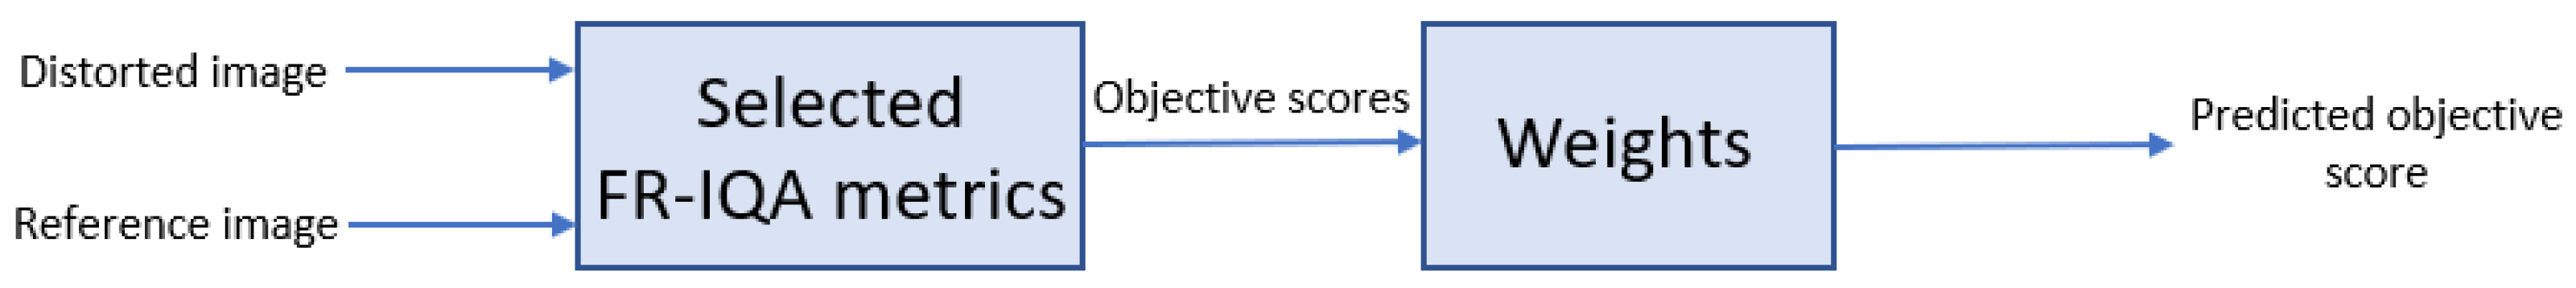
As already mentioned, an FR-IQA metric should deliver perceptual quality scores consistent with the human judgement using both the distorted and reference images. Let us express the aggregated decision of
n different FR-IQA metrics by a weighted sum as:
where
stands for the quality scores provided by the FR-IQA metrics. Further,
is a real vector of weights whose values are found via an optimization procedure to ensure an effective fusion of FR-IQA metrics. Namely, an optimization fusion was carried out in our study using
open-source FR-IQA metrics, such as FSIM [
62], FSIMc [
62], GSM [
63], IFC [
38], IFS [
64], IW-SSIM [
33], MAD [
25], MS-SSIM [
34], NQM [
65], PSNR, RFSIM [
66], SFF [
67], SR-SIM [
12], SSIM [
29], VIF [
39], and VSI [
68].
In the literature, Pearson’s linear correlation coefficient (PLCC), Spearman’s rank-order correlation coefficient (SROCC), Kendall’s rank order correlation coefficient (KROCC), and root mean square error (RMSE) are often considered to characterize the consistency between the ground-truth quality scores of an IQA benchmark database and the quality scores predicted by an FR-IQA metric [
22]. From these performance indices, RMSE was applied as an objective function in the proposed optimization based metric.
Figure 1 and
Figure 2 depict flowcharts where the compilation of the proposed fusion-based metrics and its application for FR-IQA are demonstrated.
Formally, the optimization problem can be written as
where
is vector containing the quality scores of a set of images obtained by Equation (
1) and
contains the corresponding ground-truth scores. Further, prior to the calculation of RMSE, a non-linear regression is also applied [
22] since a non-linear relationship exists between the ground-truth and predicted scores. Formally, it can be written
where
stand for the parameters of the regression model. In addition,
Q and
are the fitted and predicted scores, respectively. Since we use four large, widely accepted IQA benchmark databases, i.e., LIVE [
22], TID2013 [
23], TID2008 [
24], and CSIQ [
25], in this paper, four optimization-based fusion FR-IQA metrics are proposed, respectively. To this end, approximately 20% of the reference images were randomly selected from a given benchmark IQA database. More precisely,
and
were compiled based on those distorted images whose reference counterparts were randomly selected. Although 20% is a common choice for parameter setting in the literature [
69,
70], there are also researchers who applied 30% [
62] or 80% [
71] for parameter tuning. However, we evaluate all the fusion based metrics on all the databases to demonstrate results independent from the database.
Next, the optimization problem was solved described by Equation (
2) to determine the
weights for Equation (
1). Since the number of possible solutions increases exponentially with number of the considered FR-IQA metrics, simulated annealing (SA) [
72,
73] was used to solve the above-described optimization task. Namely, SA is a probabilistic optimization technique for estimating the global optimum of a given function. The stochastic nature of this algorithm enables the usage of nonlinear objective functions where many other methods do not operate well. SA was inspired by the physical model of heating a material and then slowly decreasing the temperature to eliminate imperfections from the material. Hence, minimizing the system’s energy is the main goal. More precisely, the SA randomly generates a new point at each iteration. Based on a probability distribution with a scale proportional to the temperature, the new point’s distance from the present point or the size of the search is determined. All new points that reduce the objective are accepted by the algorithm, but points that increase the objective can also be accepted with a pre-defined probability. Due to this property of the method, SA is prevented from being stuck in local minima in early iterations. In our implementation, the SA was performed using MATLAB R2020a with a Global Optimization Toolbox using
for
as initial point and defining no lower or upper bounds for the method. After 100 runs of SA, the best solution—
—was selected, where
d denotes the database from which 20% of the reference images was chosen randomly.
In the end of the SA optimization processes using LIVE [
22], TID2013 [
23], TID2008 [
24], and CSIQ [
25] databases, the following FR-IQA metrics can be obtained, which are codenamed LCSA, referring to the fact that they are linear combinations of FR-IQA measures selected by simulated annealing:
The corresponding
vectors are as follows:


