
Evaluating the Influence of ipRGCs on Color Discrimination


Abstract
:1. Introduction
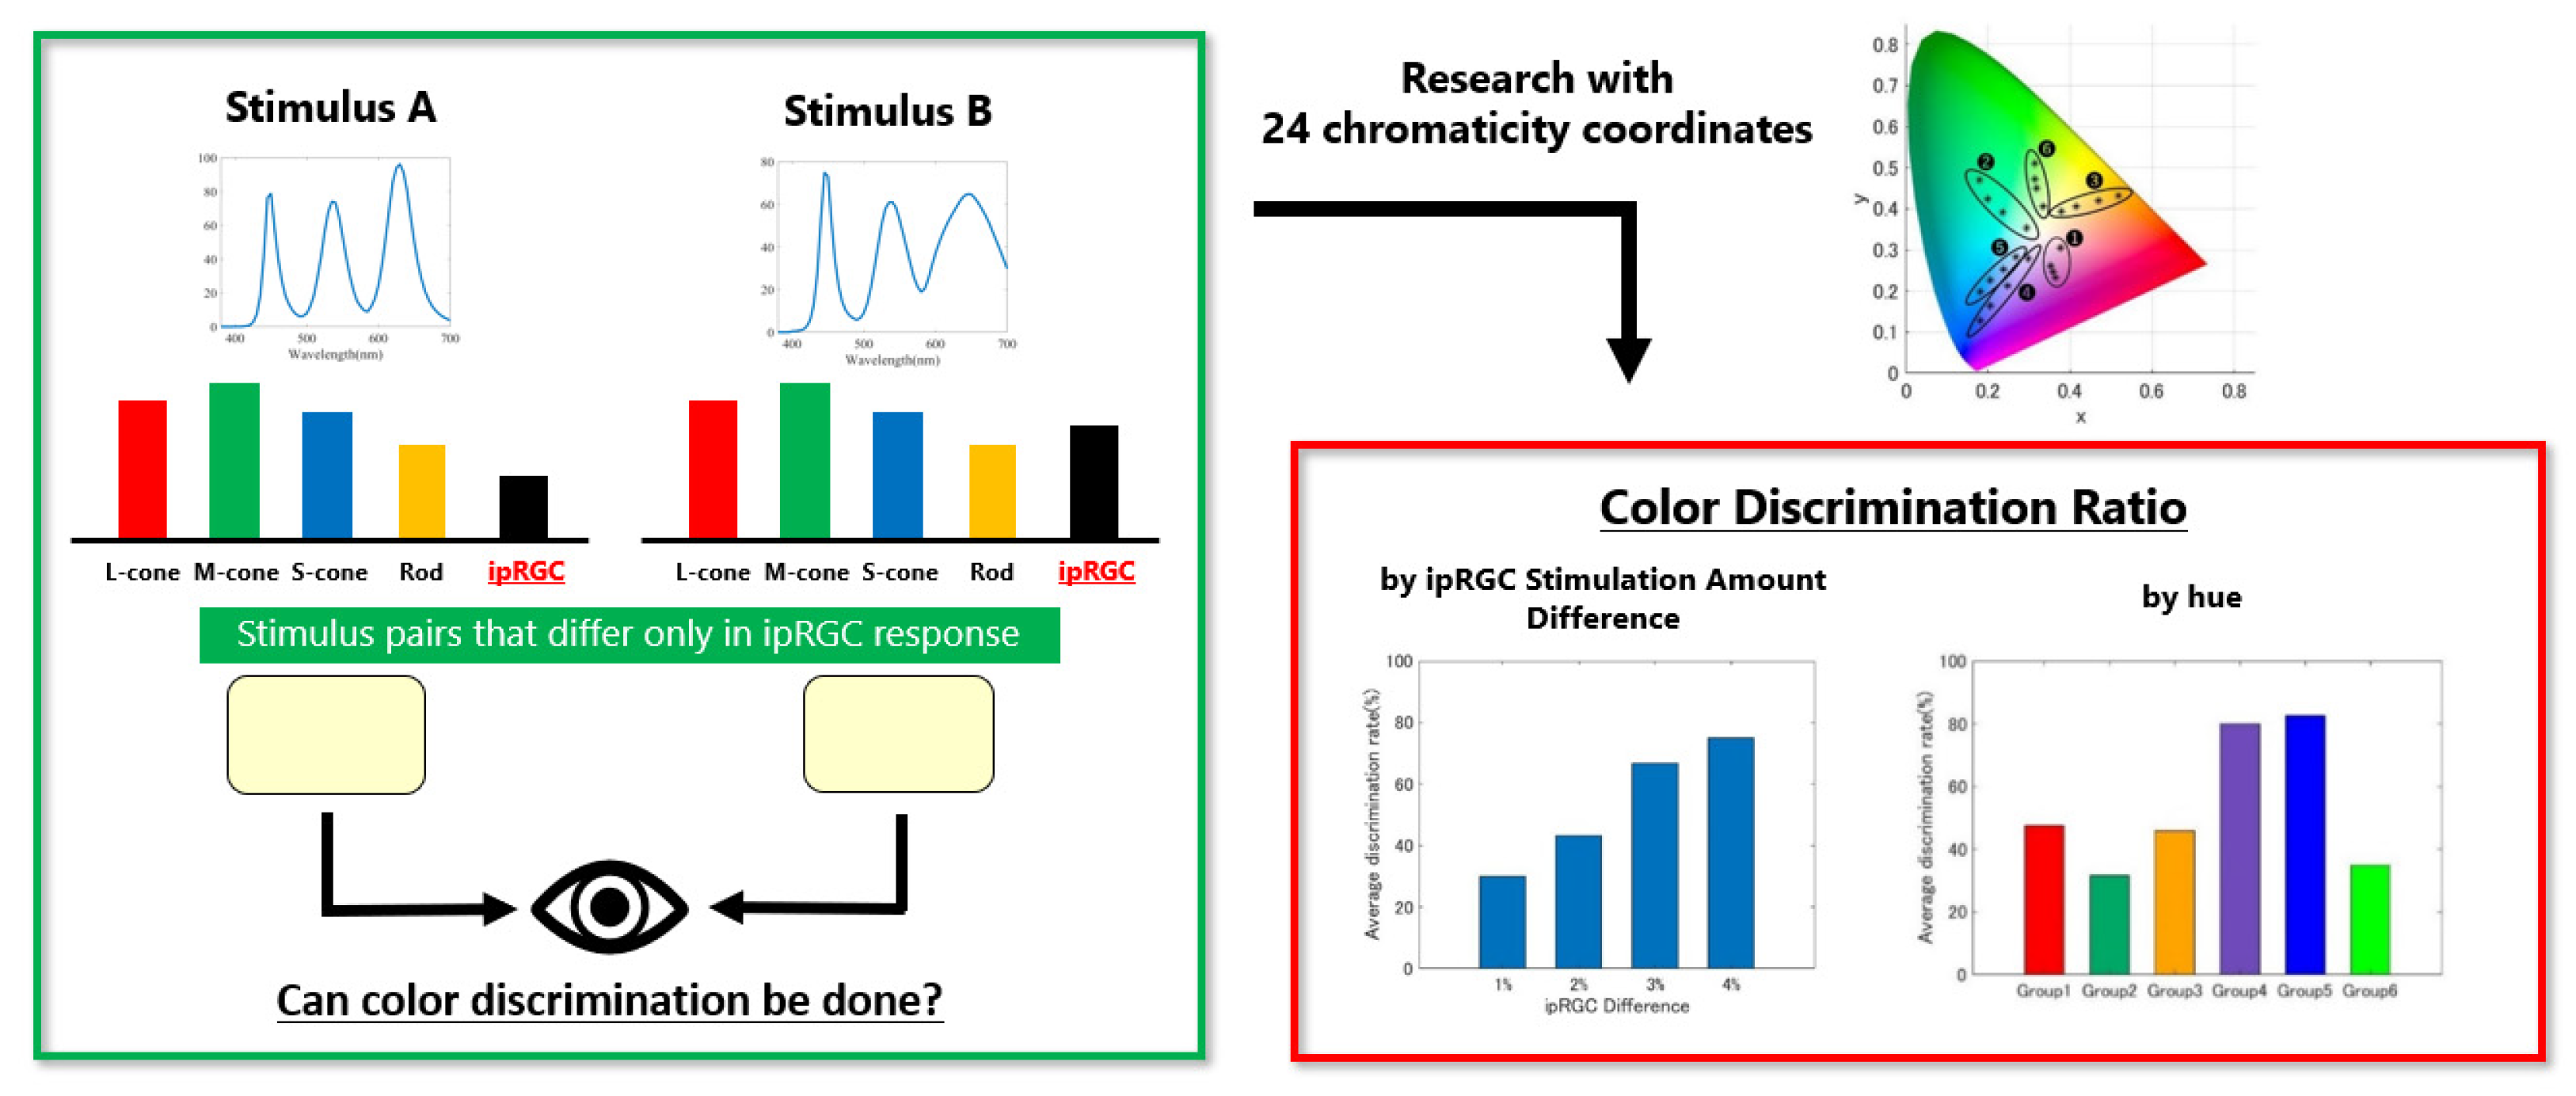
2. Metameric ipRGC Stimuli
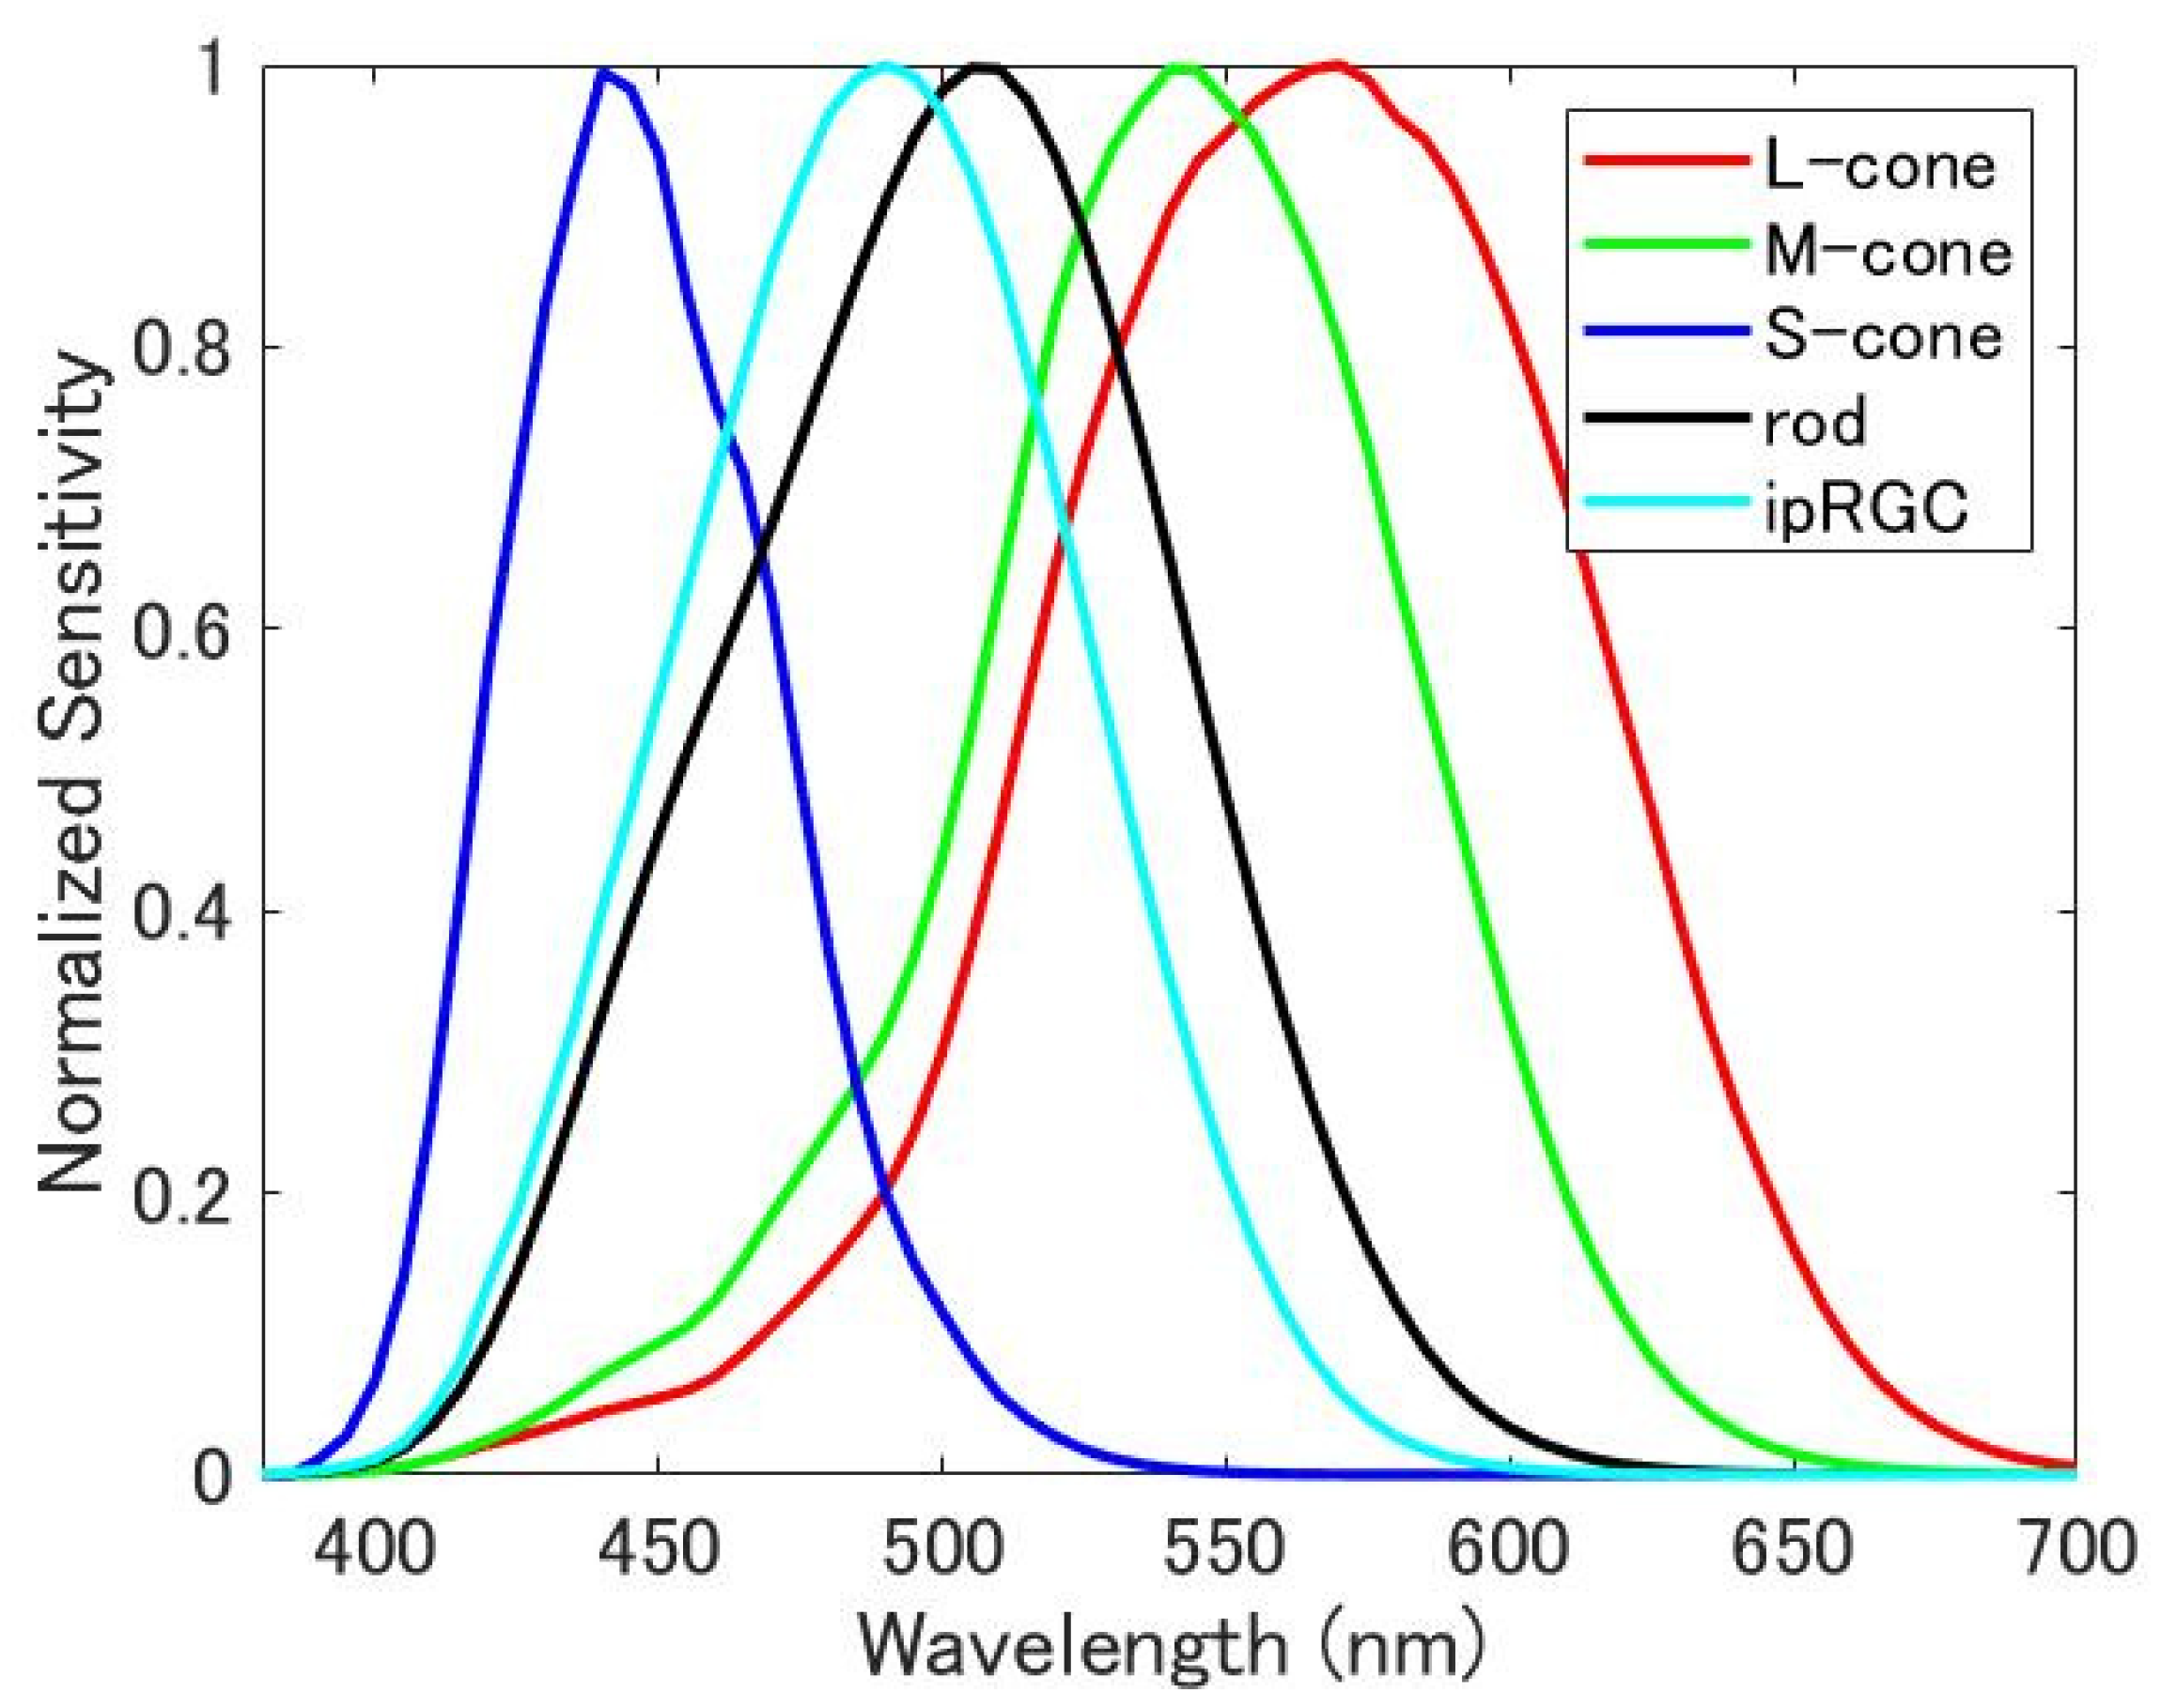
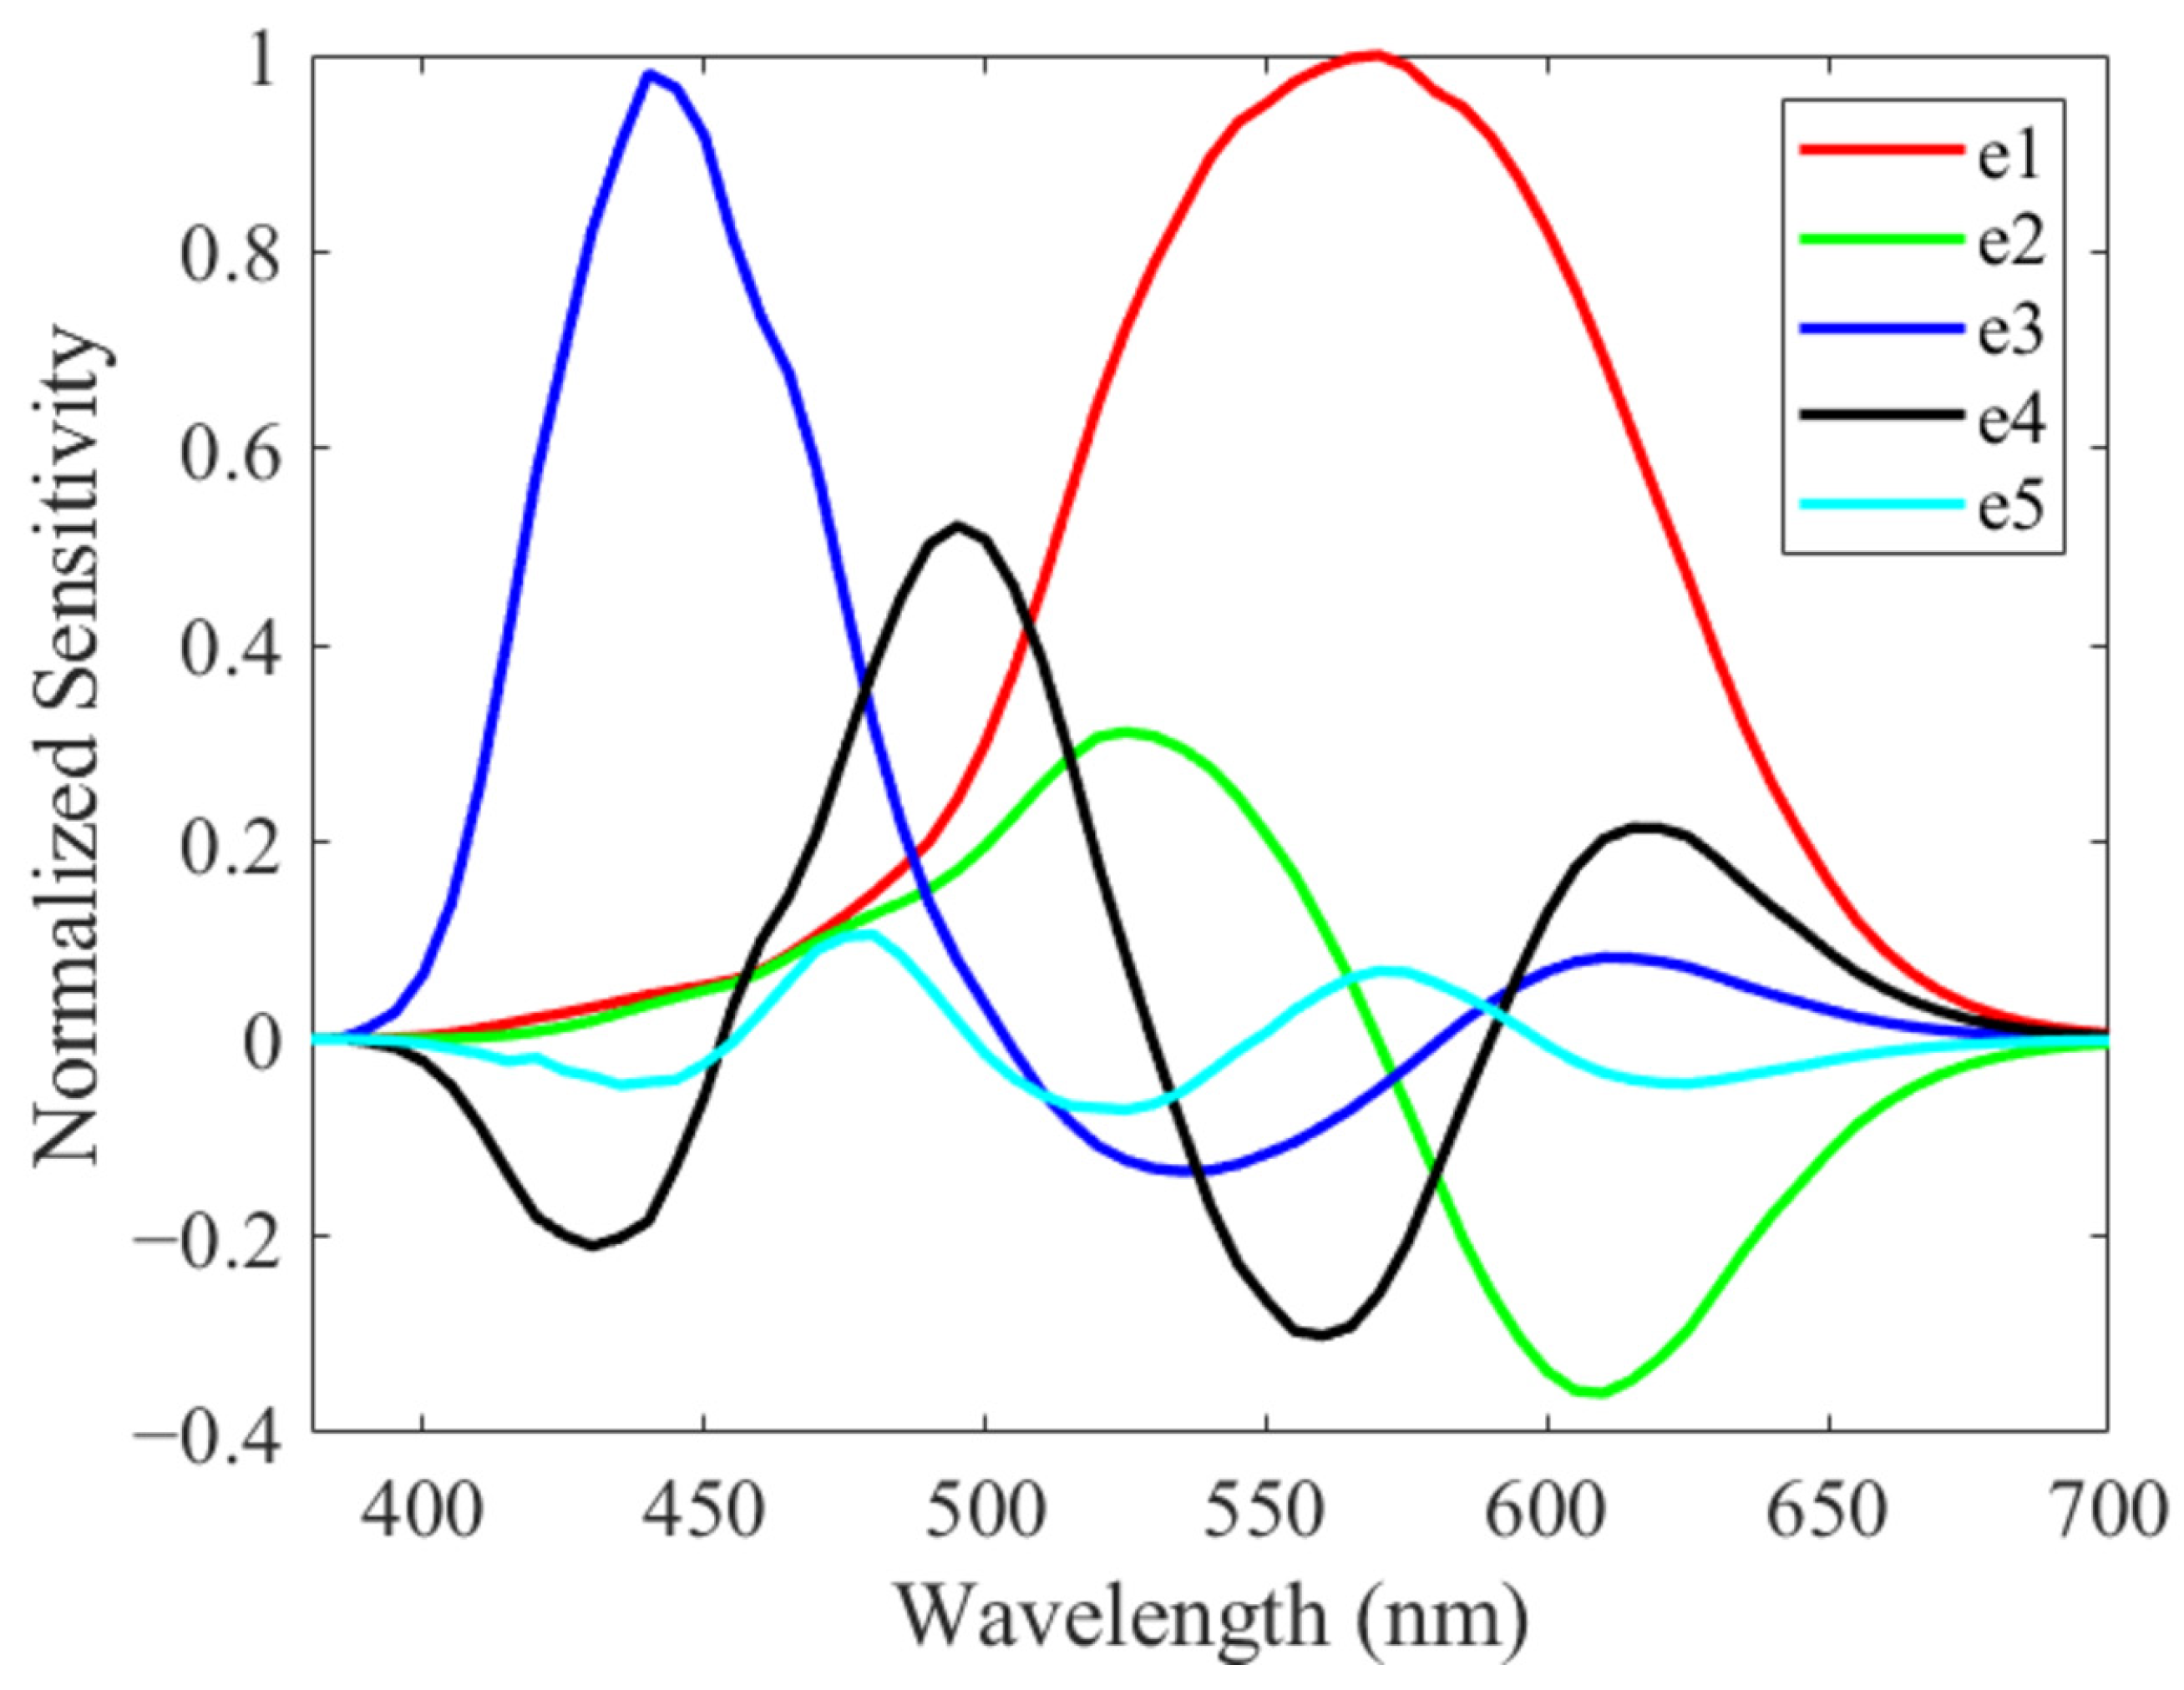
2.1. Independent Control of ipRGC Stimuli Using Spectral Basis
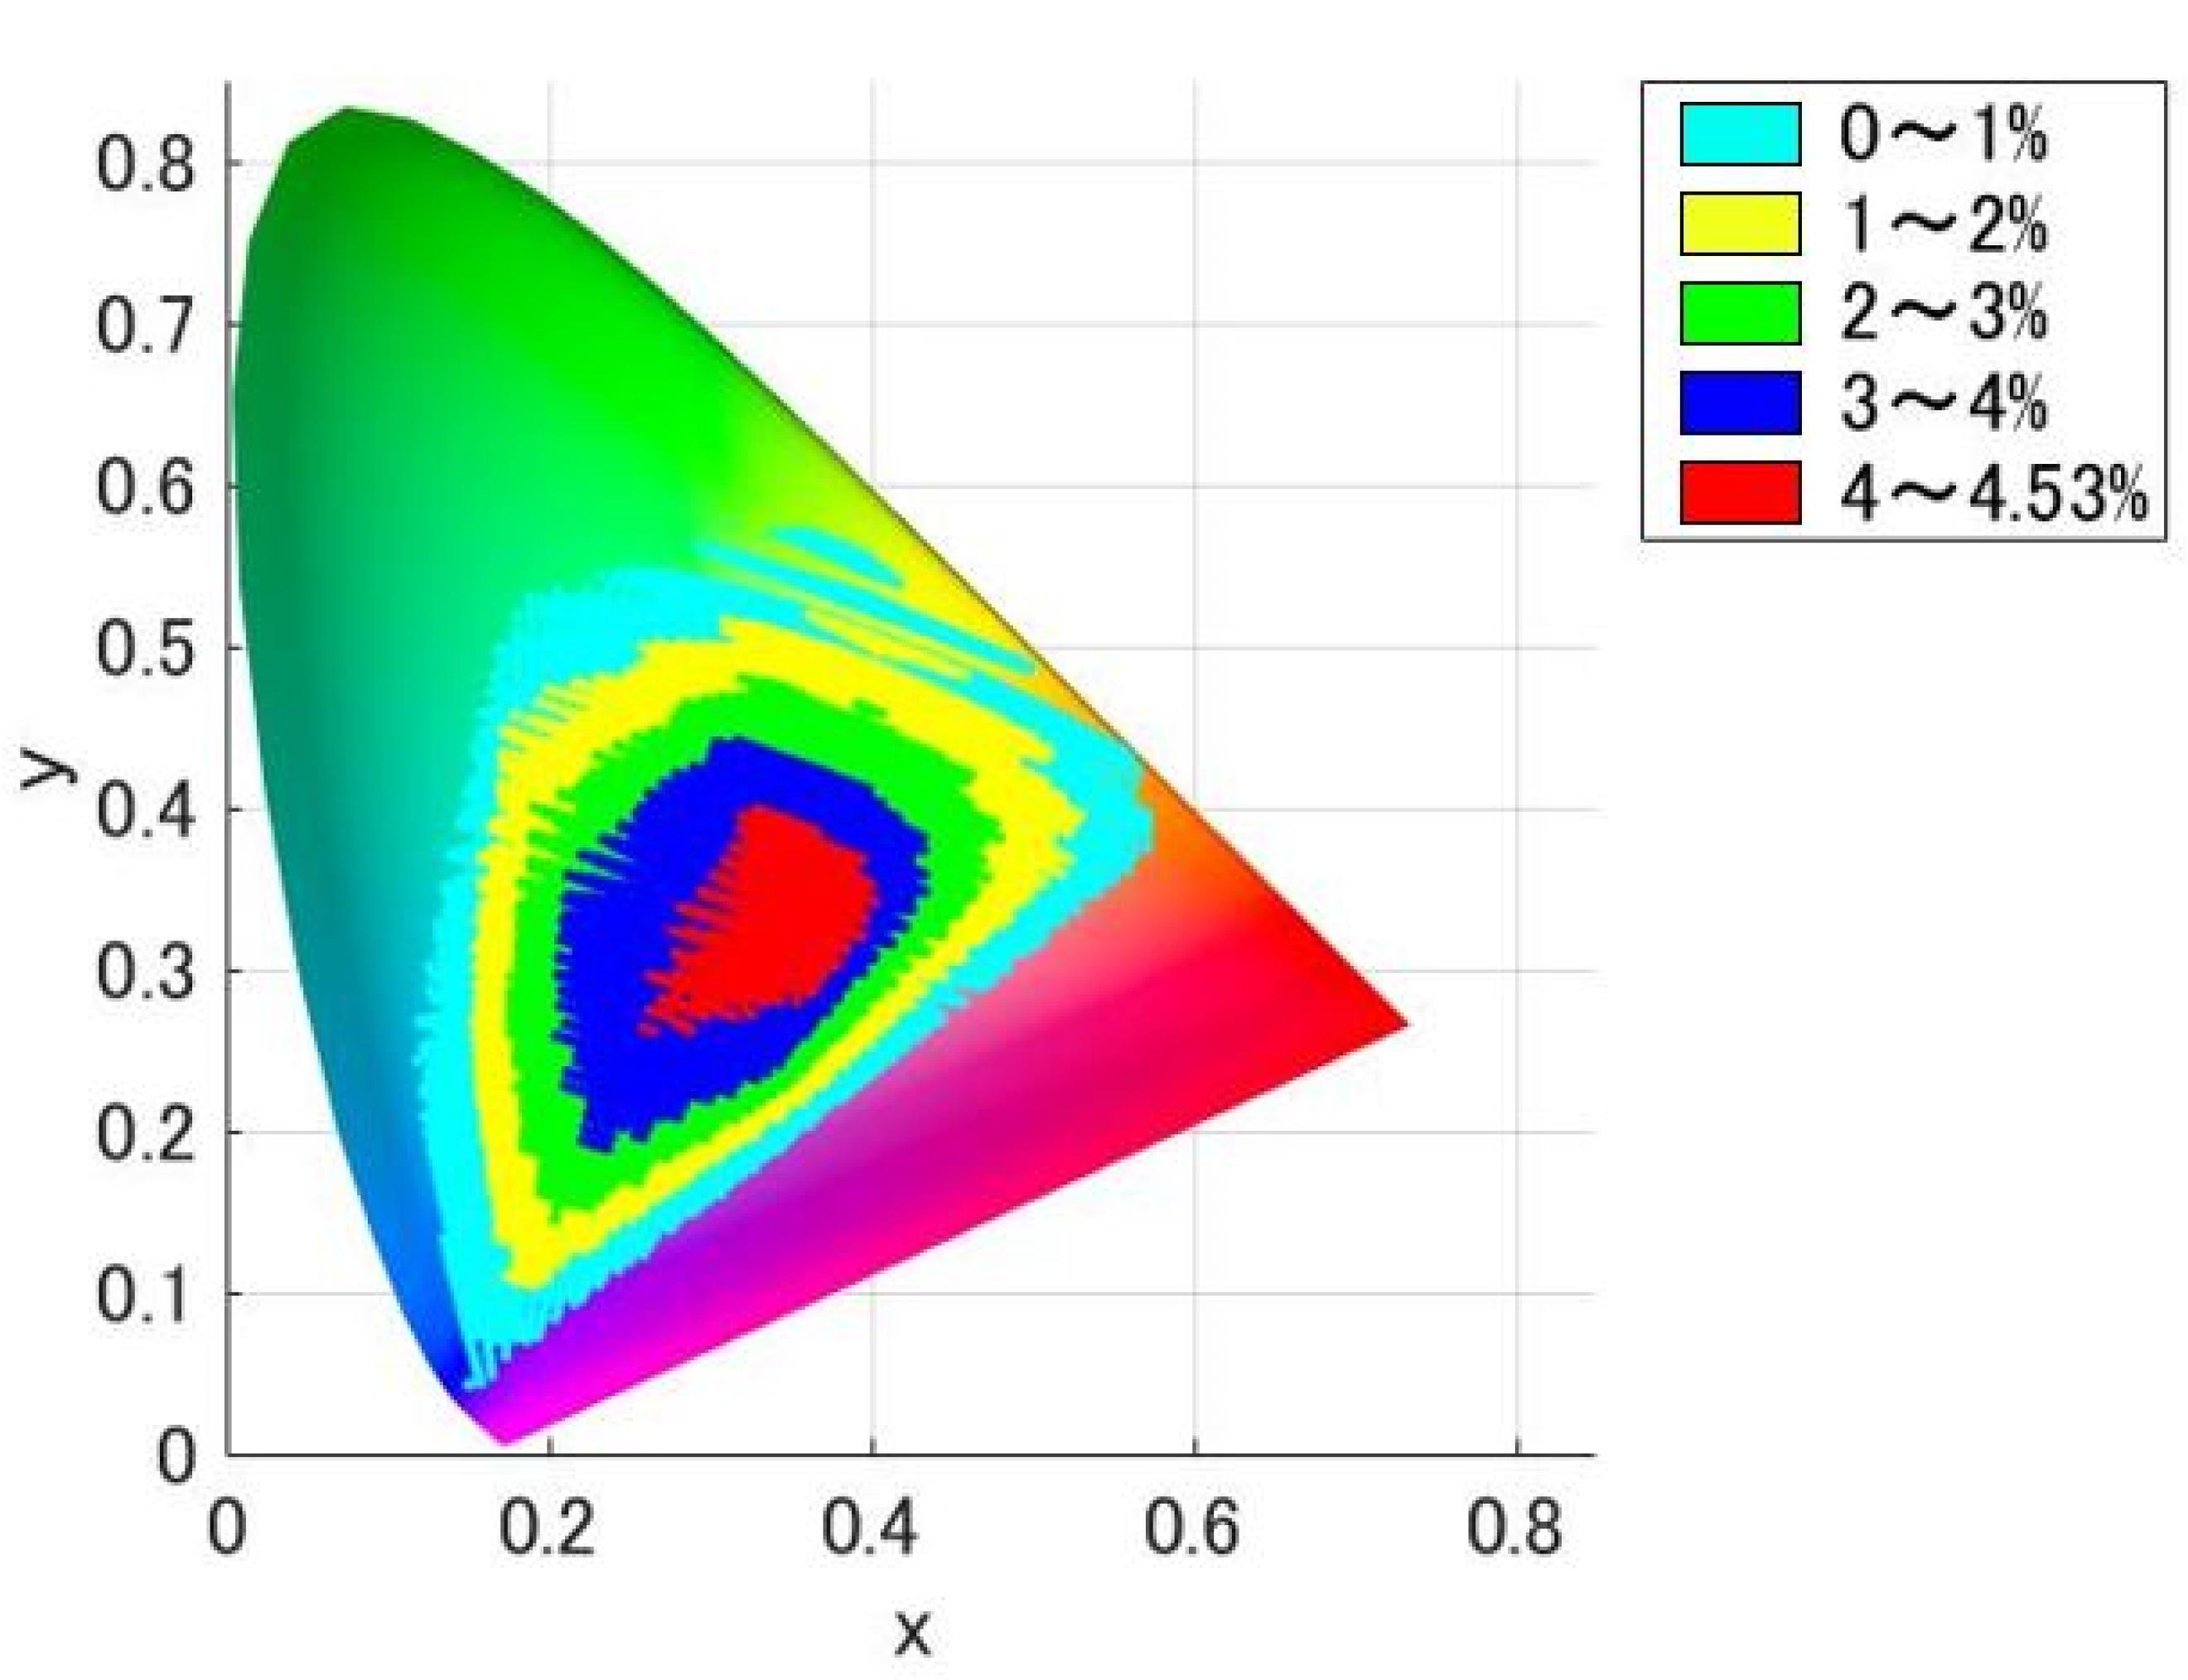
2.2. Color Gamut Simulation Due to Metameric ipRGC Stimuli
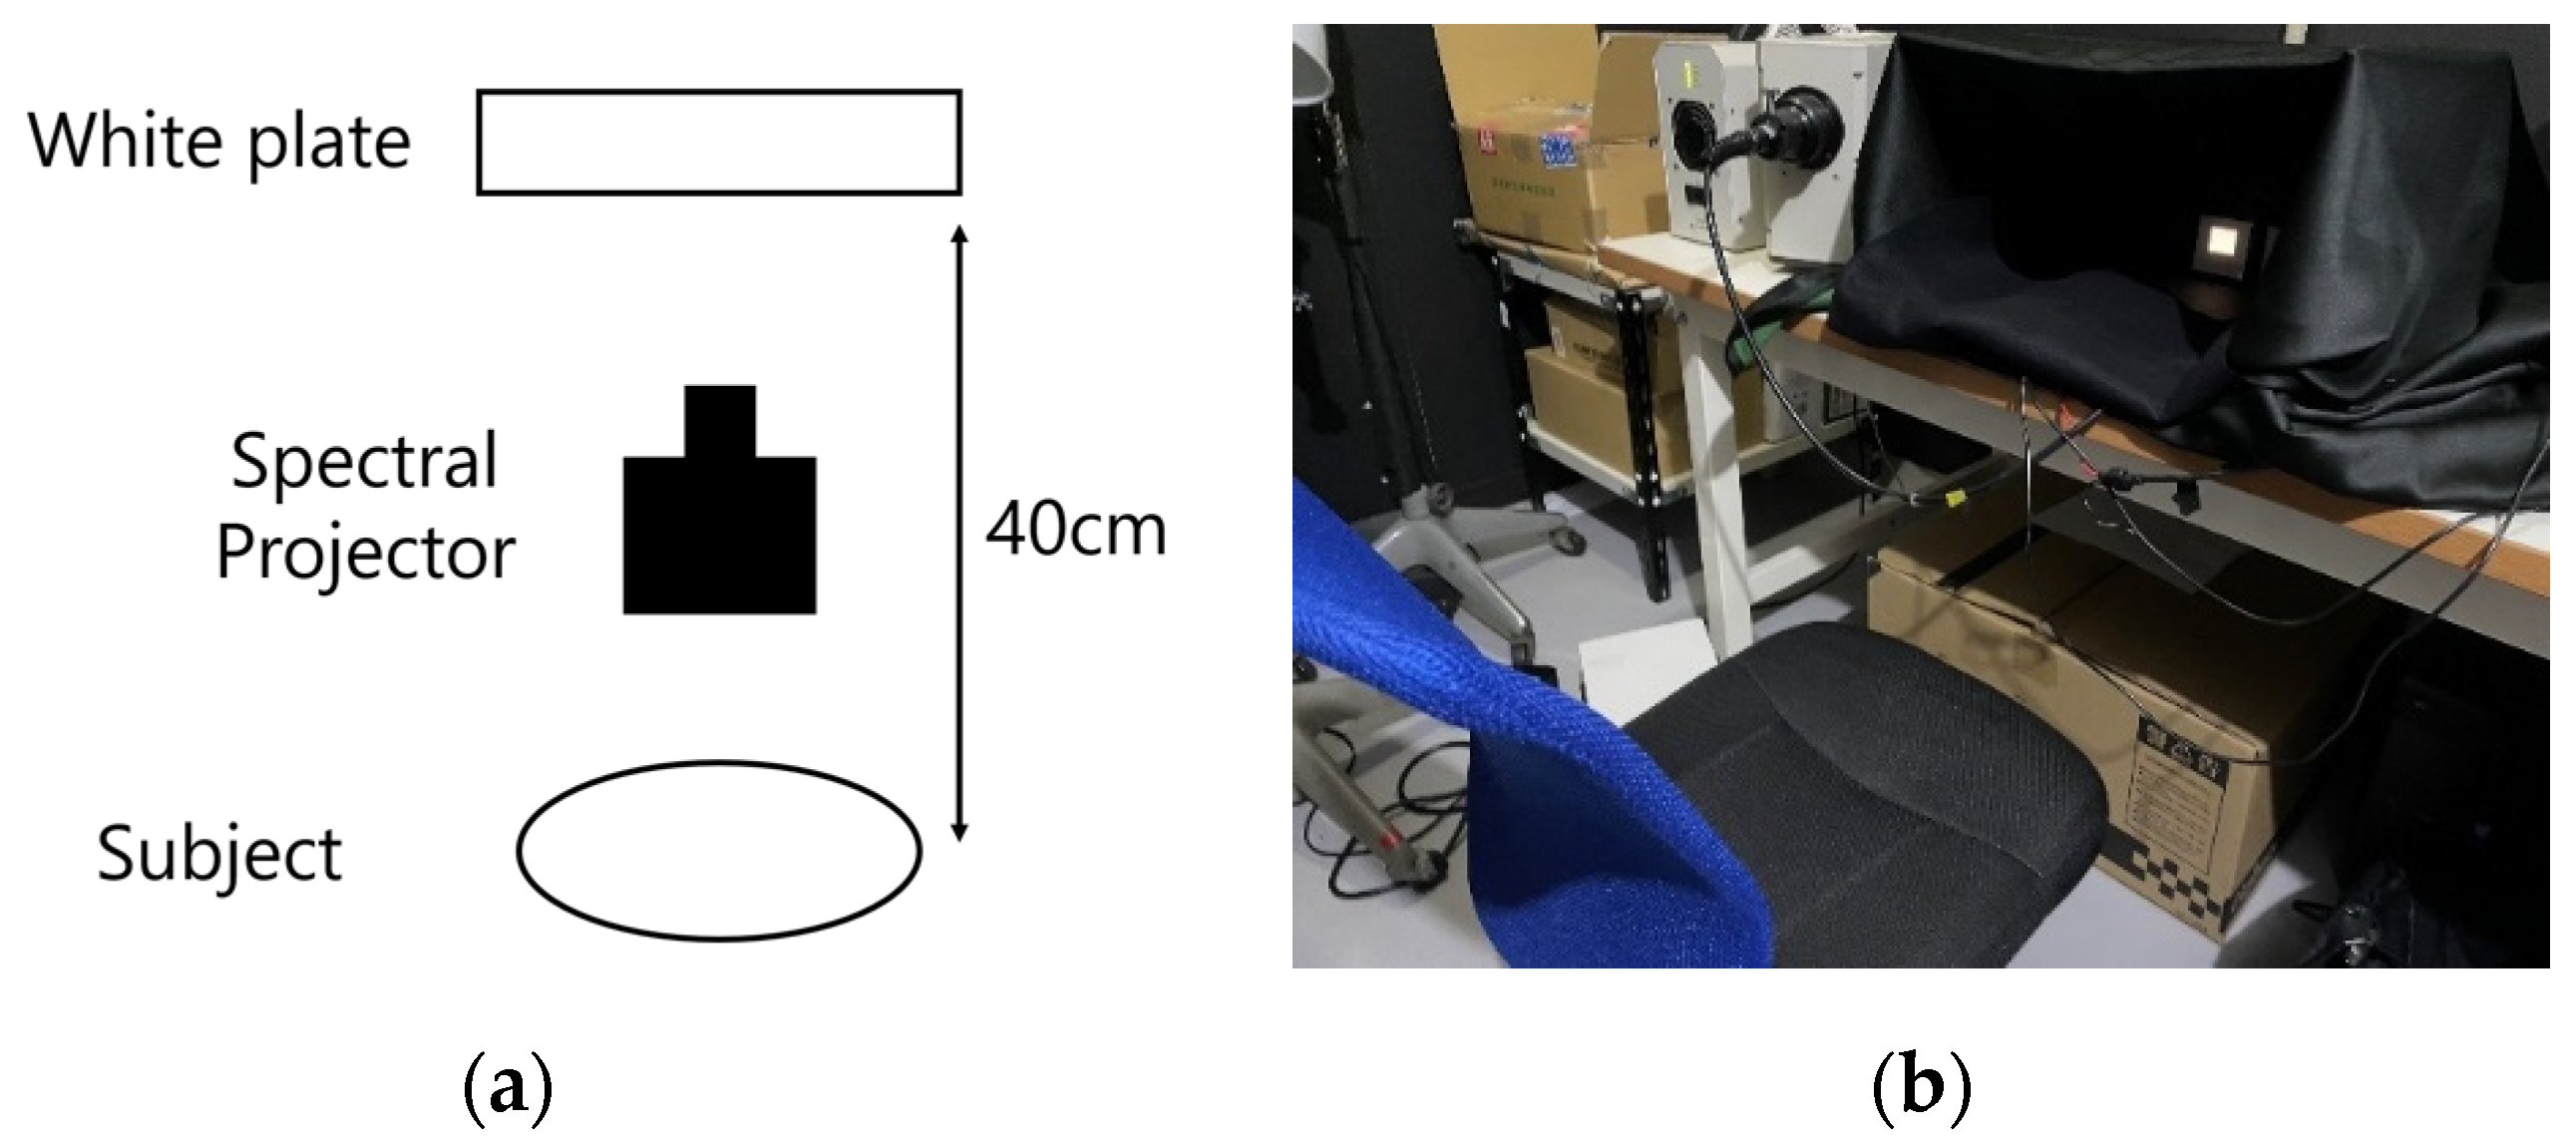
3. Experimental Methods
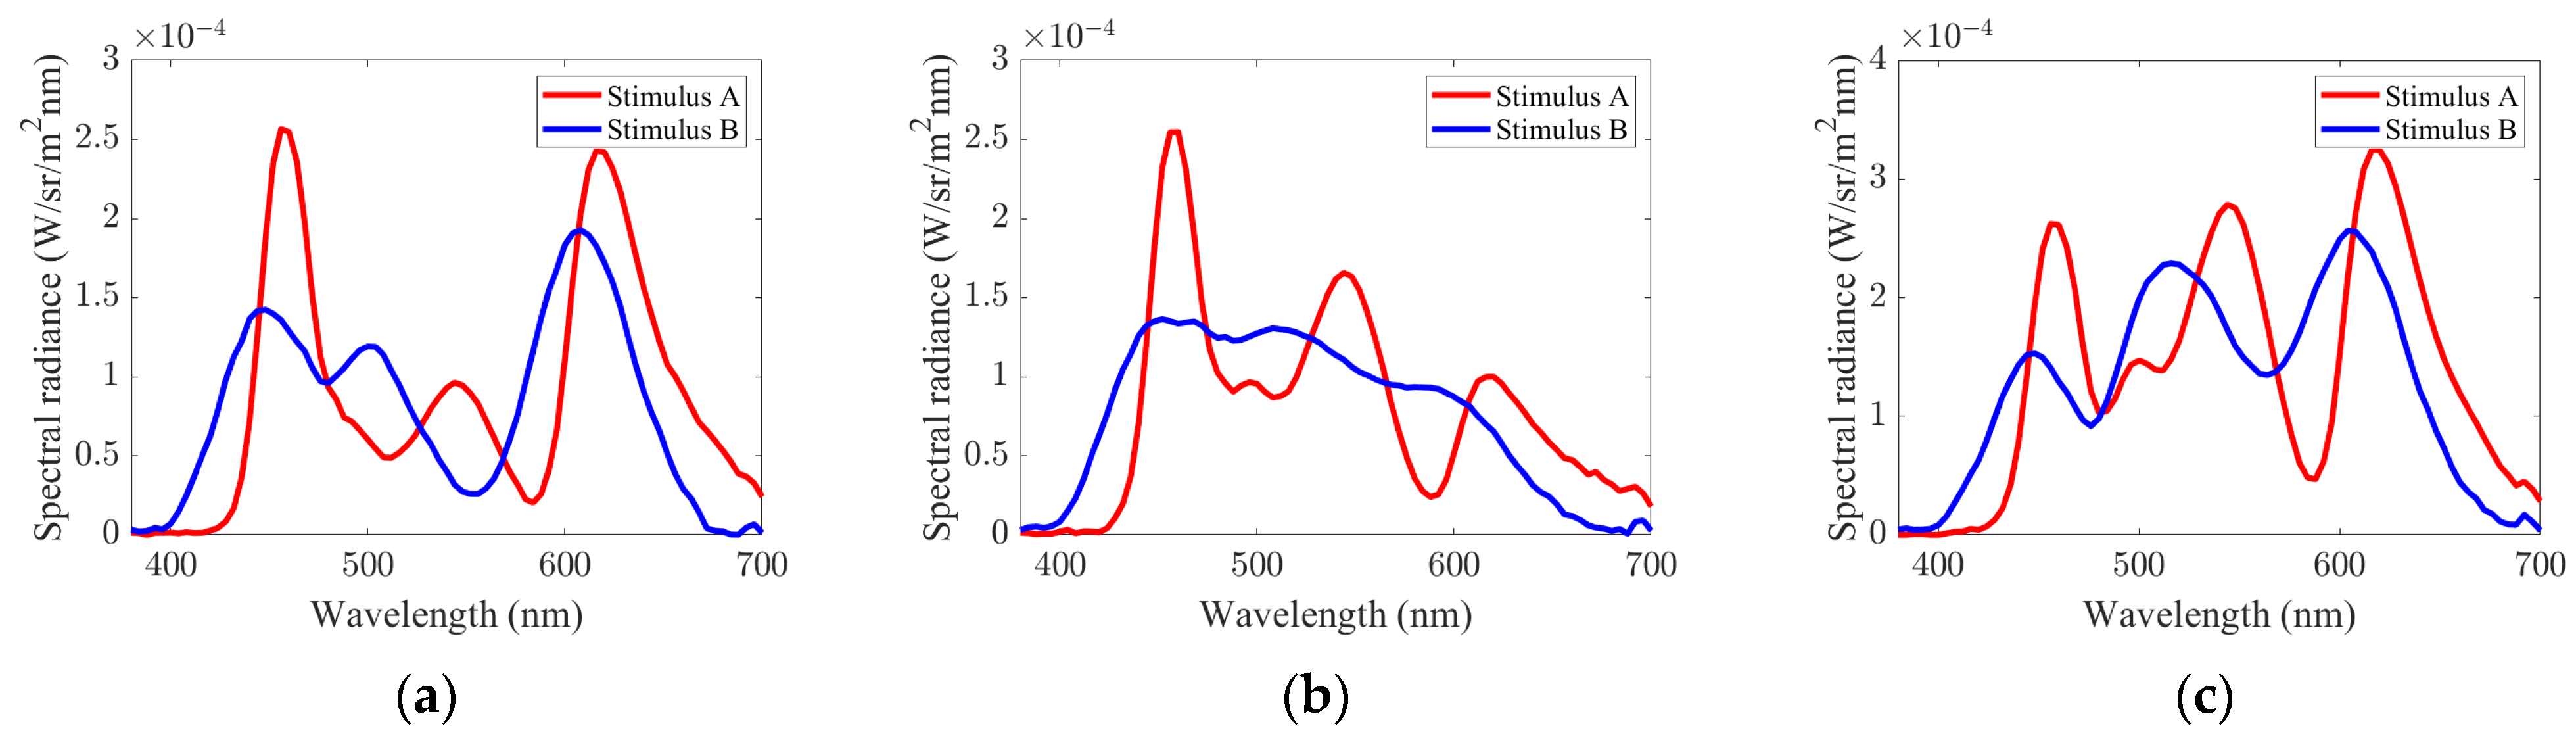
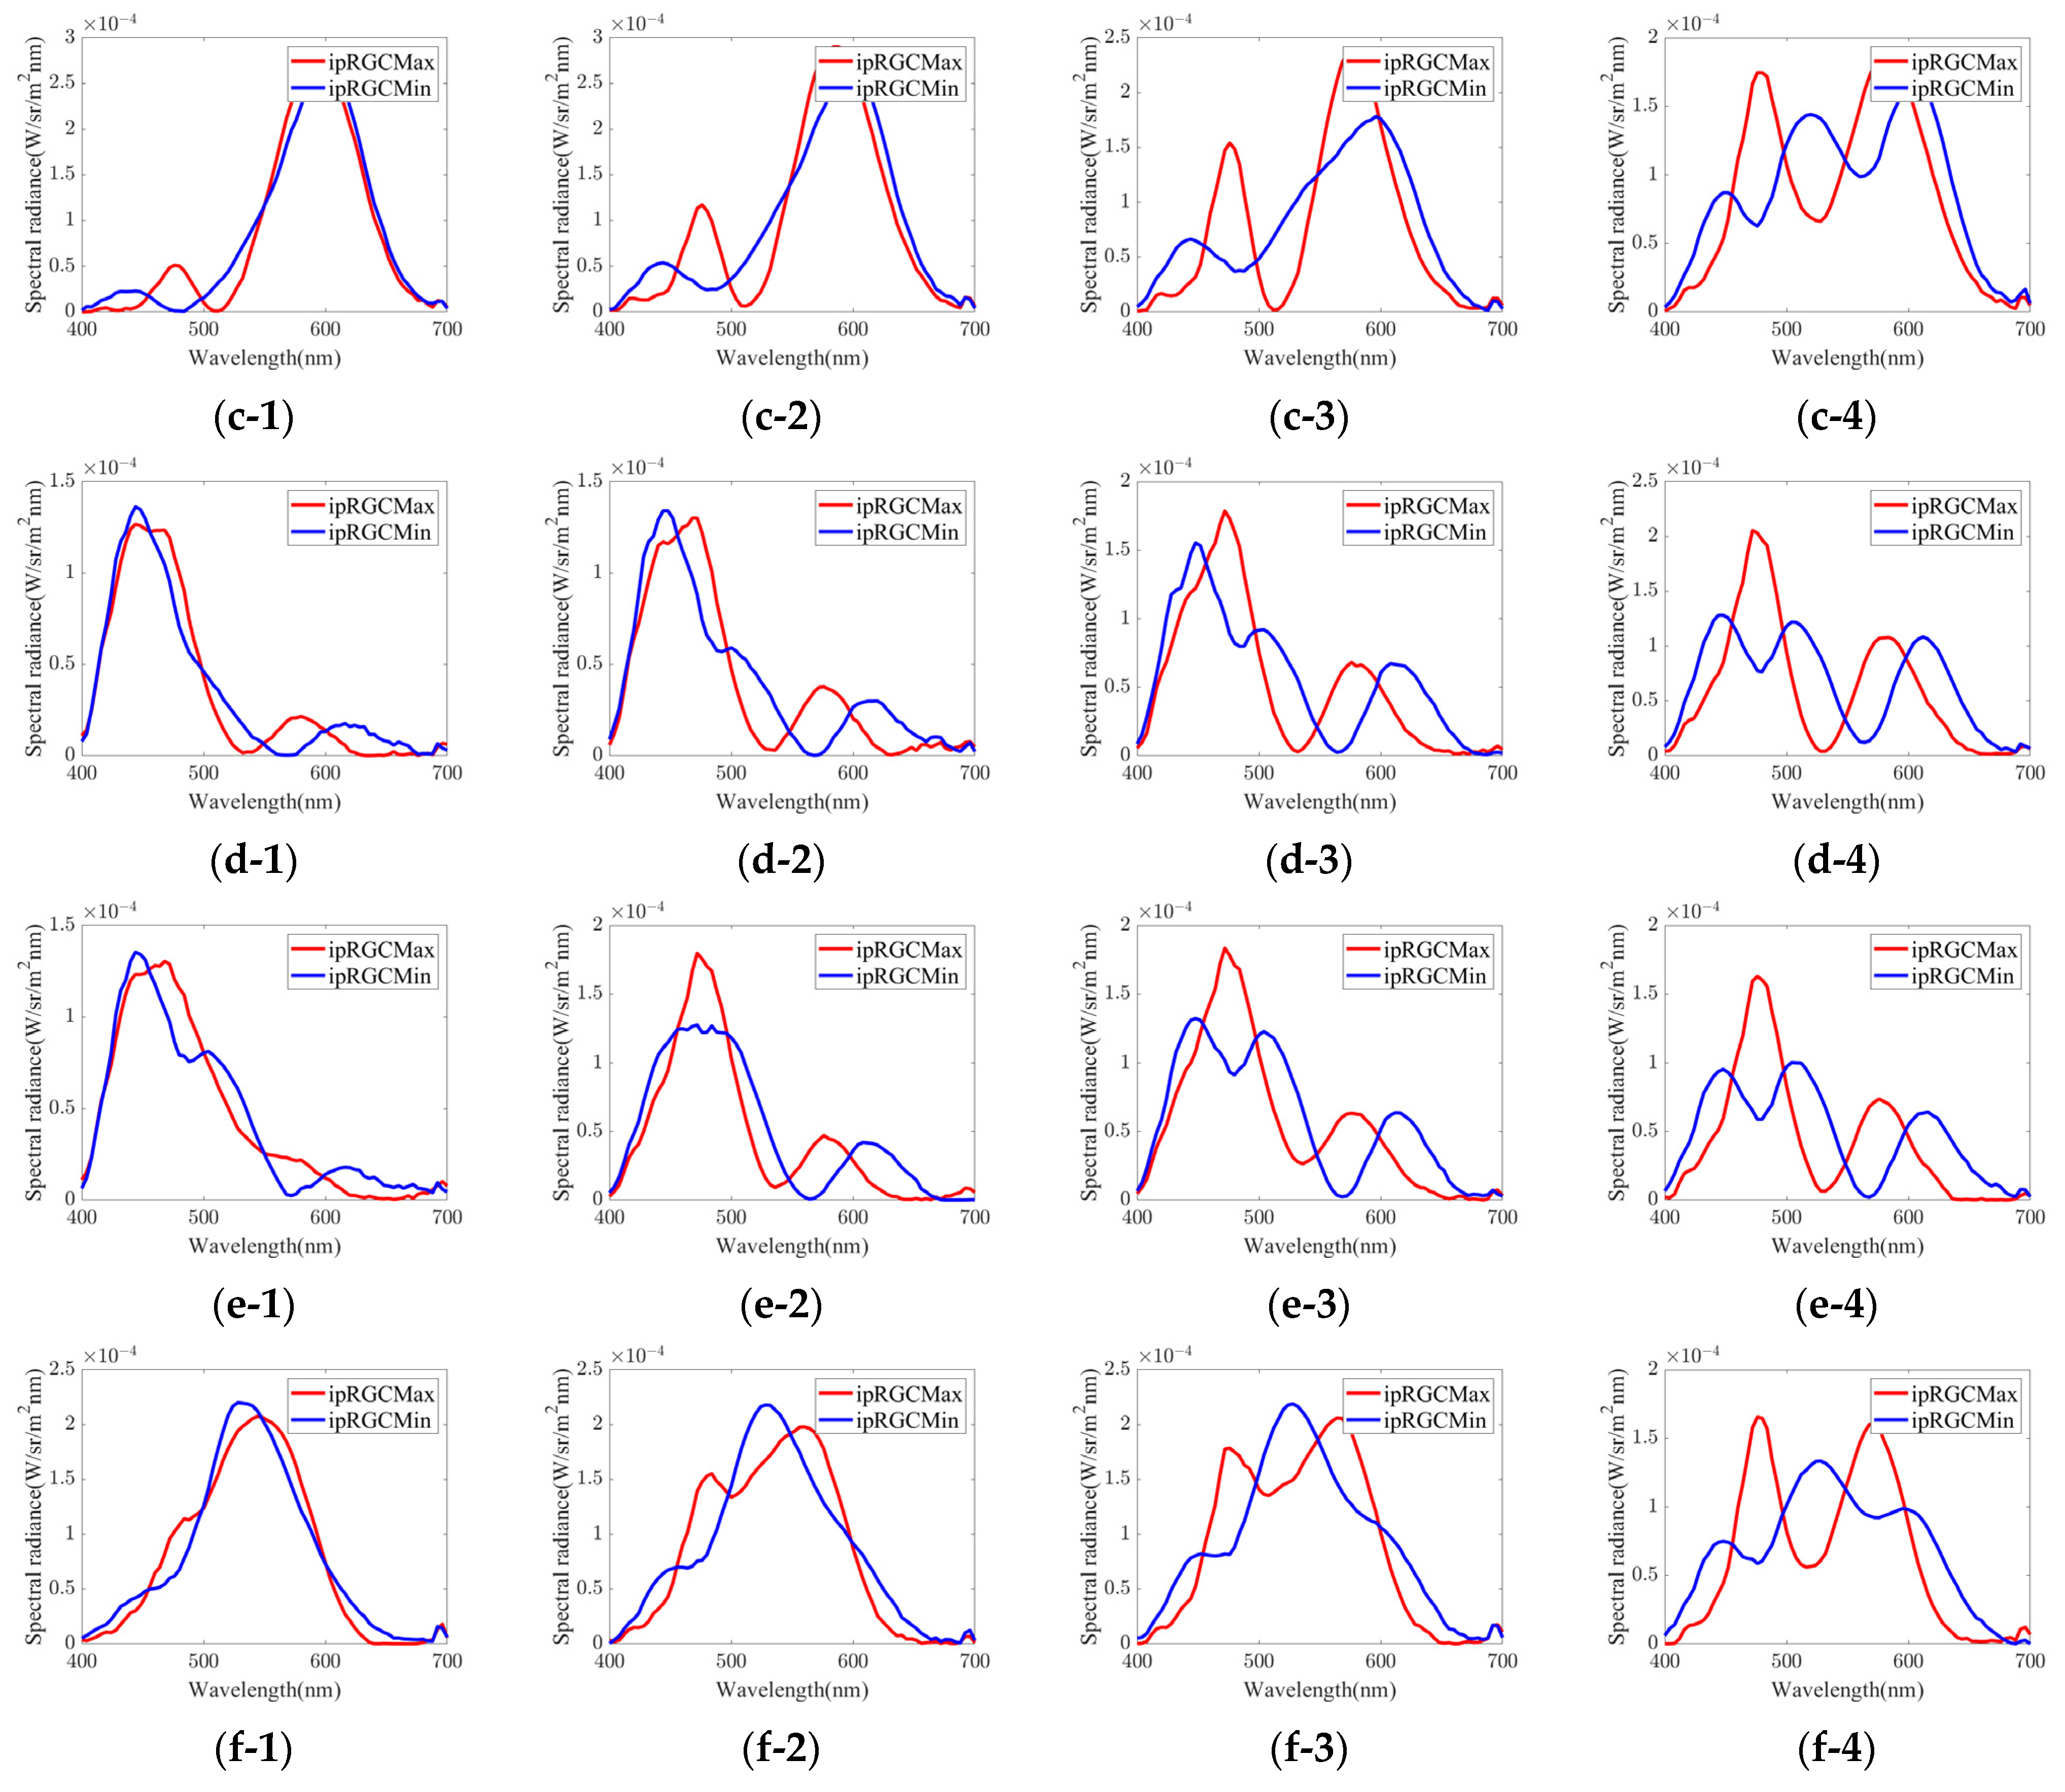
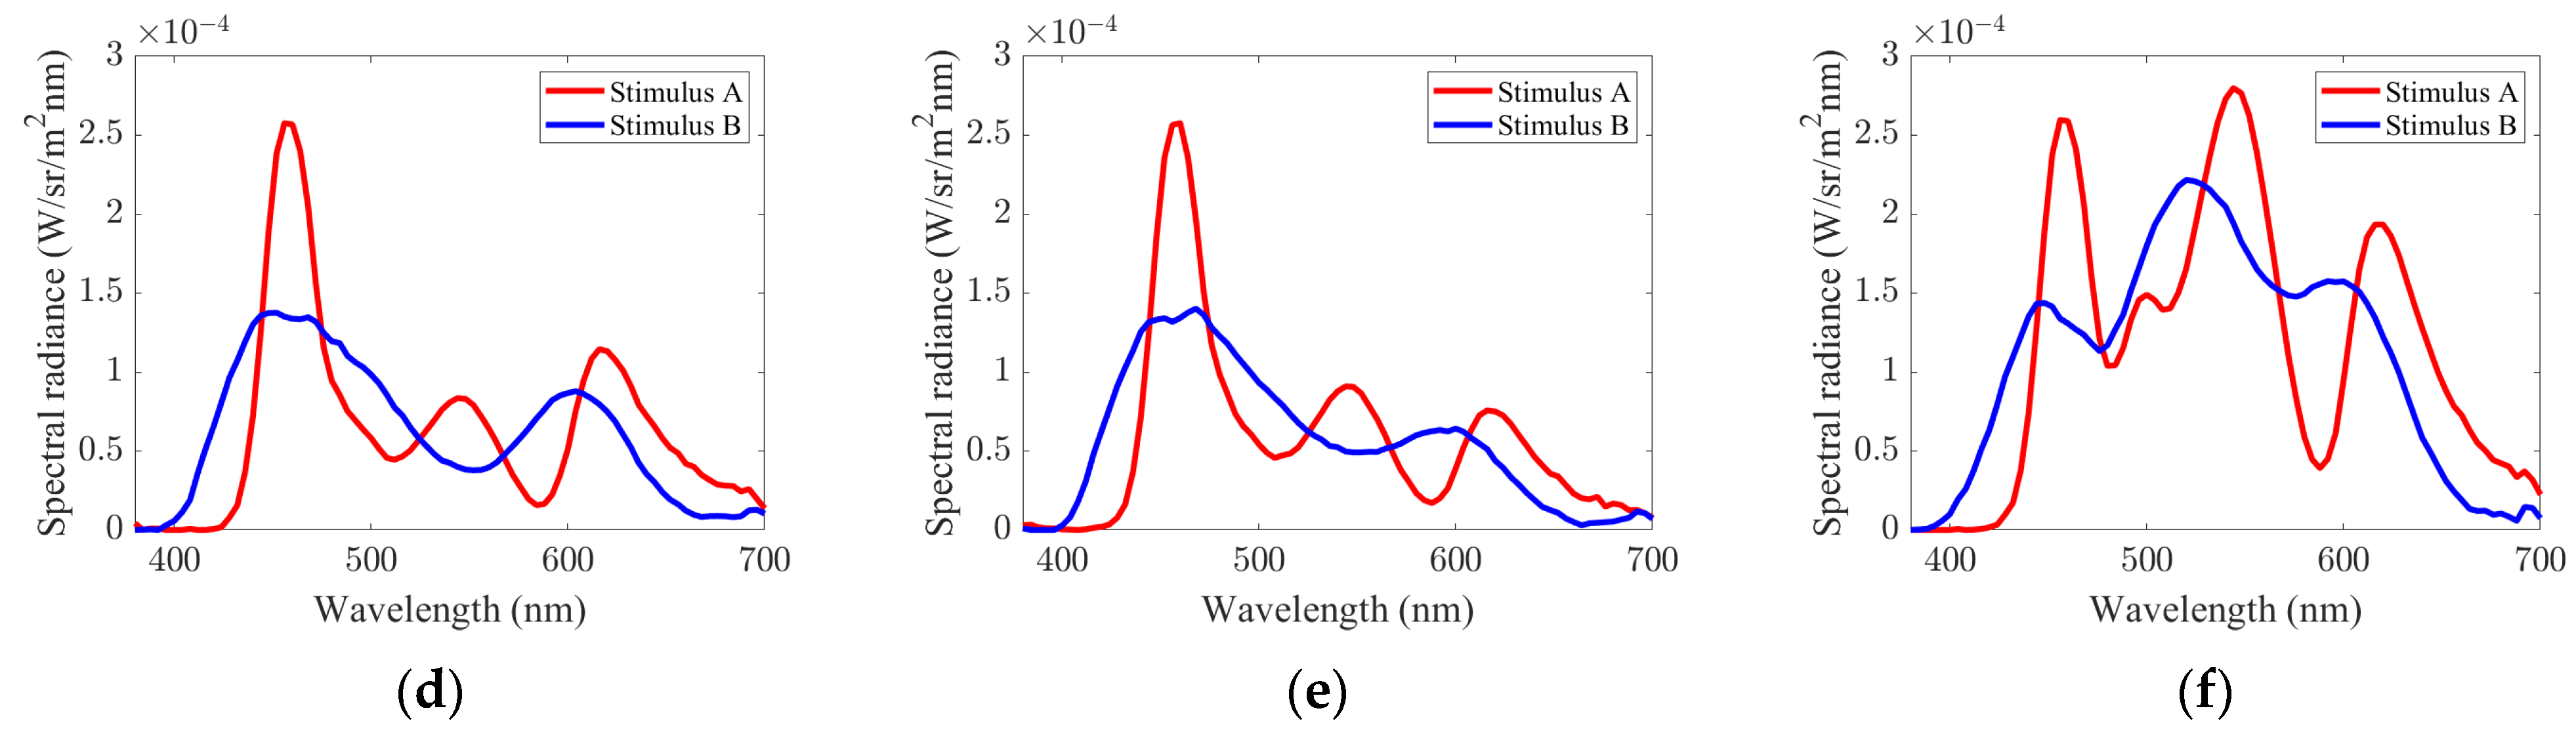
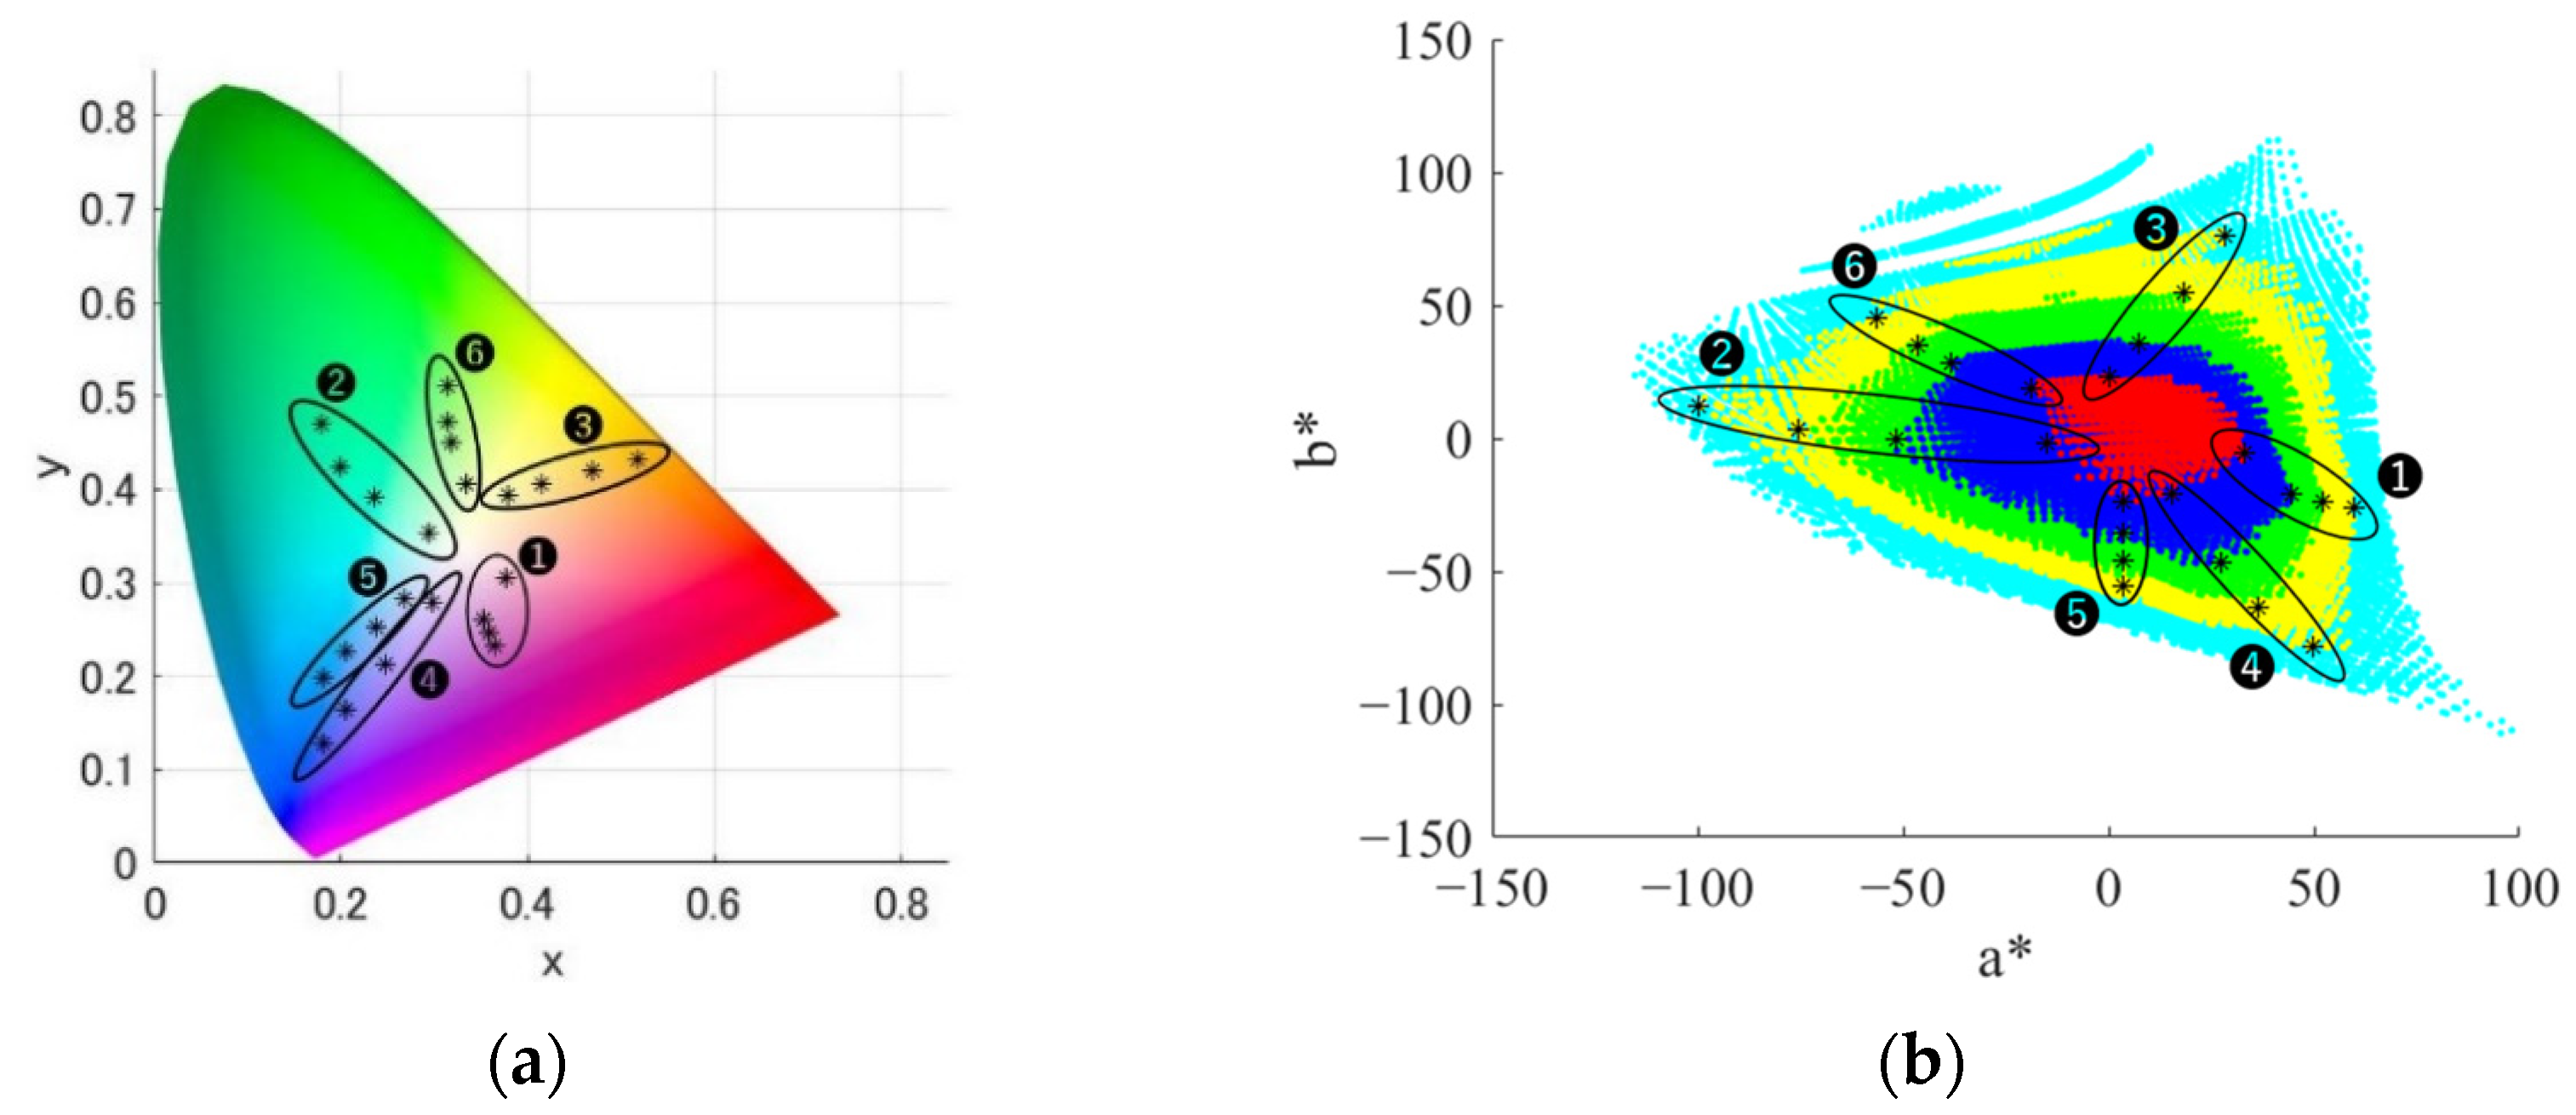
3.1. Experimental Stimuli
- Group 1.
- red to purple hue
- Group 2.
- green hue
- Group 3.
- orange hue
- Group 4.
- blue to purple hue
- Group 5.
- blue hue
- Group 6.
- yellow-green hue
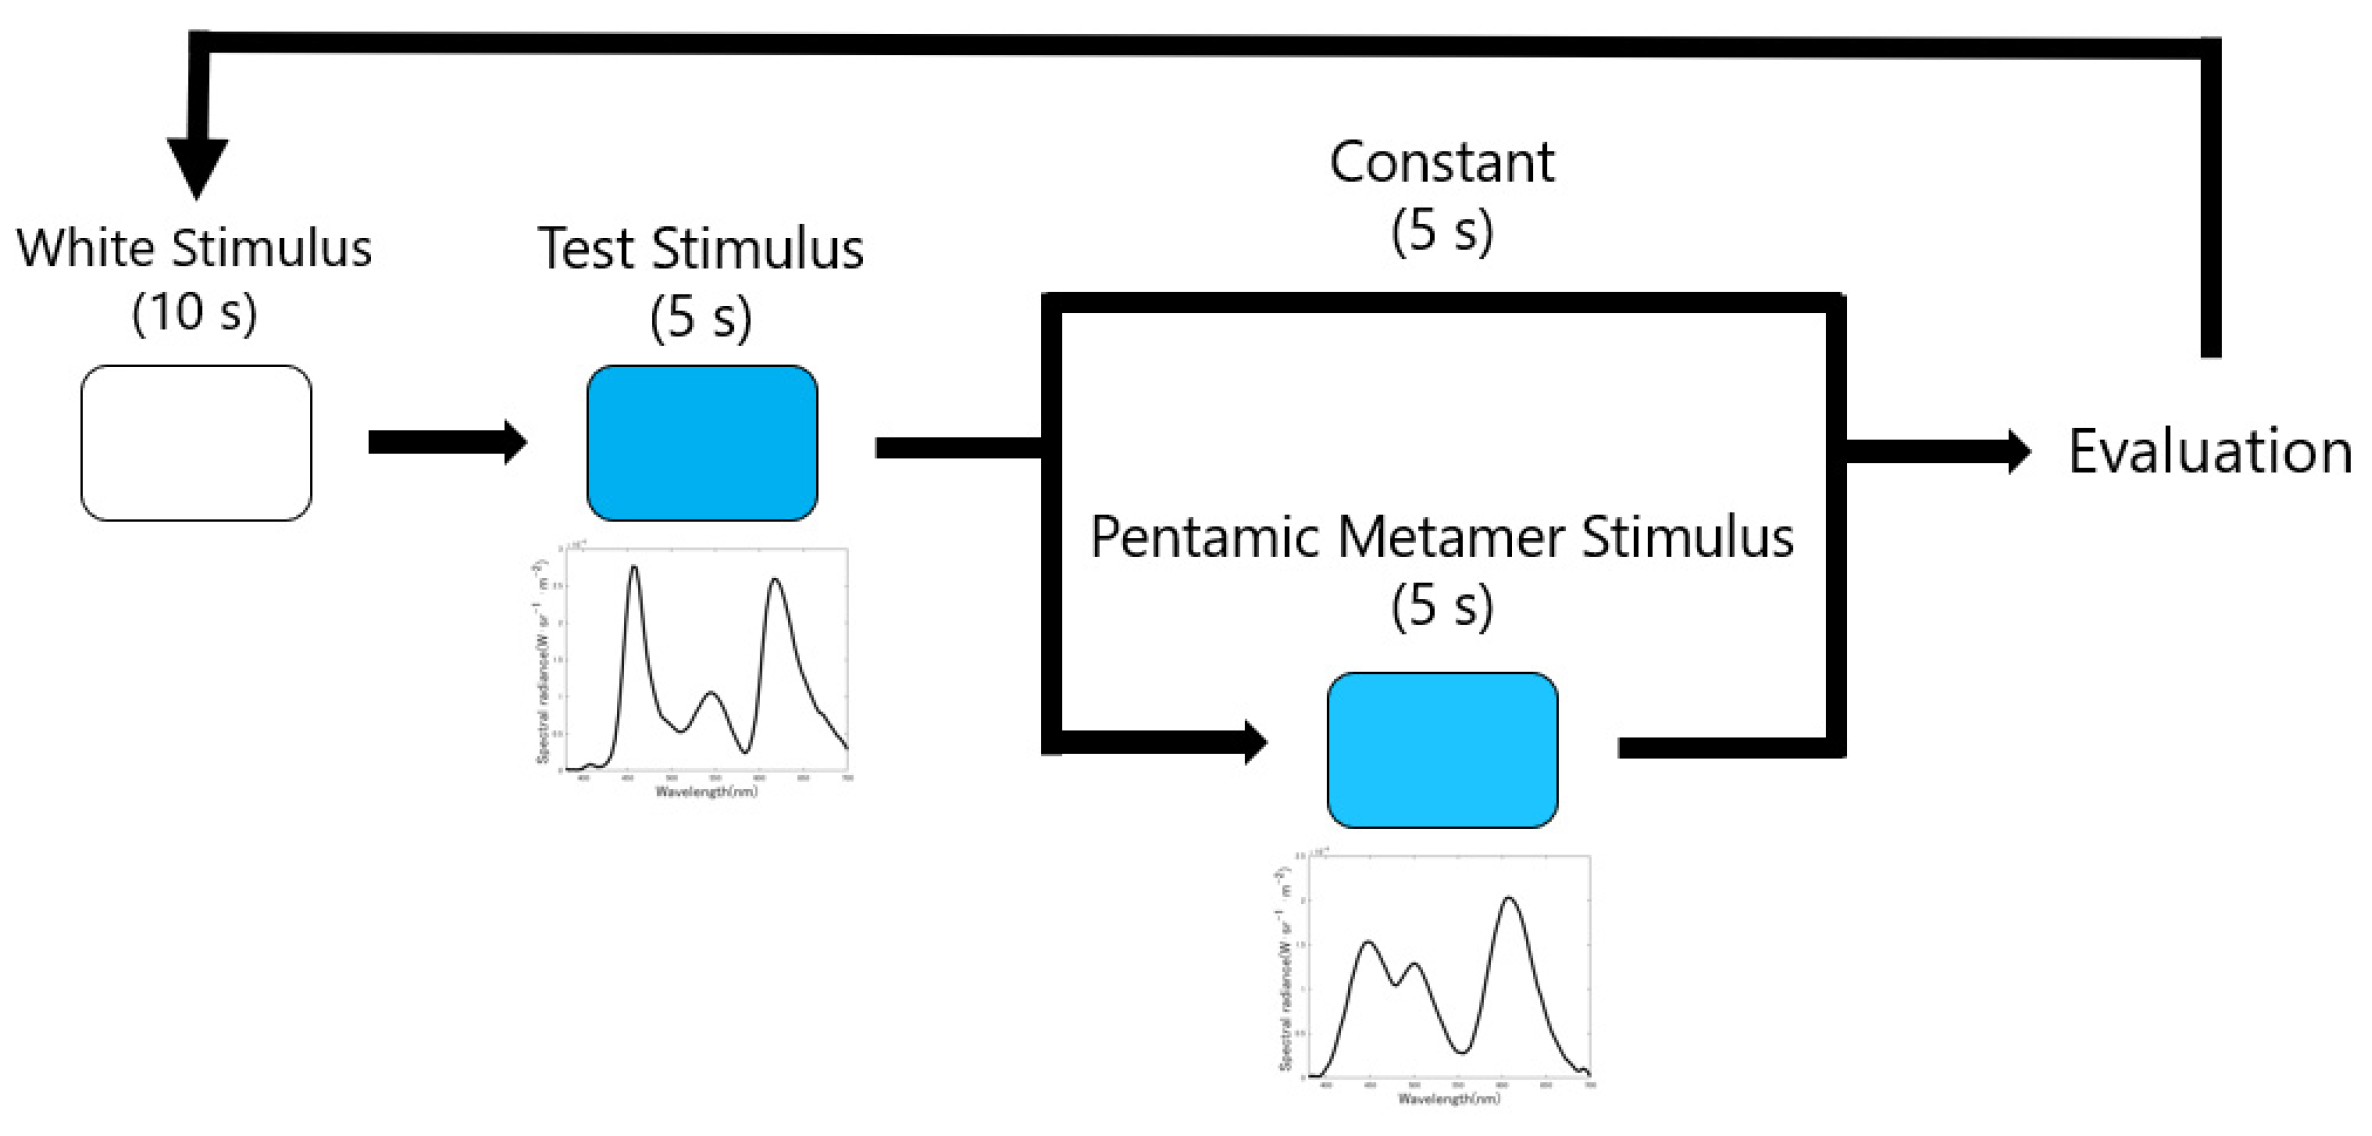
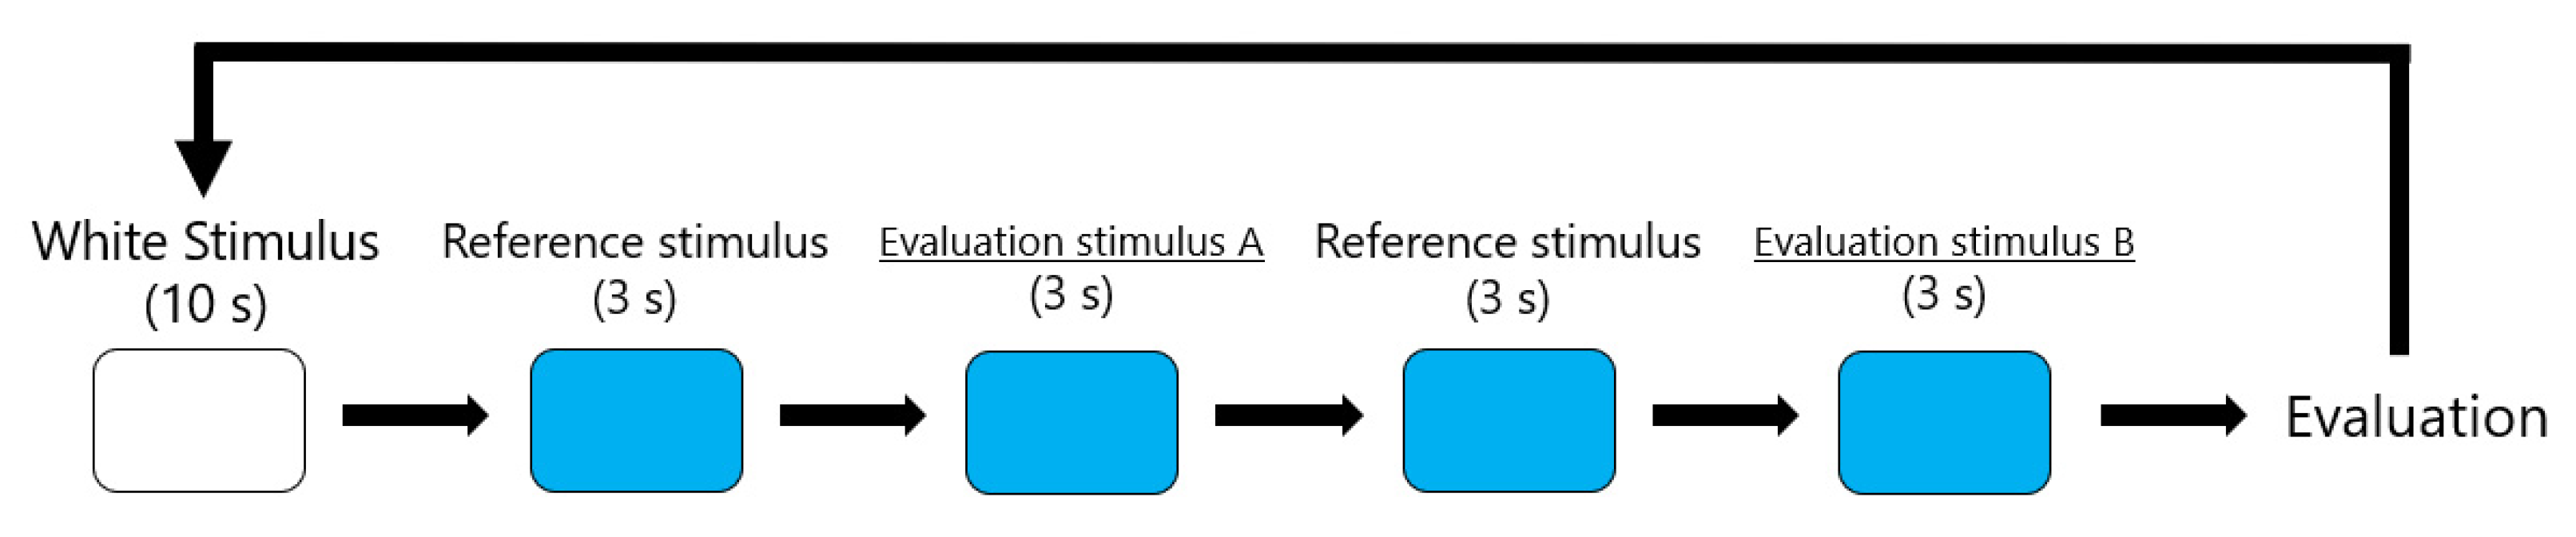
3.2. Procedure
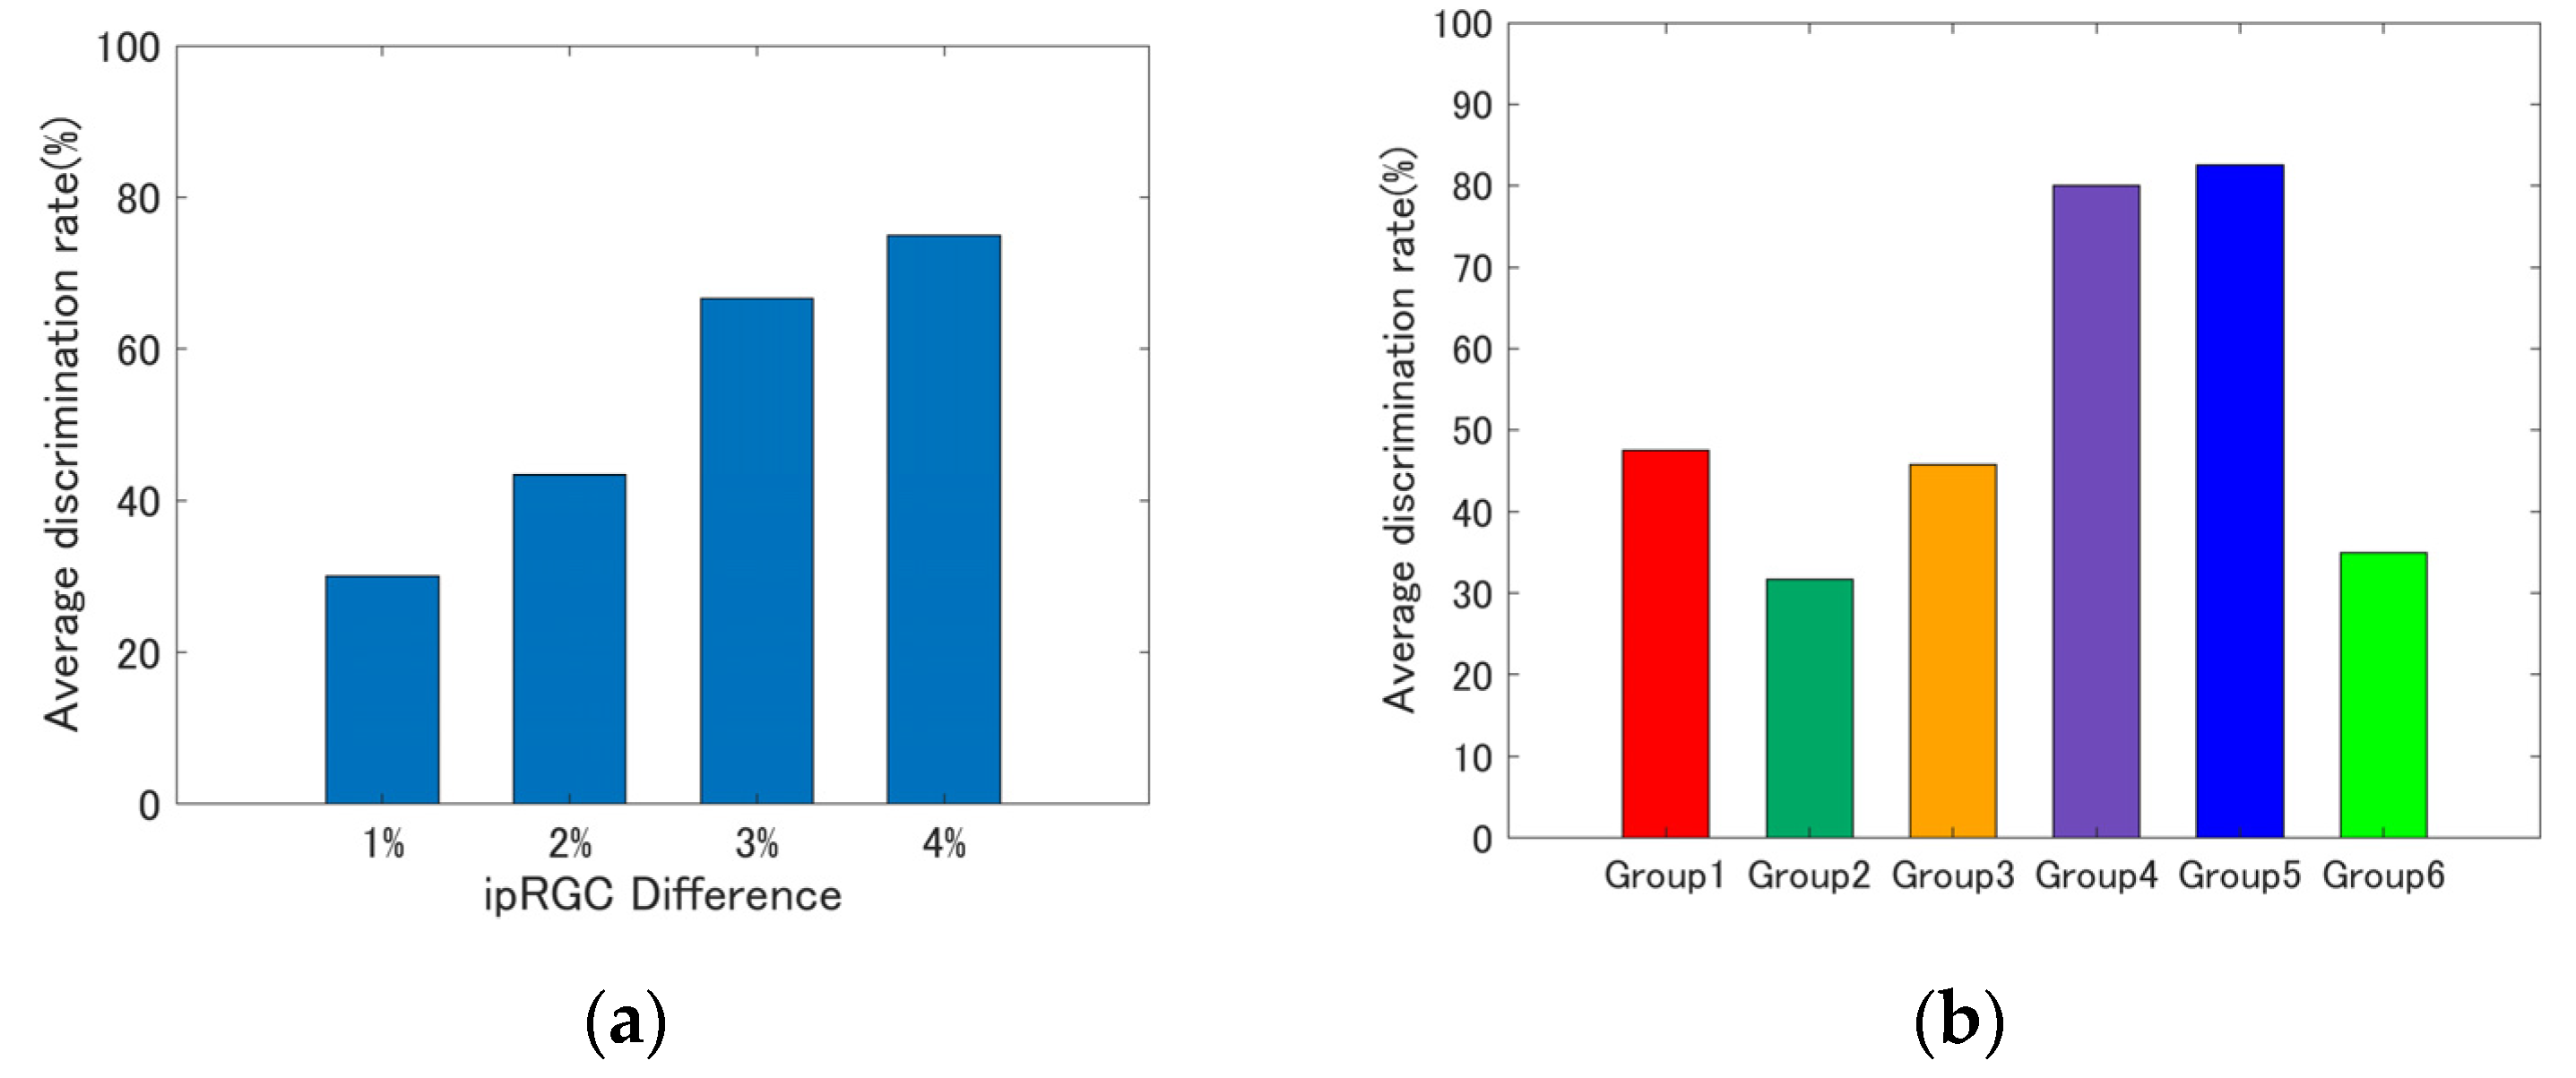
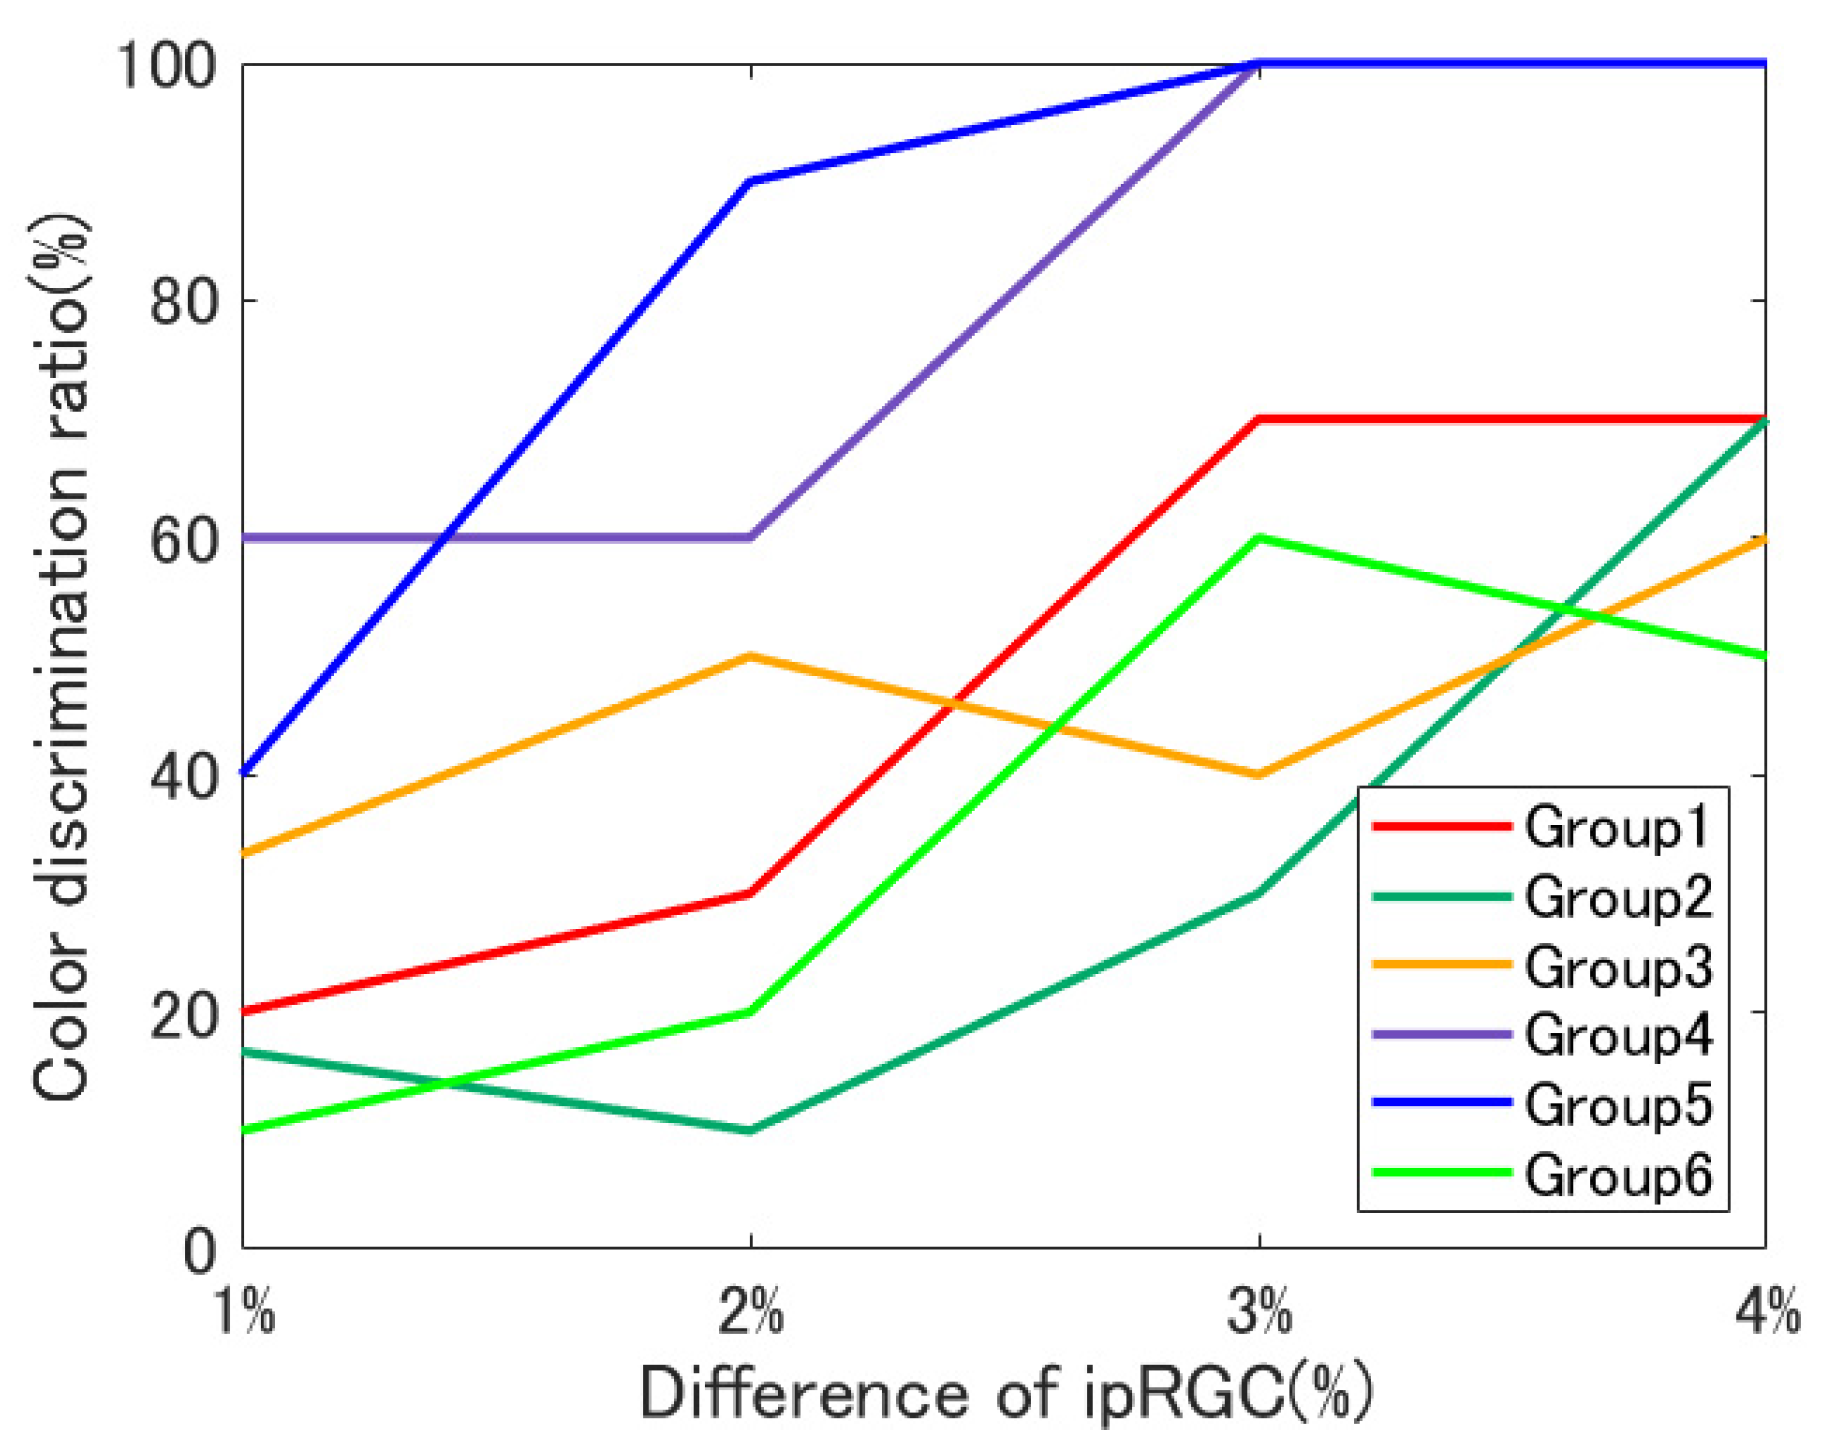
4. Results
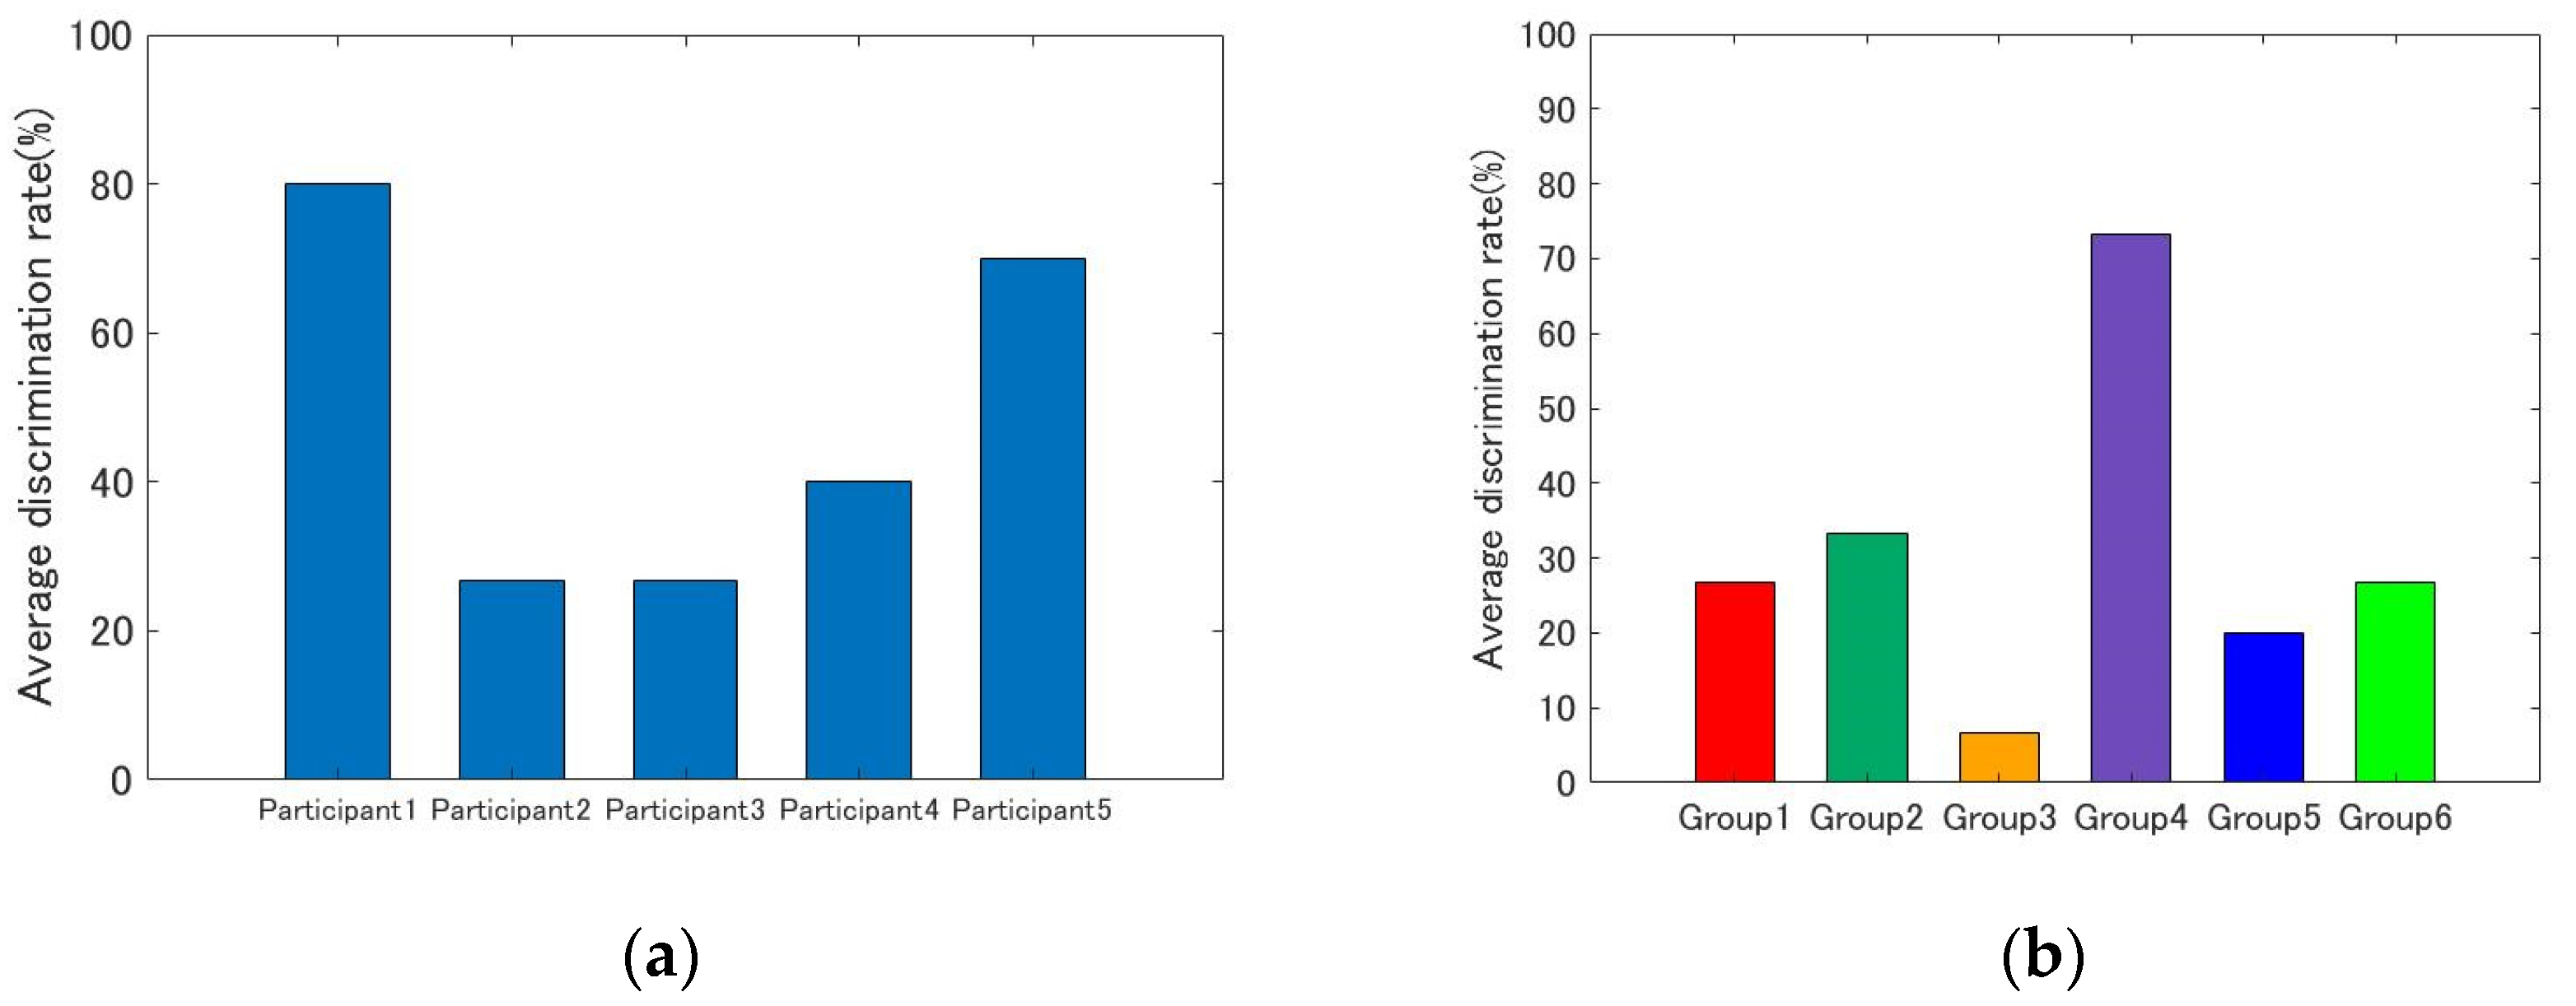
4.1. Individual Differences
4.2. Luminance of Experimental Stimuli
4.3. Viewing Angle
5. Conclusions
- -
- Previous studies on the contribution of ipRGCs to color perception have all, as far as the author has been able to determine, been conducted using white stimuli. This study is the first to investigate the contribution of ipRGCs to color vision for a number of color stimuli other than white and the first to experimentally demonstrate that ipRGCs may influence color discrimination, particularly for blue stimuli.
- -
- The multispectral projector used in this experiment could present color stimuli with far greater precision than previous multi-primary methods. To investigate the contribution of ipRGCs to color perception using this device, it was necessary to be able to independently control the ipRGC stimulation amount in the spectral data. The method proposed in Section 2 solved this problem. We expect that it will be possible to investigate the contribution of ipRGCs to vision with higher precision than in previous studies, not only in this study’s experiments.
Author Contributions
Funding
Institutional Review Board Statement
Informed Consent Statement
Data Availability Statement
Conflicts of Interest
Appendix A


| Group 1 | Group 2 | Group 3 | Group 4 | Group 5 | Group 6 | |||||||
|---|---|---|---|---|---|---|---|---|---|---|---|---|
| Stimulus | A | B | A | B | A | B | A | B | A | B | A | B |
| Y (cd/m2) | 4.44 | 4.50 | 4.91 | 4.99 | 9.09 | 9.09 | 3.20 | 3.19 | 3.06 | 3.04 | 8.12 | 8.16 |
| x | 0.362 | 0.362 | 0.280 | 0.283 | 0.364 | 0.366 | 0.286 | 0.285 | 0.260 | 0.258 | 0.319 | 0.321 |
| y | 0.284 | 0.286 | 0.336 | 0.336 | 0.381 | 0.384 | 0.260 | 0.259 | 0.264 | 0.264 | 0.393 | 0.394 |
| ΔLab | 1.05 | 1.11 | 1.28 | 0.537 | 0.373 | 0.797 | ||||||
| L-cone (%) | 23.9 | 24.2 | 24.3 | 24.8 | 47.0 | 47.1 | 16.3 | 16.2 | 15.2 | 15.1 | 40.7 | 40.9 |
| M-cone (%) | 21.5 | 21.9 | 29.3 | 29.7 | 49.0 | 49.0 | 17.9 | 17.8 | 18.2 | 18.1 | 47.1 | 47.3 |
| S-cone (%) | 45.2 | 45.1 | 45.8 | 46.2 | 49.7 | 48.3 | 45.6 | 45.9 | 45.1 | 45.0 | 48.6 | 48.0 |
| rod (%) | 29.8 | 29.9 | 38.8 | 39.0 | 54.1 | 53.6 | 28.6 | 28.4 | 28.8 | 29.0 | 54.0 | 53.6 |
| ipRGC (%) | 34.4 | 34.4 | 41.9 | 42.0 | 54.4 | 53.6 | 33.8 | 33.6 | 33.8 | 34.0 | 54.4 | 53.7 |
| Group 1 | Group 2 | Group 3 | Group 4 | Group 5 | Group 6 | |
|---|---|---|---|---|---|---|
| x | 0.362 | 0.282 | 0.366 | 0.288 | 0.259 | 0.320 |
| y | 0.286 | 0.338 | 0.385 | 0.263 | 0.264 | 0.394 |
| L-cone (%) | 36.5 | 37.5 | 56.5 | 24.9 | 22.8 | 56.6 |
| M-cone (%) | 31.1 | 42.7 | 55.6 | 25.7 | 25.8 | 61.9 |
| S-cone (%) | 43.0 | 43.9 | 36.4 | 42.8 | 42.9 | 42.0 |
| rod (%) | 36.4 | 46.2 | 41.7 | 36.2 | 36.7 | 48.3 |
| ipRGC (%) | 40.3 | 51.1 | 46.2 | 40.1 | 40.7 | 53.5 |
References
- Parraga, C.M.; Troscianko, T.; Tolhurst, D.J. The human visual system is optimised for processing the spatial information in natural visual images. Curr. Biol. 2000, 10, 35–38. [Google Scholar] [CrossRef] [Green Version]
- Sumner, P.; Mollon, J.D. Catarrhine photopigments are optimized for detecting targets against a foliage background. J. Exp. Biol. 2000, 203, 1963–1986. [Google Scholar] [CrossRef] [PubMed]
- Regan, B.C.; Julliot, C.; Simmen, B.; Vienot, F.; Charles-Dominique, P.; Mollon, J.D. Fruits, foliage and the evolution of primate colour vision. Philos. Trans. R. Soc. B Biol. Sci. 2001, 356, 229–283. [Google Scholar] [CrossRef] [PubMed] [Green Version]
- Parraga, C.A.; Troscianko, T.; Tolhurst, D.J. The effects of amplitude-spectrum statistics on foveal and peripheral discrimination of changes in natural images, and a multi-resolution model. Vis. Res. 2005, 45, 3145–3168. [Google Scholar] [CrossRef] [PubMed] [Green Version]
- Osorio, D.; Vorobyev, M. Colour vision as an adaptation to frugivory in primates. Proc. R. Soc. Lond. Ser. B Biol. Sci. 1996, 263, 593–599. [Google Scholar]
- Moroney, N.; Fairchild, M.D.; Hunt, R.W.; Changjun, L.; Luo, M.R.; Newman, T. The CIECAM02 color appearance model. In Proceedings of the Color and Imaging Conference, Society for Imaging Science and Technology, Scottsdale, AZ, USA, 13–17 November 2002; Volume 2002, pp. 23–27. [Google Scholar]
- Li, C.; Li, Z.; Wang, Z.; Xu, Y.; Luo, M.R.; Cui, G.; Melgosa, M.; Brill, M.H.; Pointer, M. Comprehensive color solutions: CAM16, CAT16, and CAM16-UCS. Color Res. Appl. 2017, 42, 703–718. [Google Scholar] [CrossRef]
- MacAdam, D.L. T visual sensitivities to color differences in daylight. J. Opt. Soc. Am. 1942, 32, 247–274. [Google Scholar] [CrossRef]
- Krauskopf, J.; Gegenfurtner, K. Color discrimination and adaptation. Vis. Res. 1992, 32, 2165–2175. [Google Scholar] [CrossRef]
- Ohtsu, M.; Hirai, K. Color Discrimination Experiments using Metameric ipRGC Stimuli. Electron. Imaging 2021, 16, 307–310. [Google Scholar] [CrossRef]
- Kagimoto, A.; Okajima, K. Perfect appearance match between self-luminous and surface colors can be performed with isomeric spectra. Sci. Rep. 2020, 10, 18350. [Google Scholar] [CrossRef] [PubMed]
- Park, S.W.; Ko, J.S.; Huh, J.H.; Kim, J.C. Review on generative adversarial networks: Focusing on computer vision and its applications. Electronics 2021, 10, 1216. [Google Scholar] [CrossRef]
- Veitch, J.A.; Davis, R.G. Lighting research today: The more things change, the more they stay the same. J. Illum. Eng. Soc. 2019, 15, 77–83. [Google Scholar] [CrossRef] [Green Version]
- Hatter, S.; Liao, H.W.; Takao, M.; Berson, D.M.; Yau, K.W. Melanopsin-Containing Retinal Ganglion Cells: Architecture, Projections, and Intrinsic Photosensitivity. Science 2002, 295, 1065–1070. [Google Scholar] [CrossRef] [PubMed] [Green Version]
- Berson, D.M.; Dunn, F.A.; Takao, M. Phototransduction by Retinal Ganglion Cells That Set the Circadian Clock. Science 2002, 295, 1070–1073. [Google Scholar] [CrossRef] [PubMed] [Green Version]
- Brown, T.M.; Tsujimura, S.; Allen, A.E.; Wynne, J.; Bedford, R.; Vickery, G.; Vugler, A.; Lucas, R.J. Melanopsin-Based Brightness Discrimination in Mice and Humans. Curr. Biol. 2012, 22, 1134–1141. [Google Scholar] [CrossRef] [PubMed] [Green Version]
- Yamakawa, M.; Tsujimura, S.; Okajima, K. A quantitative analysis of the contribution of melanopsin to brightness perception. Sci. Rep. 2019, 9, 7568. [Google Scholar] [CrossRef]
- Cao, D.; Chang, A.; Gai, S. Evidence for an impact of melanopsin activation on unique white perception. J. Opt. Soc. Am. A 2018, 35, B287–B291. [Google Scholar] [CrossRef] [PubMed]
- Hirai, K.; Irie, D.; Horiuchi, T. Multi-primary Image Projector using Programmable Spectral Light Source. J. Soc. Inf. Disp. 2016, 24, 144–153. [Google Scholar] [CrossRef]
- CIE Functions. Available online: https://github.com/ifarup/ciefunctions (accessed on 29 June 2020).
- CIE: CIE System for Metrology of Optical Radiation for ipRGC-Influenced Responses to Light, CIE S 026/E:2018; CIE: Vienna, Austria, 2018.


| Group | Chromaticity Point | ipRGC diff. = 1% | ipRGC diff. = 2% | ipRGC diff. = 3% | ipRGC diff. = 4% | ||||
|---|---|---|---|---|---|---|---|---|---|
| ipRGC | Max | Min | Max | Min | Max | Min | Max | Min | |
| Group 1 | Y (cd/m2) | 4.10 | 4.12 | 4.22 | 4.27 | 4.60 | 4.68 | 5.42 | 5.46 |
| x | 0.364 | 0.365 | 0.356 | 0.358 | 0.353 | 0.353 | 0.374 | 0.376 | |
| y | 0.233 | 0.235 | 0.246 | 0.247 | 0.260 | 0.259 | 0.304 | 0.303 | |
| ΔLab | 1.17 | 0.724 | 0.598 | 1.45 | |||||
| L-cone (%) | 21.8 | 21.7 | 22.2 | 22.0 | 24.1 | 23.7 | 27.9 | 27.6 | |
| M-cone (%) | 17.3 | 17.2 | 19.0 | 18.6 | 21.5 | 21.1 | 25.5 | 25.5 | |
| S-cone (%) | 60.9 | 59.6 | 59.2 | 57.7 | 59.5 | 58.9 | 49.6 | 49.0 | |
| rod (%) | 22.2 | 21.7 | 26.3 | 25.5 | 29.8 | 29.3 | 33.4 | 33.8 | |
| ipRGC (%) | 27.9 | 26.5 | 32.8 | 30.4 | 36.8 | 34.4 | 40.4 | 37.9 | |
| Group 2 | Y (cd/m2) | 5.03 | 5.03 | 5.00 | 5.00 | 5.35 | 5.28 | 4.80 | 4.72 |
| x | 0.179 | 0.180 | 0.202 | 0.200 | 0.231 | 0.235 | 0.290 | 0.294 | |
| y | 0.471 | 0.475 | 0.425 | 0.424 | 0.393 | 0.392 | 0.353 | 0.357 | |
| ΔLab | 0.870 | 0.536 | 1.77 | 1.33 | |||||
| L-cone (%) | 21.7 | 21.7 | 21.9 | 21.8 | 23.6 | 24.0 | 22.2 | 22.5 | |
| M-cone (%) | 33.9 | 33.9 | 32.8 | 32.9 | 33.3 | 33.6 | 27.0 | 27.5 | |
| S-cone (%) | 31.9 | 31.3 | 37.6 | 37.8 | 43.3 | 43.5 | 39.5 | 41.3 | |
| rod (%) | 45.8 | 46.1 | 46.3 | 46.3 | 46.5 | 47.2 | 35.3 | 34.7 | |
| ipRGC (%) | 47.3 | 46.8 | 49.8 | 48.1 | 51.1 | 49.6 | 40.2 | 36.8 | |
| Group 3 | Y (cd/m2) | 9.93 | 9.99 | 11.1 | 11.0 | 8.74 | 8.63 | 8.79 | 8.83 |
| x | 0.518 | 0.518 | 0.467 | 0.470 | 0.415 | 0.416 | 0.376 | 0.378 | |
| y | 0.432 | 0.435 | 0.420 | 0.421 | 0.406 | 0.408 | 0.393 | 0.397 | |
| ΔLab | 1.73 | 1.43 | 0.974 | 1.54 | |||||
| L-cone (%) | 52.5 | 52.2 | 56.8 | 56.9 | 43.3 | 43.8 | 43.4 | 43.3 | |
| M-cone (%) | 43.0 | 42.5 | 50.4 | 50.8 | 42.5 | 43.0 | 45.6 | 45.4 | |
| S-cone (%) | 9.35 | 9.78 | 24.4 | 25.5 | 31.8 | 33.0 | 42.8 | 44.1 | |
| rod (%) | 18.7 | 18.9 | 29.5 | 29.0 | 30.9 | 30.9 | 44.3 | 44.3 | |
| ipRGC (%) | 13.8 | 12.5 | 26.3 | 23.3 | 30.7 | 27.5 | 46.7 | 43.5 | |
| Group 4 | Y (cd/m2) | 1.54 | 1.51 | 2.04 | 2.07 | 3.15 | 3.24 | 4.57 | 4.71 |
| x | 0.182 | 0.181 | 0.206 | 0.205 | 0.242 | 0.248 | 0.296 | 0.298 | |
| y | 0.127 | 0.125 | 0.165 | 0.165 | 0.212 | 0.214 | 0.279 | 0.281 | |
| ΔLab | 0.484 | 0.565 | 1.89 | 0.996 | |||||
| L-cone (%) | 5.94 | 5.79 | 8.55 | 8.53 | 15.3 | 14.8 | 22.8 | 22.1 | |
| M-cone (%) | 8.79 | 8.56 | 11.5 | 11.5 | 18.3 | 18.1 | 25.3 | 24.6 | |
| S-cone (%) | 62.9 | 62.6 | 61.2 | 61.6 | 69.9 | 69.6 | 60.3 | 59.5 | |
| rod (%) | 24.4 | 24.1 | 26.2 | 26.9 | 35.7 | 36.6 | 39.9 | 41.2 | |
| ipRGC (%) | 32.9 | 31.8 | 34.5 | 34.0 | 46.0 | 44.5 | 49.8 | 47.2 | |
| Group 5 | Y (cd/m2) | 2.40 | 2.40 | 2.75 | 2.87 | 3.76 | 3.74 | 3.25 | 3.30 |
| x | 0.177 | 0.181 | 0.206 | 0.211 | 0.233 | 0.237 | 0.266 | 0.268 | |
| y | 0.198 | 0.200 | 0.225 | 0.227 | 0.252 | 0.254 | 0.282 | 0.281 | |
| ΔLab | 1.27 | 1.55 | 1.47 | 1.30 | |||||
| L-cone (%) | 10.4 | 10.4 | 12.9 | 12.3 | 17.2 | 17.2 | 15.5 | 15.3 | |
| M-cone (%) | 16.0 | 15.9 | 17.9 | 17.3 | 22.3 | 22.6 | 18.8 | 18.6 | |
| S-cone (%) | 64.6 | 63.4 | 61.0 | 59.7 | 63.9 | 65.7 | 45.3 | 44.4 | |
| rod (%) | 34.8 | 33.8 | 38.2 | 39.7 | 42.5 | 42.3 | 32.4 | 32.6 | |
| ipRGC (%) | 43.2 | 41.0 | 48.7 | 48.7 | 52.4 | 49.5 | 40.2 | 37.3 | |
| Group 6 | Y (cd/m2) | 9.92 | 9.99 | 10.1 | 10.1 | 10.3 | 10.3 | 6.95 | 7.13 |
| x | 0.313 | 0.313 | 0.315 | 0.314 | 0.317 | 0.318 | 0.331 | 0.334 | |
| y | 0.510 | 0.512 | 0.473 | 0.476 | 0.449 | 0.454 | 0.406 | 0.409 | |
| ΔLab | 0.560 | 1.44 | 1.89 | 1.59 | |||||
| L-cone (%) | 46.2 | 45.9 | 46.9 | 47.0 | 48.3 | 48.4 | 34.0 | 33.1 | |
| M-cone (%) | 59.2 | 58.8 | 58.9 | 59.2 | 59.6 | 59.8 | 39.5 | 38.6 | |
| S-cone (%) | 29.5 | 28.8 | 38.7 | 38.1 | 45.9 | 44.3 | 38.4 | 38.5 | |
| rod (%) | 60.5 | 60.1 | 63.4 | 64.0 | 65.8 | 66.4 | 43.1 | 44.0 | |
| ipRGC (%) | 56.6 | 54.9 | 62.4 | 60.7 | 66.4 | 64.1 | 45.9 | 43.5 | |
| Group | Chromaticity Point | ipRGC Diff. = 1% | ipRGC Diff. = 2% | ipRGC Diff. = 3% | ipRGC Diff. = 4% | ||||
|---|---|---|---|---|---|---|---|---|---|
| ipRGC | Max | Min | Max | Min | Max | Min | Max | Min | |
| Group 1 | x | 0.357 | 0.347 | 0.343 | 0.362 | ||||
| y | 0.218 | 0.227 | 0.241 | 0.286 | |||||
| L-cone (%) | 40.5 | 40.5 | 44.2 | 44.2 | |||||
| M-cone (%) | 30.2 | 32.4 | 37.1 | 38.2 | |||||
| S-cone (%) | 70.1 | 67.9 | 68.8 | 49.1 | |||||
| rod (%) | 36.8 | 42.3 | 48.4 | 46.9 | |||||
| ipRGC (%) | 44.1 | 43.1 | 50.4 | 48.4 | 57.3 | 54.2 | 54.2 | 50.2 | |
| Group 2 | x | 0.172 | 0.191 | 0.221 | 0.282 | ||||
| y | 0.448 | 0.400 | 0.371 | 0.338 | |||||
| L-cone (%) | 33.2 | 33.2 | 36.8 | 36.8 | |||||
| M-cone (%) | 48.0 | 46.3 | 48.3 | 41.8 | |||||
| S-cone (%) | 28.6 | 34.5 | 40.8 | 40.7 | |||||
| rod (%) | 59.7 | 60.5 | 62.7 | 49.8 | |||||
| ipRGC (%) | 58.9 | 57.8 | 62.0 | 59.9 | 66.0 | 62.8 | 54.3 | 50.2 | |
| Group 3 | x | 0.511 | 0.462 | 0.406 | 0.366 | ||||
| y | 0.432 | 0.420 | 0.402 | 0.385 | |||||
| L-cone (%) | 47.9 | 55.3 | 51.6 | 66.3 | |||||
| M-cone (%) | 36.4 | 45.8 | 47.1 | 64.9 | |||||
| S-cone (%) | 5.86 | 14.6 | 23.6 | 40.5 | |||||
| rod (%) | 14.9 | 24.5 | 31.7 | 58.8 | |||||
| ipRGC (%) | 10.7 | 9.68 | 20.9 | 18.8 | 30.2 | 27.1 | 59.3 | 55.3 | |
| Group 4 | x | 0.180 | 0.204 | 0.236 | 0.288 | ||||
| y | 0.107 | 0.145 | 0.189 | 0.263 | |||||
| L-cone (%) | 11.1 | 14.7 | 22.1 | 29.5 | |||||
| M-cone (%) | 15.3 | 18.3 | 25.1 | 30.7 | |||||
| S-cone (%) | 71.3 | 64.6 | 65.1 | 48.0 | |||||
| rod (%) | 35.8 | 36.1 | 42.6 | 42.2 | |||||
| ipRGC (%) | 45.5 | 44.4 | 45.0 | 43.0 | 52.0 | 49.0 | 49.6 | 45.6 | |
| Group 5 | x | 0.175 | 0.201 | 0.227 | 0.259 | ||||
| y | 0.177 | 0.203 | 0.230 | 0.264 | |||||
| L-cone (%) | 14.7 | 18.4 | 25.8 | 25.8 | |||||
| M-cone (%) | 21.1 | 24.2 | 31.4 | 29.3 | |||||
| S-cone (%) | 55.9 | 52.6 | 60.1 | 45.4 | |||||
| rod (%) | 38.4 | 44.8 | 50.2 | 42.5 | |||||
| ipRGC (%) | 45.0 | 43.9 | 53.7 | 51.7 | 58.7 | 55.6 | 49.8 | 45.8 | |
| Group 6 | x | 0.301 | 0.301 | 0.304 | 0.321 | ||||
| y | 0.500 | 0.465 | 0.440 | 0.395 | |||||
| L-cone (%) | 59.0 | 59.0 | 62.6 | 55.3 | |||||
| M-cone (%) | 70.1 | 69.0 | 72.1 | 60.0 | |||||
| S-cone (%) | 22.8 | 29.0 | 35.8 | 39.2 | |||||
| rod (%) | 60.0 | 62.3 | 67.0 | 56.1 | |||||
| ipRGC (%) | 53.0 | 51.8 | 57.9 | 55.7 | 64.1 | 61.1 | 56.6 | 52.5 | |
| Group | ipRGC Diff. = 1% | ipRGC Diff. = 2% | ipRGC Diff. = 3% | ipRGC Diff. = 4% | |
|---|---|---|---|---|---|
| ΔLab | Group 1 | 1.13 | 0.576 | 0.758 | 0.705 |
| Group 2 | 1.36 | 1.64 | 0.306 | 1.42 | |
| Group 3 | 1.63 | 0.990 | 1.53 | 1.67 | |
| Group 4 | 0.825 | 1.61 | 0.740 | 1.59 | |
| Group 5 | 0.889 | 0.832 | 0.975 | 0.776 | |
| Group 6 | 0.730 | 1.91 | 2.43 | 1.46 |
| Group 1 | Group 2 | Group 3 | Group 4 | Group 5 | Group 6 | |
|---|---|---|---|---|---|---|
| ΔLab | 1.37 | 1.53 | 1.80 | 0.406 | 0.677 | 1.42 |
Publisher’s Note: MDPI stays neutral with regard to jurisdictional claims in published maps and institutional affiliations. |
© 2022 by the authors. Licensee MDPI, Basel, Switzerland. This article is an open access article distributed under the terms and conditions of the Creative Commons Attribution (CC BY) license (https://creativecommons.org/licenses/by/4.0/).
Share and Cite
Ohtsu, M.; Kurata, A.; Hirai, K.; Tanaka, M.; Horiuchi, T. Evaluating the Influence of ipRGCs on Color Discrimination. J. Imaging 2022, 8, 154. https://doi.org/10.3390/jimaging8060154
Ohtsu M, Kurata A, Hirai K, Tanaka M, Horiuchi T. Evaluating the Influence of ipRGCs on Color Discrimination. Journal of Imaging. 2022; 8(6):154. https://doi.org/10.3390/jimaging8060154
Chicago/Turabian StyleOhtsu, Masaya, Akihiro Kurata, Keita Hirai, Midori Tanaka, and Takahiko Horiuchi. 2022. "Evaluating the Influence of ipRGCs on Color Discrimination" Journal of Imaging 8, no. 6: 154. https://doi.org/10.3390/jimaging8060154
APA StyleOhtsu, M., Kurata, A., Hirai, K., Tanaka, M., & Horiuchi, T. (2022). Evaluating the Influence of ipRGCs on Color Discrimination. Journal of Imaging, 8(6), 154. https://doi.org/10.3390/jimaging8060154