
Four Severity Levels for Grading the Tortuosity of a Retinal Fundus Image

 , , , , and
Abstract
:1. Introduction
- Calculated the tortuosity values of each of the fourteen tortuosity metrics to the vessels of each image in the large-scale AV-classification dataset [15].
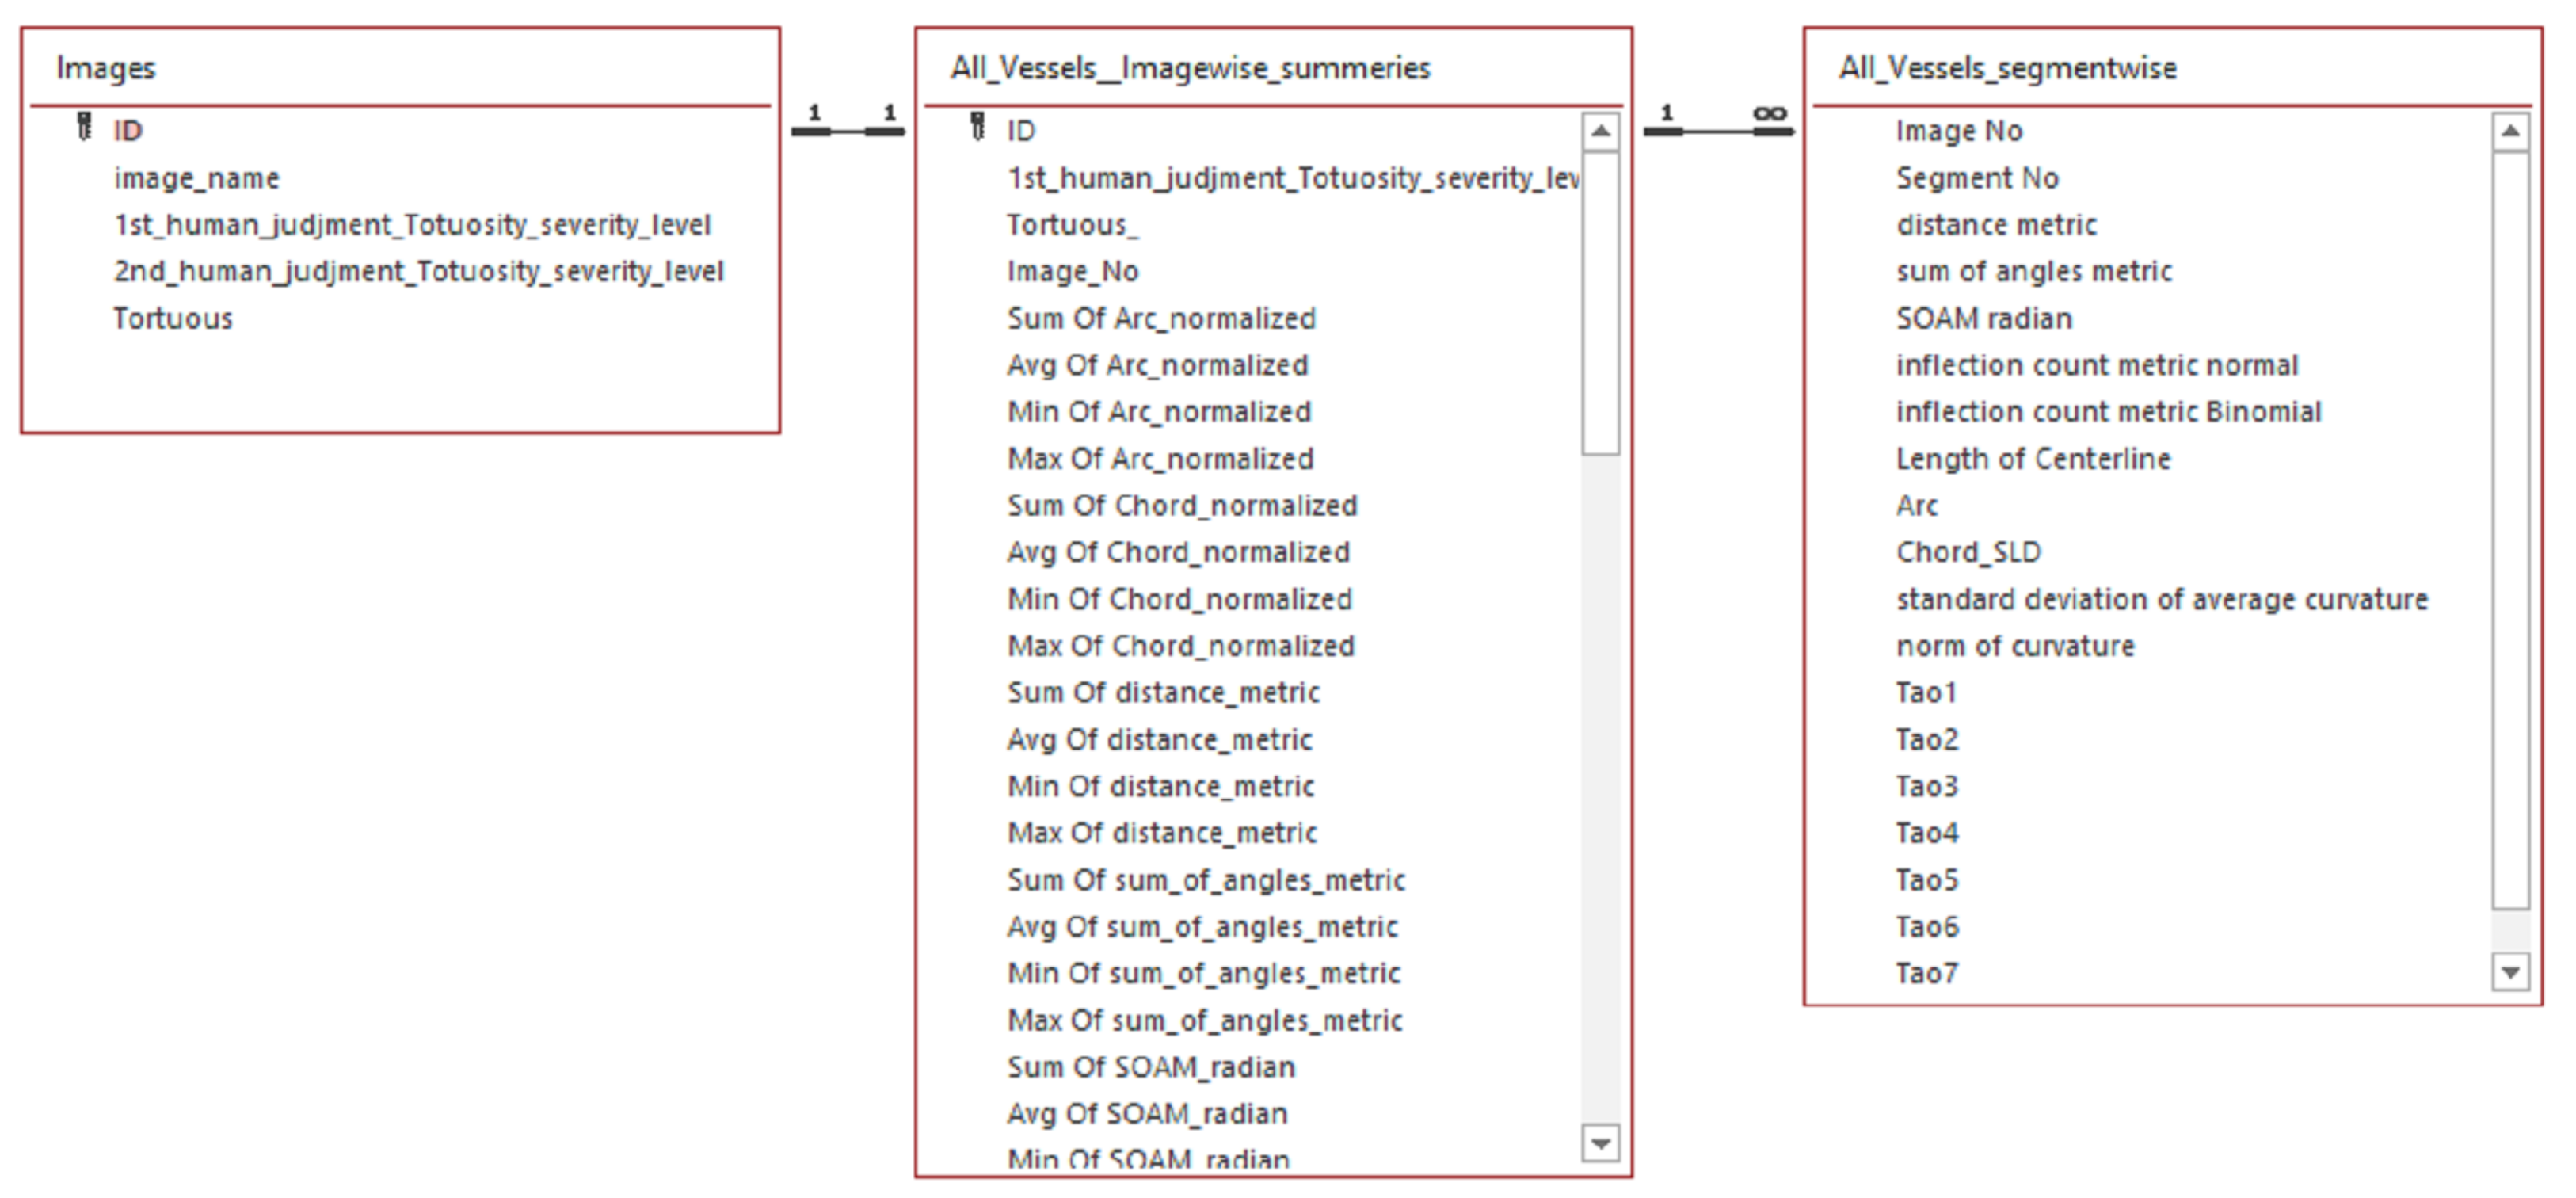
- The result is two tortuosity feature sets, one at the image level and the other at each vessel-segment level.
- Collaborated with two ophthalmologists from RAK university of science and technology and Saqr hospital to label AV-classification dataset images to 4-levels of severity.
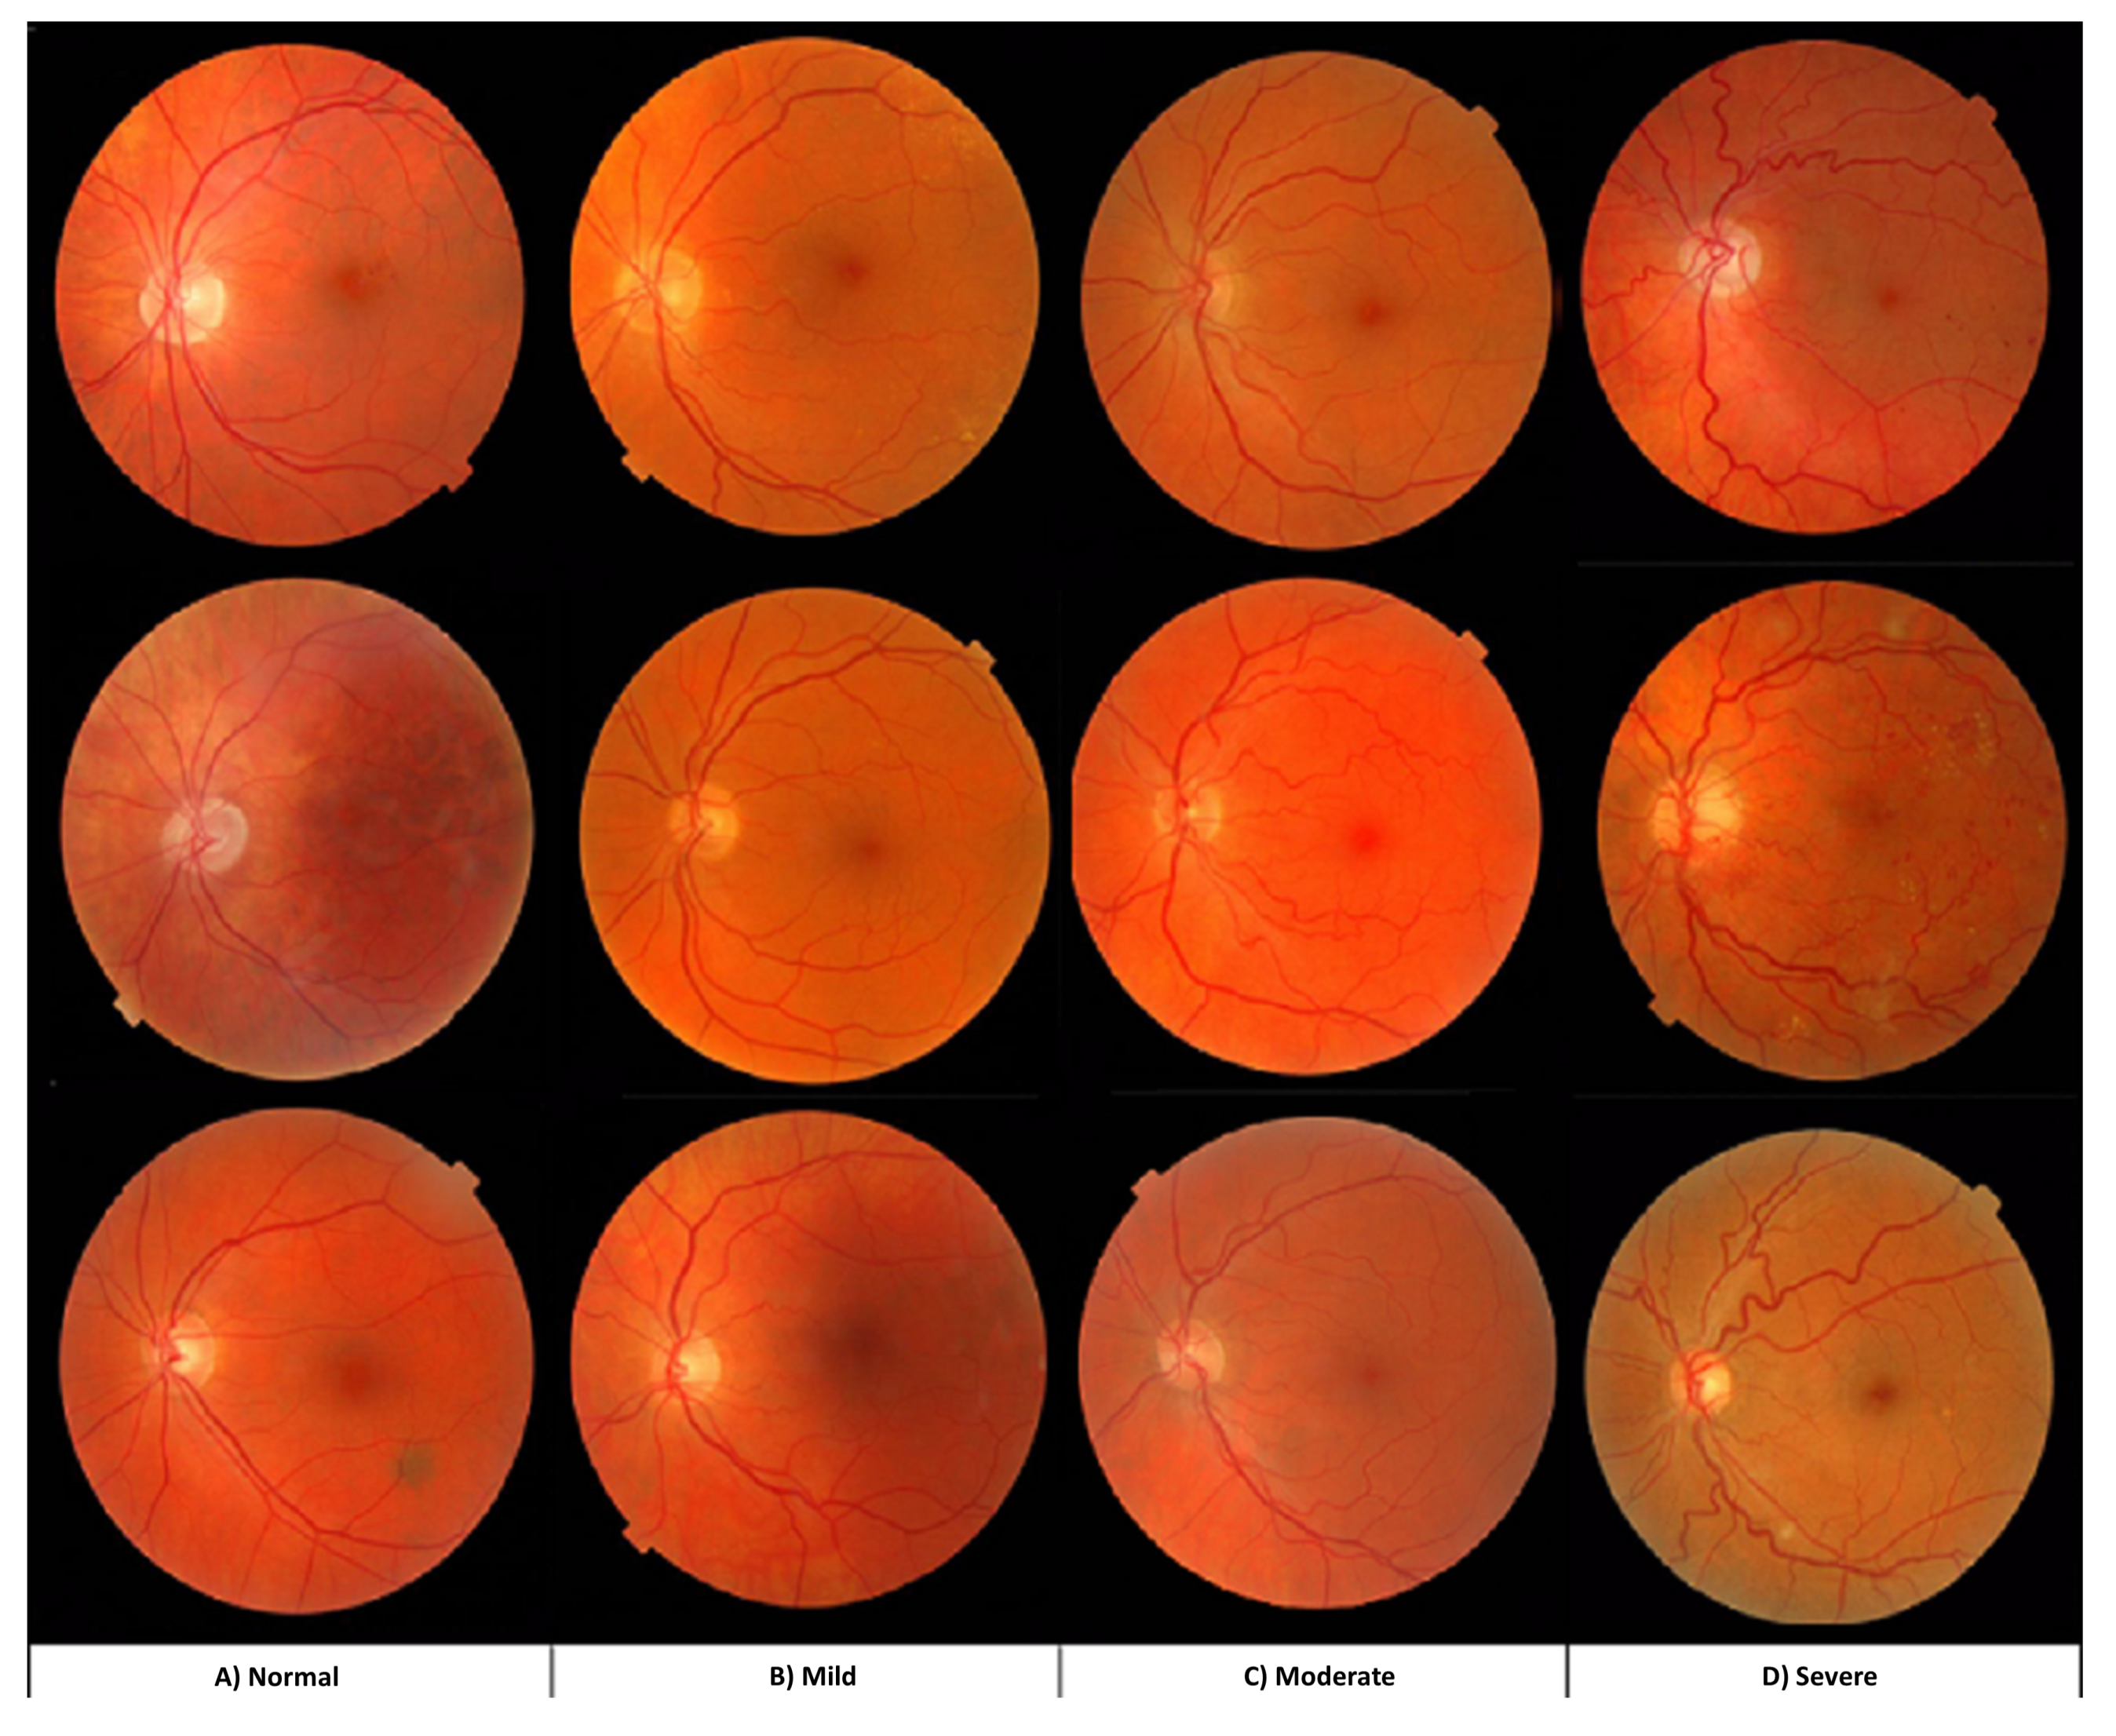
- The two ophthalmologists label the images of the AV classification dataset to classify each image to its tortuosity severity level (normal, mild, medium, and severe) based on their expert judgment as ground truth labels for tortuosity severity.
- The feature sets and the expert labels are used as input to machine learning to classify each retinal image into a class from (0 to 4) that tags each image with the severity of retinal vessels tortuosity, whether it is normal, mild, medium, or severe.
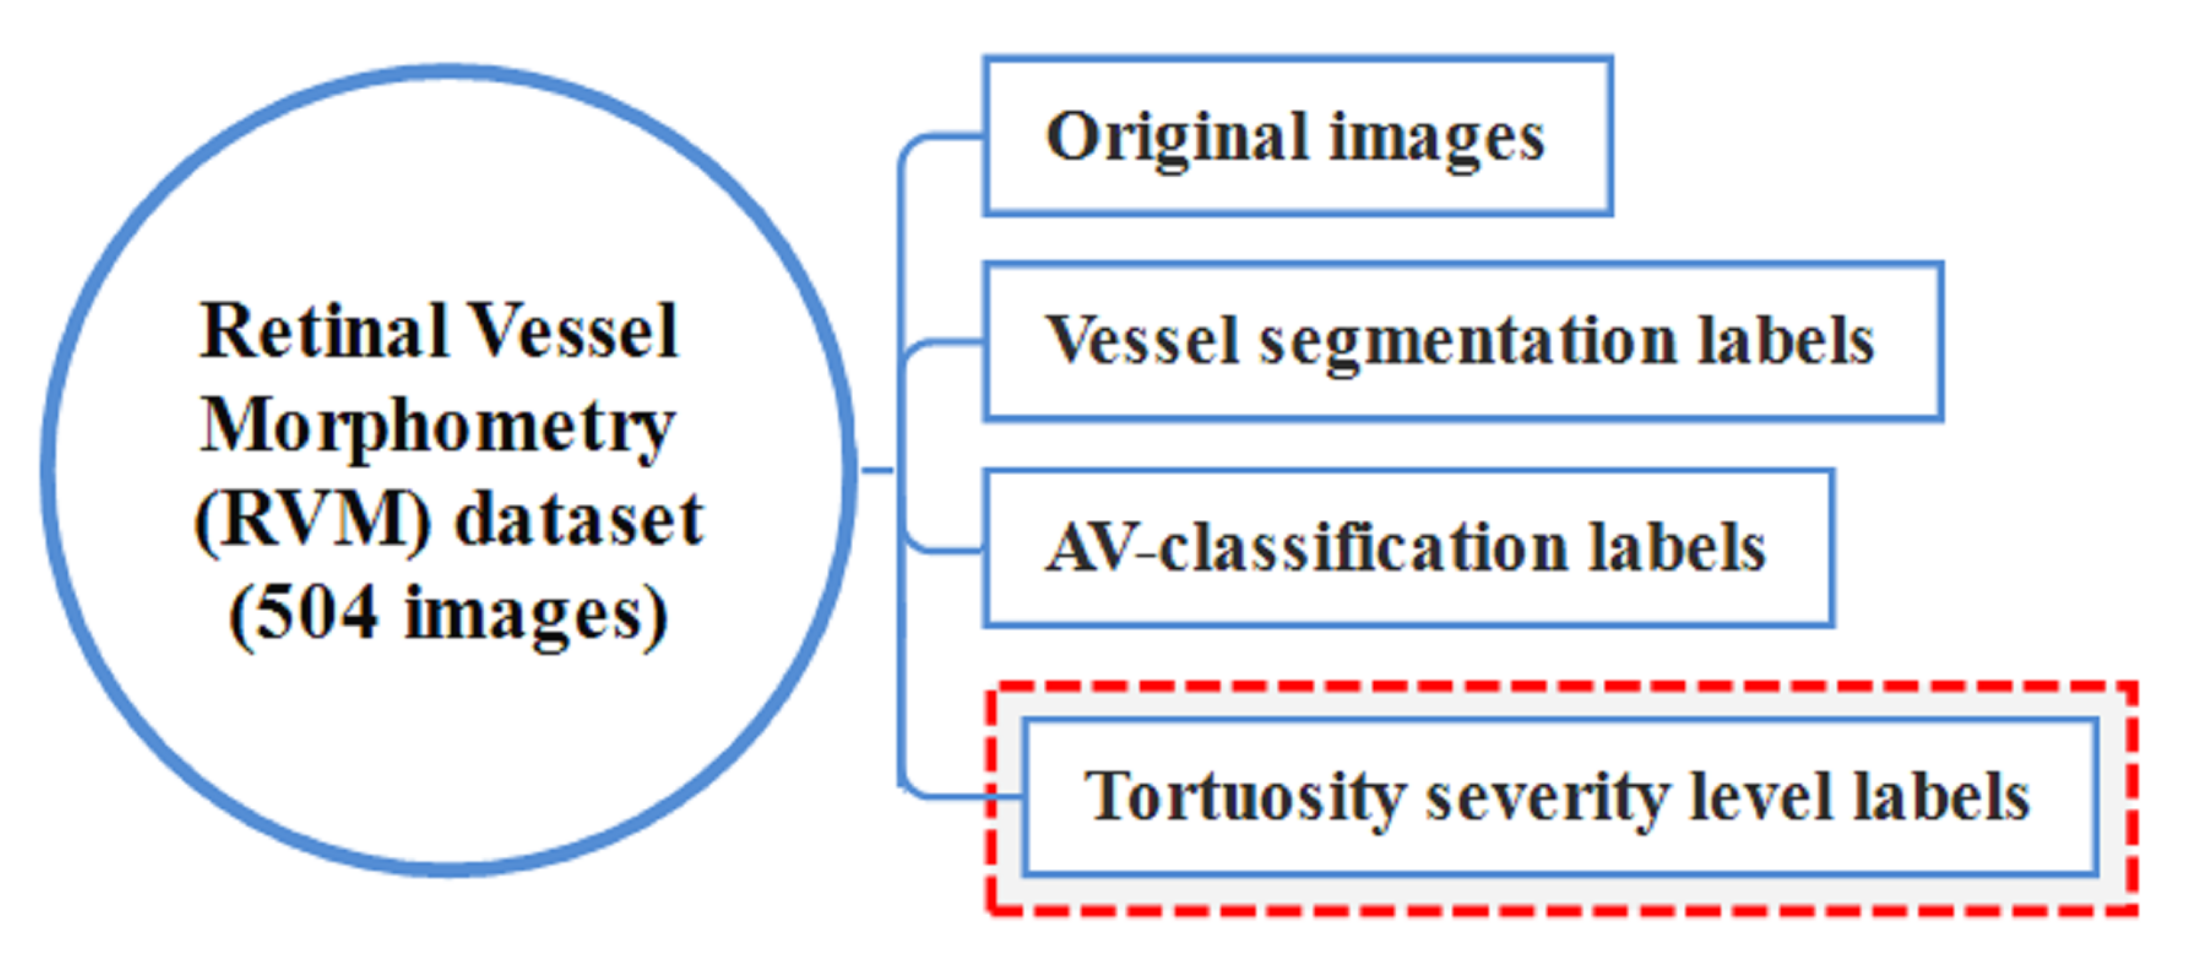
- The AV-classification dataset is extended by adding the 4-severity grades of each image.
- Finally, the new extended AV-classification comprehensive dataset is renamed to the retinal vessel morphometry (RVM) dataset. As it is a sizable data set and contains ground truth labels for each of these issues, the data set is made available for use by other researchers to study the tortuosity measures and other categories of retinal fundus image research problems, such as vessel segmentation, artery vein classification, and tortuosity severity.
2. Retinal Tortuosity Review
3. Materials and Method
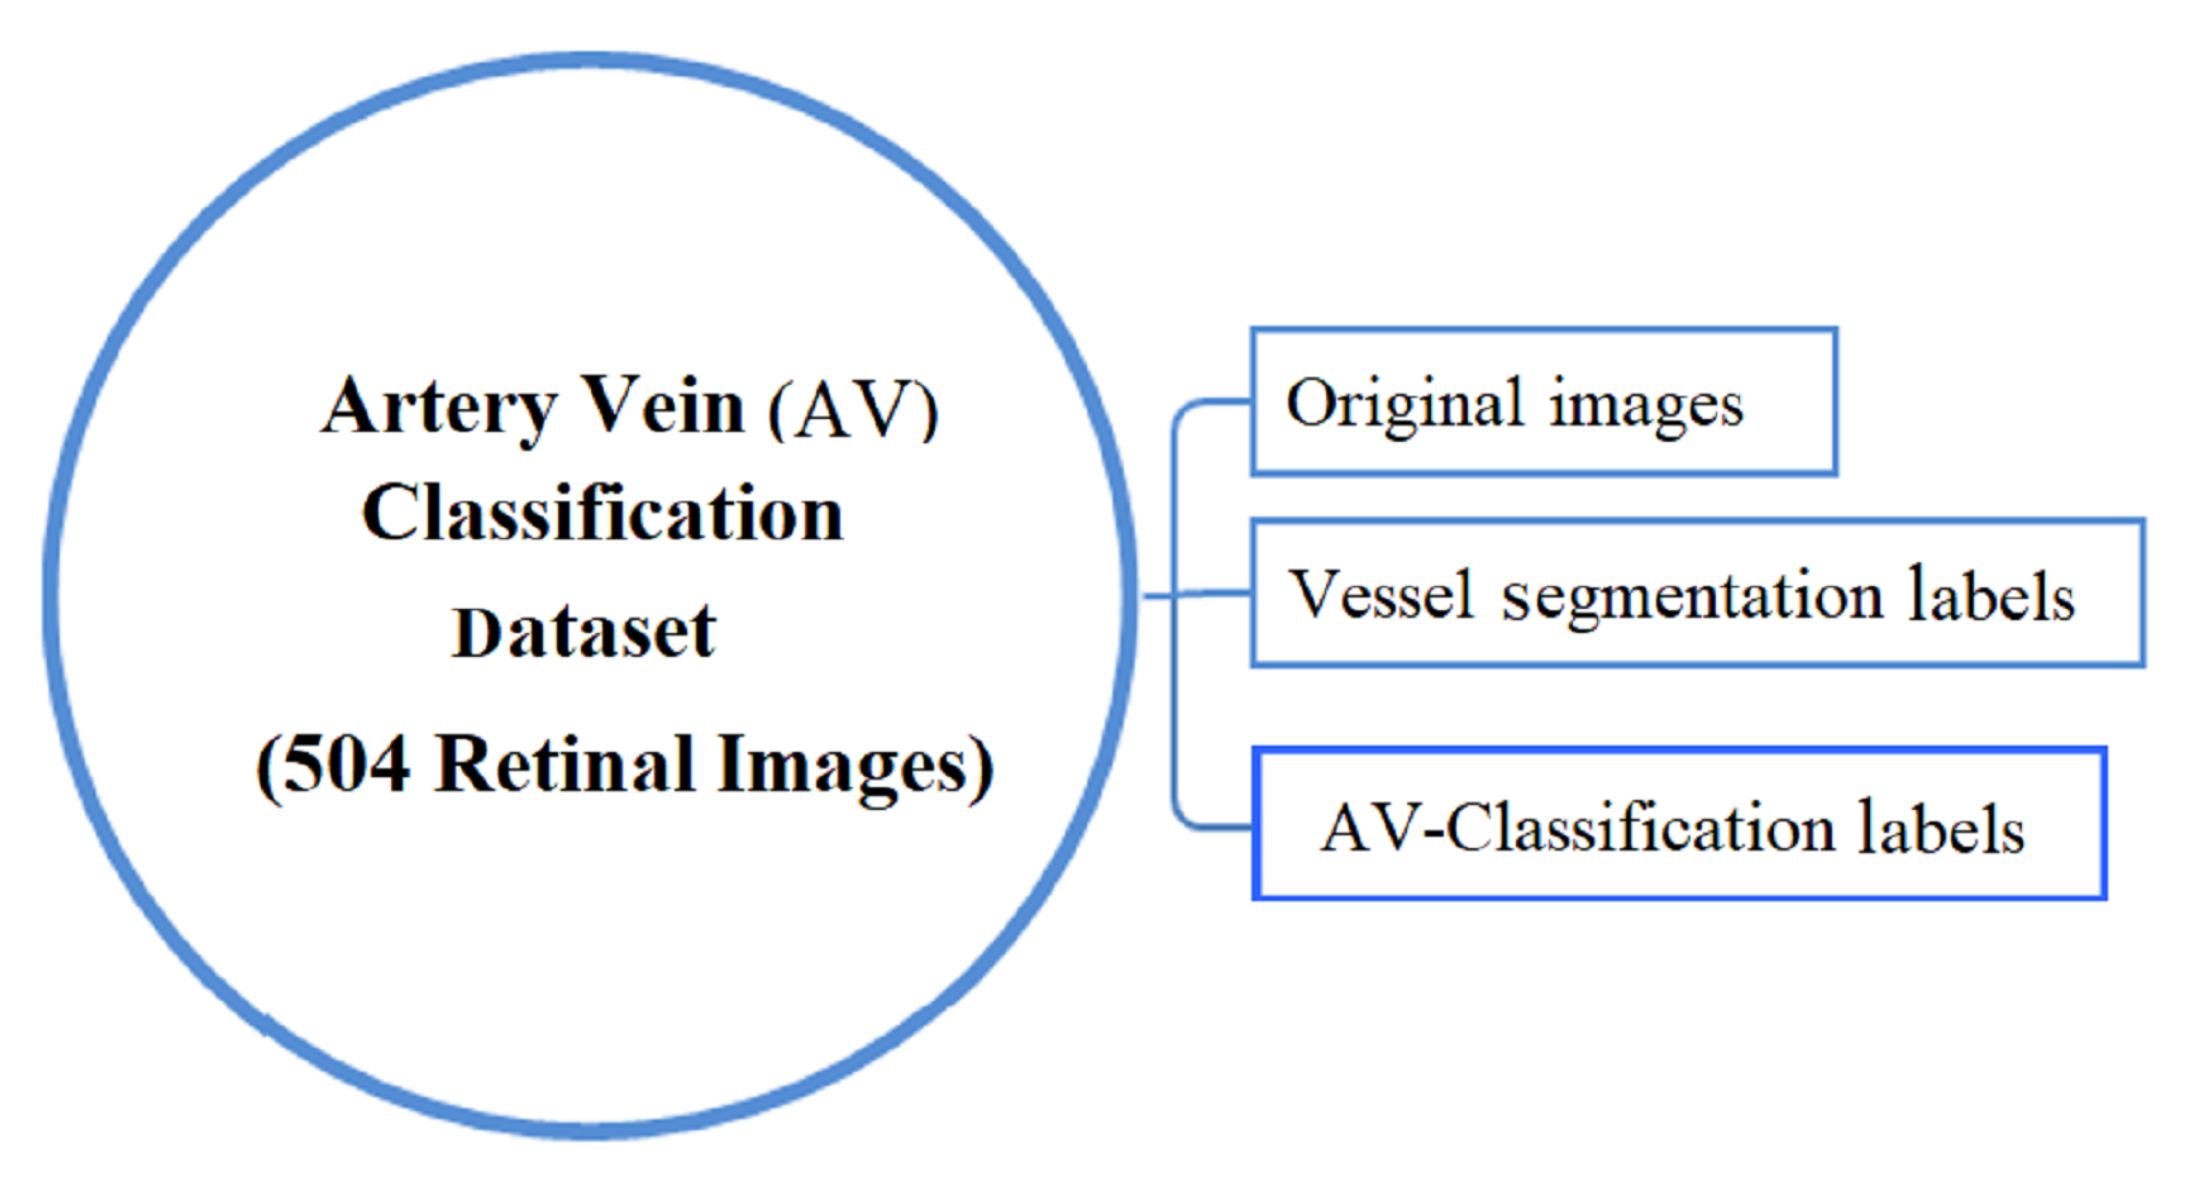
3.1. Materials
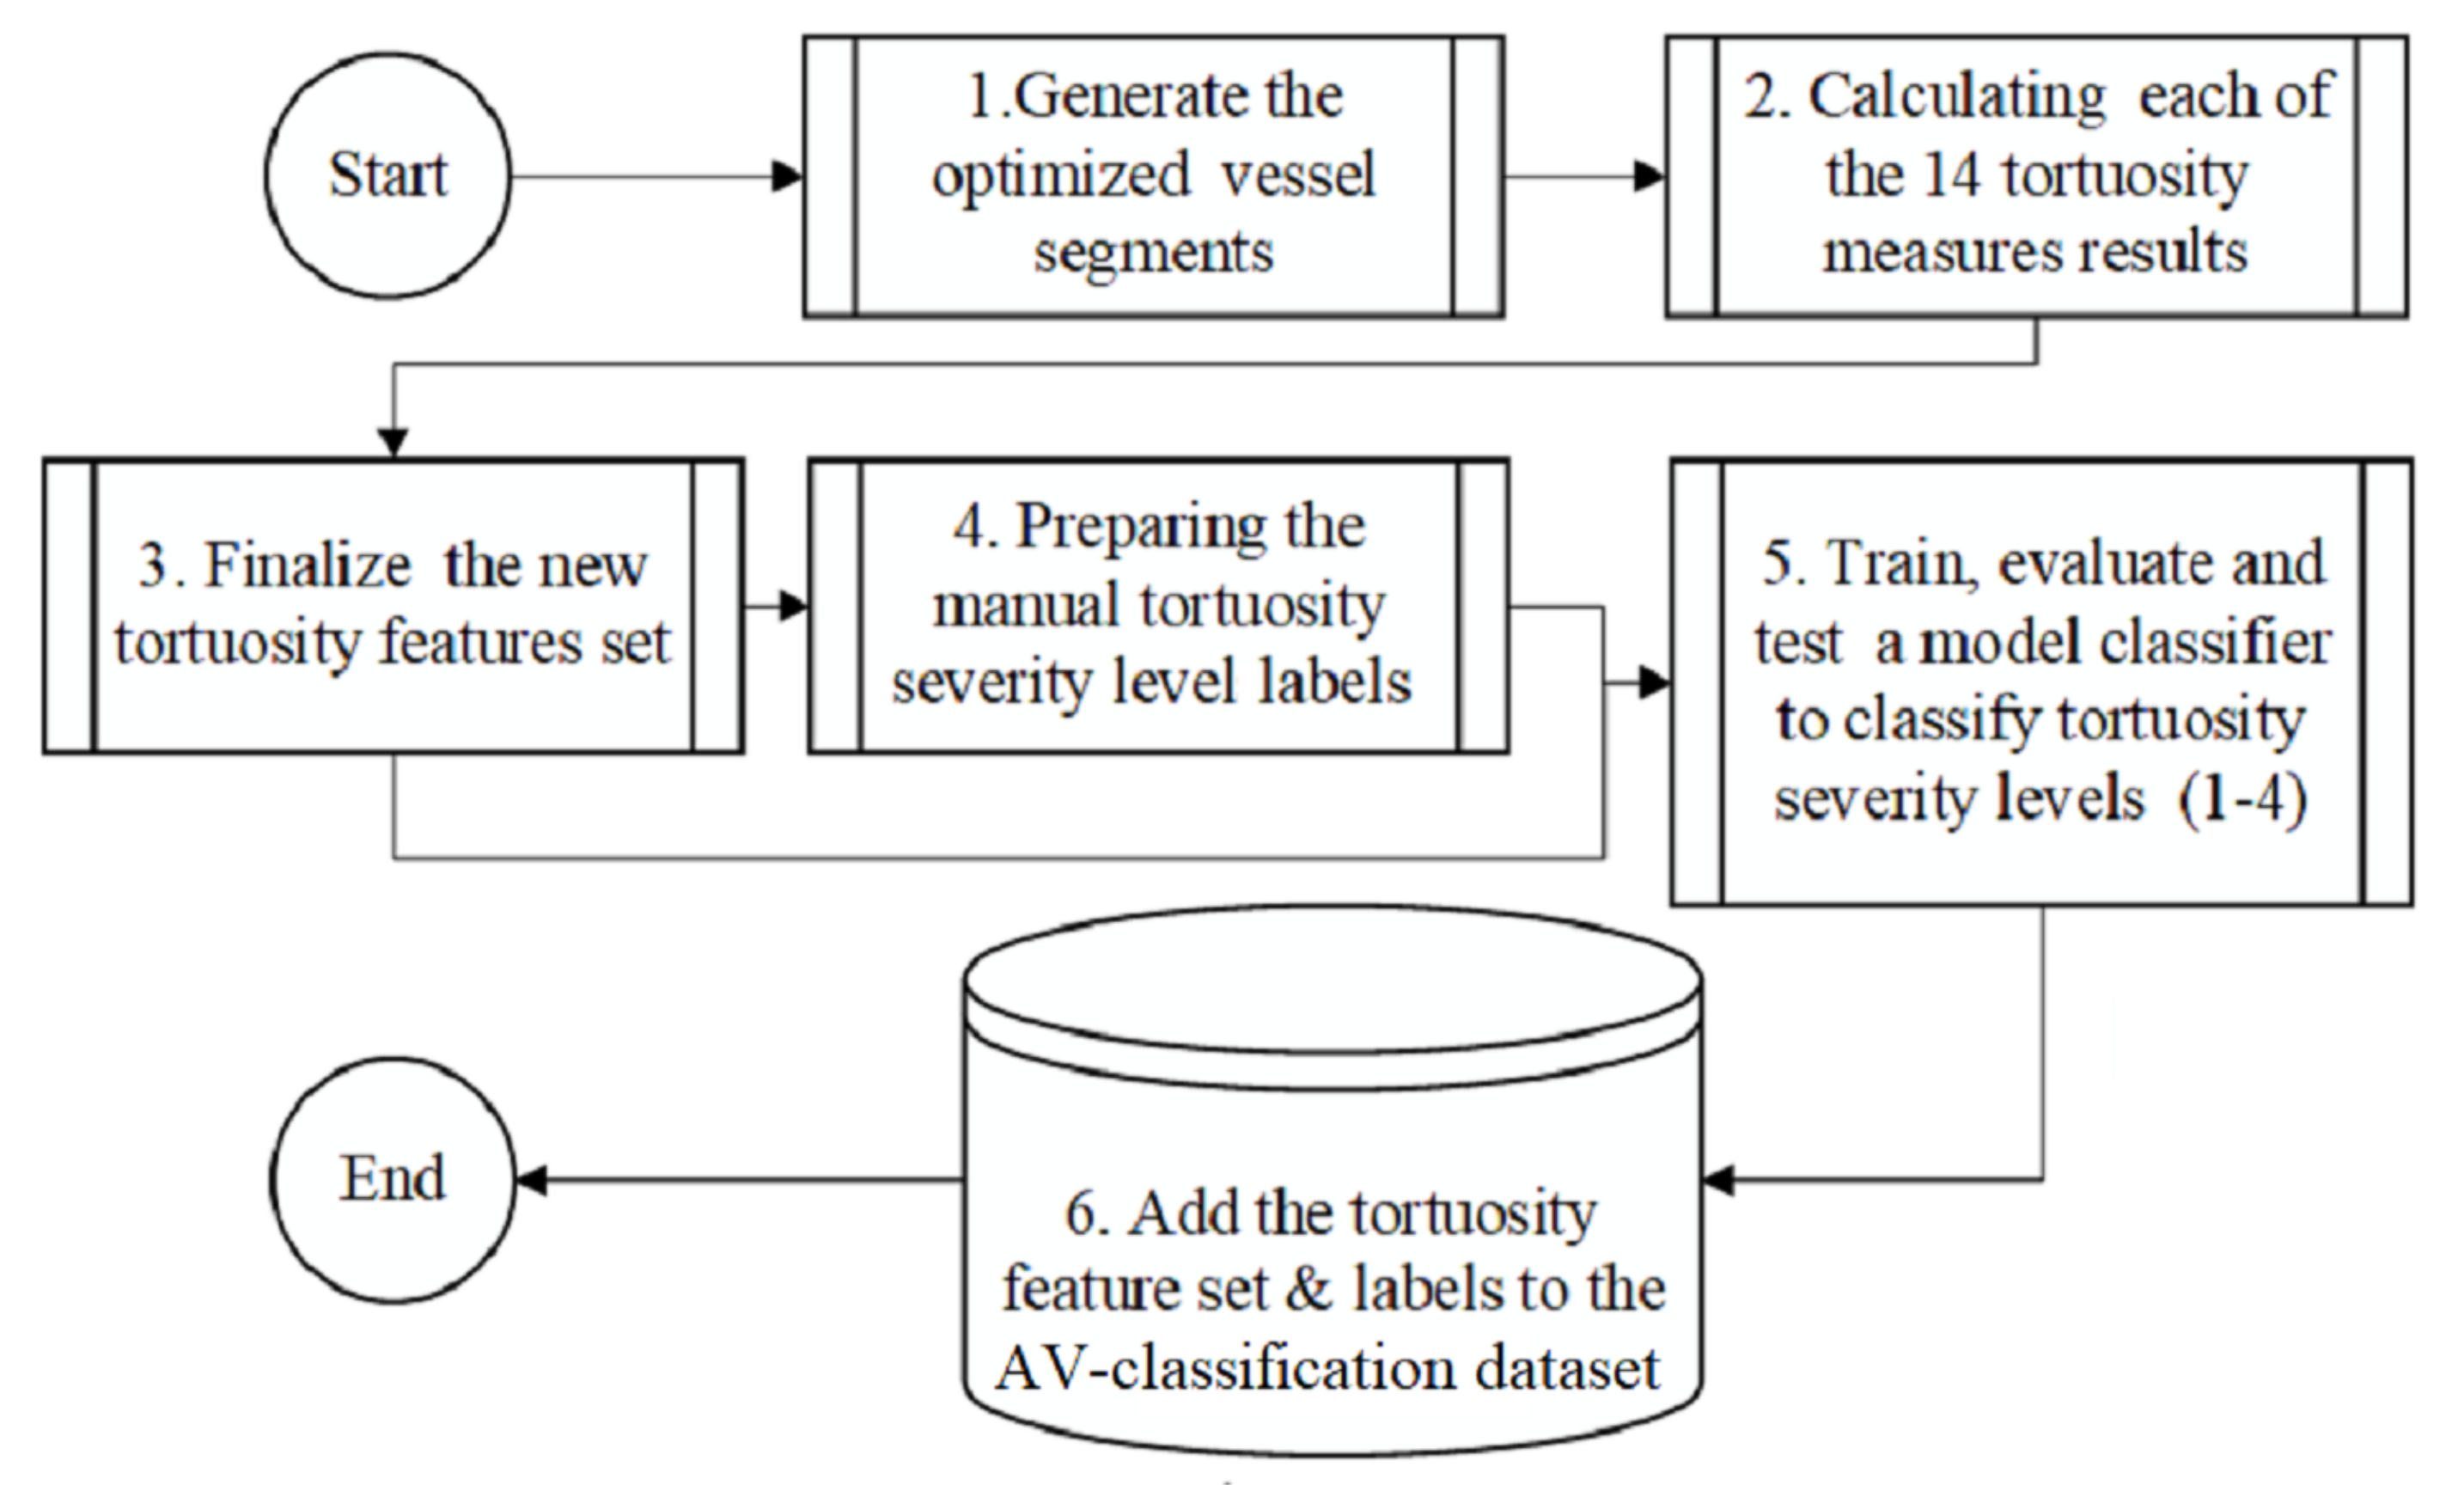
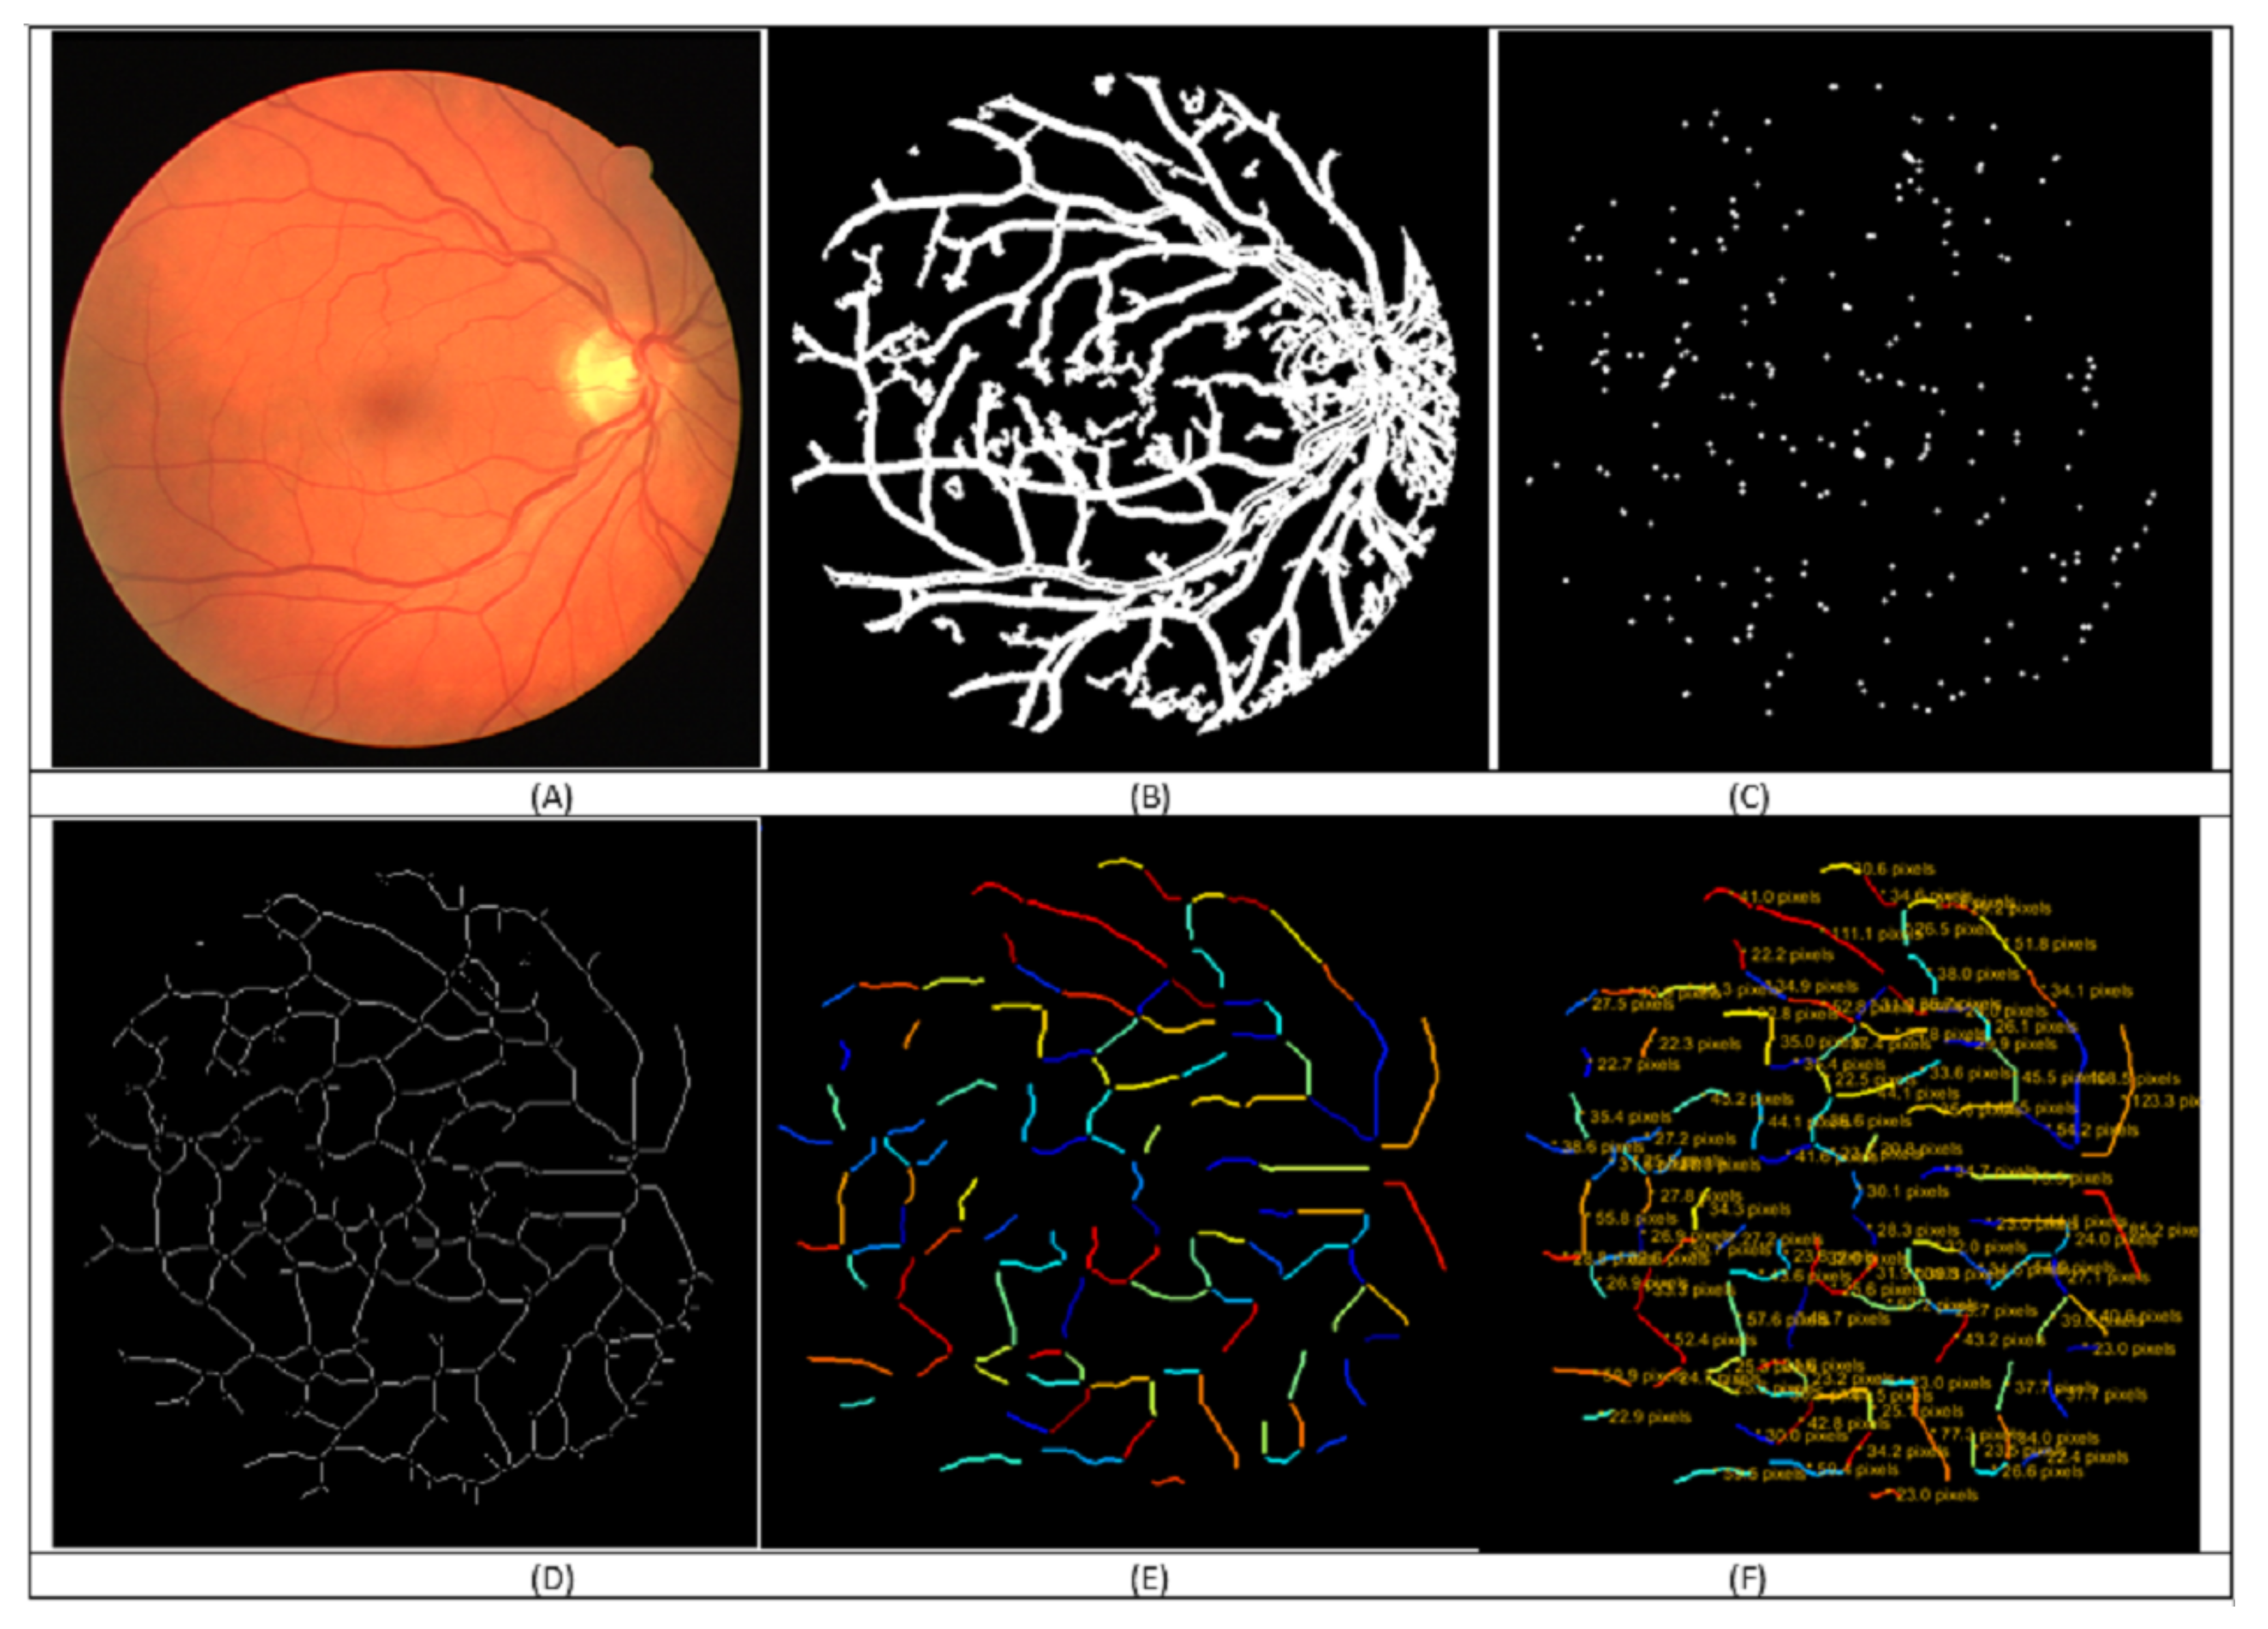
3.2. Method
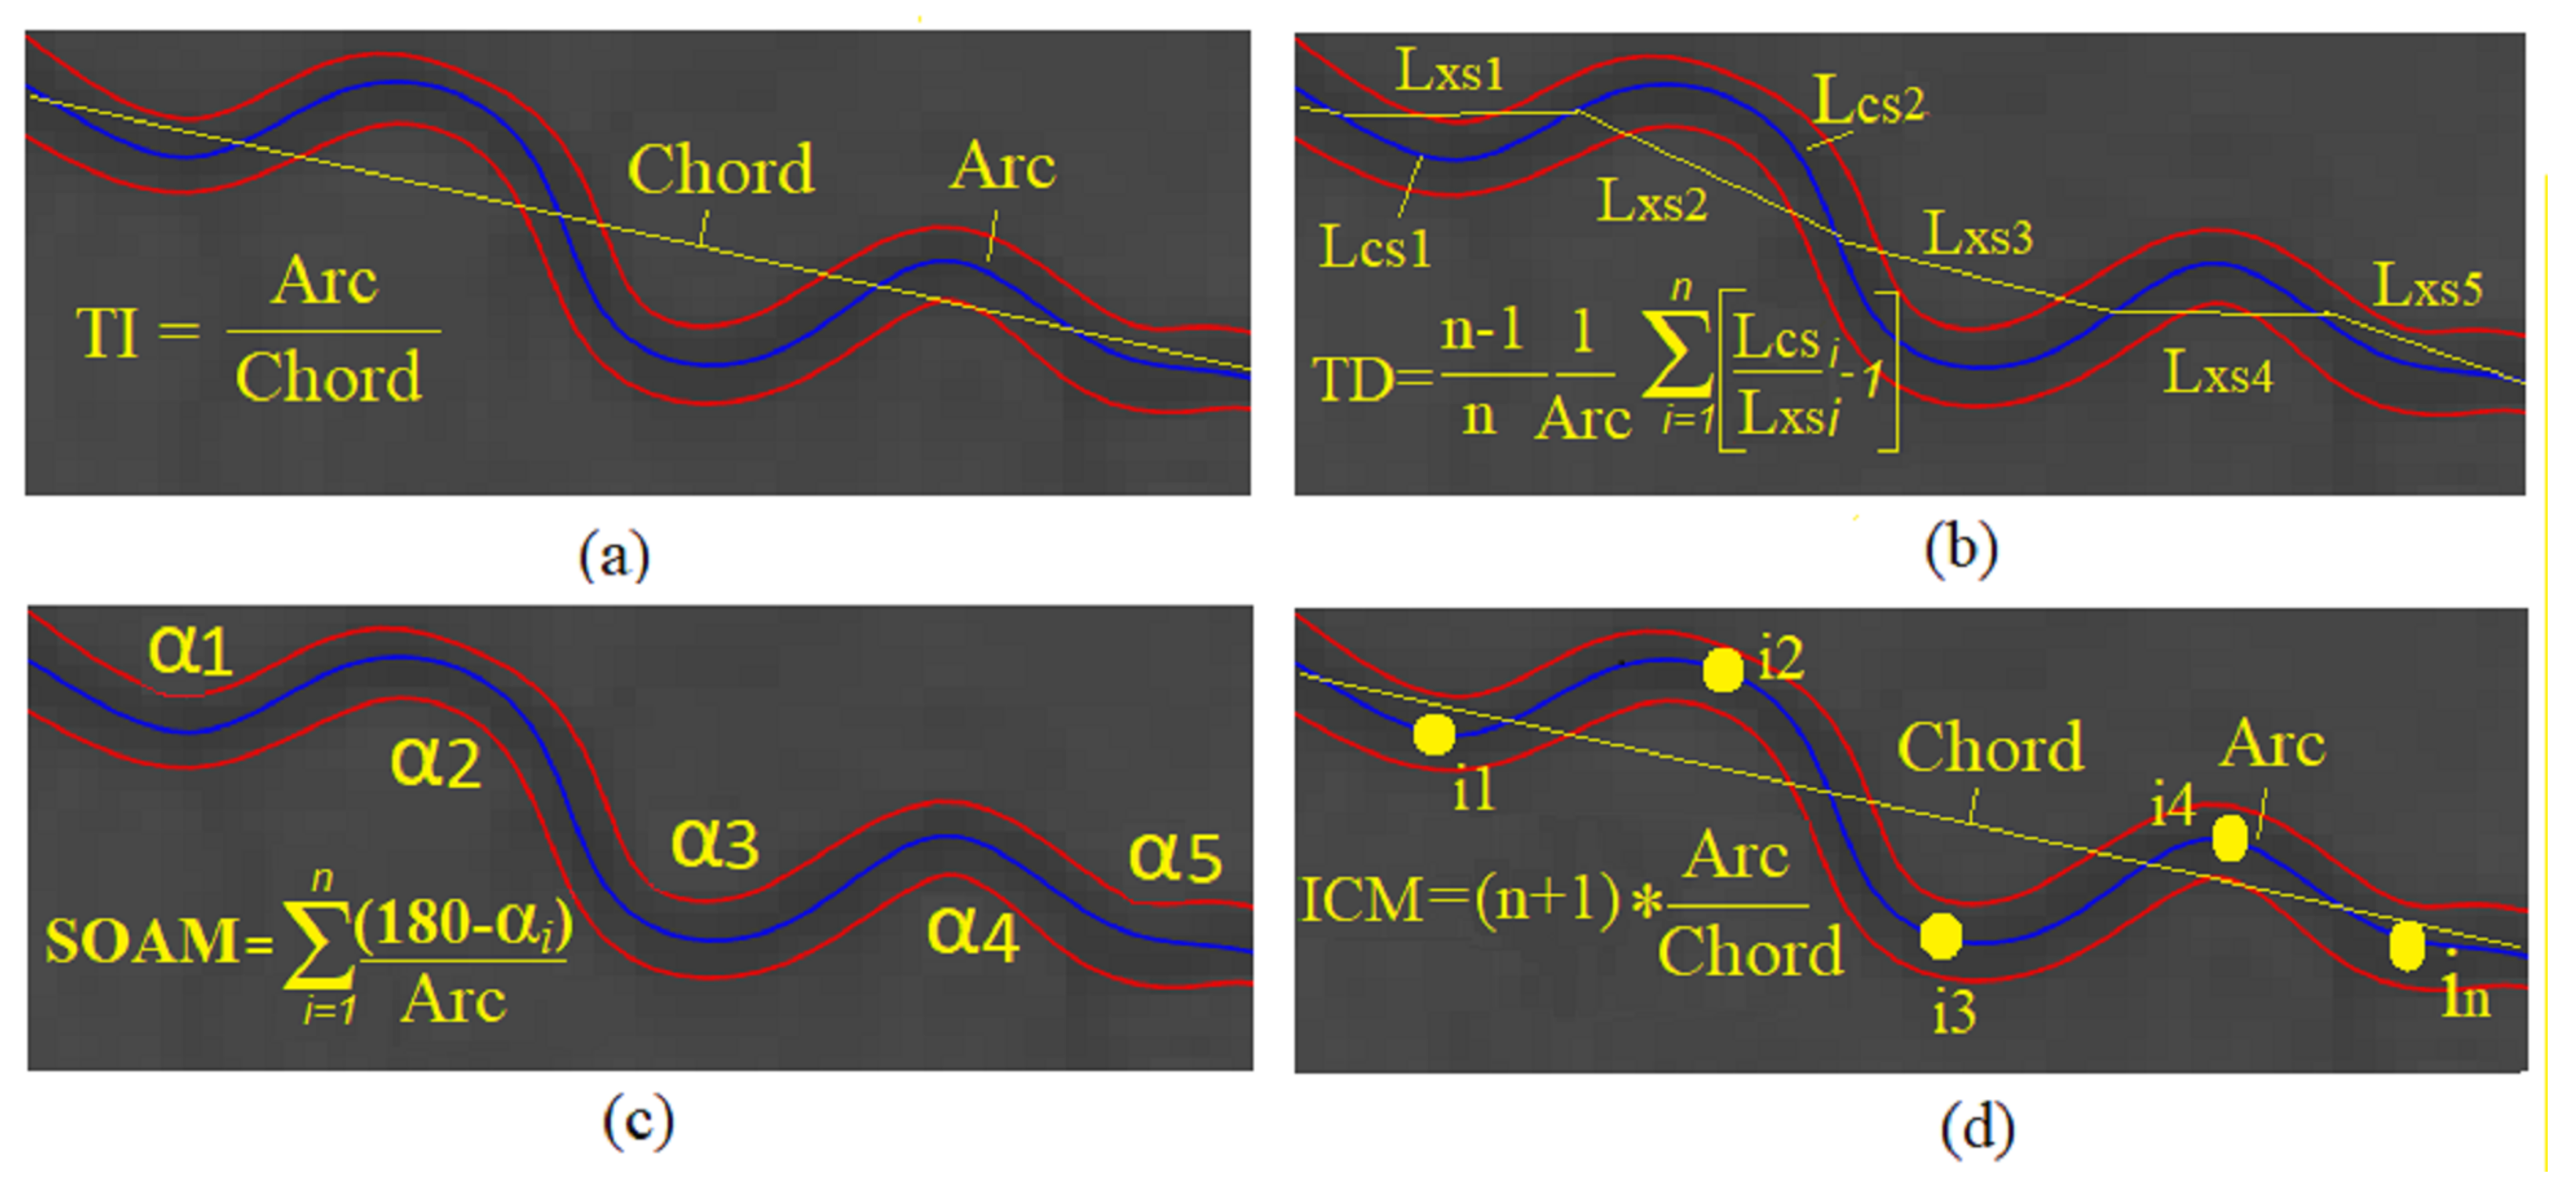
3.3. Tortuosity Metrics
- Straight Line Distance (Chord): It is the straight-line-distance between two endpoints of the centrelines segment skeleton (Euclidian distance).
- Geodesic distance (Arc): The arc-length distance between the segment end- points, using the maximum non-infinity quasi-Euclidean distance between two endpoints of the segment center-line skeleton.
- Distance Metric (DM): Although, the most straightforward dimensionless tortuosity measure used in the literature is the arc to chord ratio between the start and end points of the center line. It does not distinguish between the curvature of “S” and “C” shaped segments with equivalent arc-length. It is the most commonly used metric in the literature [46].
- Arc length/chord length: Called the distance factor (DF) as well. After dividing the segment into subsegments into chosen sample points (n) , (DF) is the summation arc to chord ratio of each subsegment for all subsegments.
- Tortuosity density (TD): After dividing the segment to subsegments into chosen sample points (n). TD is the summation of each subsegment’s arc to chord ratio for all sub-segments.
- The curvature at a single point (t): For a point at vessel segment (s), the curvature at a point t is defined as the equation
- Tortuosity density (): After dividing the segment into subsegments on chosen sample points (n), tortuosity density, for straight line segment.
- Total curvature (): Is the integration of .
- Total Squared curvature (): Is the integration of
- Total curvature/Arc-length (): Is the integration of
- Total squared curvature/Arc-length (): Is the integration of
- Total curvature/Chord-length (): Is the integration of /Chordlength
- Total squared curvature/Chord-length (): Is the integration of / Chordlength
- Sum of angles metric (SOAM): It is used for measuring the strongly coiled vessels, and the SOAM is a result of measuring the angle between two vectors formed by each consecutive three-segment point. The normalized summation of all of these angles along the segment is measured by segment length [46]. The units of the SOAM measure are (radians/mm). This metric requires that points used from a segment to calculate it are evenly spaced.
- Inflection count metric (ICM): It was extending the DM and is known as the times the inflection points count along the segment.
3.4. Preparing the New Feature-Set
3.5. Tortuosity Labeling Approach
3.6. Tortuosity Labeling Methodology
3.7. Tortuosity Severity Levels Identification Using Machine Learning
3.7.1. J48 Decision Tree
3.7.2. Rotation Forest
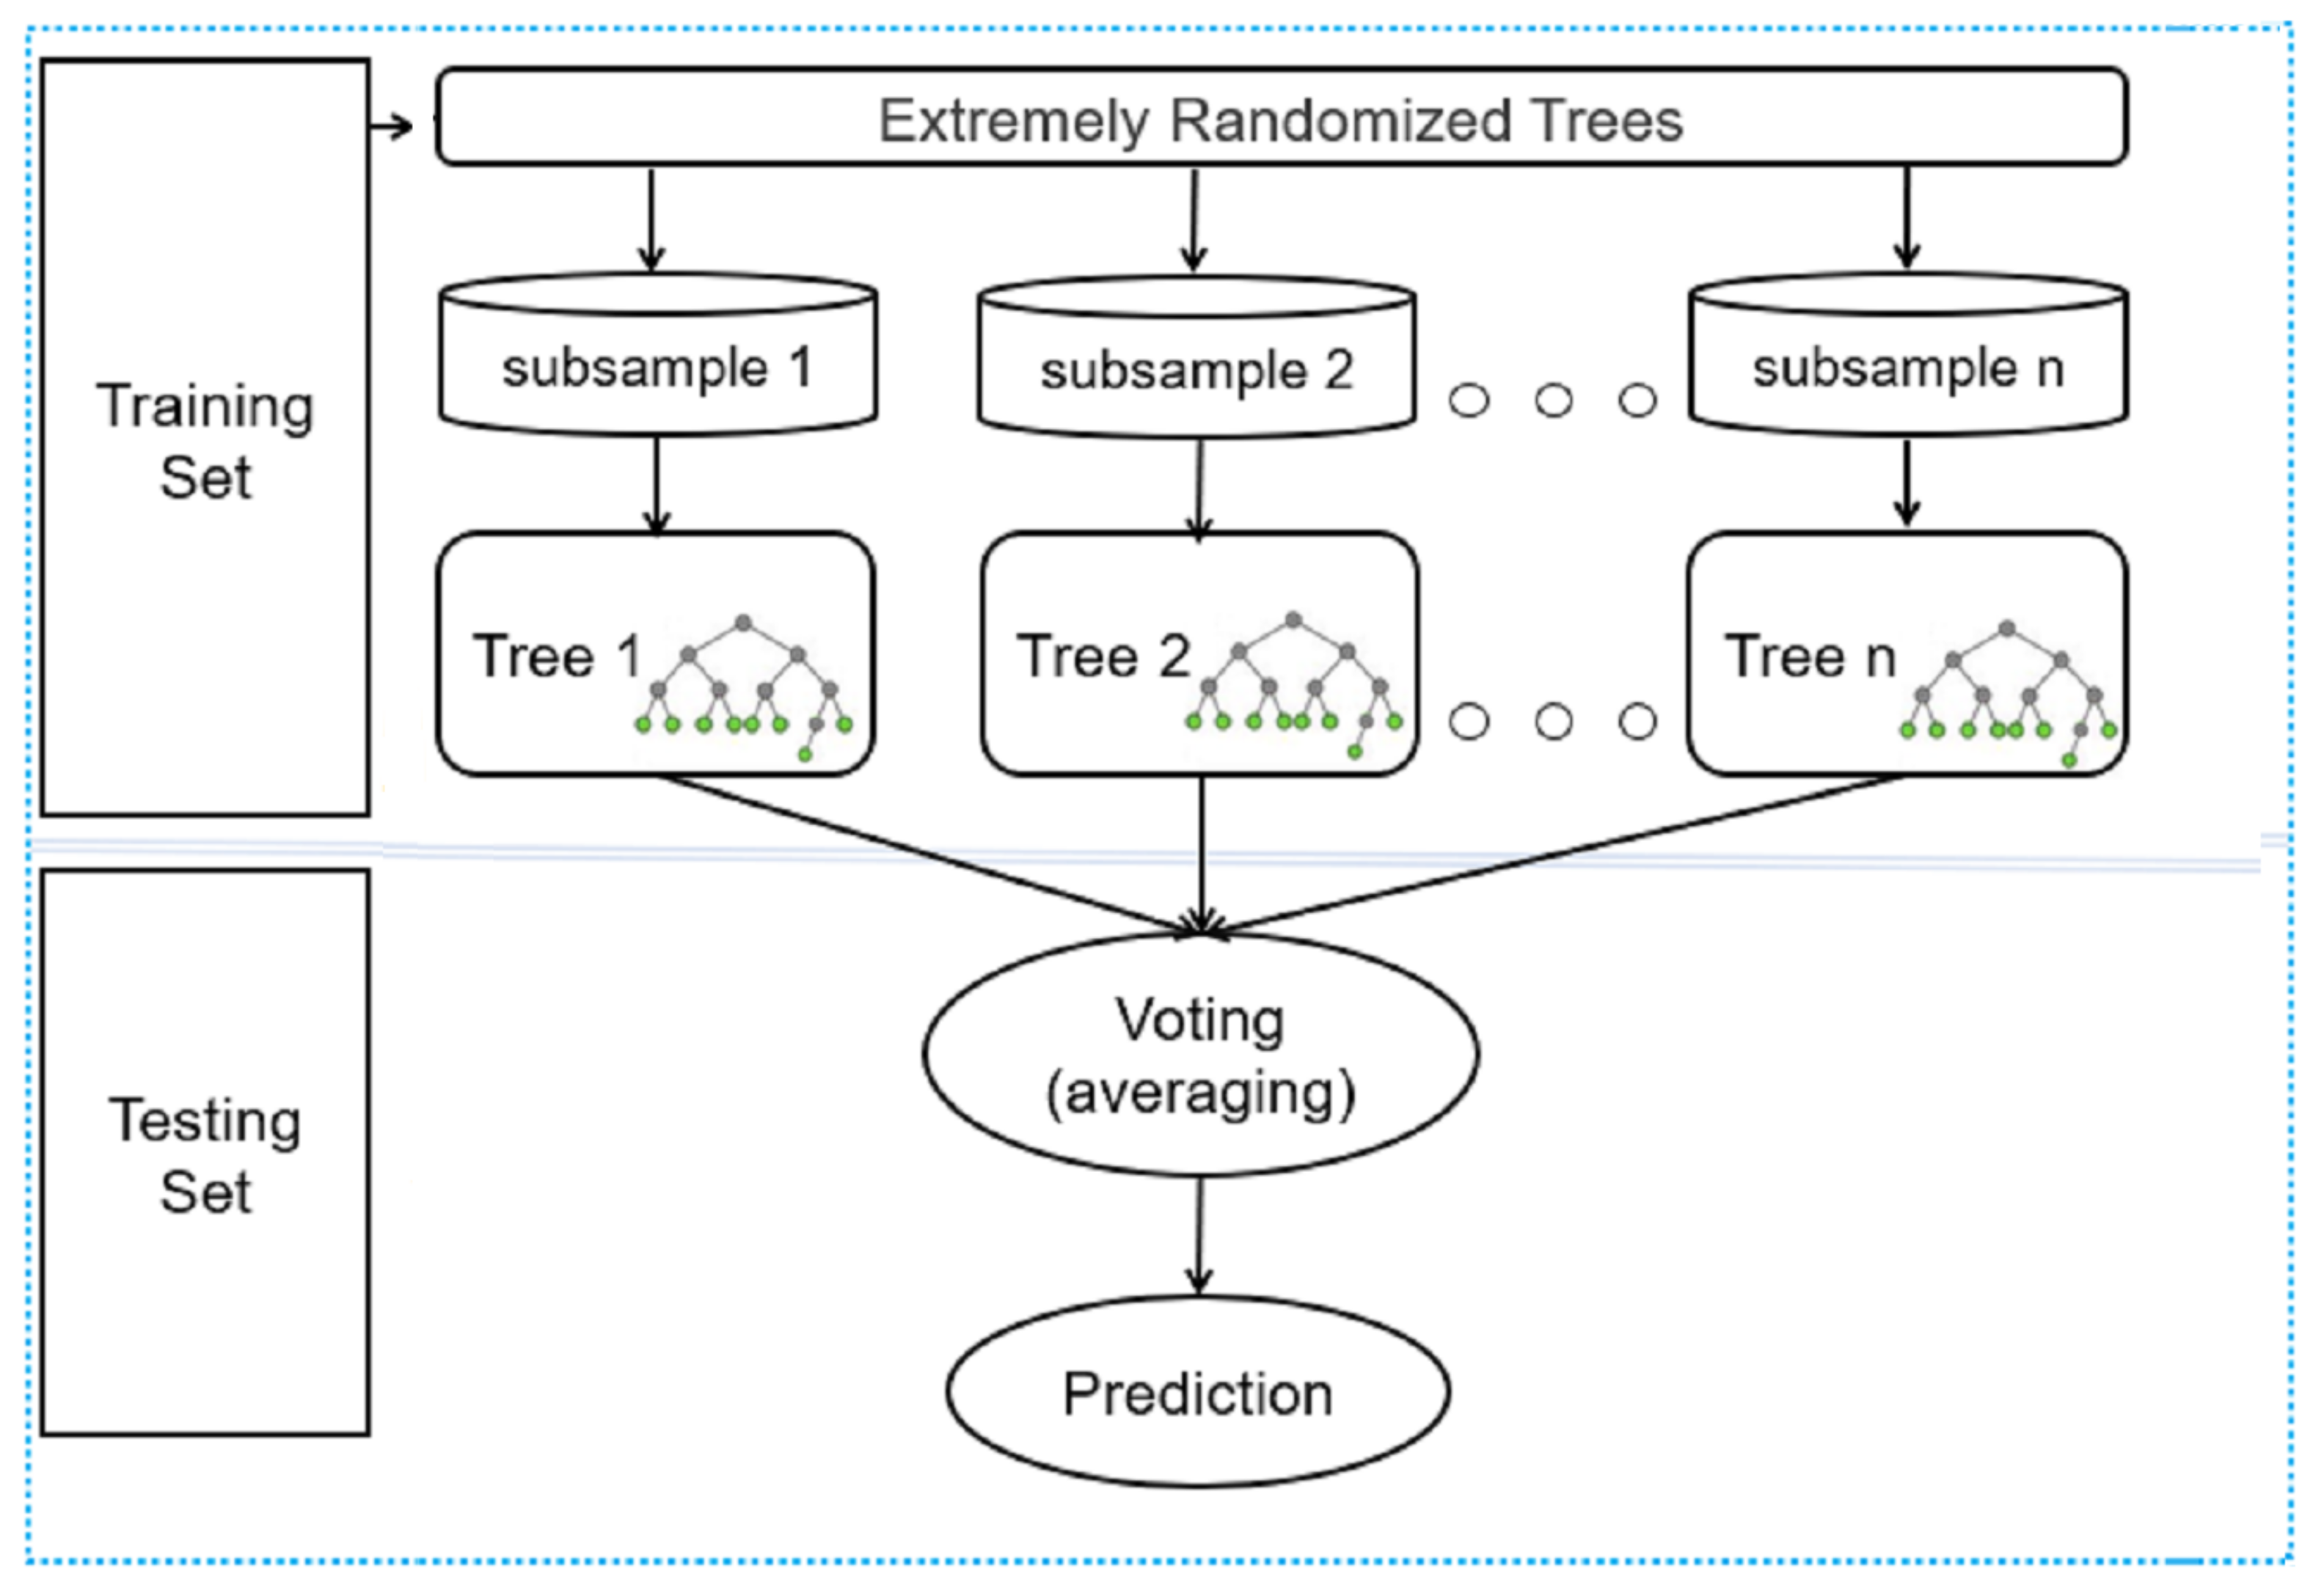
3.7.3. Distributed Random Forest
4. Results
4.1. Tortuosity Classification Results
4.1.1. Results of the Tortuosity Grading of Severity Levels Using J48 Decision Tree Model
4.1.2. Results of the Tortuosity Grading Using Ensemble Rotation Forest Model
4.1.3. Results of the Tortuosity Grading Using Distributed Random Forest Model
4.2. From ‘AV Classification’ to RVM Data Set
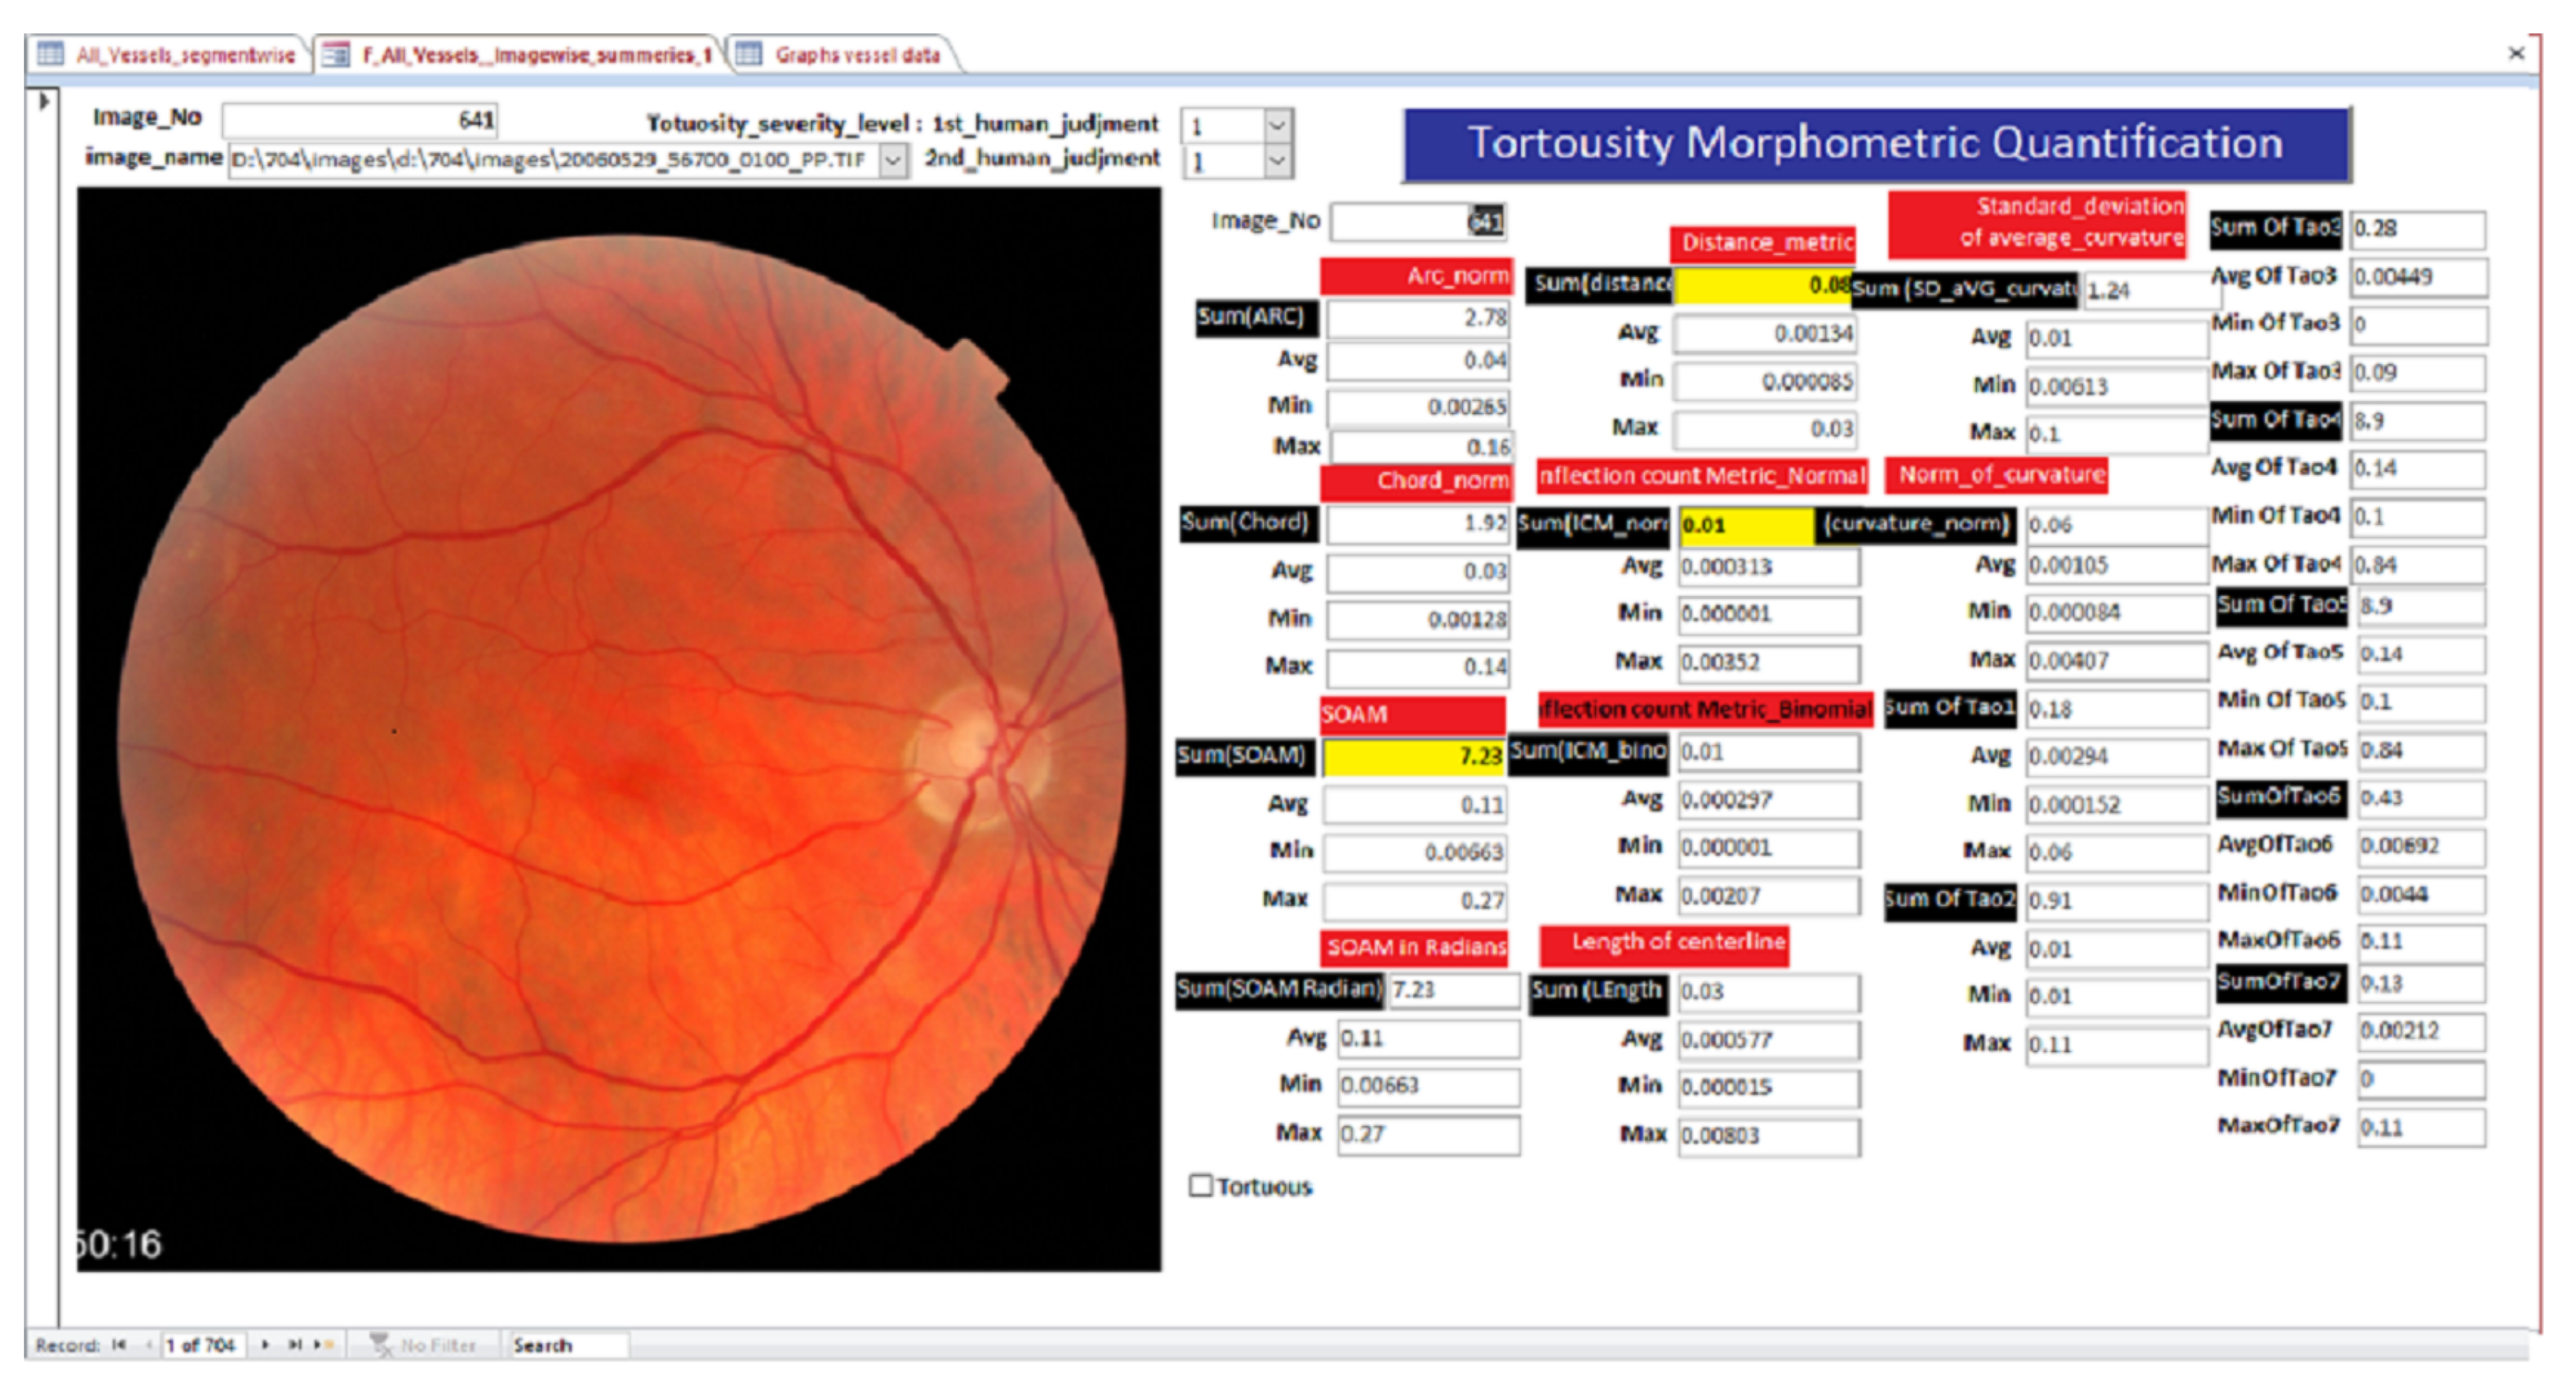
Visualization of the Tortuosity Classification Results
5. Discussion
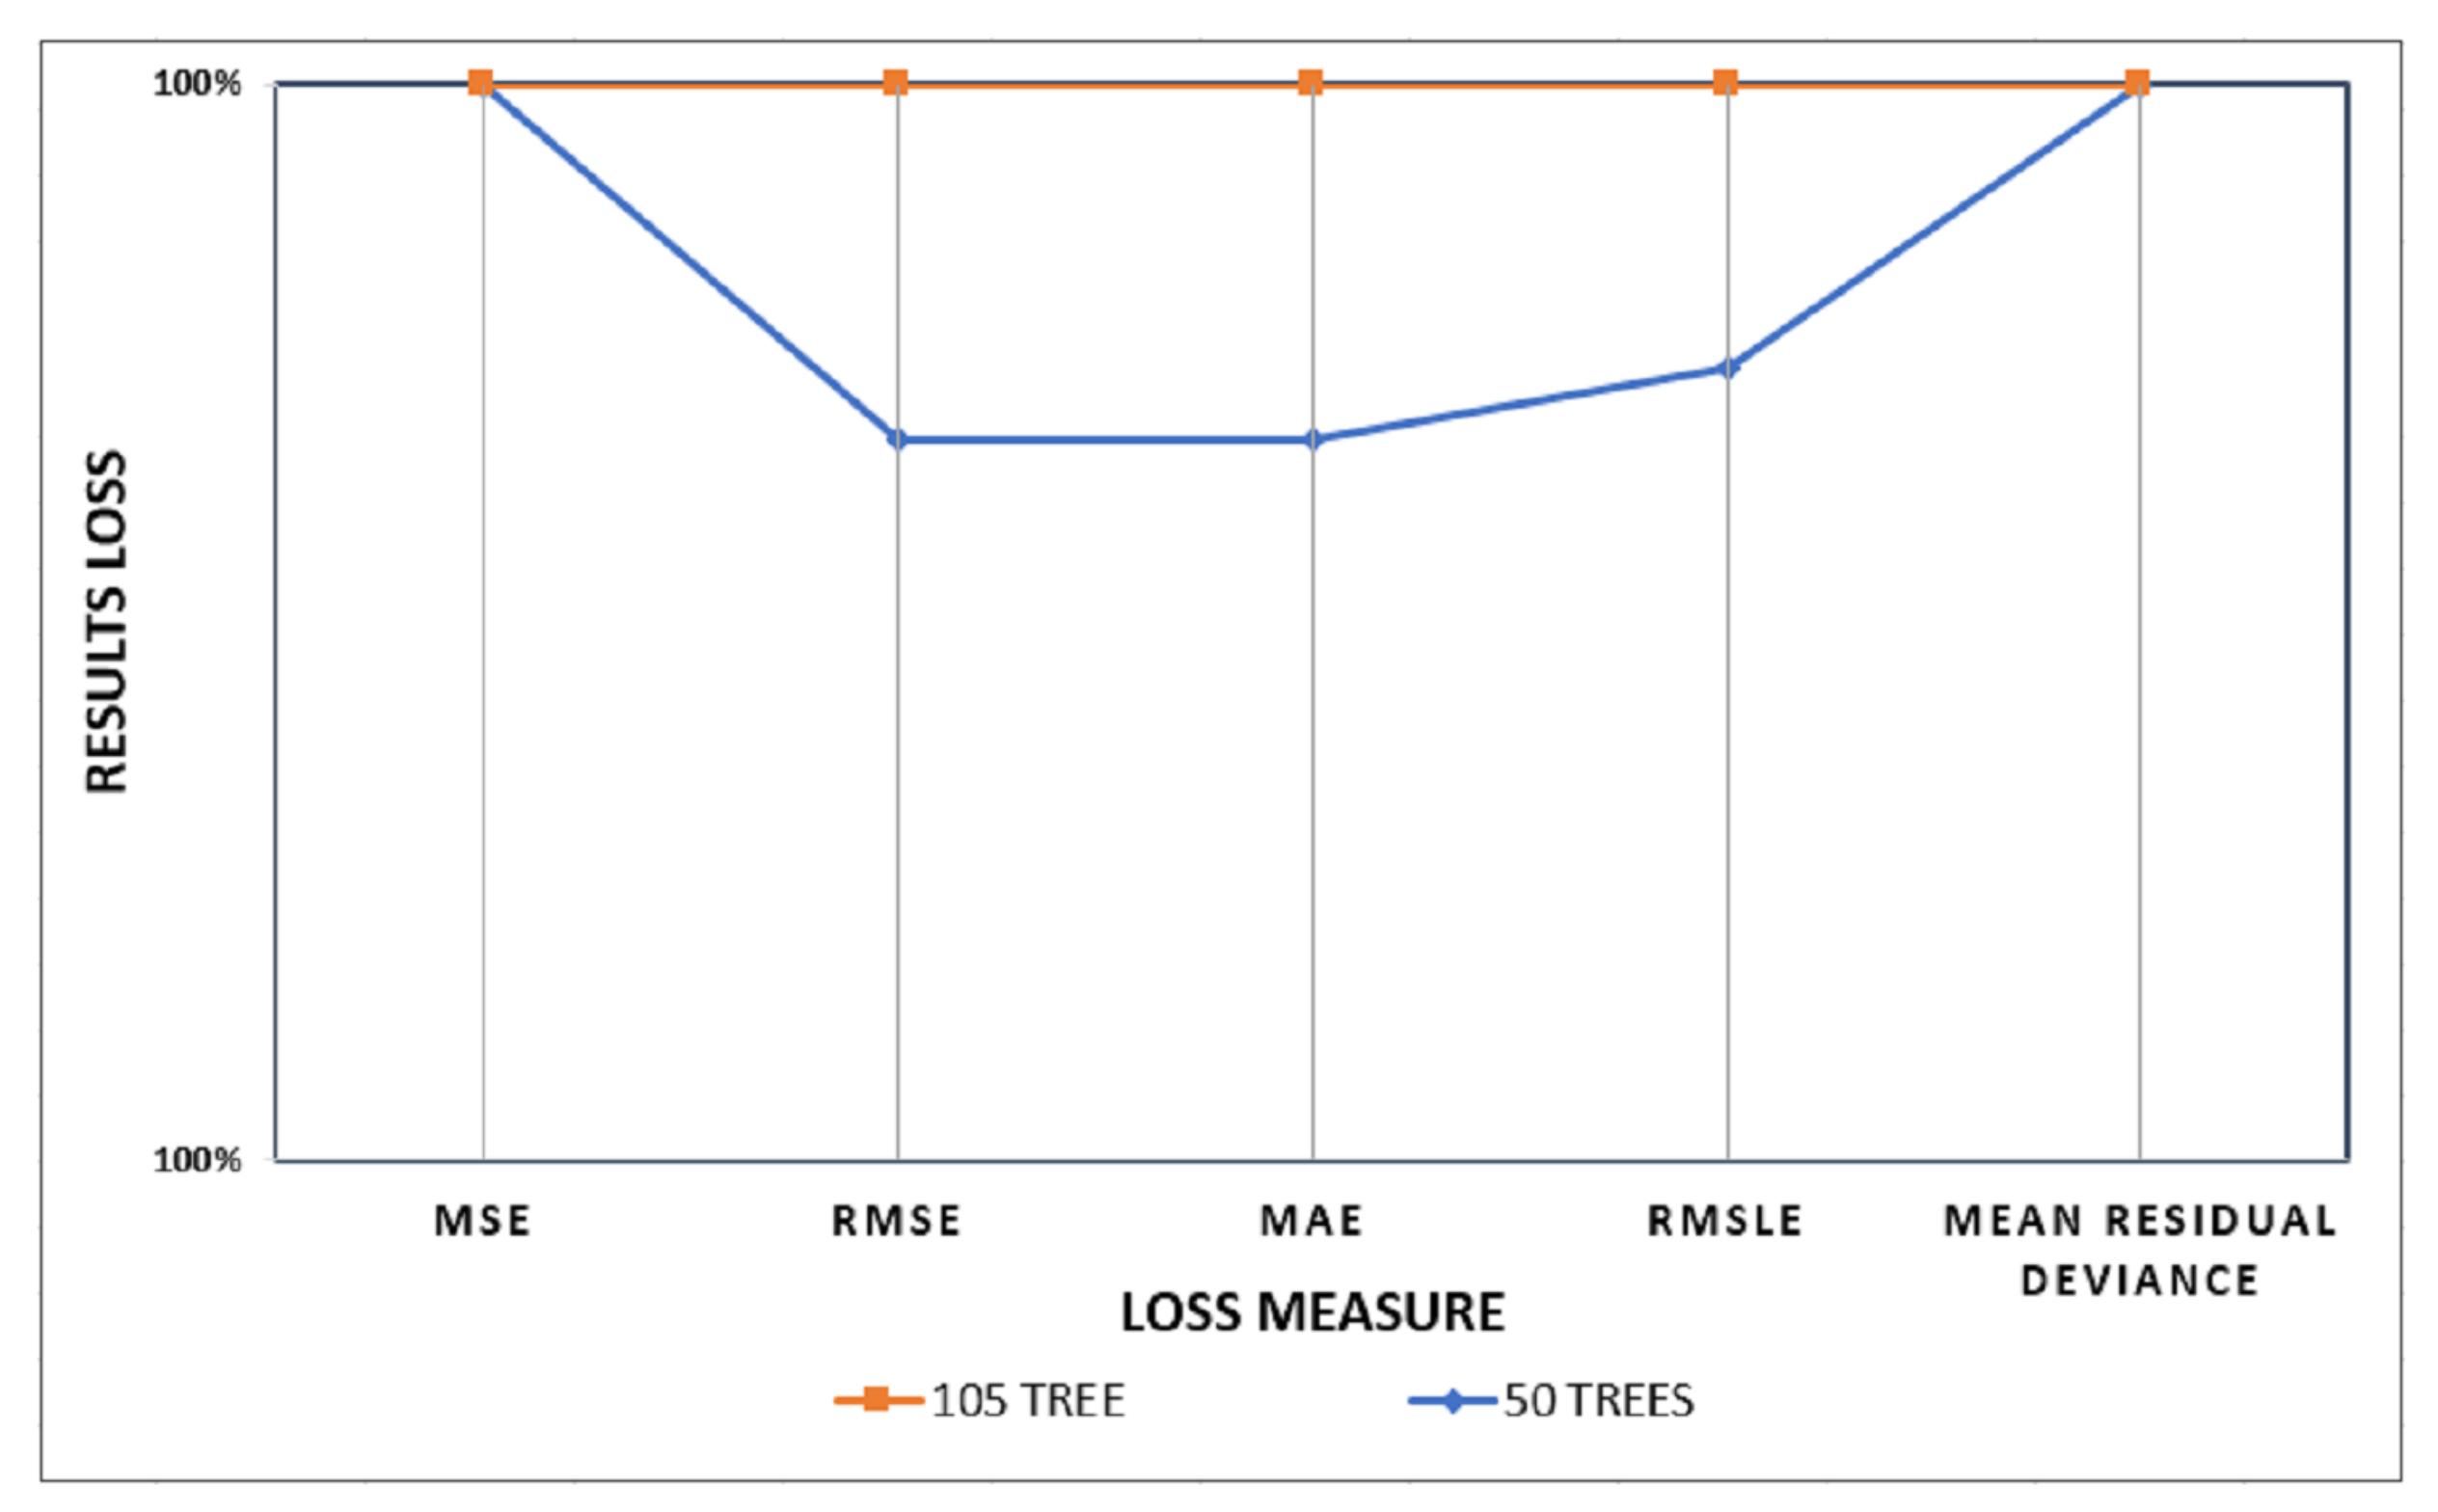
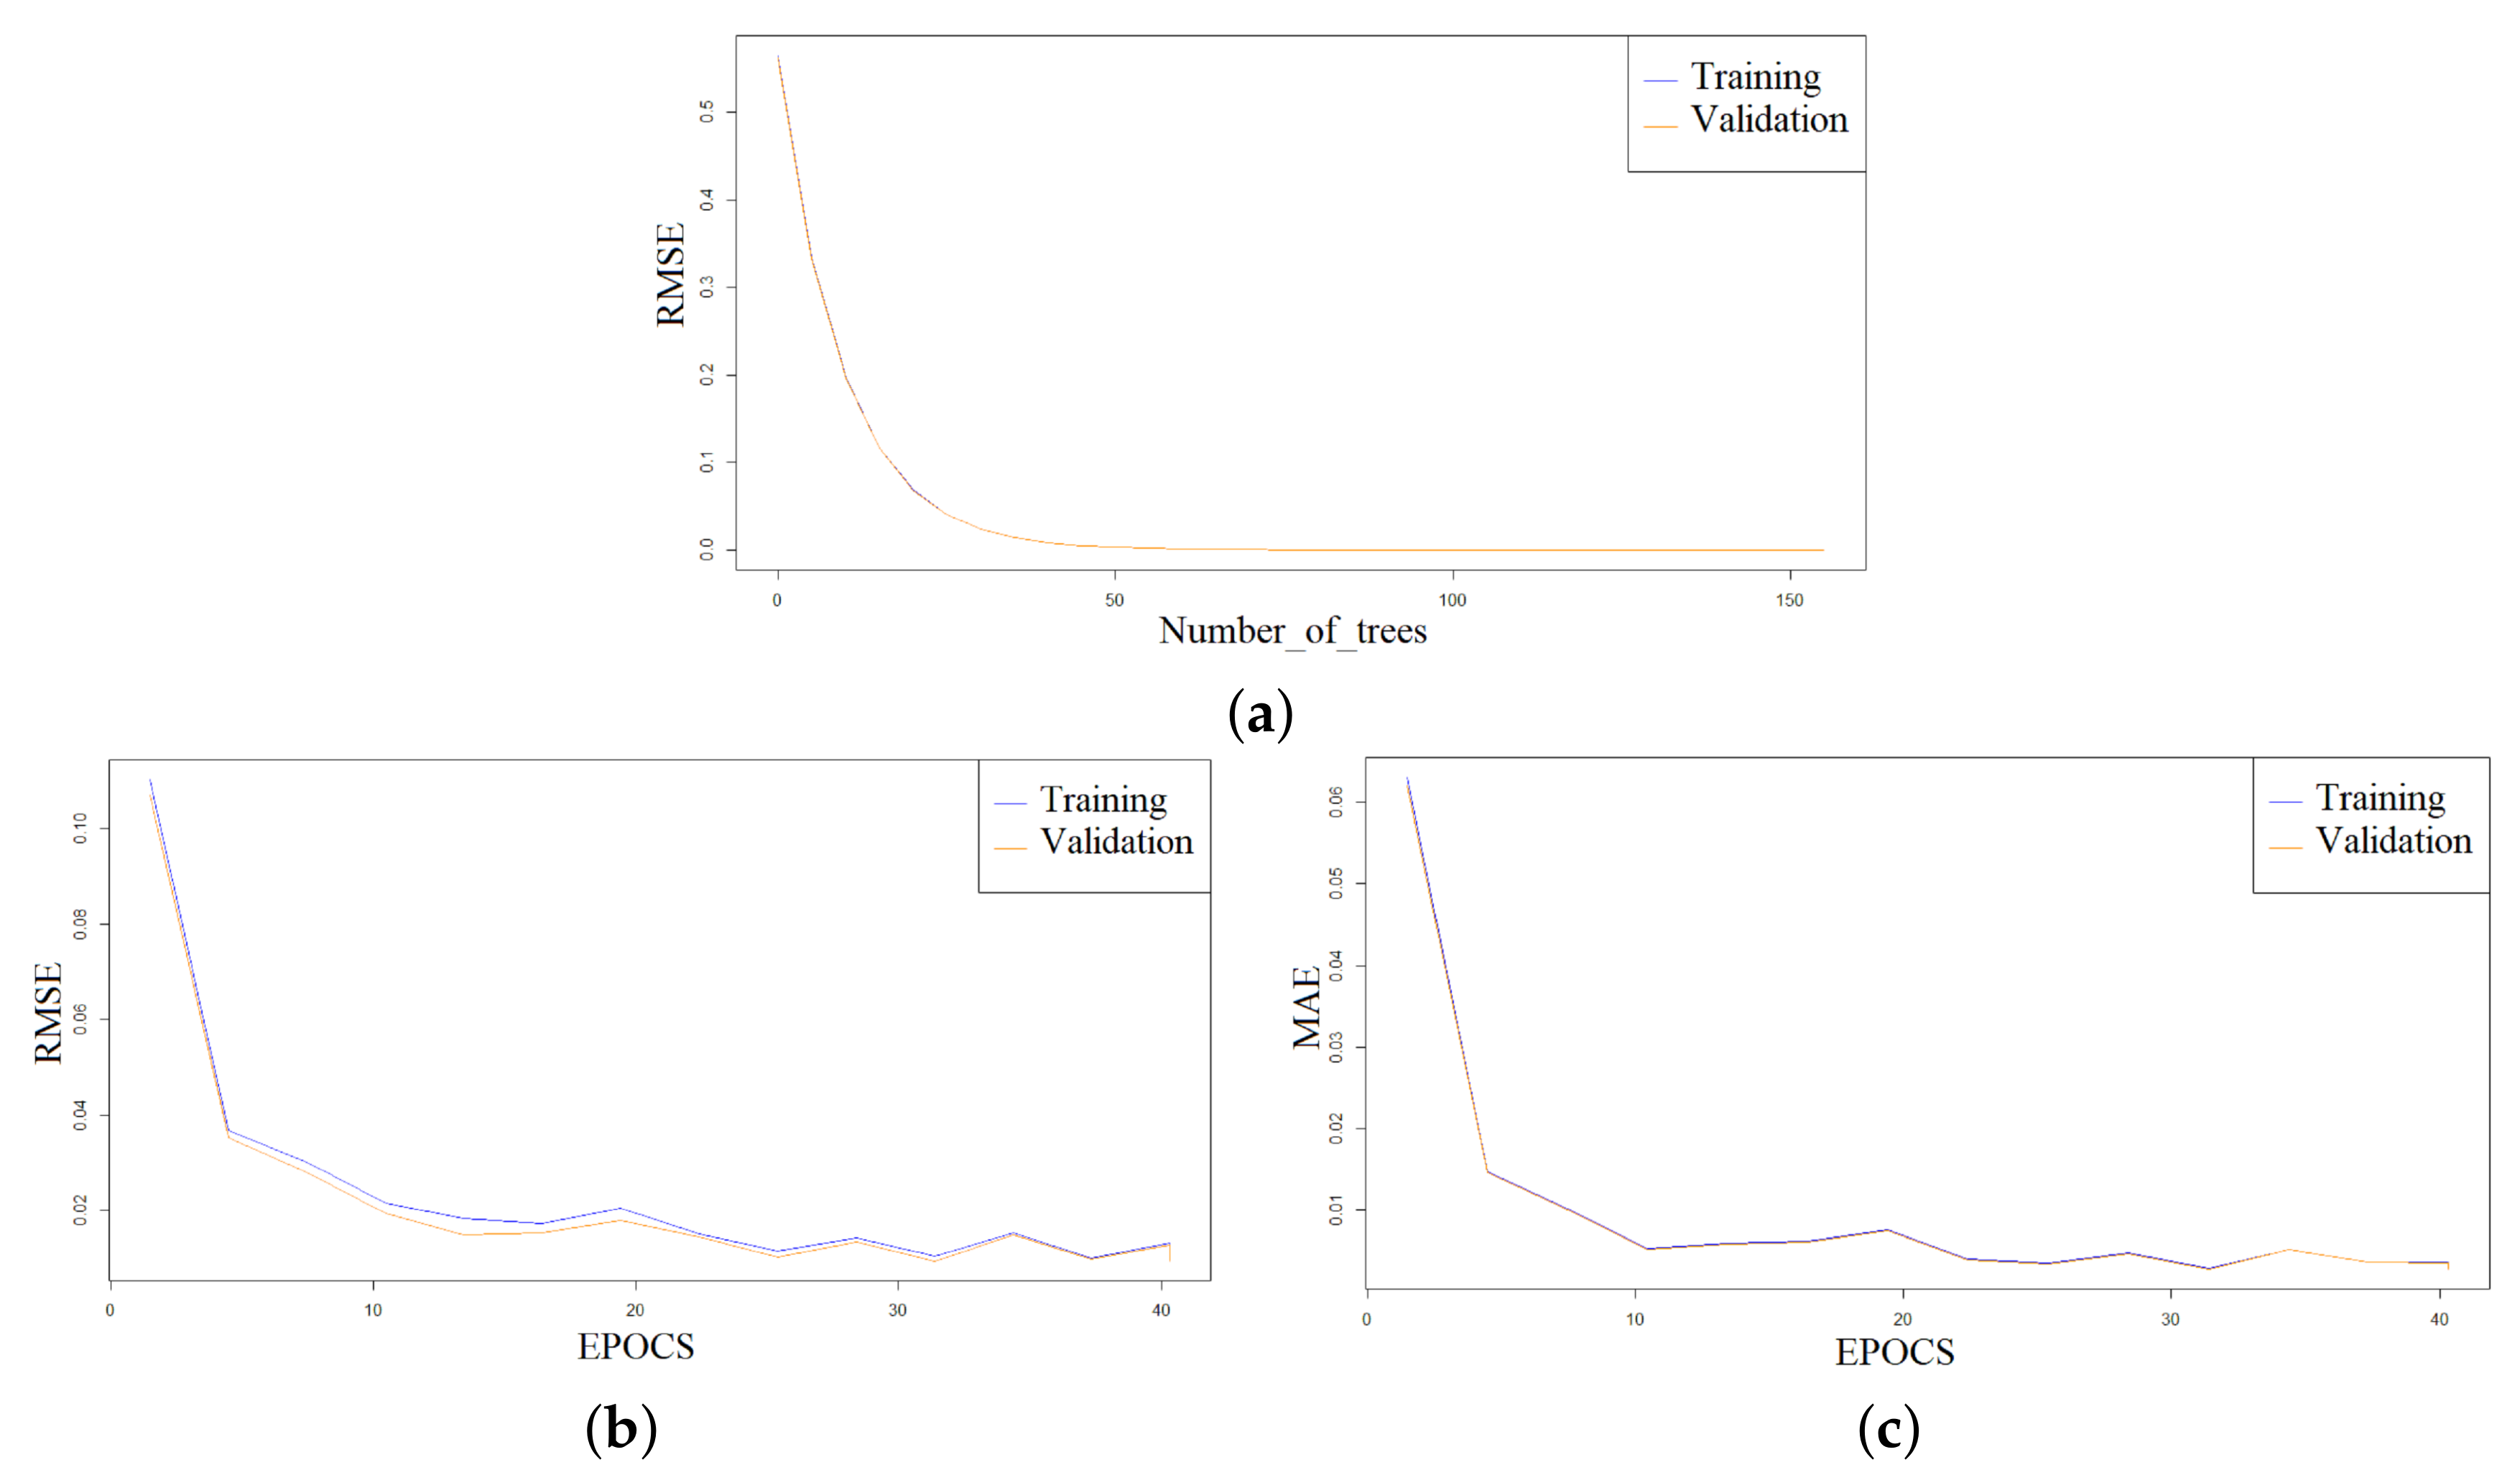
5.1. The Increase in the Number of Trees Impact
5.2. Comparison with the Other Methods
6. Conclusions
Author Contributions
Funding
Institutional Review Board Statement
Informed Consent Statement
Data Availability Statement
Acknowledgments
Conflicts of Interest
Abbreviations
| CRVO | Central retinal vein occlusion |
| ROP | Retinopathy of prematurity |
| AVR | Arteriovenous ratio |
| RVM | Retinal vessel morphometry |
| VTI | Vessel tortuosity index |
| TI | Tortuosity index |
| TD | Tortuosity density |
| SOAM | Sum of angles metric |
| ICM | Inflection count metric |
| DM | Distance metric |
| DF | Distance factor |
| RM | Resampling method |
| CTC | Consolidated tree construction |
| DRF | Distributed random forest |
| RMSE | Root-mean-square error |
| MSE | Mean square error |
| MAE | Mean absolute error |
| RMSLE | Root mean squared logarithmic error |
| Se | Sensitivity |
| PR | Precision |
| TPR | True positive rate |
| FPR | False positive rate |
| RAKMHSU | RAK Medical and Health Sciences University |
References
- Dictionary, O.E.; Idioms, E.U. Oxford. Dictionary-Tortuous. 1989. Available online: https://www.oxfordlearnersdictionaries.com/definition/english/tortuous?q=Tortuous (accessed on 19 May 2022).
- Dogra, M.; Dogra, M. Congenital tortuous retinal vessels. Indian J. Ophthalmol. 2019, 67, 277. [Google Scholar] [CrossRef] [PubMed]
- Sasongko, M.; Wong, T.; Nguyen, T.; Cheung, C.; Shaw, J.; Wang, J. Retinal vascular tortuosity in persons with diabetes and diabetic retinopathy. Diabetologia 2011, 54, 2409–2416. [Google Scholar] [CrossRef] [PubMed]
- Lee, H.; Lee, M.; Chung, H.; Kim, H.C. Quantification of retinal vessel tortuosity in diabetic retinopathy using optical coherence. Retina 2018, 8, 976–985. [Google Scholar] [CrossRef] [PubMed]
- Cavallari, M.; Stamile, C.; Umeton, R.; Calimeri, F.; Orzi, F. Novel method for automated analysis of retinal images: Results in subjects with hypertensive retinopathy and CADASIL. Biomed Res. Int. 2015, 2015, 752957. [Google Scholar] [CrossRef]
- Abramoff, M.D.; Garvin, M.K.; Sonka, M. Retinal imaging and image analysis. IEEE Rev. Biomed. Eng. 2010, 3, 169–208. [Google Scholar] [CrossRef]
- Cheung, C.Y.; Tay, W.T.; Mitchell, P.; Wang, J.J.; Hsu, W.; Lee, M.L.; Lau, Q.P.; Zhu, A.L.; Klein, R.; Saw, S.M.; et al. Quantitative and qualitative retinal microvascular characteristics and blood pressure. J. Hypertens. 2011, 29, 1380–1391. [Google Scholar] [CrossRef]
- Yang, M.B. A pilot study using “roptool” to quantify plus disease in retinopathy of prematurity. J. Am. Assoc. Pediatr. Ophthalmol. Strabismus (JAAPOS) 2007, 11, 630–631. [Google Scholar] [CrossRef]
- Cheung, C.Y.; Ikram, M.K.; Klein, R.; Wong, T.Y. The Clinical Implications of Recent Studies on the Structure and Function of the Retinal Microvasculature in Diabetes. Diabetologia 2015, 58. Available online: https://imagebank.asrs.org/file/5153/congenital-venous-tortuosity-od (accessed on 10 April 2022). [CrossRef]
- Abdalla, M.; Hunter, A.; Al-Diri, B. Quantifying retinal blood vessels’ tortuosity. In Proceedings of the 2015 Science and Information Conference (SAI), London, UK, 28–30 July 2015; IEEE: Piscataway, NJ, USA, 2015; pp. 687–693. [Google Scholar]
- Abbasi, U.G.; Akram, M.U. Classification of blood vessels as arteries and veins for diagnosis of hypertensive retinopathy. In Proceedings of the 2014 10th International Computer Engineering Conference (ICENCO), Cairo, Egypt, 29–30 December 2014; IEEE: Piscataway, NJ, USA, 2014; pp. 5–9. [Google Scholar]
- Akbar, S.; Akram, M.U.; Sharif, M.; Tariq, A.; Ullah Yasin, U. Arteriovenous ratio and papilledema based hybrid decision support system for detection and grading of hypertensive retinopathy. Comput. Methods Programs Biomed. 2018, 154, 123–141. [Google Scholar] [CrossRef]
- Badawi, S.A.; Fraz, M.M.; Shehzad, M.; Mahmood, I.; Javed, S.; Mosalam, E.; Nileshwar, A.K. Detection and Grading of Hypertensive Retinopathy Using Vessels Tortuosity and Arteriovenous Ratio. J. Digit. Imaging 2022, 35, 281–301. [Google Scholar] [CrossRef]
- Zaki, W.M.D.W.; Zulkifley, M.A.; Hussain, A.; Halim, W.H.W.; Mustafa, N.B.A.; Ting, L.S. Diabetic retinopathy assessment: Towards an automated system. Biomed. Signal Process. Control. 2016, 24, 72–82. [Google Scholar] [CrossRef]
- Sufian Badawi, M.M.F. Segmentation, Classification, and Morphometric Analysis of Retinal Vasculature. Ph.D. Thesis, Department of Computing-SEECS, National University for Sciences and Technology, Islamabad, Pakistan, 2020. [Google Scholar]
- Badawi, S.A.; Fraz, M.M. Optimizing the trainable b-cosfire filter for retinal blood vessel segmentation. PeerJ 2018, 6, e5855. [Google Scholar] [CrossRef] [PubMed]
- Nagpal, D.; Panda, S.N.; Malarvel, M.; Pattanaik, P.A.; Khan, M.Z. A review of diabetic retinopathy: Datasets, approaches, evaluation metrics and future trends. J. King Saud Univ.-Comput. Inf. Sci. 2021. [Google Scholar] [CrossRef]
- Kalitzeos, A.A.; Lip, G.Y.; Heitmar, R. Retinal vessel tortuosity measures and their applications. Exp. Eye Res. 2013, 106, 40–46. [Google Scholar] [CrossRef]
- Lotmar, W.; Freiburghaus, A.; Bracher, D. Measurement of vessel tortuosity on fundus photographs. Albrecht Von Graefes Arch. Klin. Exp. 1979, 211, 49–57. [Google Scholar] [CrossRef]
- Capowski, J.J.; Kylstra, J.A.; Freedman, S.F. A numeric index based on spatial frequency for the tortuosity of retinal vessels and its application to plus disease in retinopathy of prematurity. Retina 1995, 15, 490–500. [Google Scholar] [CrossRef]
- Heneghan, C.; Flynn, J.; O’Keefe, M.; Cahill, M. characterization of changes in blood vessel width and tortuosity in retinopathy of prematurity using image analysis. Med. Image Anal. 2002, 6, 407–429. [Google Scholar] [CrossRef]
- Gelman, R.; Jiang, L.; Du, Y.E.; Martinez-Perez, M.E.; Flynn, J.T.; Chiang, M.F. Plus disease in retinopathy of prematurity: A pilot study of computer-based and expert diagnosis. J. Am. Assoc. Pediatr. Ophthalmol. Strabismus 2007, 11, 532–540. [Google Scholar] [CrossRef]
- Grisan, E.; Foracchia, M.; Ruggeri, A. A novel method for the automatic grading of retinal vessel tortuosity. IEEE Trans. Med. Imaging 2008, 27, 310–319. [Google Scholar] [CrossRef]
- ElAbbadi, N.K.; AlSaadi, E.H. Automatic Retinal Vessel Tortuosity Measurement. J. Comput. Sci. 2013, 9, 1456–1460. [Google Scholar] [CrossRef] [Green Version]
- Kiely, A.E.; Wallace, D.K.; Freedman, S.F.; Zhao, Z. Computer-assisted measurement of retinal vascular width and tortuosity in retinopathy of prematurity. Arch. Ophthalmol. 2010, 128, 847–852. [Google Scholar] [CrossRef] [PubMed]
- Patwari, M.B.; Manza, R.R.; Rajput, Y.M.; Saswade, M.; Deshpande, N. Automatic detection of retinal venous beading and tortuosity by using image processing techniques. Int. J. Comput. Appl. 2014, 975, 8887. [Google Scholar]
- Chandrinos, K.; Pilu, M.; Fisher, R.; Trahanias, P. Image Processing Techniques for the Quantification of Atherosclerotic Changes; Department of Artificial Intelligence, University of Edinburgh: Edinburgh, UK, 1998. [Google Scholar]
- Hart, W.E.; Goldbaum, M.; Côté, B.; Kube, P.; Nelson, M.R. Measurement and classification of retinal vascular tortuosity. Int. J. Med. Informatics 1999, 53, 239–252. [Google Scholar] [CrossRef]
- Dougherty, G.; Varro, J. A quantitative index for the measurement of the tortuosity of blood vessels. Med. Eng. Phys. 2000, 22, 567–574. [Google Scholar] [CrossRef]
- Iorga, M.; Dougherty, G. Tortuosity as an indicator of the severity of diabetic retinopathy. In Medical Image Processing; Springer: New York, NY, USA, 2011; pp. 269–290. [Google Scholar]
- Oloumi, F.; Rangayyan, R.M.; Ells, A.L. Assessment of vessel tortuosity in retinal images of preterm infants. In Proceedings of the 2014 36th Annual International Conference of the IEEE Engineering in Medicine and Biology Society, Chicago, IL, USA, 26–30 August 2014; IEEE: Piscataway, NJ, USA, 2014; pp. 5410–5413. [Google Scholar]
- Lorthois, S.; Lauwers, F.; Cassot, F. Tortuosity and other vessel attributes for arterioles and venules of the human cerebral cortex. Microvasc. Res. 2014, 91, 99–109. [Google Scholar] [CrossRef] [PubMed]
- Mayrhofer-Reinhartshuber, M.; Cornforth, D.J.; Ahammer, H.; Jelinek, H.F. Multiscale analysis of tortuosity in retinal images using wavelets and fractal methods. Pattern Recognit. Lett. 2015, 68, 132–138. [Google Scholar] [CrossRef]
- Dougherty, G.; Johnson, M.J.; Wiers, M.D. Measurement of retinal vascular tortuosity and its application to retinal pathologies. Medical, Biol. Eng. Comput. 2010, 48, 87–95. [Google Scholar] [CrossRef]
- Onkaew, D.; Turior, R.; Uyyanonvara, B.; Akinori, N.; Sinthanayothin, C. Automatic retinal vessel tortuosity measurement using curvature of improved chain code. In Proceedings of the International Conference on Electrical, Control and Computer Engineering 2011 (InECCE), Kuantan, Malaysia, 21–22 June 2011; IEEE: Piscataway, NJ, USA, 2011; pp. 183–186. [Google Scholar]
- Turior, R.; Onkaew, D.; Uyyanonvara, B.; Chutinantvarodom, P. Quantification and classification of retinal vessel tortuosity. Sci. Asia 2013, 39, 265–277. [Google Scholar] [CrossRef]
- Chakravarty, A.; Sivaswamy, J. A novel approach for quantification of retinal vessel tortuosity using quadratic polynomial decomposition. In Proceedings of the 2013 Indian Conference on Medical Informatics and Telemedicine (ICMIT), Kharagpur, India, 28–30 March 2013; IEEE: Piscataway, NJ, USA, 2013; pp. 7–12. [Google Scholar]
- Wilson, C.M.; Cocker, K.D.; Moseley, M.J.; Paterson, C.; Clay, S.T.; Schulenburg, W.E.; Mills, M.D.; Ells, A.L.; Parker, K.H.; Quinn, G.E.; et al. Computerized analysis of retinal vessel width and tortuosity in premature infants. Investig. Ophthalmol. Vis. Sci. 2008, 49, 3577–3585. [Google Scholar] [CrossRef]
- Pourreza, H.R.; Pourreza, M.; Banaee, T. Simple and efficient method to measure vessel tortuosity. In Proceedings of the ICCKE 2013, Mashhad, Iran, 31 October–1 November 2013; IEEE: Piscataway, NJ, USA, 2013; pp. 219–222. [Google Scholar]
- Narasimhan, K.; Vijayarekha, K. Automated diagnosis of hypertensive retinopathy using fundus images. Res. J. Pharm. Technol. 2015, 8, 1534. [Google Scholar] [CrossRef]
- Mapayi, T.; Tapamo, J.-R.; Viriri, S.; Adio, A. Automatic retinal vessel detection and tortuosity measurement. Image Anal. Stereol. 2016, 35, 117–135. [Google Scholar] [CrossRef]
- Khansari, M.M.; O’Neill, W.; Lim, J.; Shahidi, M. Method for quantitative assessment of retinal vessel tortuosity in optical coherence tomography angiography applied to sickle cell retinopathy. Biomed. Opt. Express 2017, 8, 3796–3806. [Google Scholar] [CrossRef] [PubMed]
- Badawi, S.A.; Fraz, M.M. Multiloss function based deep convolutional neural network for segmentation of retinal vasculature into arterioles and venules. Biomed Res. Int. 2019, 2019, 4747230. [Google Scholar] [CrossRef] [PubMed]
- Azzopardi, G.; Strisciuglio, N.; Vento, M.; Petkov, N. Trainable cosfire filters for vessel delineation with application to retinal images. Med. Image Anal. 2015, 19, 46–57. [Google Scholar] [CrossRef] [PubMed]
- Gonzalez, R.C.; Eddins, S.L.; Woods, R.E. Digital Image Publishing Using MATLAB; Prentice Hall: Hoboken, NJ, USA, 2004. [Google Scholar]
- Bullitt, E.; Gerig, G.; Pizer, S.M.; Lin, W.; Aylward, S.R. Measuring tortuosity of the intracerebral vasculature from MRA images. IEEE Trans. Med. Imaging 2003, 22, 1163–1171. [Google Scholar] [CrossRef]
- Rodriguez, J.J.; Kuncheva, L.I.; Alonso, C.J. Rotation forest: A new classifier ensemble method. IEEE Trans. Pattern Anal. Mach. 2006, 28, 1619–1630. [Google Scholar] [CrossRef]
- Dai, Y.; Khandelwal, M.; Qiu, Y.; Zhou, J.; Monjezi, M.; Yang, P. A hybrid metaheuristic approach using random forest and particle swarm optimization to study and evaluate backbreak in open-pit blasting. Neural Comput. Applic. 2022, 34, 6273–6288. [Google Scholar] [CrossRef]
- Goetz, M.; Weber, C.; Stieltjes, B.; Meinzer, H.P.; Bloecher, J.; Maier-Hein, K. An Extremely randomized trees based brain tumor segmentation. In Proceeding of the BRATS challenge-MICCAI, Boston, MA, USA, 14 September 2014; Volume 405, pp. 6–11. [Google Scholar]
- Pérez, J.M.; Muguerza, J.; Arbelaitz, O.; Gurrutxaga, I.; Martín, J.I. Combining multiple class distribution modified subsamples in a single tree. Pattern Recognit. Lett. 2007, 28, 414–422. [Google Scholar] [CrossRef]


| Image | Seg. | 1-A | Arc | Chord | DM | SOAM | ICMn | ICMb | SDavc | Navc | 1 | 2 | 3 | 4 | 5 | 6 | 7 |
|---|---|---|---|---|---|---|---|---|---|---|---|---|---|---|---|---|---|
| No. | No. | 2-V | |||||||||||||||
| 2 | 42 | 2 | 0.12 | 0.09 | 0.0001 | 0.13 | 0.0007 | 0.0008 | 0.01 | 0.0014 | 0.0006 | 0.01 | 0.0003 | 0.12 | 0.1 | 0.005 | 0 |
| 2 | 44 | 2 | 0.18 | 0.14 | 0.0002 | 0.36 | 0.0011 | 0.0009 | 0.01 | 0.0022 | 0.0011 | 0.01 | 0.0001 | 0.12 | 0.1 | 0.005 | 0 |
| 2 | 46 | 2 | 0.06 | 0.04 | 0.0002 | 0.13 | 0.0003 | 0.0002 | 0.01 | 0.0009 | 0.0014 | 0.08 | 0.05 | 0.25 | 0.3 | 0.009 | 0.004 |
| 3 | 2 | 2 | 0.08 | 0.05 | 0.0002 | 0.19 | 0.0002 | 0.0003 | 0.02 | 0.0015 | 0.0011 | 0.01 | 0.0001 | 0.12 | 0.1 | 0.005 | 0 |
| 3 | 4 | 2 | 0.32 | 0.27 | 0.0009 | 0.13 | 0.0024 | 0.0024 | 0.1 | 0.0041 | 0.002 | 0.14 | 0.14 | 0.17 | 0.2 | 0.006 | 0.002 |
| 3 | 5 | 1 | 0.02 | 0.01 | 0.0002 | 0.08 | 0.0001 | 0.0002 | 0.01 | 0.0004 | 0.0009 | 0.01 | 0.0001 | 0.12 | 0.1 | 0.005 | 0 |
| 44 | 117 | 1 | 0.2 | 0.16 | 0.0012 | 0.08 | 0.0008 | 0.0012 | 0.01 | 0.0021 | 0.0017 | 0.26 | 0.26 | 0.28 | 0.3 | 0.01 | 0.005 |
| 44 | 119 | 1 | 0.003 | 0.0073 | 0.03 | 0.01 | 0.0011 | 0.0005 | 0.0059 | 0.0001 | 0.07 | 0.07 | 0.06 | 0.53 | 0.5 | 0.06 | 0.06 |
| 45 | 1 | 1 | 0.1 | 0.07 | 0.0001 | 0.13 | 0.0006 | 0.0006 | 0.01 | 0.0014 | 0.0009 | 0.01 | 0.0003 | 0.12 | 0.1 | 0.005 | 0.004 |
| 45 | 2 | 2 | 0.0078 | 0.0076 | 0.02 | 0.02 | 0.002 | 0.0008 | 0.14 | 0.0017 | 0.02 | 0.04 | 0.02 | 0.32 | 0.3 | 0.01 | 0.01 |
| 45 | 3 | 1 | 0.02 | 0.01 | 0.0011 | 0.25 | 0.0005 | 0.0004 | 0.03 | 0.0011 | 0.0015 | 0.01 | 0.0004 | 0.13 | 0.1 | 0.005 | 0 |
| 45 | 4 | 2 | 0.02 | 0.0079 | 0.0002 | 0.05 | 0 | 0 | 0.02 | 0.0004 | 0.0012 | 0.01 | 0 | 0.11 | 0.1 | 0.005 | 0 |
| Loss Function | 50 Trees | 105 Trees |
|---|---|---|
| MSE | 0.00000863 | |
| RMSE | 0.00293811 | |
| MAE | 0.00276098 | |
| RMSLE | 0.00097426 | |
| Mean-Residual-Deviance | 0.00000863 |
| Model | TPR | FPR | Pr | Se | Fscore | ROC |
|---|---|---|---|---|---|---|
| Decision Tree (J48) | 0.927 | 0.084 | 0.879 | 0.927 | 0.988 | 0.994 |
| Rotation Forest | 0.869 | 0.132 | 0.667 | 0.869 | 0.484 | 0.953 |
| Predicted as → | Normal | Mild | Moderate | Severe |
|---|---|---|---|---|
| Actual ↓ | ||||
| Normal | 2 | 20 | 0 | 0 |
| Mild | 0 | 269 | 0 | 0 |
| Moderate | 0 | 14 | 196 | 0 |
| Severe | 0 | 3 | 0 | 0 |
| Loss Function | J48 Decision Tree | Rotation Forest | DRF 105 Trees Model |
|---|---|---|---|
| RMSE | 0.05 | 0.18 | 0.00000194 |
| MAE | 0.01 | 0.01 | 0.00000182 |
Publisher’s Note: MDPI stays neutral with regard to jurisdictional claims in published maps and institutional affiliations. |
© 2022 by the authors. Licensee MDPI, Basel, Switzerland. This article is an open access article distributed under the terms and conditions of the Creative Commons Attribution (CC BY) license (https://creativecommons.org/licenses/by/4.0/).
Share and Cite
Badawi, S.A.Q.; Takruri, M.; Albadawi, Y.; Khattak, M.A.K.; Nileshwar, A.K.; Mosalam, E. Four Severity Levels for Grading the Tortuosity of a Retinal Fundus Image. J. Imaging 2022, 8, 258. https://doi.org/10.3390/jimaging8100258
Badawi SAQ, Takruri M, Albadawi Y, Khattak MAK, Nileshwar AK, Mosalam E. Four Severity Levels for Grading the Tortuosity of a Retinal Fundus Image. Journal of Imaging. 2022; 8(10):258. https://doi.org/10.3390/jimaging8100258
Chicago/Turabian StyleBadawi, Sufian Abdul Qader, Maen Takruri, Yaman Albadawi, Muazzam A. Khan Khattak, Ajay Kamath Nileshwar, and Emad Mosalam. 2022. "Four Severity Levels for Grading the Tortuosity of a Retinal Fundus Image" Journal of Imaging 8, no. 10: 258. https://doi.org/10.3390/jimaging8100258
APA StyleBadawi, S. A. Q., Takruri, M., Albadawi, Y., Khattak, M. A. K., Nileshwar, A. K., & Mosalam, E. (2022). Four Severity Levels for Grading the Tortuosity of a Retinal Fundus Image. Journal of Imaging, 8(10), 258. https://doi.org/10.3390/jimaging8100258