
Diagnostic Accuracy of Imaging Findings in Pleural Empyema: Systematic Review and Meta-Analysis

 ,
,
Abstract
1. Introduction
2. Materials and Methods
2.1. Eligibility Criteria
- Population: Human patients with empyema as a positive condition and other pleural effusions as a negative condition.
- Index test: Computed tomography.
- Outcome: Diagnostic accuracy measures (e.g., sensitivity, specificity, area under the curve (AUC), diagnostic odds ratio (DOR)). The data is retrievable to calculate a 2 × 2 contingency.
- Time-period: Studies between 01-1980 and 10-2021.
2.2. Information Sources
2.3. Search Strategy
2.4. Selection Process
2.5. Data Collection Process
2.6. Data Items and Data Extraction
2.7. Statistical Analysis and Data Synthesis
3. Results
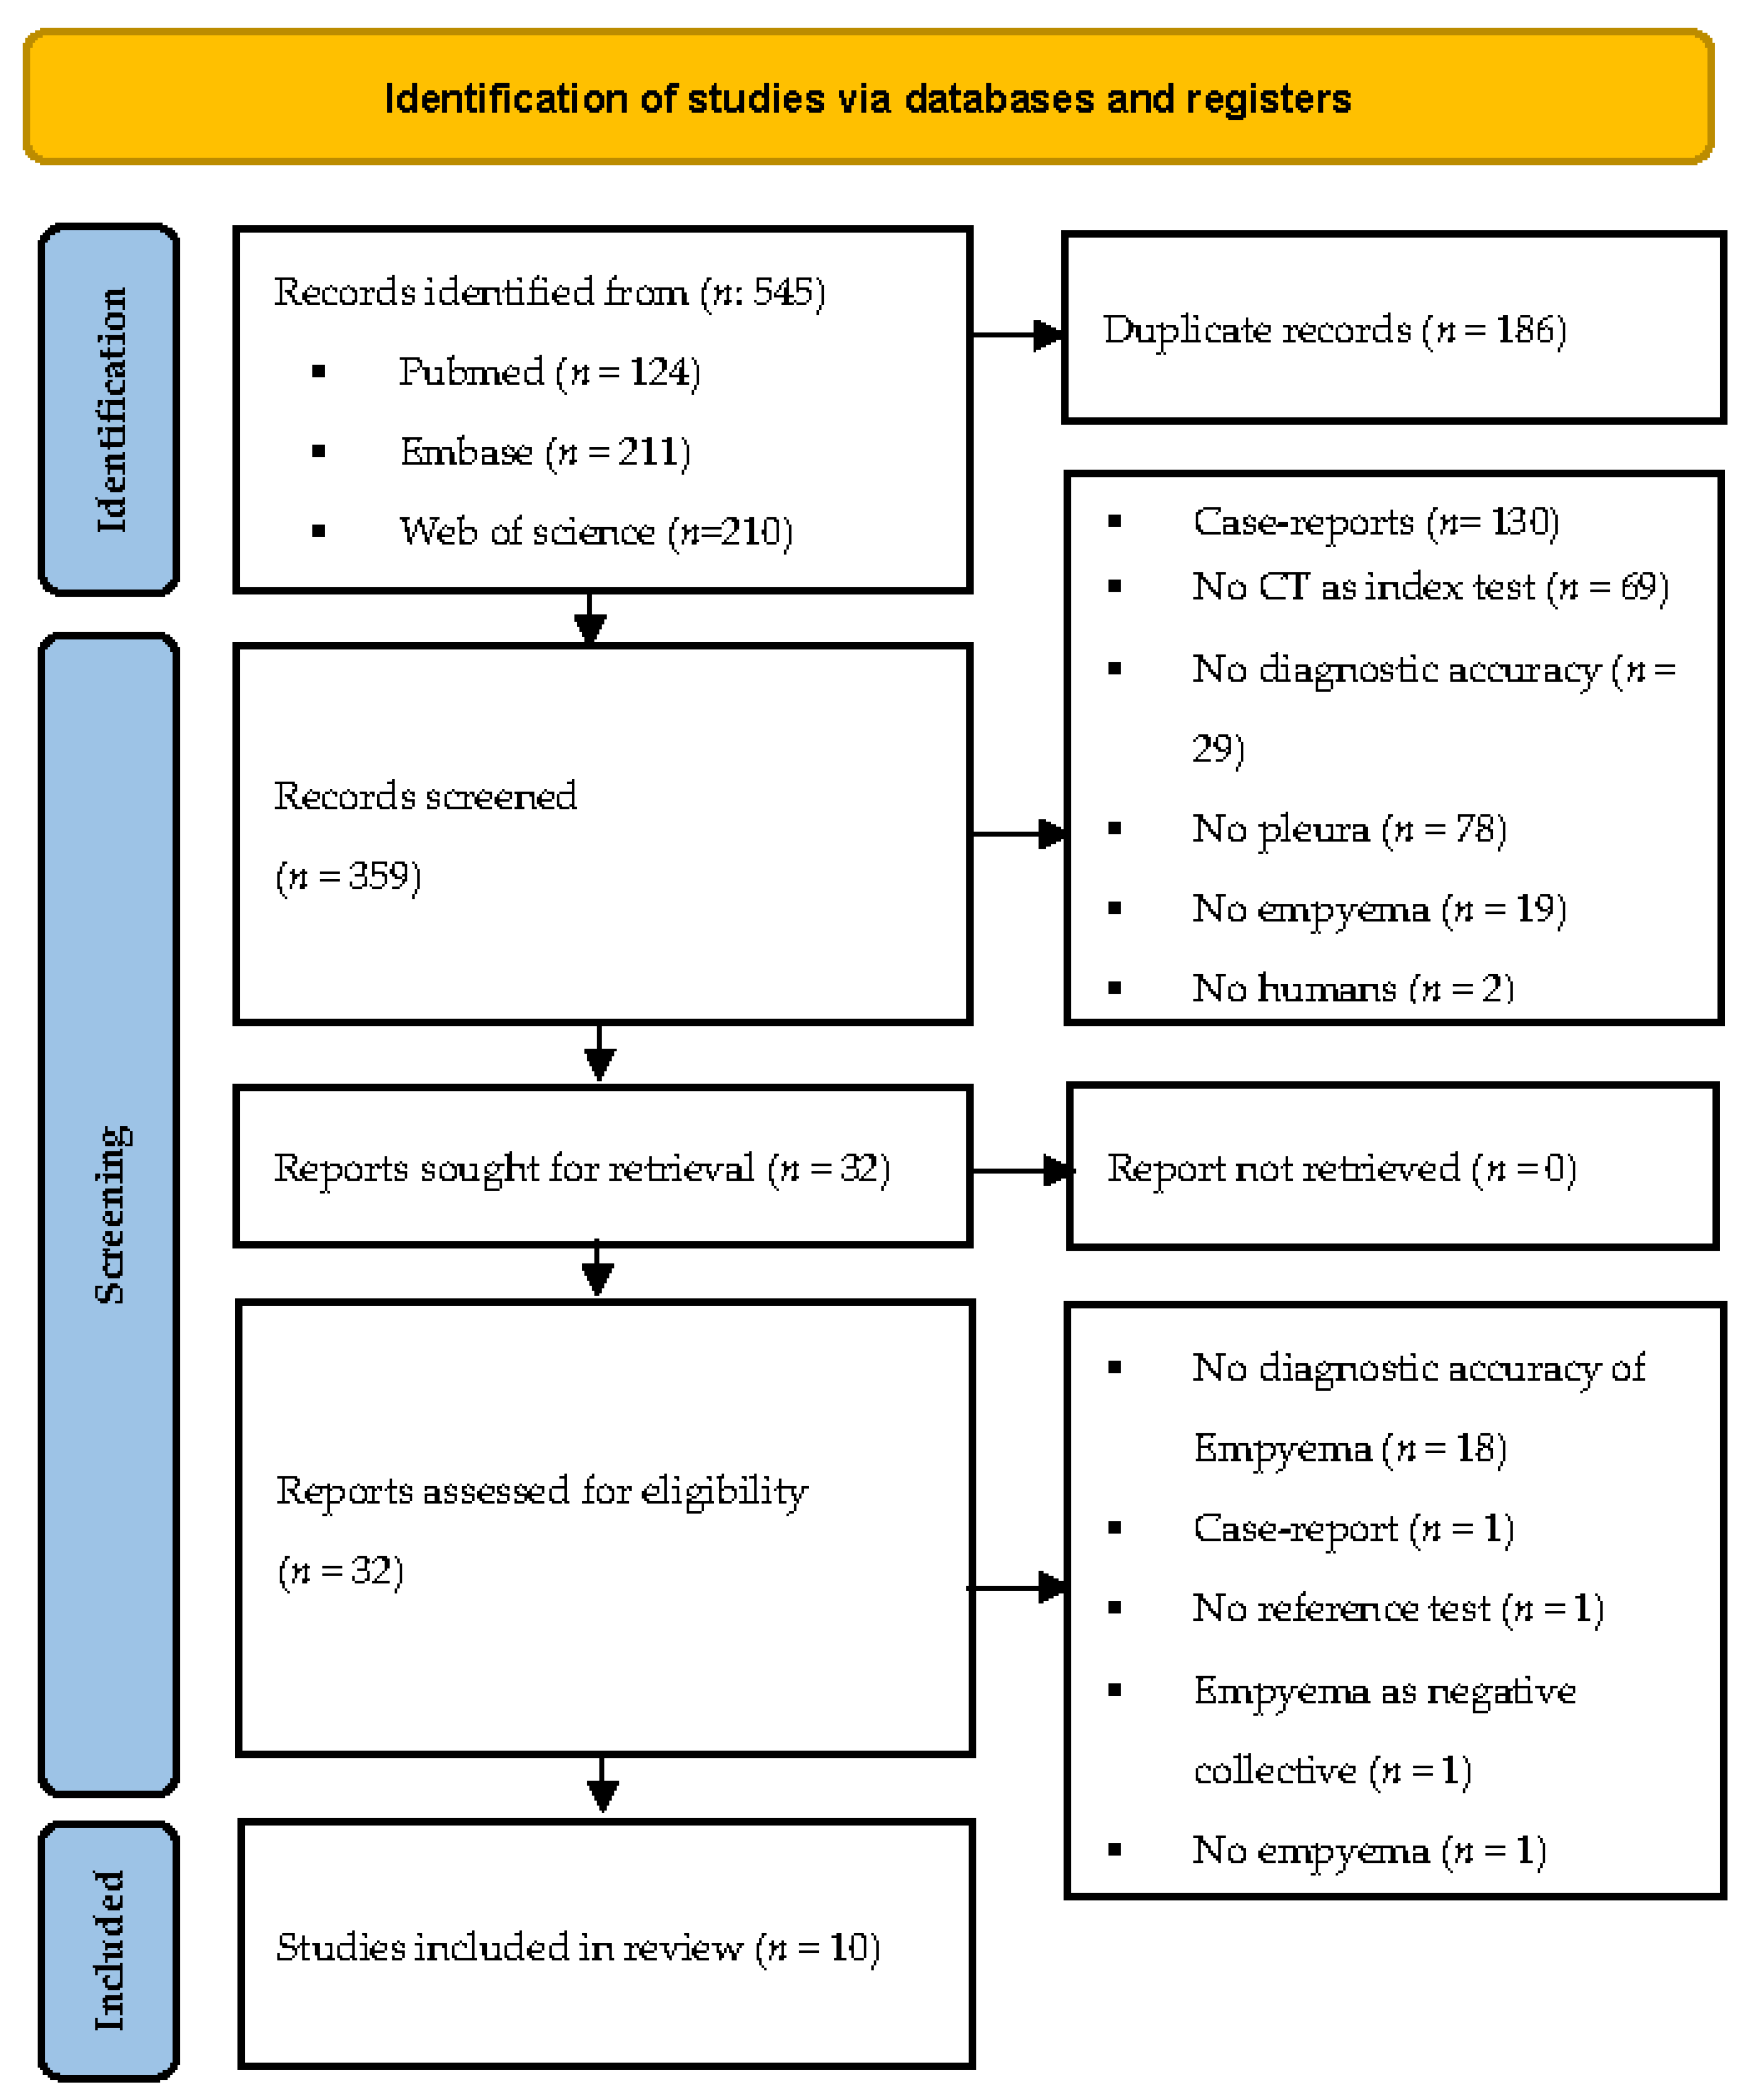
3.1. Study Selection
3.2. Data Extraction/Characteristics of the Included Studies Population
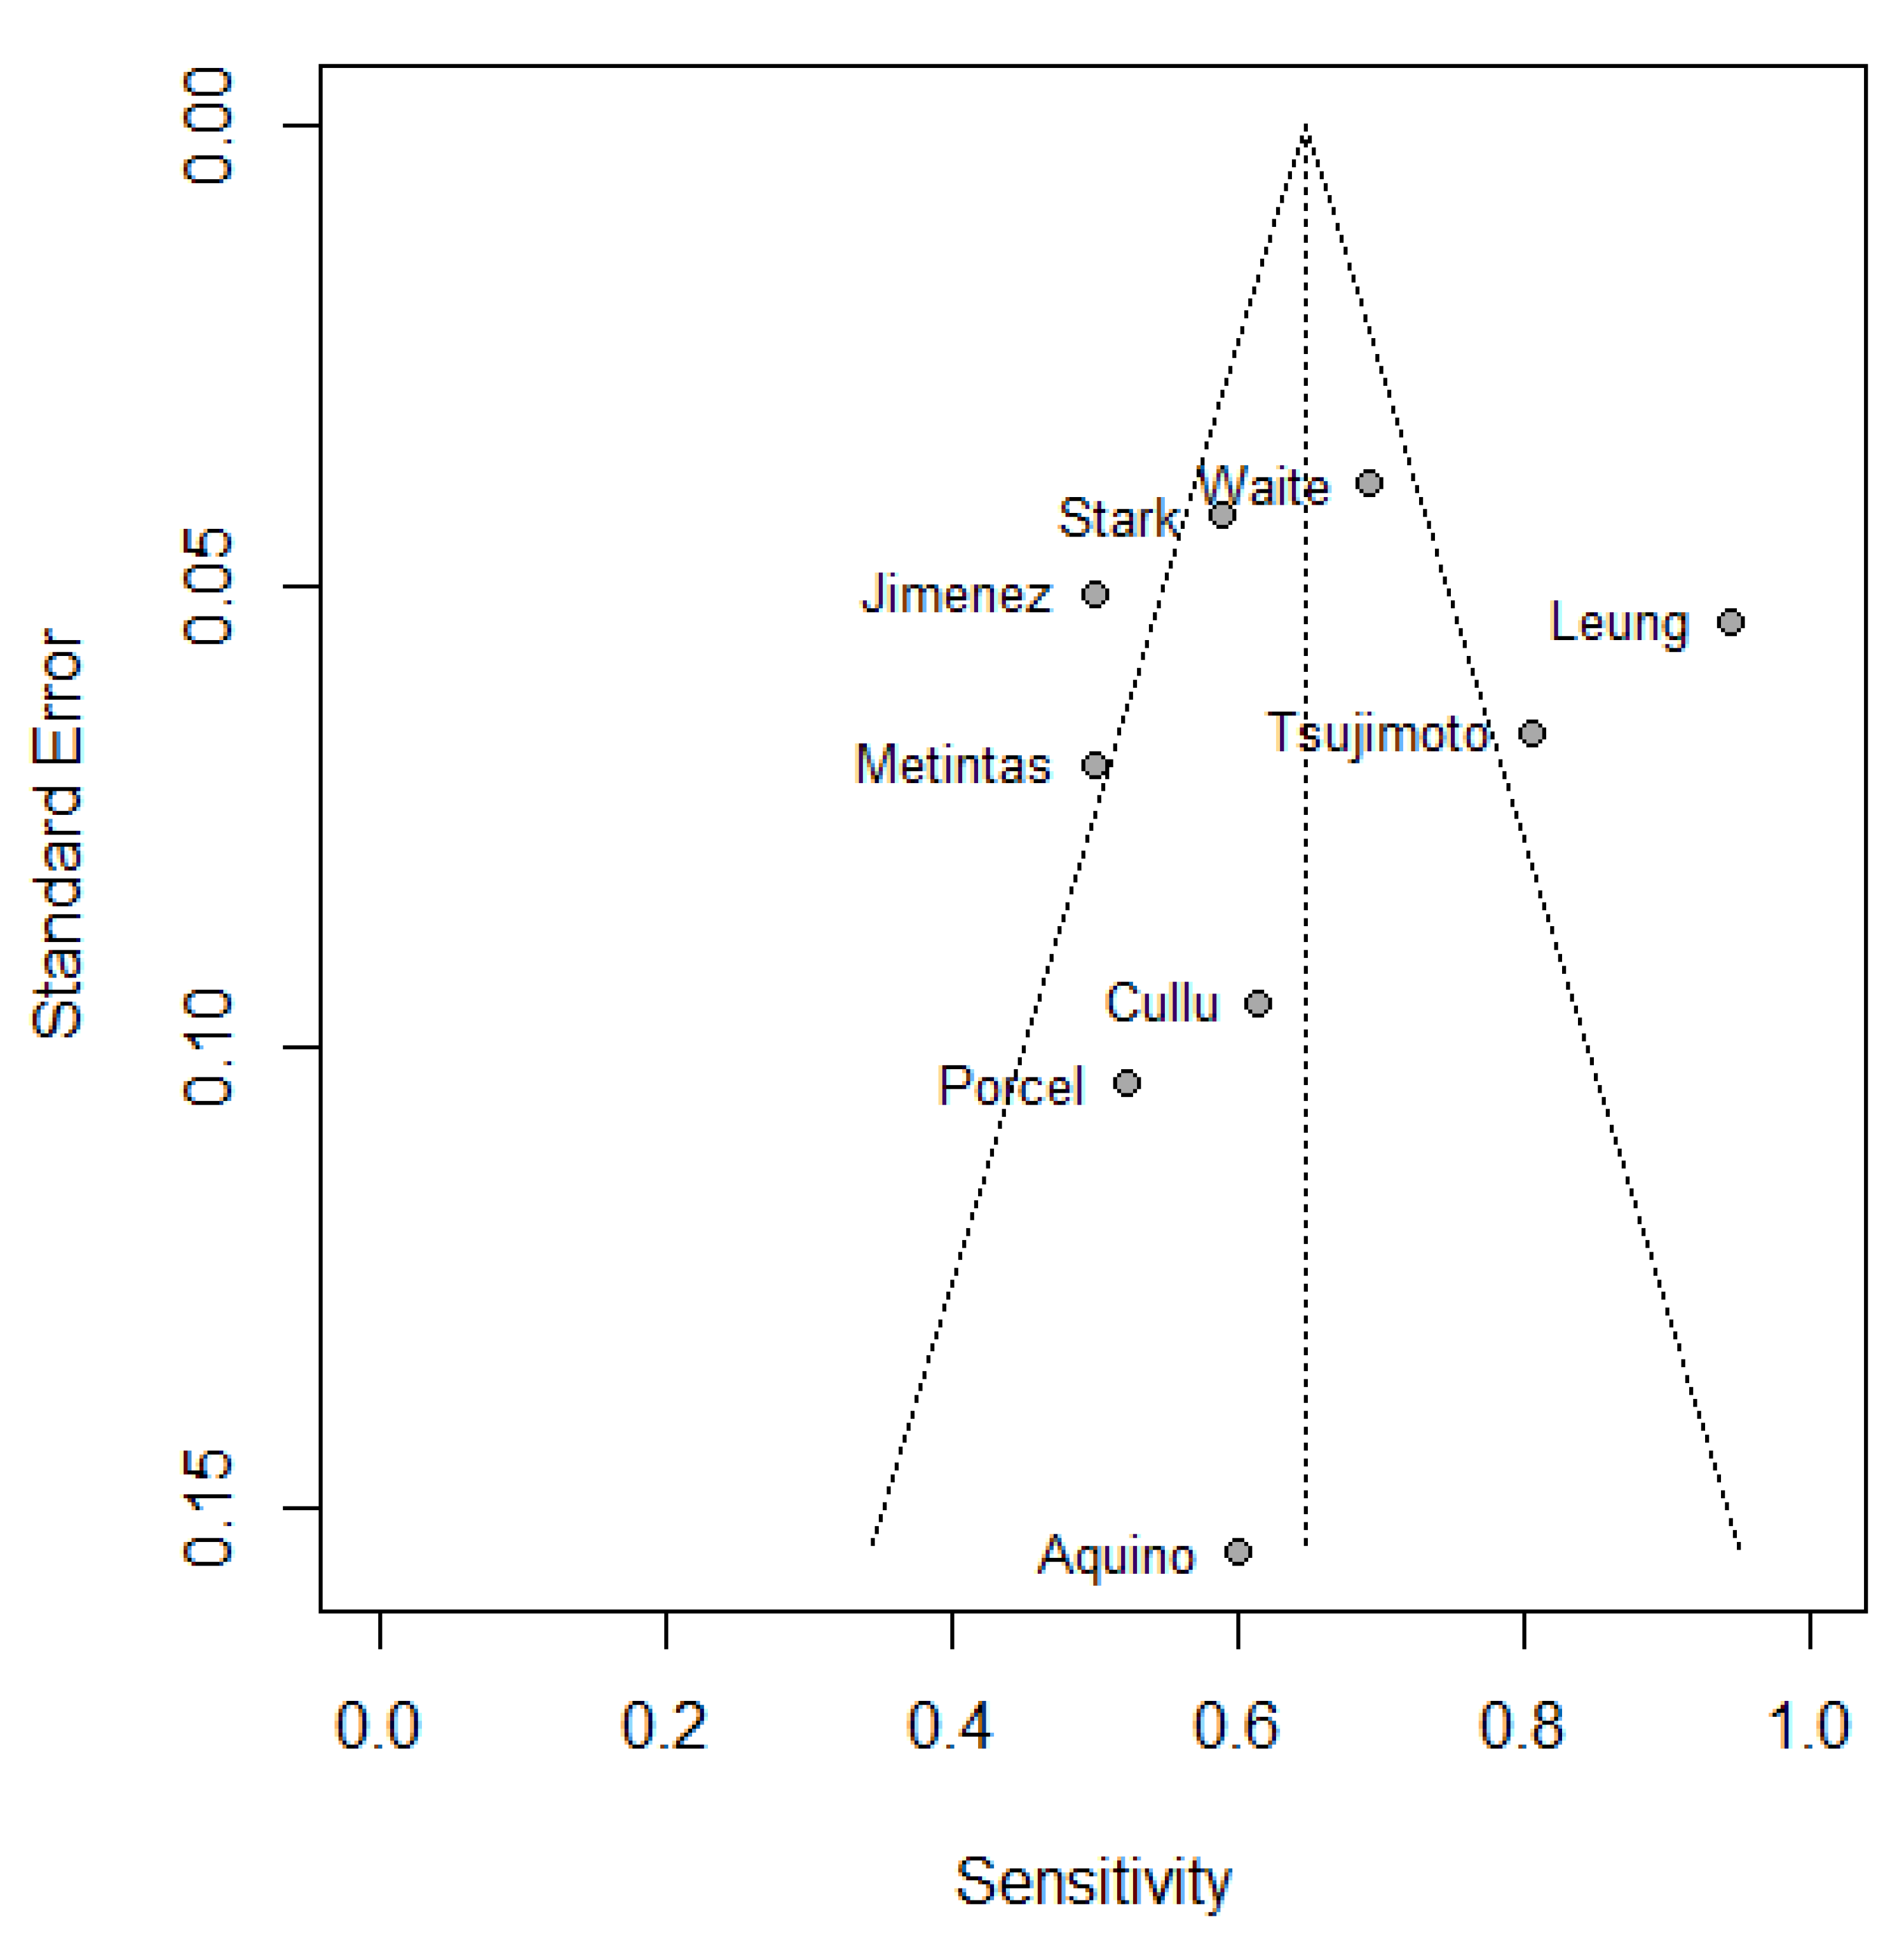
3.3. Risk of Bias
3.4. Categorization of Pleural Findings
3.5. Results of Syntheses
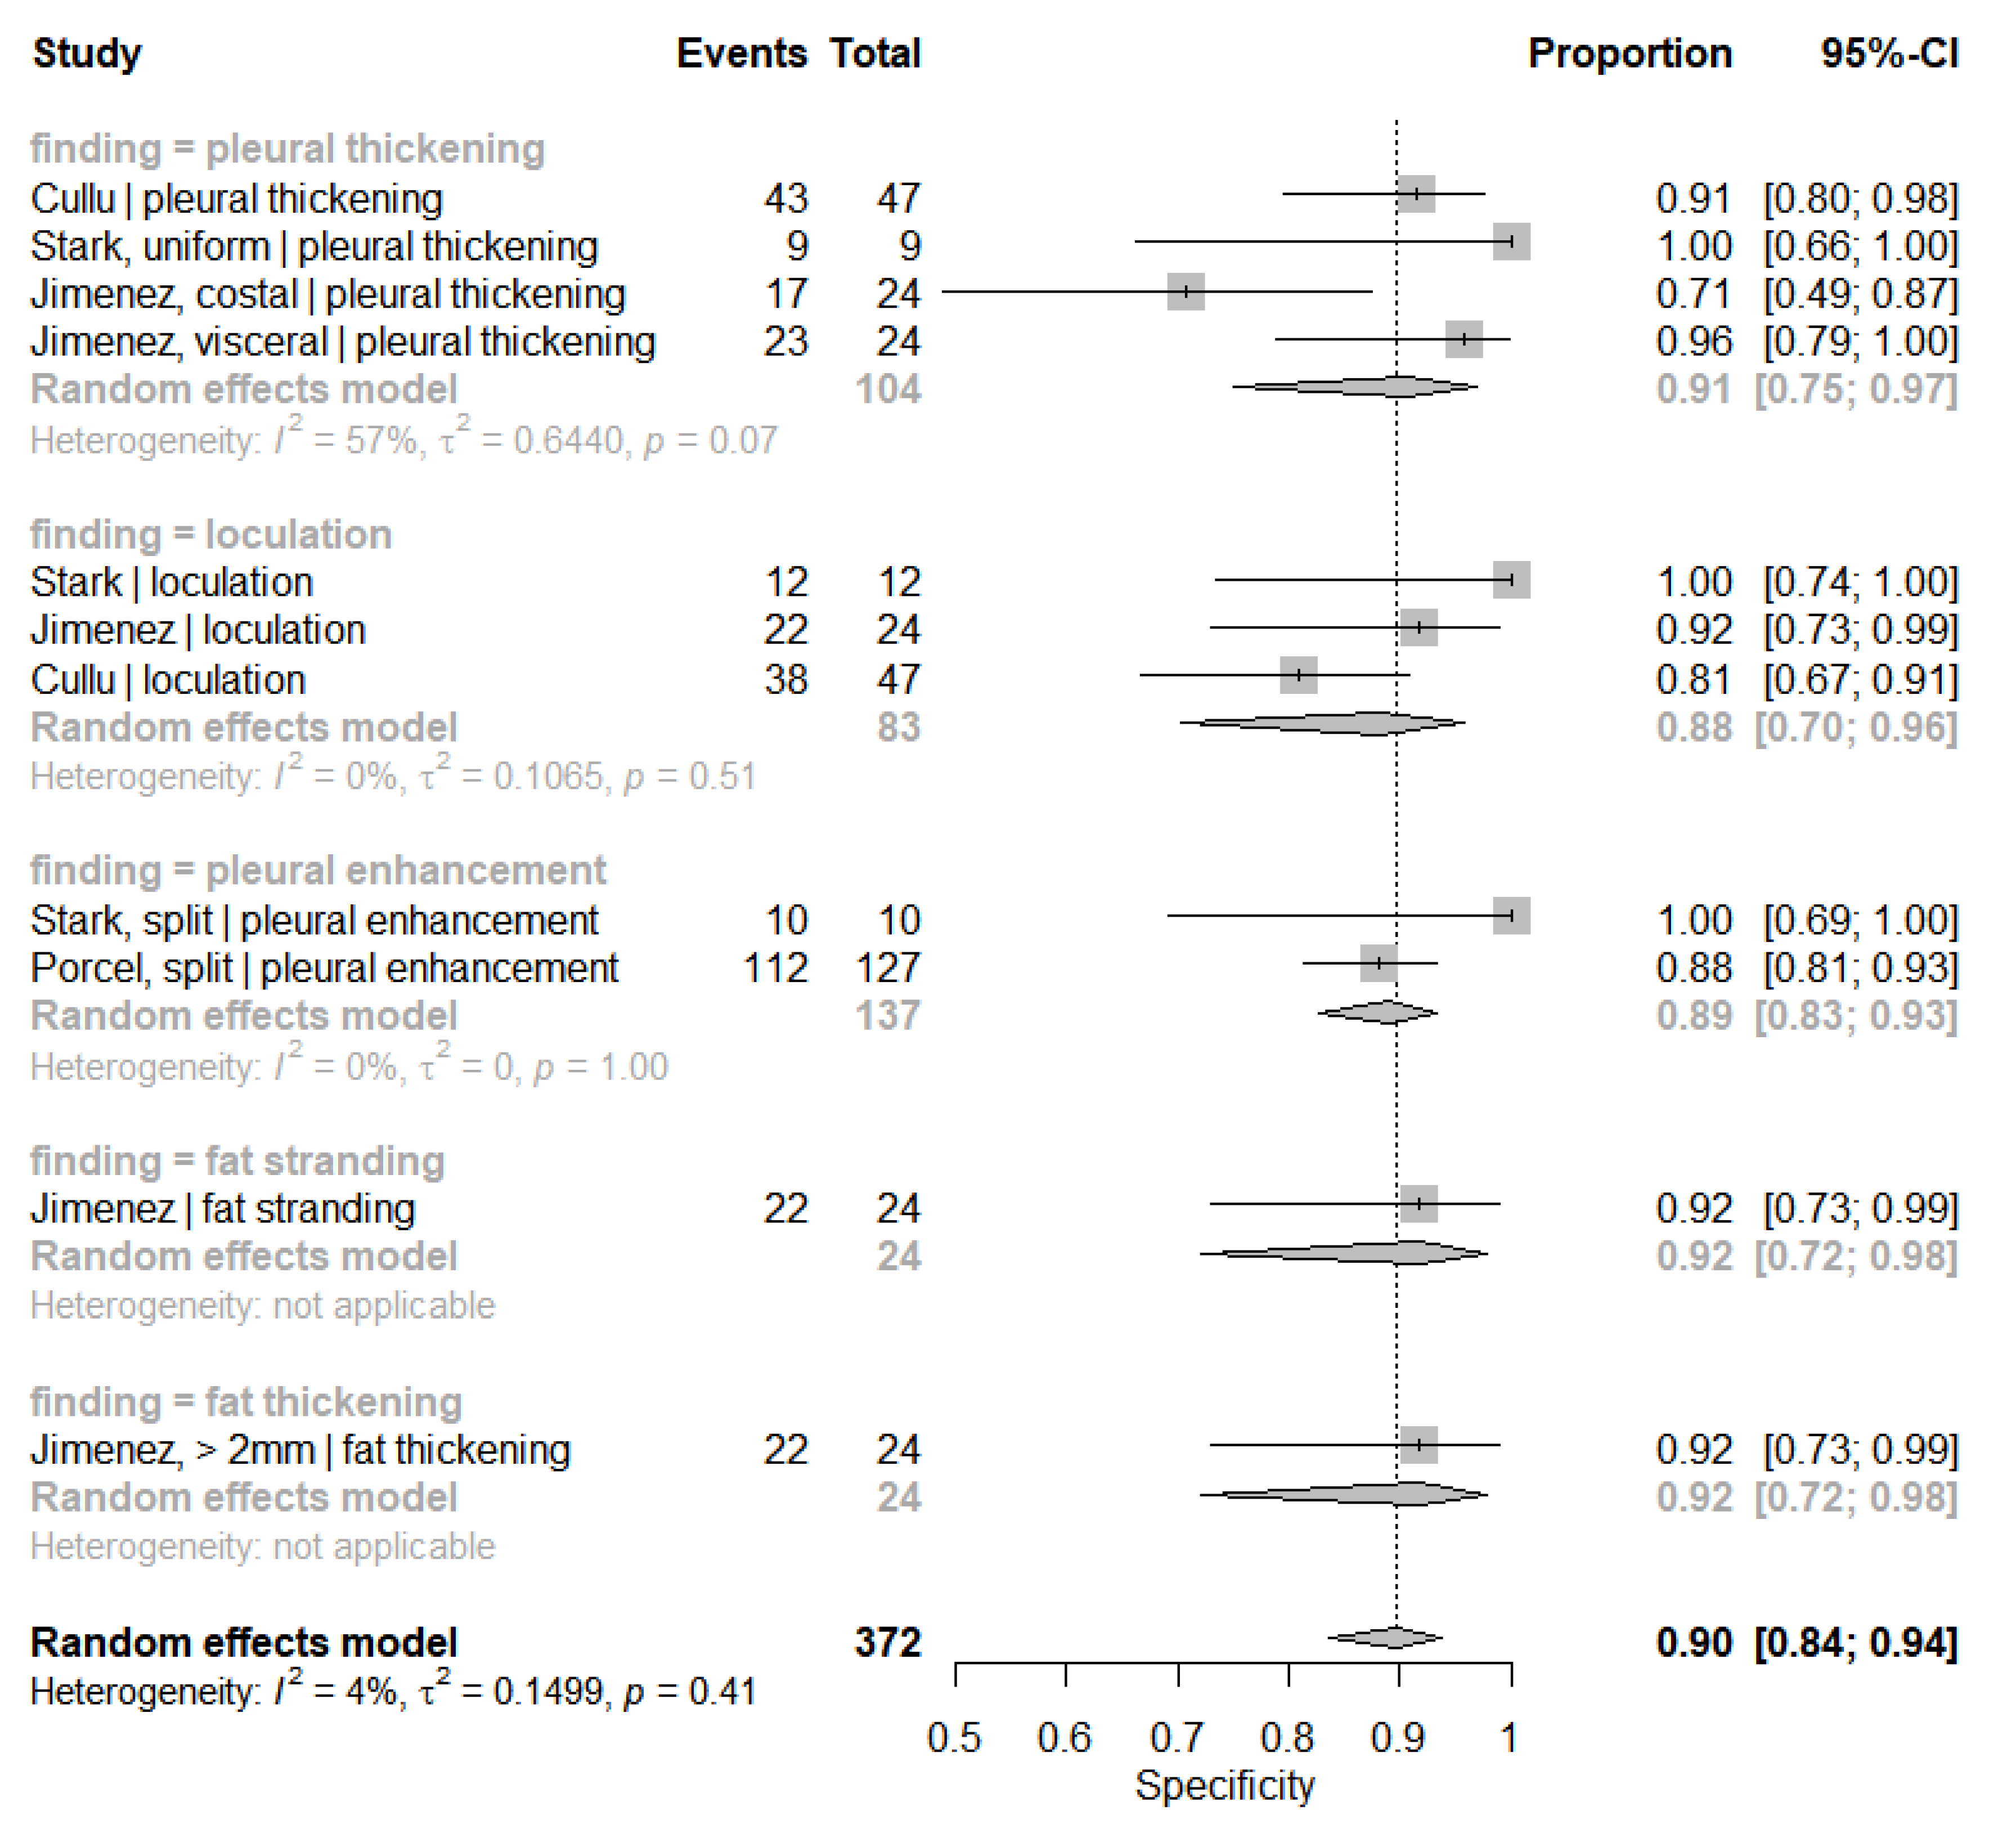
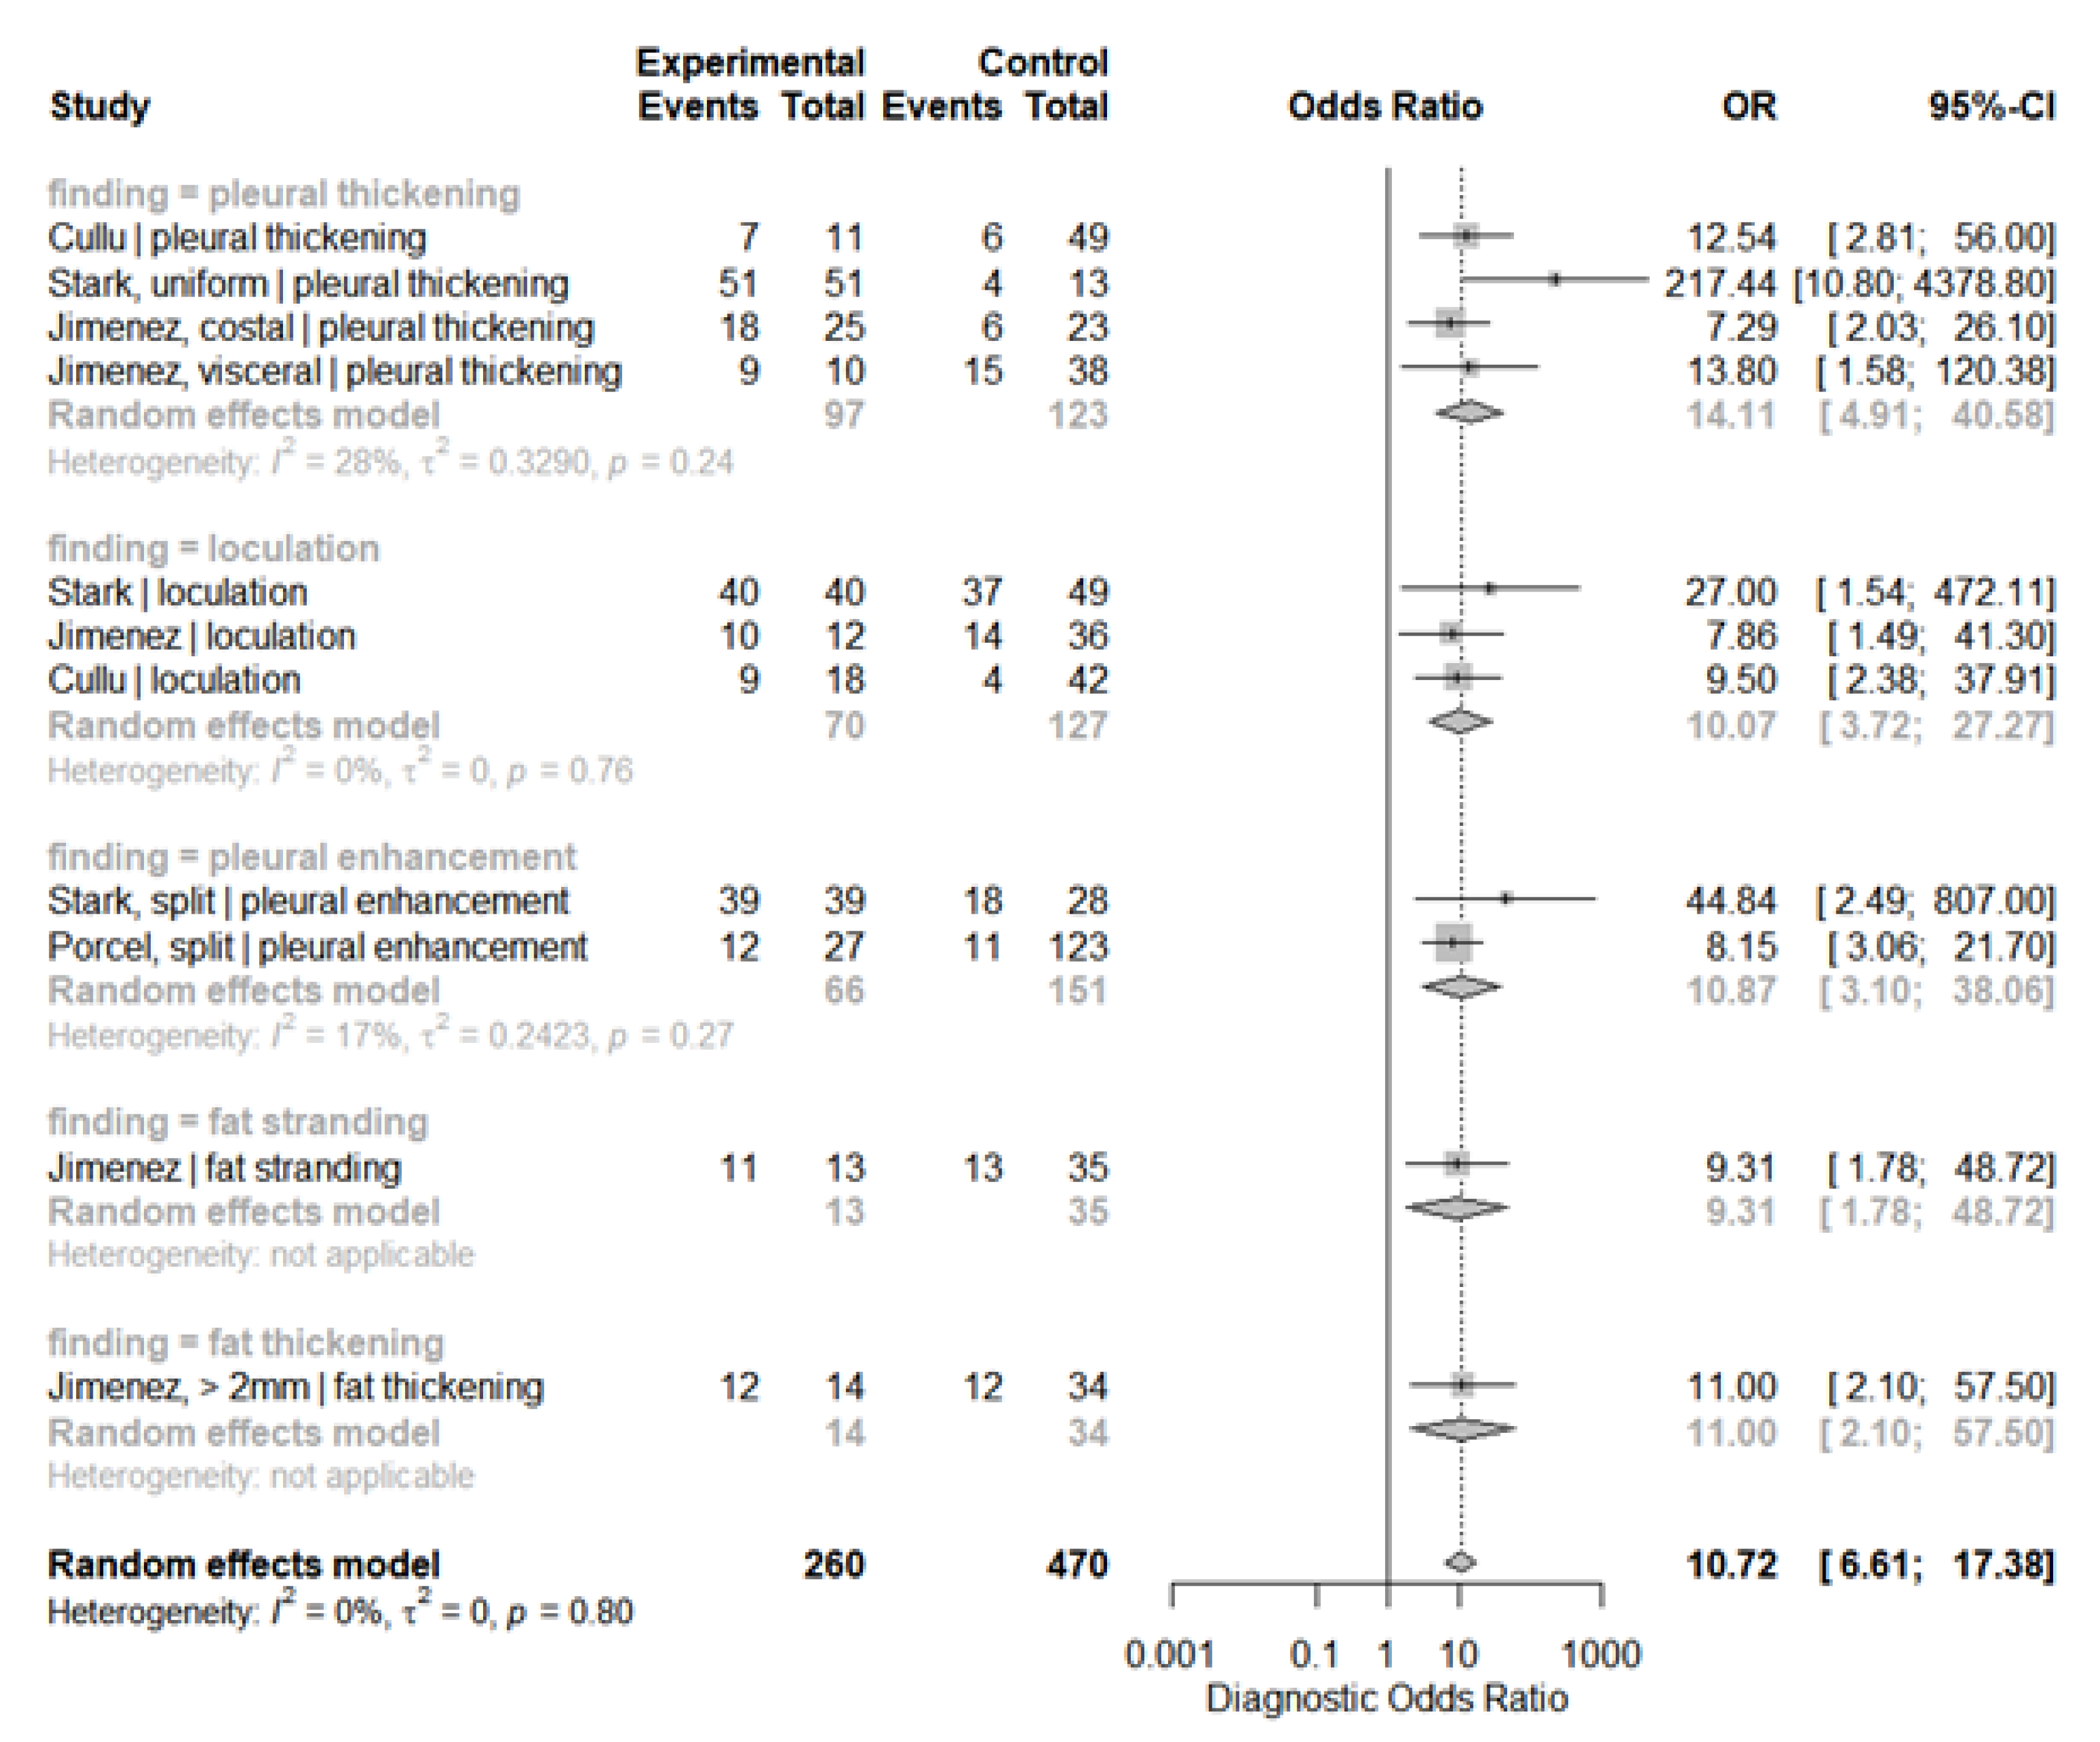
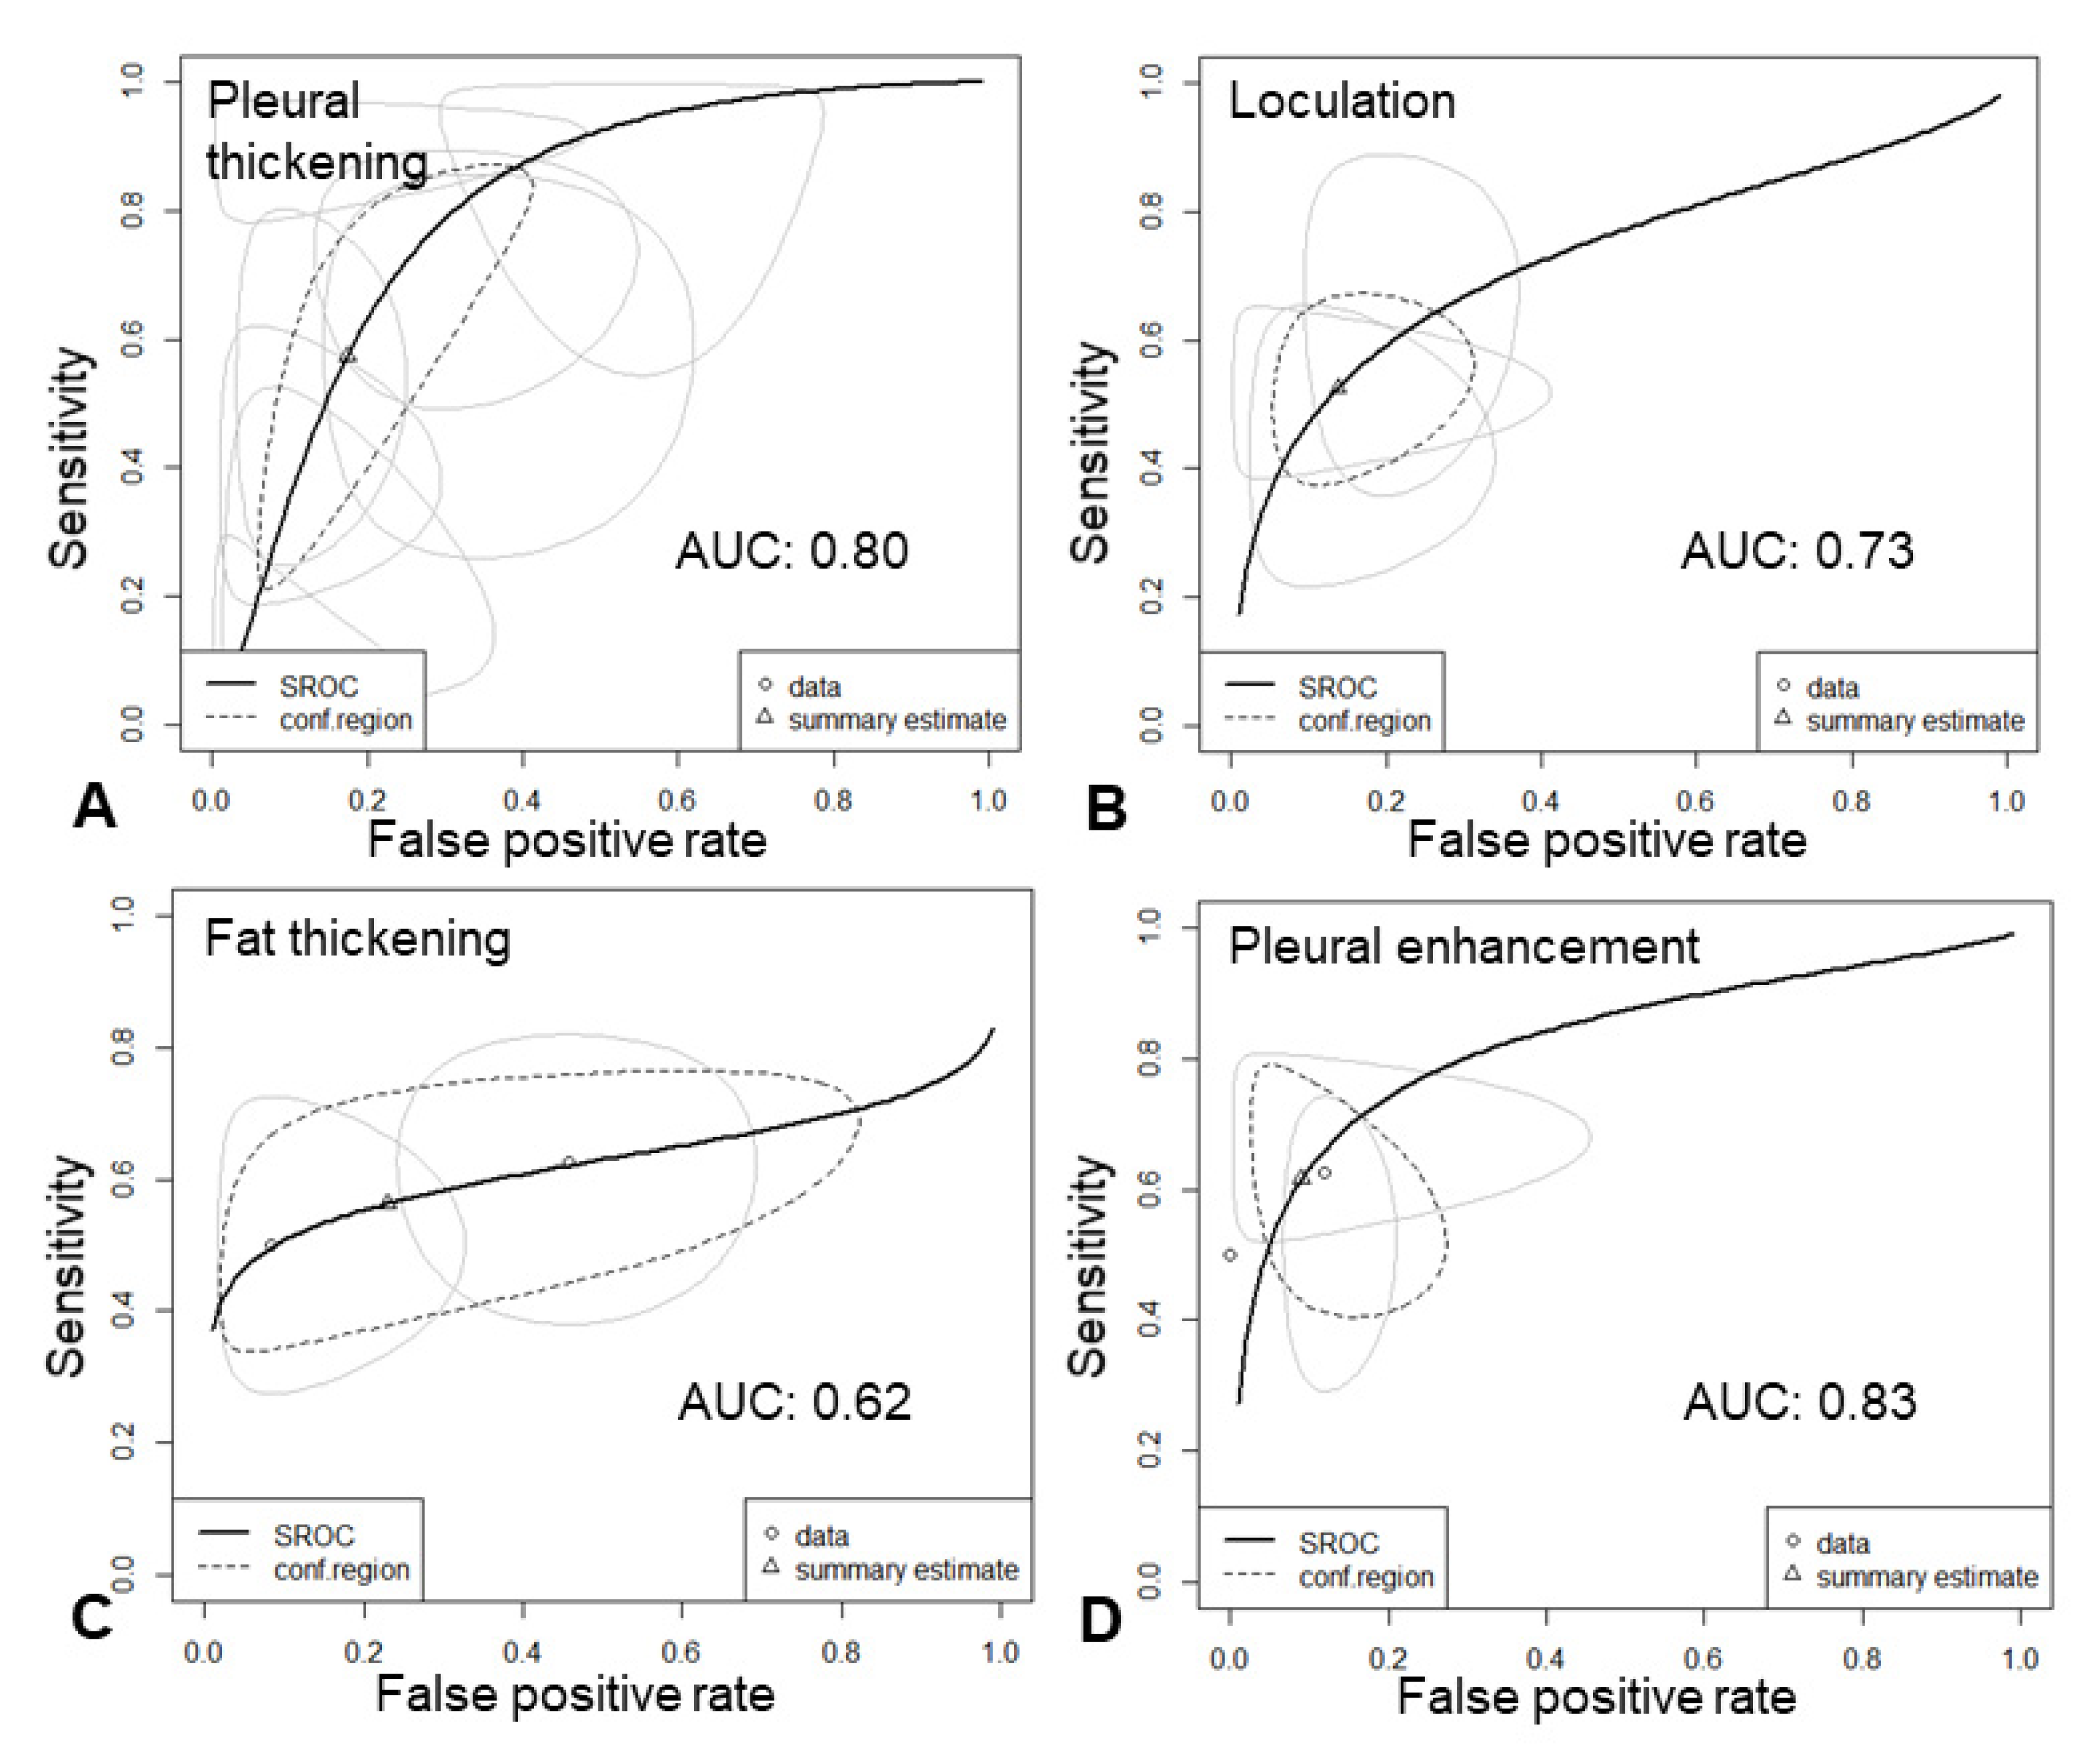
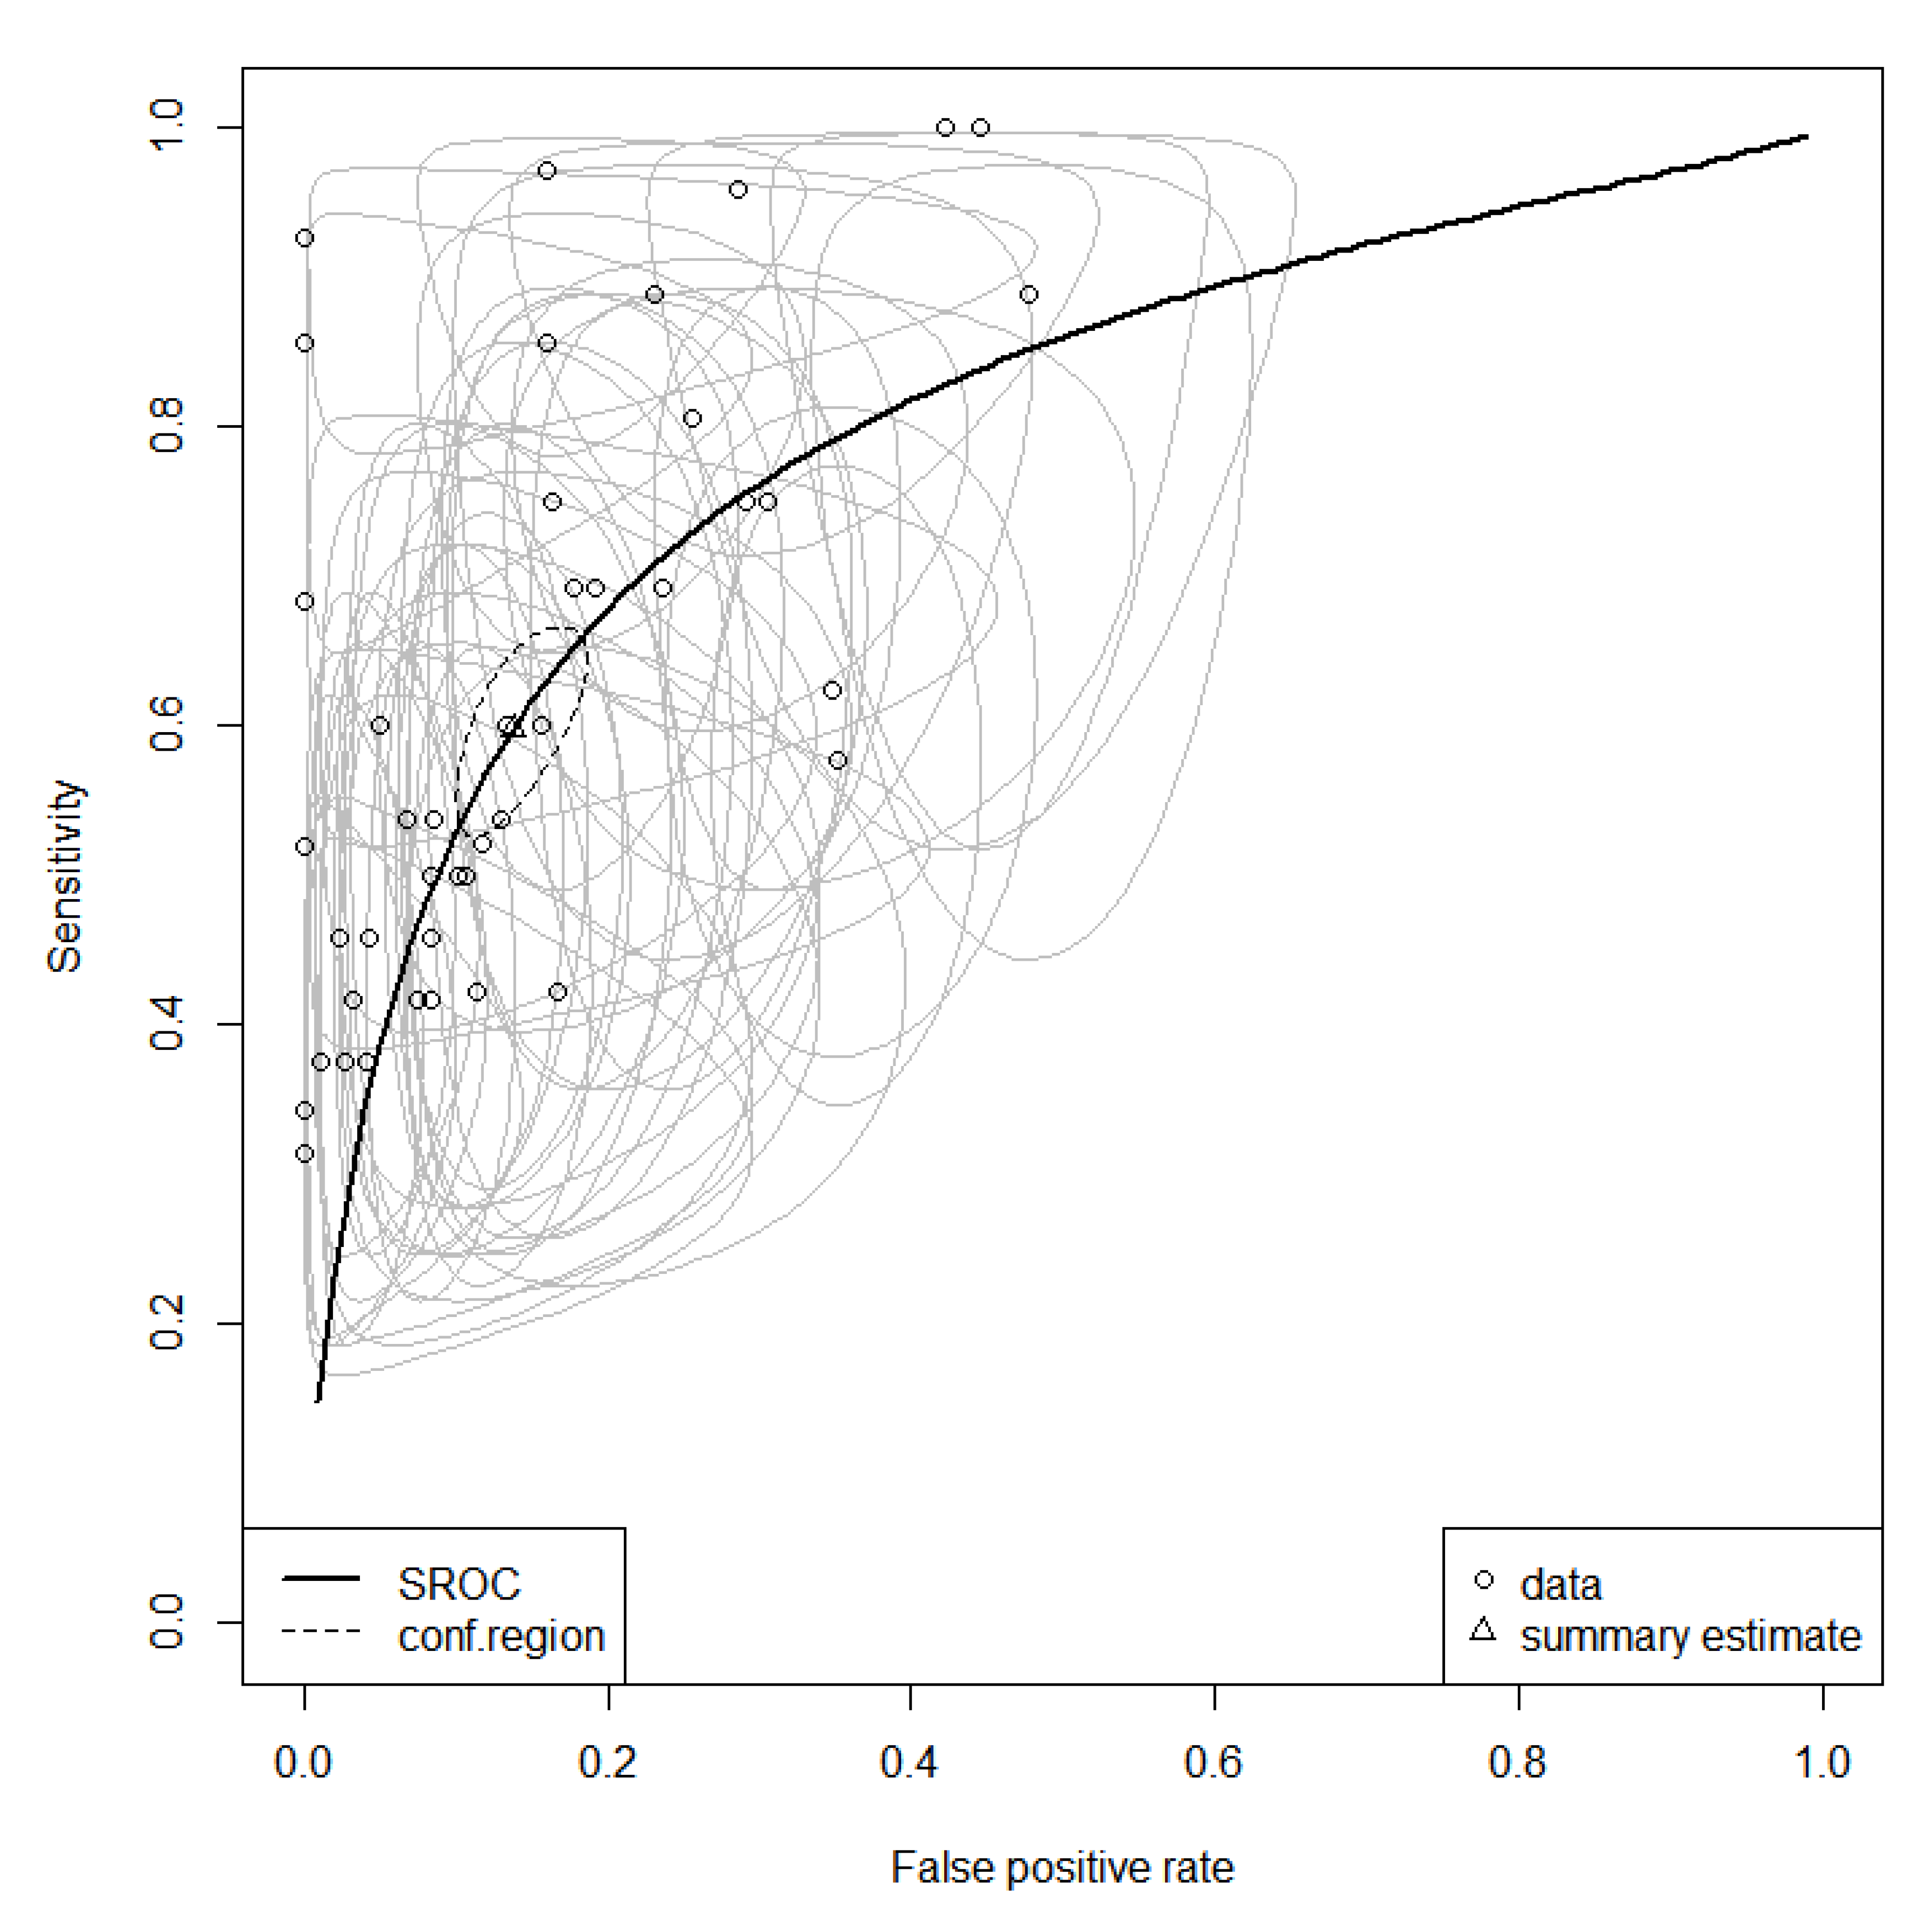
3.6. Empyema and Subgroup Analysis
4. Discussion
5. Conclusions
6. Future Directions
Author Contributions
Funding
Institutional Review Board Statement
Informed Consent Statement
Data Availability Statement
Acknowledgments
Conflicts of Interest
Appendix A. Search Strategy
Appendix B. Extracted Data Items
Appendix C. Study Risk of Bias and Assessment of the Methodological Quality

| First Author | Journal/Meeting | Publication Year | Reason for Exclusion |
|---|---|---|---|
| Schmitt [23] | Rofo | 1981 | No Diagnostic accuracy |
| Williford [24] | Radiol Clin North Am. | 1983 | No Diagnostic accuracy |
| Snow [25] | Chest | 1990 | No Diagnostic accuracy |
| Kohda [26] | Nihon Kyobu Shikkan Gakkai Zasshi | 1994 | No Diagnostic accuracy |
| Beigelman [27] | Rev Mal Respir. | 1998 | No Diagnostic accuracy |
| Kearney [28] | Clin Radiol. | 2000 | No Diagnostic accuracy |
| Ellis [29] | ER | 2002 | No Diagnostic accuracy |
| Smolikov [30] | Clin Radiol | 2006 | No Diagnostic accuracy |
| Lee [31] | J Comput Assit Tomogr. | 2006 | No Diagnostic accuracy |
| Heffner [32] | Chest | 2010 | No Diagnostic accuracy |
| Franklin [33] | BMJ | 2011 | No Diagnostic accuracy |
| Franklin [34] | AJRCCM | 2012 | No Diagnostic accuracy |
| Valdés [35] | Lung | 2013 | No Diagnostic accuracy |
| Yasnogorodsky [36] | Khirurgiia | 2017 | No Diagnostic accuracy |
| Carlucci [37] | Panminerva Med. | 2019 | No Diagnostic accuracy |
| Agrawal [38] | Indian Journal of Surgery | 2020 | No Diagnostic accuracy |
| Das [39] | Indian J Thorac Cardiovasc Surg | 2021 | No Diagnostic accuracy |
| Franklin [40] | Clinical Radiology | 2021 | No Diagnostic accuracy |
| Kendrick [41] | Pediatr Radiol. | 2002 | No Empyema |
| Ahmed [42] | Semin Interven Radiol | 2012 | Case report |
| Iudin [43] | Vestn Rentgenol Radiol | 1997 | No reference test |
| Liu [44] | Journal of Acute Medicine | 2016 | Empyemas as the negative collective |
| CT Finding | TP | FN | FP | TN | Negative Collective | Sensitivity [95%-CI] | Specificity [95%-CI] | DOR [95%-CI] | |
|---|---|---|---|---|---|---|---|---|---|
| Stark [49] | septated | 10 | 47 | 3 | 9 | A | 17.5 [9.8; 29.4] | 75.0 [46.8; 91.1] | 0.0 [0.0; 2.8 ] |
| smooth luminal margin | 52 | 5 | 1 | 6 | A | 91.2 [81.1; 96.2] | 85.7 [48.7; 97.4] | 62.4 [6.2; 627] | |
| Porcel [46] | microbubbles | 13 | 10 | 24 | 103 | A | 56.5 [36.8; 74.4] | 81.1 [73.4; 87.0] | 5.6 [2.2; 14.2] |
| Metintas [50] | smooth margin | 20 | 6 | 41 | 107 | C | 76.9 [57.9; 89.0] | 72.3 [64.6; 78.9] | 8.7 [3.3; 23.2] |
| Moderate or large effusion | 13 | 13 | 101 | 47 | C | 50.0 [32.4; 67.6] | 31.9 [24.9; 39.7] | 0.0 [0.0; 1.1] | |
| Leung [51] | Lung base involvement | 9 | 0 | 55 | 10 | C | 95.0 [65.5; 99.5] | 15.9 [9; 26.6] | 3.6 [0.0; 66.6] |
| Tsujimoto [47] | amount > 30 mm | 26 | 10 | 14 | 33 | B | 72.2 [56.0; 84.2] | 70.2 [56.0; 81.3] | 6.1 [2.3; 16.0] |
| gas pleural fluid | 11 | 25 | 2 | 45 | B | 30.6 [18.0; 46.9] | 95.7 [85.8; 98.8] | 9.9 [2.0; 48.3] | |
| HU > 10 | 31 | 5 | 24 | 23 | B | 86.1 [71.3; 93.9] | 48.9 [35.3; 62.8] | 5.9 [2.0; 17.9] | |
| Septum | 8 | 28 | 2 | 45 | B | 22.2 [11.7; 38.1] | 95.7 [85.8; 98.8] | 6.4 [1.3; 32.5] | |
| Jimenez [48] | pleural gas | 6 | 18 | 8 | 203 | C | 25.0 [12.0; 44.9] | 96.2 [92.7; 98.1] | 8.5 [2.6; 27.1] |
| Author | Neg. Collective | Threshold | TP | FN | FP | TN | Sensitivity [95%-CI] | Specificity [95%-CI] | DOR [95%-CI] | |
|---|---|---|---|---|---|---|---|---|---|---|
| fat stranding | Jimenez [48] | C | visible | 11 | 13 | 8 | 179 | 46 [28.3; 64.7] | 95.5 [91.5; 97.6] | 18 [6.3; 51.1] |
| B | visible | 11 | 13 | 2 | 84 | 46 [28.3; 64.7] | 97.1 [91.2; 99.1] | 28.8 [6.5; 126.9] | ||
| A | visible | 11 | 13 | 2 | 22 | 46 [28.3; 64.7] | 90 [72.5; 96.8] | 7.7 [1.7; 35.2] | ||
| Waite [53] | B | visible | 11 | 24 | 0 | 20 | 31.9 [19.1; 48.3] | 97.6 [80.8; 99.8] | 19.2 [1.1; 346.8] | |
| C | visible | 12 | 23 | 0 | 50 | 34.7 [21.3; 51.1] | 99 [91.3; 99.9] | 53.7 [3.1; 946.3] | ||
| fat thickening | Jimenez [48] | B | visible | 15 | 9 | 30 | 56 | 62 [42.6; 78.2] | 64.9 [54.5; 74.1] | 3 [1.2; 7.6] |
| B | >2 mm | 12 | 12 | 10 | 84 | 50 [31.8; 68.2] | 88.9 [81.1; 93.8] | 8 [2.9; 22.2] | ||
| C | >2 mm | 12 | 12 | 19 | 168 | 50 [31.8; 68.2] | 89.6 [84.4; 93.2] | 8.6 [3.5; 21.5] | ||
| A | >2 mm | 12 | 12 | 2 | 22 | 50 [31.8; 68.2] | 90 [72.5; 96.8] | 9 [2; 41.3] | ||
| Waite [53] | B | visible | 21 | 14 | 1 | 19 | 59.7 [43.5; 74] | 92.9 [74.1; 98.3] | 19.3 [3.2; 115.4] | |
| C | visible | 21 | 14 | 4 | 26 | 59.7 [43.5; 74] | 85.5 [69.2; 93.9] | 8.7 [2.6; 29] | ||
| C | 3–4 mm | 12 | 23 | 0 | 50 | 34.7 [21.3; 51.1] | 99 [91.3; 99.9] | 53.7 [3.1; 946.3] | ||
| loculation | Çullu [52] | C | visible | 9 | 4 | 22 | 71 | 67.9 [42; 86] | 76.1 [66.5; 83.6] | 6.7 [2; 22.7] |
| A | visible | 9 | 4 | 9 | 38 | 67.9 [42; 86] | 80.2 [66.9; 89] | 8.6 [2.3; 32.3] | ||
| B | visible | 9 | 4 | 13 | 60 | 67.9 [42; 86] | 81.8 [71.5; 88.9] | 9.5 [2.7; 33.6] | ||
| Jimenez [48] | B | visible | 10 | 14 | 3 | 91 | 42 [25; 61.1] | 96.3 [90.4; 98.6] | 18.9 [5; 71.6] | |
| A | visible | 10 | 14 | 2 | 22 | 42 [25; 61.1] | 90 [72.5; 96.8] | 6.5 [1.4; 30.1] | ||
| C | visible | 10 | 14 | 14 | 173 | 42 [25; 61.1] | 92.3 [87.6; 95.3] | 8.7 [3.3; 22.6] | ||
| Stark [49] | A | visible | 40 | 37 | 0 | 12 | 51.9 [41; 62.7] | 96.2 [71.7; 99.6] | 27 [1.5; 472.1] | |
| pleural enhancement | Porcel [46] | A | split pleura | 12 | 11 | 15 | 112 | 52.1 [33.2; 70.4] | 87.9 [81.1; 92.5] | 7.9 [3; 20.6] |
| Stark [49] | A | split pleura | 39 | 18 | 0 | 10 | 68.1 [55.3; 78.6] | 95.5 [67.9; 99.5] | 44.8 [2.5; 807] | |
| Tsujimoto [47] | B | split pleura | 29 | 7 | 12 | 35 | 79.7 [64.3; 89.6] | 74 [60.1; 84.3] | 11.2 [4; 31.2] | |
| Waite [53] | C | visible | 34 | 1 | 8 | 42 | 95.8 [83.8; 99] | 83.3 [70.9; 91.1] | 115 [19.1; 690.8] | |
| B | visible | 24 | 1 | 8 | 20 | 94.2 [78.4; 98.7] | 70.7 [52.5; 84] | 39.4 [6.3; 246.1] | ||
| pleural thickening | Aquino [54] | C | 2–4 mm | 6 | 4 | 11 | 59 | 59.1 [31.6; 81.9] | 83.8 [73.5; 90.6] | 7.5 [1.9; 29.1] |
| B | 2–4 mm | 6 | 4 | 8 | 52 | 59.1 [31.6; 81.9] | 86.1 [75.2; 92.6] | 8.9 [2.2; 36.3] | ||
| Çullu [52] | A | visible | 7 | 6 | 4 | 43 | 53.6 [29.6; 76] | 90.6 [79.1; 96.1] | 11.2 [2.7; 46.6] | |
| B | visible | 7 | 6 | 5 | 68 | 53.6 [29.6; 76] | 92.6 [84.3; 96.7] | 14.4 [3.7; 56.2] | ||
| C | visible | 7 | 6 | 12 | 81 | 53.6 [29.6; 76] | 86.7 [78.4; 92.1] | 7.5 [2.2; 25.2] | ||
| Jimenez [48] | B | costal | 18 | 6 | 14 | 72 | 74 [54.5; 87.1] | 83.3 [74.1; 89.7] | 14.2 [4.9; 40.9] | |
| C | costal | 18 | 6 | 57 | 130 | 74 [54.5; 87.1] | 69.4 [62.5; 75.6] | 6.5 [2.5; 16.6] | ||
| A | costal | 18 | 6 | 7 | 17 | 74 [54.5; 87.1] | 70 [50.4; 84.3] | 6.6 [1.9; 22.9] | ||
| C | visceral | 9 | 15 | 5 | 182 | 38 [21.8; 57.4] | 97.1 [93.6; 98.7] | 20.3 [6.3; 65.6] | ||
| B | visceral | 9 | 15 | 1 | 85 | 38 [21.8; 57.4] | 98.3 [92.9; 99.6] | 34.9 [5.7; 212.4] | ||
| A | visceral | 9 | 15 | 1 | 23 | 38 [21.8; 57.4] | 94 [77.7; 98.6] | 9.6 [1.5; 60.3] | ||
| Leung [51] | B | smooth | 8 | 1 | 6 | 20 | 85 [54.1; 96.5] | 75.9 [57.3; 88.1] | 17.9 [2.6; 125.3] | |
| C | visceral | 9 | 0 | 11 | 15 | 95 [65.5; 99.5] | 57.4 [39; 74] | 25.6 [1.3; 486.5] | ||
| B | unilateral | 8 | 1 | 31 | 34 | 85 [54.1; 96.5] | 52.3 [40.4; 63.9] | 6.2 [1; 37.6] | ||
| C | visceral | 9 | 0 | 29 | 36 | 95 [65.5; 99.5] | 55.3 [43.3; 66] | 23.5 [1.3; 420.9] | ||
| Metintas [50] | C | diffuse | 15 | 11 | 59 | 109 | 57.4 [39; 74] | 64.8 [57.3; 71.6] | 2.5 [1.1; 5.7] | |
| Stark [49] | B | focal | 11 | 15 | 5 | 25 | 42.6 [26; 61] | 82.3 [65.5; 91.9] | 3.4 [1; 11.4] | |
| C | focal | 11 | 15 | 19 | 149 | 42.6 [26; 61] | 88.5 [82.8; 92.4] | 5.7 [2.3; 13.9] | ||
| A | uniform | 51 | 4 | 0 | 9 | 92 [81.9; 96.7] | 95 [65.5; 99.5] | 217.4 [10.8; 4378.8] | ||
| Waite [53] | B | visible | 30 | 5 | 0 | 20 | 84.7 [69.7; 93] | 97.6 [80.8; 99.8] | 227.4 [11.9; 4338.3] | |
| C | visible | 30 | 5 | 8 | 42 | 84.7 [69.7; 93] | 83.3 [70.9; 91.1] | 27.7 [8.6; 89.3] | ||
| B | 3–4 mm | 12 | 23 | 0 | 20 | 34.7 [21.3; 51.1] | 97.6 [80.8; 99.8] | 21.8 [1.2; 391.7] |
| DOR | Proportion [95%-CI] | Tau2 | Q | AUC (Univariate) |
|---|---|---|---|---|
| enhancement | 21.08 [7.91–56.20] | 0.62 | 4.02 | 0.91 |
| pleural thickening | 10.11 [6.88–14.87] | 0.29 | 20.38 | 0.82 |
| loculation | 9.40 [5.73–15.44] | 0.00 | 2.15 | 0.79 |
| fat thickening | 7.99 [4.97–12.86] | 0.05 | 6.91 | 0.80 |
| fat stranding | 17.88 [8.88–36.01] | 0.00 | 2.15 | 0.81 |
| CT Feature | Pooled Sensitivity [95%-CI] | Pooled Specificity [95%-CI] | AUC (Bivariate) | DOR [95%-CI] | Tau2 | Cochrane Q | Heterogenity Chi2 | AUC: Univariate | |
|---|---|---|---|---|---|---|---|---|---|
| Benign Effusion | enhancement | 0.89 [0.60–0.98] | 0.73 [0.62–0.82] | 0.76 | 20.1 [4.6–87.2] | 0.5 | 1.00 | 2.28 * | 0.93 |
| pleural thickening | 0.64 [0.46–0.79] | 0.86 [0.77–0,92] | 0.85 | 13.5 [7.2–25.2] | 0.2 | 8.00 | 10.10 | 0.84 | |
| loculation | 0.55 [0.26–0.82] | 0.92 [0.64–0.99] | 0.80 | 14.6 [5.6–38.4] | 0.0 | 0.56 | 0.10 * | 0.80 | |
| fat thickening | 0.59 [49.4–67.2] | 0.87 [0.68–0.95] | 0.61 | 8.7 [3.1–24.1] | 0.5 | 3.03 | 7.06 * | 0.87 | |
| fat stranding | 0.38 [0.26–0.53] | 0.97 [0.92–0.99] | 0.96 | 26.5 [7.1–99.0] | 0.0 | 0.06 | 0.03 * | 0.80 | |
| Effusion general | enhancement 1 | 0.97 [0.82–1.00] | 0.84 [0.71–0.92] | 0.97 | 7.9 [4.5–13.8] | NA | NA | NA | 0.98 |
| pleural thickening | 0.65 [0.51–0.78] | 0.79 [0.66–0.88] | 0.78 | 7.9 [4.6–13.8] | 0.3 | 7.06 | 8.15 | 0.81 | |
| loculation | 0.56 [0.26–0.82] | 0.86 [0.67–0.96] | 0.78 | 8.2 [3.8–17.8] | 0.0 | 0.06 | 0.34 * | 0.75 | |
| fat thickening | 0.48 [0.32–0.64] | 0.92 [0.79–0.97] | 0.74 | 9.6 [4.8–19.6] | 0.0 | 1.45 | 0.41 | 0.80 | |
| fat stranding | 0.40 [0.28–0.52] | 0.96 [0.92–0.98] | 0.77 | 20.4 [7.6–54.6] | 0.0 | 0.49 | 0.06 * | 0.80 |
| Sensitivity [95%-CI] | Tau2 | I2 | Specificity [95%-CI] | Tau2 | I2 | ||
|---|---|---|---|---|---|---|---|
| Random effect model | 0.62 [0.55; 0.68] | 0.7373 | 67.3% | 0.90 [0.86; 0.93] | 1.1359 | 82.5% | |
| Sensitivity [95%-CI] | p | Q | Specificity [95%-CI] | p | Q | ||
| Negative collective | All | 0.63 [0.50; 0.74] | 0.9234 | 0.16 | 0.88 [0.80; 0.93] | 0.7485 | 0.58 |
| Benign | 0.63 [0.52; 0.73] | 0.91 [0.84; 0.95] | |||||
| Parapneumonic | 0.60 [0.48; 0.71] | 0.90 [0.84; 0.94] | |||||
| Concerns regarding appicability | Yes | 0.69 [0.58; 0.78] | 0.1902 | 1.72 | 0.87 [0.80; 0.91] | 0.3076 | 1.04 |
| No | 0.60 [0.52; 0.68 | 0.90 [0.85; 0.93] | |||||
| Referencestandard for all patients | Yes | 0.61 [0.54; 0.67] | 0.2879 | 1.13 | 0.89 [0.85; 0.92] | 0.9996 | 0.00 |
| No | 0.75 [0.48; 0.90] | 1.00 [0.00; 1.00] | |||||
| More than 1 reviewer | Yes | 0.60 [0.52; 0.67] | 0.5257 | 0.40 | 0.88 [0.83; 0.92] | 0.2605 | 1.27 |
| No | 0.65 [0.52; 0.76] | 0.92 [0.86; 0.96] | |||||
| Slice thickness | 10 mm | 0.66 [0.52; 0.77] | 0.634 | 1.71 | 0.94 [0.87; 0.98] | <0.001 | 84.39 |
| 5 mm | 0.62 [0.50; 0.72] | 0.86 [0.80; 0.90] | |||||
| 3 mm | 0.52 [0.32; 0.71] | 0.88 [0.81; 0.93] | |||||
| Study after 2000 | Yes | 0.59 [0.50; 0.67] | 0.4489 | 0.57 | 0.92 [0.87; 0.95] | 0.0131 | 6.15 |
| No | 0.63 [0.54; 0.71] | 0.84 [0.78; 0.88] | |||||
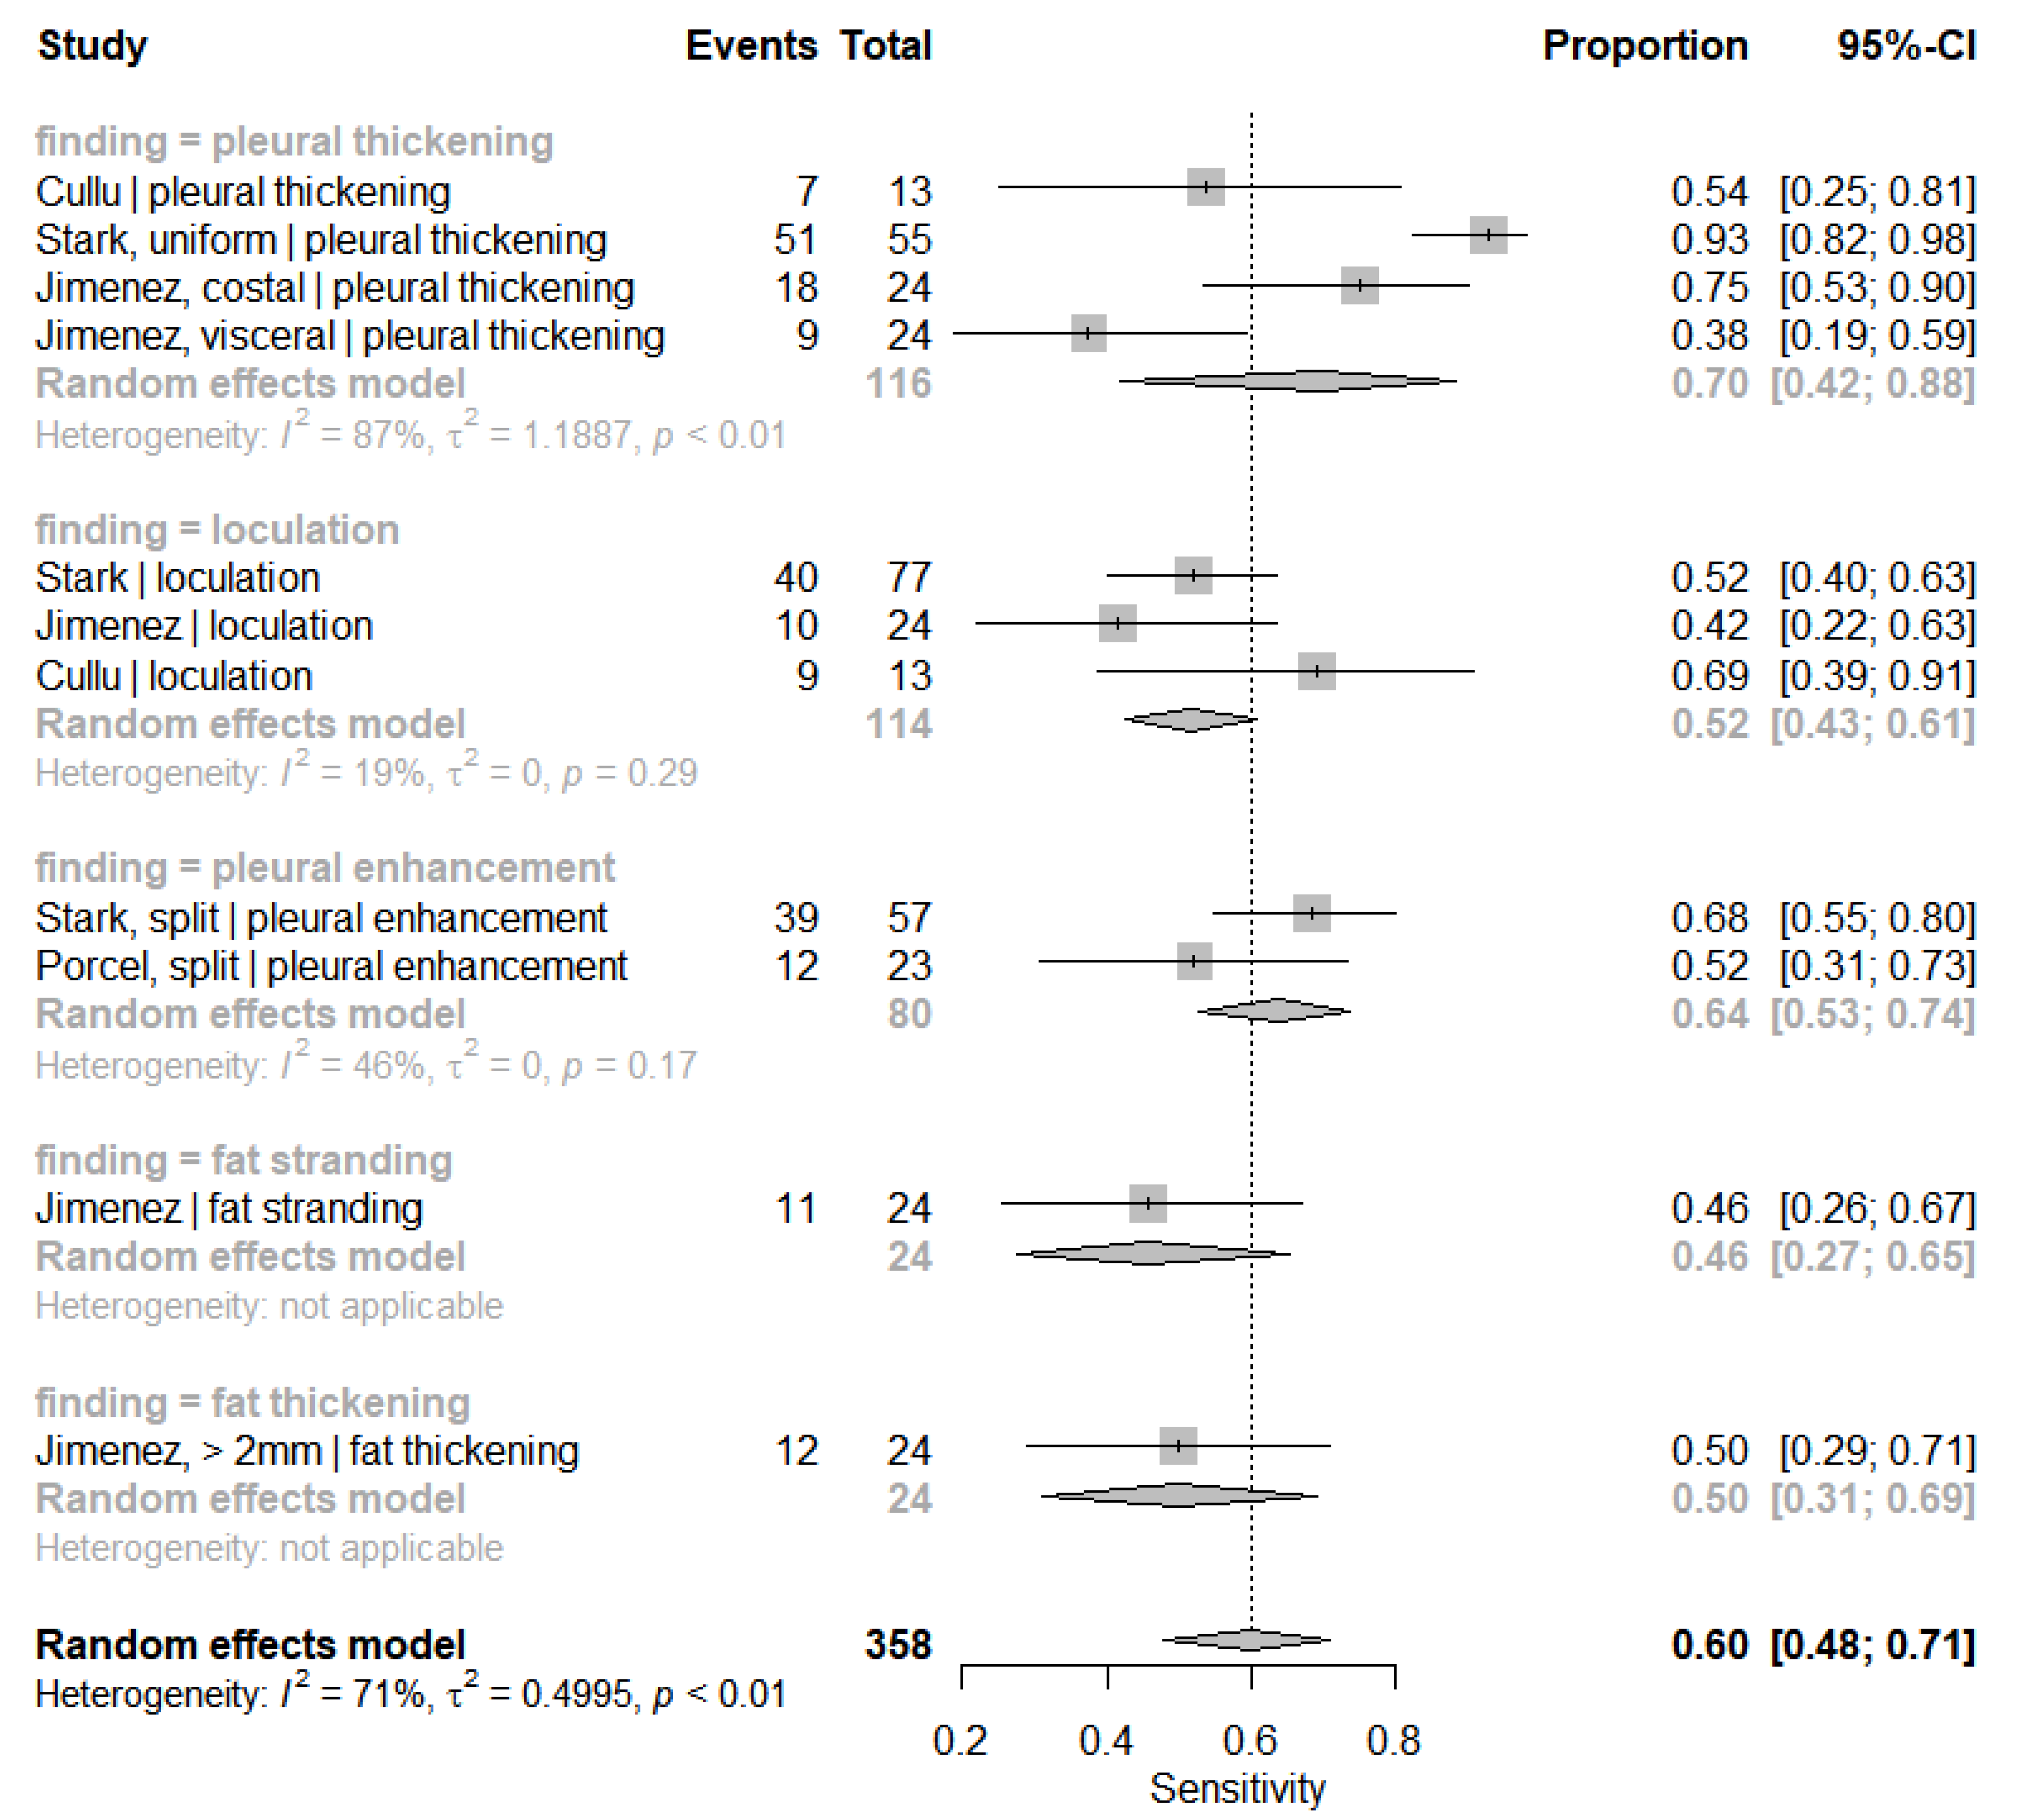
| Pleural finding | pleural thickening | 0.68 [0.56; 0.77] | 0.0001 | 23.35 | 0.87 [0.80; 0.92] | <0.0001 | 24.68 |
| enhancement | 0.84 [0.62; 0.94] | 0.83 [0.75; 0.89] | |||||
| fat stranding | 0.39 [0.32; 0.48] | 0.97 [0.94; 0.98] | |||||
| fat thickening | 0.53 [0.47; 0.60] | 0.91 [0.82; 0.96] | |||||
| loculation | 0.52 [0.44; 0.59] | 0.89 [0.82; 0.94] | |||||
| Empyema prevalence | <30% | 0.59 [0.52; 0.65] | 0.4491 | 0.57 | 0.87 [0.81; 0.91] | 0.0387 | 4.27 |
| >30% | 0.64 [0.52; 0.74] | 0.94 [0.88; 0.97] | |||||
| High bias | Yes | 0.60 [0.52; 0.66] | 0.4270 | 0.63 | 0.88 [0.83; 0.92] | 0.2291 | 1.45 |
| No | 0.66 [0.51; 0.78] | 0.93 [0.85; 0.97] |


References
- Marel, M.; Zrůstová, M.; Stasný, B.; Light, R.W. The incidence of pleural effusion in a well-defined region. Epidemiologic study in central Bohemia. Chest 1993, 104, 1486–1489. [Google Scholar] [CrossRef] [PubMed]
- Light, R.W. Pleural effusions. Med. Clin. N. Am. 2011, 95, 1055–1070. [Google Scholar] [CrossRef] [PubMed]
- Khan, J.A.; Lehtomäki, A.I.; Toikkanen, V.J.; Ukkonen, M.T.; Nevalainen, R.M.; Laurikka, J.O. Long-Term Prognosis and Causes of Death After Pleural Infections. Scand. J. Surg. 2018, 107, 145–151. [Google Scholar] [CrossRef]
- Grijalva, C.G.; Zhu, Y.; Nuorti, J.P.; Griffin, M.R. Emergence of parapneumonic empyema in the USA. Thorax 2011, 66, 663–668. [Google Scholar] [CrossRef] [PubMed]
- Strange, C.; Sahn, S.A. The definitions and epidemiology of pleural space infection. Semin. Respir. Infect. 1999, 14, 3–8. [Google Scholar]
- Taryle, D.A.; Potts, D.E.; Sahn, S.A. The Incidence and Clinical Correlates of Parapneumonic Effusions in Pneumococcal Pneumonia. Chest 1978, 74, 170–173. [Google Scholar] [CrossRef]
- Okiror, L.; Coltart, C.; Bille, A.; Guile, L.; Pilling, J.; Harrison-Phipps, K.; Routledge, T.; Lang-Lazdunski, L.; Hemsley, C.; King, J. Thoracotomy and decortication: Impact of culture-positive empyema on the outcome of surgery. Eur. J. Cardiothorac. Surg. 2014, 46, 901–906. [Google Scholar] [CrossRef]
- Sahn, S.A. Diagnosis and management of parapneumonic effusions and empyema. Clin. Infect. Dis. Publ. Infect. Dis. Soc. Am. 2007, 45, 1480–1486. [Google Scholar] [CrossRef]
- Shen, K.R.; Bribriesco, A.; Crabtree, T.; Denlinger, C.; Eby, J.; Eiken, P.; Maldonado, F.; Paul, S. The American Association for Thoracic Surgery consensus guidelines for the management of empyema. J. Thorac. Cardiovasc. Surg. 2017, 153, e129–e146. [Google Scholar] [CrossRef]
- Colice, G.L.; Curtis, A.; Deslauriers, J.; Heffner, J.; Light, R.; Littenberg, B.; Sahn, S.; Weinstein, R.A.; Yusen, R.D. Medical and surgical treatment of parapneumonic effusions: An evidence-based guideline. Chest 2000, 118, 1158–1171. [Google Scholar] [CrossRef]
- Light, R.W. Parapneumonic effusions and empyema. Proc. Am. Thorac. Soc. 2006, 3, 75–80. [Google Scholar] [CrossRef]
- Suárez, P.R.; Gilart, J.F.; Pérez, J.M.H.; Serhal, M.H.; Artalejo, A.L. Treatment of complicated parapneumonic pleural effusion and pleural parapneumonic empyema. Med. Sci. Monit. Int. Med. J. Exp. Clin. Res. 2012, 18, CR443–CR449. [Google Scholar] [CrossRef]
- Clark, J.M.; Sanders, S.; Carter, M.; Honeyman, D.; Cleo, G.; Auld, Y.; Booth, D.; Condron, P.; Dalais, C.; Bateup, S.; et al. Improving the translation of search strategies using the Polyglot Search Translator: A randomized controlled trial. J. Med. Libr. Assoc. 2020, 108, 195. [Google Scholar] [CrossRef]
- Sexauer, R. Data Extraction Sheet. 2021. Available online: https://doi.org/10.17605/OSF.IO/EZWP6 (accessed on 22 December 2021). [CrossRef]
- Whiting, P.F. QUADAS-2: A Revised Tool for the Quality Assessment of Diagnostic Accuracy Studies. Ann. Intern. Med. 2011, 155, 529. [Google Scholar] [CrossRef] [PubMed]
- Bossuyt, P.M.; Reitsma, J.B.; Bruns, D.E.; Gatsonis, C.A.; Glasziou, P.P.; Irwig, L.; Lijmer, J.G.; Moher, D.; Rennie, D.; de Vet, H.C.W. STARD 2015: An updated list of essential items for reporting diagnostic accuracy studies. Clin. Chem. 2015, 61, 1446–1452. [Google Scholar] [CrossRef] [PubMed]
- Harbord, R.M.; Whiting, P.; Sterne, J.A.C.; Egger, M.; Deeks, J.J.; Shang, A.; Bachmann, L.M. An empirical comparison of methods for meta-analysis of diagnostic accuracy showed hierarchical models are necessary. J. Clin. Epidemiol. 2008, 61, 1095–1103. [Google Scholar] [CrossRef]
- Reitsma, J.B.; Glas, A.S.; Rutjes, A.W.S.; Scholten, R.J.; Bossuyt, P.M.; Zwinderman, A.H. Bivariate analysis of sensitivity and specificity produces informative summary measures in diagnostic reviews. J. Clin. Epidemiol. 2005, 58, 982–990. [Google Scholar] [CrossRef] [PubMed]
- Higgins, J.P.T. Measuring inconsistency in meta-analyses. BMJ 2003, 327, 557–560. [Google Scholar] [CrossRef]
- Lee, J.; Kim, K.W.; Choi, S.H.; Huh, J.; Park, S.H. Systematic Review and Meta-Analysis of Studies Evaluating Diagnostic Test Accuracy: A Practical Review for Clinical Researchers-Part II. Statistical Methods of Meta-Analysis. Korean J. Radiol. 2015, 16, 1188. [Google Scholar] [CrossRef]
- Higgins, J.; Thomas, J.; Chandler, J.; Cumpston, M.; Li, T.; Page, M.; Welch, V. (Eds.) Cochrane Handbook for Systematic Reviews of Interventions; John Wiley & Sons: Hoboken, NJ, USA, 2021; Available online: https://training.cochrane.org/handbook/current. (accessed on 11 May 2021).
- McInnes, M.D.F.; Bossuyt, P.M.M. Pitfalls of Systematic Reviews and Meta-Analyses in Imaging Research. Radiology 2015, 277, 13–21. [Google Scholar] [CrossRef]
- Schmitt, W.G.; Hübener, K.H. Calcified pleural scars and pleural empyema with mural calcification (author’s transl). ROFO Geb. Rontgenstr. Nukl. 1981, 134, 619–625. [Google Scholar] [CrossRef]
- Williford, M.E.; Godwin, J.D. Computed tomography of lung abscess and empyema. Radiol. Clin. North. Am. 1983, 21, 575–583. [Google Scholar]
- Snow, N.; Bergin, K.T.; Horrigan, T.P. Thoracic CT Scanning in Critically III Patients: Information Obtained Frequently Alters Management. Chest 1990, 97, 1467–1470. [Google Scholar] [CrossRef]
- Kohda, E.; Suzuki, K.; Tanaka, M.; Taki, Y.; Kobayashi, K.; Kanazawa, M.; Yamaguchi, K. Radiological approach to the pleura and pleural cavity with CT and MRI. Nihon Kyobu Shikkan Gakkai Zasshi 1994, 32, 148–154. [Google Scholar]
- Beigelman, C.; Chartrand-Lefebvre, C.; Jouveshomme, S.; Brauner, M. Thoracic infections in immunocompetent patients. The contribution of computed tomography. Rev. Mal. Respir. 1998, 15, 151–157. [Google Scholar]
- Kearney, S.E.; Davies, C.W.H.; Davies, R.J.O.; Gleeson, F.V. Computed Tomography and Ultrasound in Parapneumonic Effusions and Empyema. Clin. Radiol. 2000, 55, 542–547. [Google Scholar] [CrossRef] [PubMed]
- Ellis, J.R.C.; Gleeson, F.V. Non-traumatic thoracic emergencies: Imaging and treatment of thoracic fluid collections (including pneumothorax). Eur. Radiol. 2002, 12, 1922–1930. [Google Scholar] [CrossRef] [PubMed]
- Smolikov, A.; Smolyakov, R.; Riesenberg, K.; Schlaeffer, F.; Borer, A.; Cherniavsky, E.; Gavriel, A.; Gilad, J. Prevalence and clinical significance of pleural microbubbles in computed tomography of thoracic empyema. Clin. Radiol. 2006, 61, 513–519. [Google Scholar] [CrossRef] [PubMed]
- Lee, H.Y.; Goo, J.M.; Lee, H.J.; Lee, C.H.; Chun, E.J.; Im, J.G. The Value of Computed Tomography for Predicting Empyema-Associated Malignancy. J. Comput. Assist. Tomogr. 2006, 30, 453–459. [Google Scholar] [CrossRef] [PubMed]
- Heffner, J.E.; Klein, J.S.; Hampson, C. Diagnostic Utility and Clinical Application of Imaging for Pleural Space Infections. Chest 2010, 137, 467–479. [Google Scholar] [CrossRef]
- Franklin, J.M.; Purcell-Jones, J.; Helm, E.J.; Benamore, R.; Rahman, N.M.; Gleeson, F.V. S62 Appearances of empyema on CT: Analysis of the MIST 2 Cohort. Thorax 2011, 66, A30–A31. [Google Scholar] [CrossRef][Green Version]
- Franklin, J.M.; Purcell-Jones, J.; Helm, E.; Benamore, R.; Rahman, N.; Gleeson, F.; Appearances of Empyema on Computed Tomography—Analysis of the MIST 2 Cohort. Presented at The ESTI 2012 meeting, London, UK, 22–24 June 2021. Available online: https://epos.myesr.org/poster/esr/esti2012/E-0095 (accessed on 11 May 2021).
- Valdes, L.; San-Jose, E.; Ferreiro, L.; González-Barcala, F.J.; Golpe, A.; Álvarez-Dobaño, J.M.; Toubes, M.E.; Rodríguez-Núñez, N.; Rábade, C.; Lama, A.; et al. Combining clinical and analytical parameters improves prediction of malignant pleural effusion. Lung 2013, 191, 633–643. [Google Scholar] [CrossRef] [PubMed]
- Yasnogorodsky, O.O.; Shulutko, A.M.; Pinchuk, T.P.; Gandybina, E.G.; Kachikin, A.S.; Nasirov, F.N.; Moiseev, A.Y.; Gryaznov, S.E. Evolution of complex treatment of patients with non-specific pleural empyema. Khirurgiya Zhurnal Im NI Pirogova 2017, 4, 24–29. [Google Scholar] [CrossRef]
- Carlucci, P.; Trigiani, M.; Mori, P.A.; Mondoni, M.; Pinelli, V.; Casalini, A.G.; Conte, E.G.; Buggio, G.; Villari, L.; Marchetti, G. Competence in pleural procedures. Panminerva Med. 2019, 61, 326–343. [Google Scholar] [CrossRef]
- Agrawal, V.; Namdeo, H.; Singh, S.; Agrawal, R.; Acharya, H.; Sharma, D. Pediatric Empyema Thoracis: Jabalpur Image-Based Staging and Stage-Directed Decision-Making Algorithm. Indian J. Surg. 2020, 83, 966–973. [Google Scholar] [CrossRef]
- Das, N.N.; Lakhotia, S.; Verma, A. Surgical outcome of empyema thoracis patients with special correlation to pre-operative contrast-enhanced computerized tomography (CECT) thorax morphometry. Indian J. Thorac. Cardiovasc. Surg. 2021, 37, 164–174. [Google Scholar] [CrossRef]
- Franklin, J.; Talwar, A.; Addala, D.; Helm, E.J.; Benamore, R.; Rahman, N.M.; Gleeson, F.V. CT appearances of pleural infection: Analysis of the Second Multi-centre Intra-pleural Sepsis Trial (MIST 2) cohort. Clin. Radiol. 2021, 76, 436–442. [Google Scholar] [CrossRef]
- Tan Kendrick, A.P.; Ling, H.; Subramaniam, R.; Joseph, V.T. The value of early CT in complicated childhood pneumonia. Pediatr. Radiol. 2002, 32, 16–21. [Google Scholar] [CrossRef]
- Ahmed, O.; Zangan, S. Emergent Management of Empyema. Semin. Interv. Radiol. 2012, 29, 226–230. [Google Scholar] [CrossRef]
- La, I.; Im, K. Computed tomography of the pleura. Vestn. Rentgen. Radiol. 1997, 2, 11–15. [Google Scholar]
- Liu, F.; Huang, Y.C.; Ng, Y.-B.; Liang, J.H. Differentiate pleural effusion from hemothorax after blunt chest trauma; comparison of computed tomography attenuation values. J. Acute Med. 2016, 6, 1–6. [Google Scholar] [CrossRef]
- Page, M.J.; McKenzie, J.E.; Bossuyt, P.M.; Boutron, I.; Hoffmann, T.C.; Mulrow, C.D.; Shamseer, L.; Tetzlaff, J.M.; Akl, E.A.; Brennan, S.E.; et al. The PRISMA 2020 statement: An updated guideline for reporting systematic reviews. BMJ 2021, n71, 372. [Google Scholar] [CrossRef]
- Porcel, J.M.; Pardina, M.; Alemán, C.; Pallisa, E.; Light, R.W.; Bielsa, S. Computed tomography scoring system for discriminating between parapneumonic effusions eventually drained and those cured only with antibiotics. Respirology 2017, 22, 1199–1204. [Google Scholar] [CrossRef]
- Tsujimoto, N.; Saraya, T.; Light, R.W.; Tsukahara, Y.; Koide, T.; Kurai, D.; Ishii, H.; Kimura, H.; Goto, H.; Takizawa, H. A Simple Method for Differentiating Complicated Parapneumonic Effusion/Empyema from Parapneumonic Effusion Using the Split Pleura Sign and the Amount of Pleural Effusion on Thoracic CT. PLoS ONE 2015, 10, e0130141. [Google Scholar] [CrossRef] [PubMed]
- Arenas-Jiménez, J.; Alonso-Charterina, S.; Sánchez-Payá, J.; Fernández-Latorre, F.; Gil-Sánchez, S.; Lloret-Llorens, M. Evaluation of CT findings for diagnosis of pleural effusions. Eur. Radiol. 2000, 10, 681–690. [Google Scholar] [CrossRef] [PubMed]
- Stark, D.D.; Federle, M.P.; Goodman, P.C.; Podrasky, A.E.; Webb, W.R. Differentiating lung abscess and empyema: Radiography and computed tomography. AJR Am. J. Roentgenol. 1983, 141, 163–167. [Google Scholar] [CrossRef] [PubMed]
- Metintas, M.; Ucgun, I.; Elbek, O.; Erginel, S.; Metintas, S.; Kolsuz, M.; Harmanci, E.; Alatas, F.; Hillerdal, G.; Ozkan, R.; et al. Computed tomography features in malignant pleural mesothelioma and other commonly seen pleural diseases. Eur. J. Radiol. 2002, 41, 1–9. [Google Scholar] [CrossRef]
- Leung, A.N.; Müller, N.L.; Miller, R.R. CT in differential diagnosis of diffuse pleural disease. AJR Am. J. Roentgenol. 1990, 154, 487–492. [Google Scholar] [CrossRef] [PubMed]
- Çullu, N.; Kalemci, S.; Karakaş, Ö.; Eser, İ.; Yalçın, F.; Boyacı, F.N.; Karakaş, E. Efficacy of CT in diagnosis of transudates and exudates in patients with pleural effusion. Diagn. Interv. Radiol. 2014, 20, 116–120. [Google Scholar] [CrossRef]
- Waite, R.J.; Carbonneau, R.J.; Balikian, J.P.; Umali, C.B.; Pezzella, A.T.; Nash, G. Parietal pleural changes in empyema: Appearances at CT. Radiology 1990, 175, 145–150. [Google Scholar] [CrossRef] [PubMed]
- Aquino, S.L.; Webb, W.R.; Gushiken, B.J. Pleural exudates and transudates: Diagnosis with contrast-enhanced CT. Radiology 1994, 192, 803–808. [Google Scholar] [CrossRef]
- Takasugi, J.E.; Godwin, J.D.; Teefey, S.A. The extrapleural fat in empyema: CT appearance. Br. J. Radiol. 1991, 64, 580–583. [Google Scholar] [CrossRef] [PubMed]
- Koegelenberg, C.F.N.; Diacon, A.H.; Bolliger, C.T. Parapneumonic Pleural Effusion and Empyema. Respiration 2008, 75, 241–250. [Google Scholar] [CrossRef]
- Cameron, R.J.; Davies, H.R.H.R. Intra-pleural fibrinolytic therapy versus conservative management in the treatment of adult parapneumonic effusions and empyema. Cochrane Database Syst. Rev. 2008, 2, CD002312. [Google Scholar] [CrossRef] [PubMed]
- Kanai, E.; Matsutani, N. Management of empyema: A comprehensive review. Curr. Chall. Thorac. Surg. 2020, 2, 38. [Google Scholar] [CrossRef]
- Raj, V.; Kirke, R.; Bankart, M.J.; Entwisle, J.J. Multidetector CT imaging of pleura: Comparison of two contrast infusion protocols. Br. J. Radiol. 2011, 84, 796–799. [Google Scholar] [CrossRef] [PubMed]
- Reza, A.; Kalia, P.; Gandy, N.; Chana, H. Arterial versus pleural phase CT chest: An assessment of image quality and radiation dose. Clin. Radiol. 2020, 75, e8. [Google Scholar] [CrossRef]


| Study | Index Test: CT | Reference Standard | ||||||||||||||||
|---|---|---|---|---|---|---|---|---|---|---|---|---|---|---|---|---|---|---|
| Journal | Year | Duration | OCEBM | Included (n) | Mean Age (y) | Female (n) | Empyema (n) | Vendor * | i.v. Contrast (n) | Contrast Agent ** | Delay (s) | i.v. (mL) | Rate (mL/s) | Slice Thickness (mm) | Rater (n) | Experience (y) | Procedure *** | |
| Porcel [46] | APSR | 17 | 08–15 | 2 | 150 | 56 | NA | 23 | IV | 150 | b/c | ~60 | 90–100 | 3 | 3 | 2 | 20 & 20 | 2 B |
| Tsujimoto [47] | PloS one | 15 | 06–14 | 2 | 83 | 72 | 13 | 36 | NA | 23 | NA | NA | NA | NA | NA | 4 | 10 | 1/2 B |
| Jimenez [48] | ER | 99 | NA | 2 | 211 | 63 | 66 | 24 | II/III/VIII | 211 | c | NA | 100–120 | 2–3 | 6.5–10 | 2 | NA | 2/3 B |
| Stark [49] | AJR | 83 | NA | 4 | 63 | NA | NA | 58 | I | NA | a | NA | 150 | NA | 10 | 3 | NA | 1 (53%), A |
| Metintas [50] | EJR | 02 | 89–98 | 2 | 215 | NA | NA | 26 | V | 215 | NA | NA | NA | NA | 10 | 4 | NA | 2 B/C |
| Leung [51] | AJR | 90 | 85–89 | 2 | 74 | 60 | 21 | 9 | I/II | 58 | NA | NA | NA | NA | 10 | 2 | NA | 2 B |
| Cullu [52] | DIR | 14 | 10–12 | 3 | 106 | NA | 46 | 13 | IX | 58 | f | NA | 100–300 | 2–3.5 | 1 | 2 | NA | 2 B |
| Waite [53] | Radiology | 90 | NA | 2 | 85 | 57 | NA | 35 | I/II | 75 | a | ~20 | 120 | 0.9 | 10 | NA | NA | 2 B |
| Aquino [54] | Radiology | 94 | NA | 2 | 80 | 58 | 25 | 10 | II/VI | 80 | d | NA | 60–200 | 1.7 | 6–10 | 2 | NA | 2 B |
| Takasugi [55] | BJR | 91 | NA | 2 | 24 | NA | NA | 18 | VII | 14 | e | NA | 170 | NA | 10/30 | NA | NA | 1/2 B/D |
| Risk of Bias | Applicability Concerns | ||||||
|---|---|---|---|---|---|---|---|
| Study | Patient Selection | Index Test | Reference Standard | Flow and Timing | Patient Selection | Index Test | Reference Standard |
| Porcel [46] | low | low | unclear | unclear | low | low | low |
| Tsujimoto [47] | unclear | low | unclear | low | unclear | low | low |
| Jimenez [48] | low | low | unclear | high | low | low | low |
| Stark [49] | high | low | unclear | high | unclear | low | high |
| Metintas [50] | low | low | unclear | high | low | low | low |
| Leung [51] | low | low | unclear | high | low | low | low |
| Cullu [52] | unclear | high | unclear | low | unclear | unclear | unclear |
| Waite [53] | low | unclear | unclear | low | low | low | low |
| Aquino [54] | low | low | unclear | low | low | low | low |
| Takasugi [55] | unclear | low | unclear | unclear | unclear | low | low |
| Enhancement | Pleural Thickening | Loculation | Fat Thickening | Fat Stranding | |
|---|---|---|---|---|---|
| Sensitivity | 0.84 [95%-CI: 0.62–0.94] | 0.68 [0.56–0.77] | 0.52 [0.44–0.59] | 0.53 [0.47–0.60] | 0.39 [0.32–0.48] |
| Tau 2: 13.74 | 0.95 | 0.00 | 0.02 | 0.00 | |
| Q: 17.12 | 74.90 | 7.44 | 7.83 | 2.54 | |
| I 2: 76.60% | 72.00% | 19.30% | 10.60% | 0.00% | |
| Specificity | 0.83 [95%-CI: 0.75–0.89] | 0.87 [0.80–0.92] | 0.89 [0.82–0.94] | 0.91 [0.82–0.96] | 0.97 [0.94–0.98] |
| Tau 2: 0.11 | 12.14 | 0.48 | 0.82 | 0.00 | |
| Q: 7.20 | 142.75 | 23.15 | 31.68 | 1.7 | |
| I 2: 44.40% | 85.30% | 74.10% | 77.90% | 0.00% | |
| AUC (bivariate) | 0.86 | 0.81 | 0.75 | 0.68 | 0.79 |
Publisher’s Note: MDPI stays neutral with regard to jurisdictional claims in published maps and institutional affiliations. |
© 2021 by the authors. Licensee MDPI, Basel, Switzerland. This article is an open access article distributed under the terms and conditions of the Creative Commons Attribution (CC BY) license (https://creativecommons.org/licenses/by/4.0/).
Share and Cite
Zettinig, D.; D’Antonoli, T.A.; Wilder-Smith, A.; Bremerich, J.; Roth, J.A.; Sexauer, R. Diagnostic Accuracy of Imaging Findings in Pleural Empyema: Systematic Review and Meta-Analysis. J. Imaging 2022, 8, 3. https://doi.org/10.3390/jimaging8010003
Zettinig D, D’Antonoli TA, Wilder-Smith A, Bremerich J, Roth JA, Sexauer R. Diagnostic Accuracy of Imaging Findings in Pleural Empyema: Systematic Review and Meta-Analysis. Journal of Imaging. 2022; 8(1):3. https://doi.org/10.3390/jimaging8010003
Chicago/Turabian StyleZettinig, Desiree, Tugba Akinci D’Antonoli, Adrian Wilder-Smith, Jens Bremerich, Jan A. Roth, and Raphael Sexauer. 2022. "Diagnostic Accuracy of Imaging Findings in Pleural Empyema: Systematic Review and Meta-Analysis" Journal of Imaging 8, no. 1: 3. https://doi.org/10.3390/jimaging8010003
APA StyleZettinig, D., D’Antonoli, T. A., Wilder-Smith, A., Bremerich, J., Roth, J. A., & Sexauer, R. (2022). Diagnostic Accuracy of Imaging Findings in Pleural Empyema: Systematic Review and Meta-Analysis. Journal of Imaging, 8(1), 3. https://doi.org/10.3390/jimaging8010003