Article

Non-Destructive Testing of Archaeological Findings by Grating-Based X-Ray Phase-Contrast and Dark-Field Imaging

1
Erlangen Centre for Astroparticle Physics, Friedrich-Alexander-University Erlangen-Nuremberg, Erwin-Rommel-Strasse 1, 91058 Erlangen, Germany
2
Bayerisches Landesamt für Denkmalpflege, Dienststelle Bamberg, Schloss Seehof 1, 96117 Memmelsdorf, Germany
3
Deutsches Ledermuseum Offenbach, Frankfurter Straße 86, 63067 Offenbach, Germany
*
Author to whom correspondence should be addressed.
J. Imaging 2018, 4(4), 58; https://doi.org/10.3390/jimaging4040058
Submission received: 28 February 2018 / Revised: 28 March 2018 / Accepted: 10 April 2018 / Published: 14 April 2018
(This article belongs to the Special Issue Phase-Contrast and Dark-Field Imaging)

Abstract

:
The analysis of archaeological findings reveals the remaining secrets of human history. However, it is a challenging task to investigate and simultaneously preserve the unique remains. Available non-destructive examination methods are limited and often insufficient. Thus, we considered X-ray grating interferometry as a non-destructive and advanced X-ray imaging method to retrieve more information about archaeological findings. In addition to the conventional attenuation image, the differential phase and the dark-field image are obtained. We studied the potential of the scattering-sensitive dark-field and the phase-shift sensitive differential phase image to analyse archaeological findings. Hereby, the focus lies on organic remnants. Usually, the organic materials have vanished due to decomposition processes, but the structures are often preserved by mineralisation and penetration of corrosion products. We proved that the combination of the attenuation and the dark-field image in particular, enables a separation of structural properties for fabric remnants. Furthermore, we achieved promising results for the reconstruction of sub-pixel sized fibre orientations of woven fabric remnants by employing the directional dark-field imaging method. We conclude from our results that a further application of X-ray dark-field imaging on wet organic findings and on the distinction of different types of organic remnants at archaeological findings is promising.

1. Introduction

Archaeological findings are the remaining traces of human history. By investigation of these ancient objects we get an insight in the daily life and human habits of bygone eras. As long as the archaeological findings are embedded in their original environment, they constitute unique evidence of the past. The discovery of archaeological sites, e.g., due to building projects, initiates a process of recovery, conservation and restoration. The primary objective is the preservation of the ancient remnants of cultural heritage. Cultural heritage management plays an important role in managing the care of archaeological sites, supporting excavations and the following conservation process of archaeological findings. In addition to the importance as man-made artefacts, archaeological findings may reveal answers concerning dating, provenance, the way of deposition, the context of other findings and the former surrounding like ritual wrapping with textiles or contact to clothes of the deceased. After excavation, archaeological findings remain as unique witnesses of the archaeological site. Thus, one of the tasks of archaeological and conservation science is to investigate these remains very carefully and non-destructively [1,2]. Therefore, X-ray imaging is a favoured analysis method. The application of X-rays on archaeological findings already happens by digital radiography, computed tomography [3,4], X-ray fluorescence or X-ray diffraction methods [5]. Investigating metal artefacts by X-ray imaging is a common way to get information about the material, the dimension and the preservation status of the enclosed finding. This method plays an important role if artefacts are lifted with the surrounding soil (block excavation) due to a fragile preservation status or in case of assumed organic remains. We propose the application of X-ray differential phase-contrast and dark-field imaging on archaeological findings as an extended X-ray imaging method.
The grating-based Talbot-Lau interferometer setup for phase-contrast imaging was introduced in 2006 by Pfeiffer et al. [6]. An enhancement of the conventional X-ray imaging is given by the access to the real part of the complex refractive index of an object material. The method enables us to get more information about the inner structure and material properties by providing two additional images: the differential phase image and the dark-field image. The differential phase image reveals gradients in the real part of the refractive index, which shows better contrast for imaging light elements [7]. In addition, the X-ray dark-field image can be used for the inspection of porosity [8] and visualisation of structures below the spatial resolution of the detector [9]. The dark-field signal is mainly based on small angle X-ray scattering (SAXS) caused by variations in the electron density of an inhomogeneous sample [10,11]. As a further analysis tool, directional X-ray dark-field imaging is used in order to reconstruct fibre orientations of micrometer-sized aligned structures which are not resolvable directly [12,13,14]. The method is applicable for the analysis of bones [15,16,17] or the characterisation of fibre alignments in polymers [18,19,20]. An extension of directional dark-field imaging to a 3D analysis of fibre orientations is done by tensor tomography [21,22,23].
Applying this novel interferometric X-ray imaging method on archaeological findings could improve the non-destructive analysis compared to conventional X-ray imaging. In this paper the investigation of archaeological findings by grating-based X-ray phase-contrast and dark-field imaging with a high-energy setup is presented. In particular, X-ray dark-field imaging proved to be a promising examination method for archaeological findings. First, we analyse X-ray differential phase-contrast and dark-field imaging regarding the differentiation of structural properties. In particular, the analysis of mineralised organic remains will be addressed. Second, we examine the influence of soil particles adhered to archaeological findings. In this regard, we additionally evaluate the applicability of X-ray phase-contrast imaging as an extended X-ray prospection method to obtain more information on enclosed findings in block excavations, especially with the focus on detecting mineralised organic remnants. Third, we employ the directional dependence of the X-ray dark-field to reveal fibrous structures and to reconstruct structure orientations in samples containing mineralised fabric remnants. Finally, we discuss the advantages and occurring problems of applying X-ray grating interferometry on archaeological findings.

2. Materials and Methods

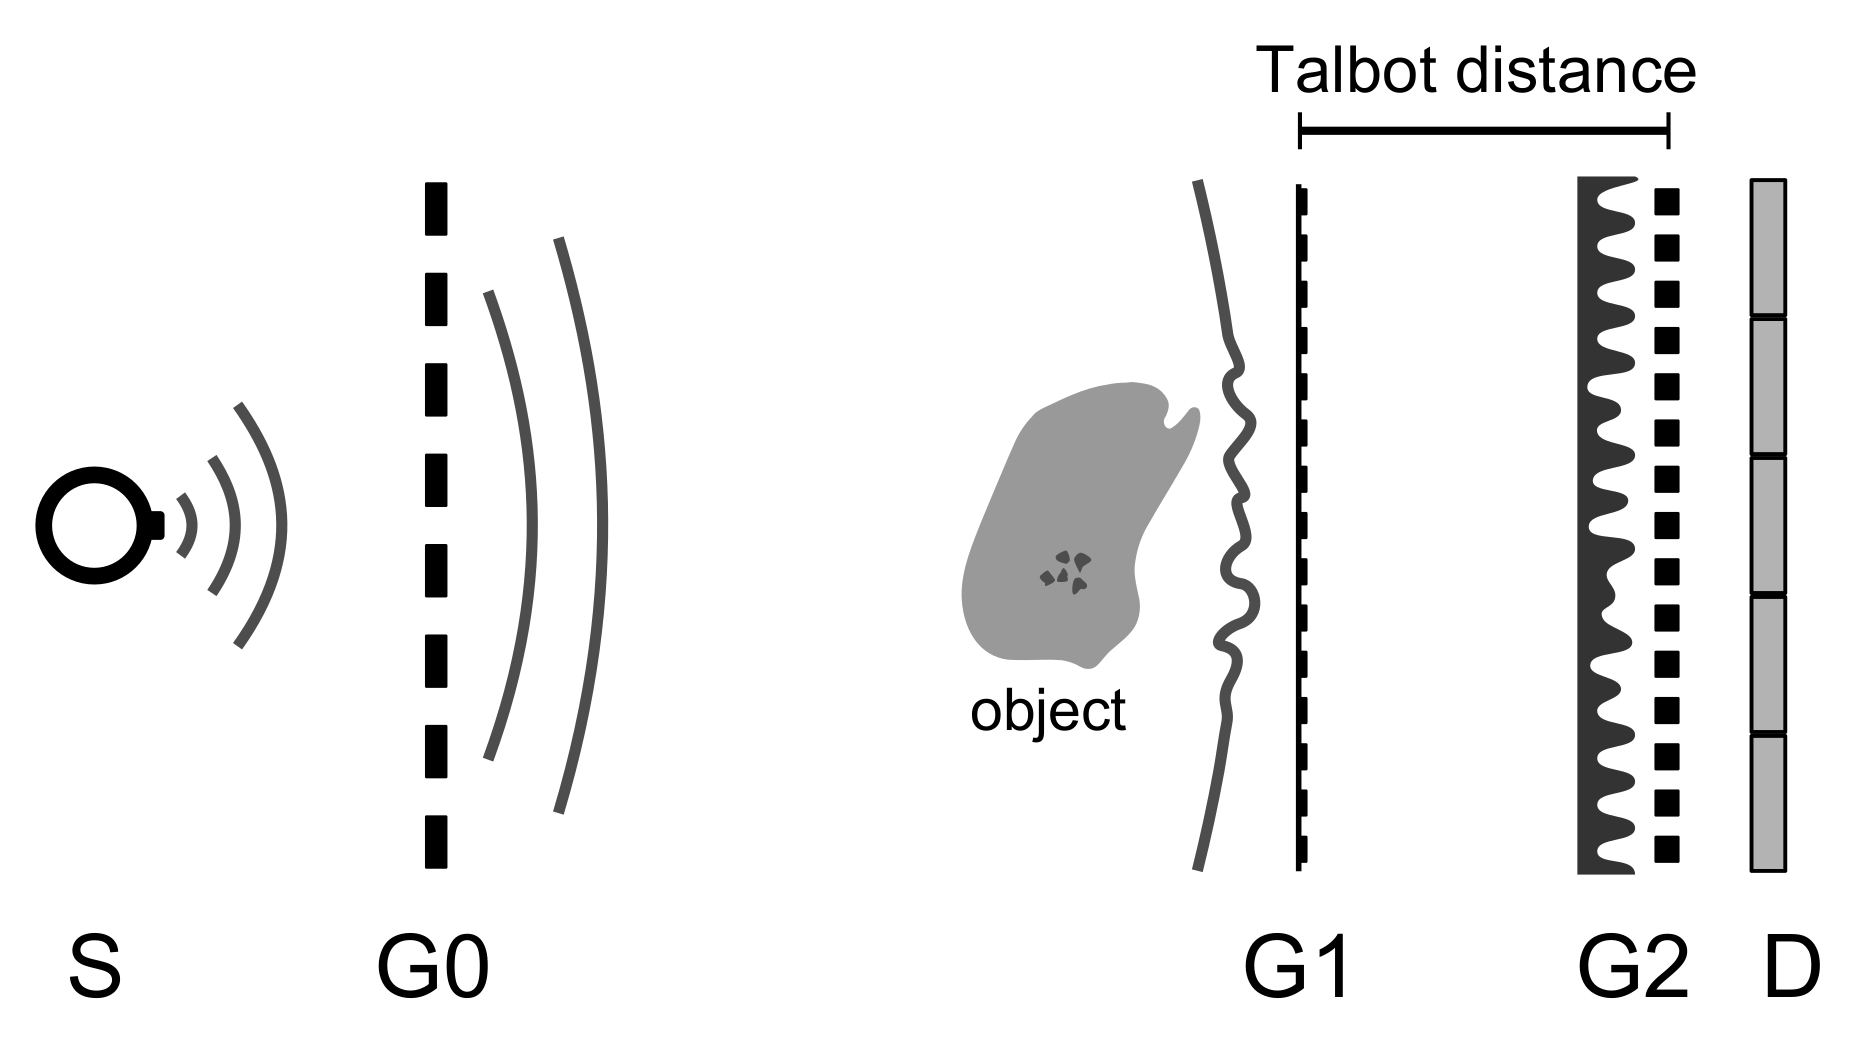
2.1. Grating-Based X-ray Phase-Contrast Imaging

X-ray phase-contrast imaging provides access to both the imaginary and the real part of the complex refractive index
n = 1 δ + i β .
In common X-ray imaging, the attenuation coefficient μ = 4 π β / λ , with λ being the wavelength of the interacting photons, comprises the complete image information. By use of a so-called Talbot-Lau interferometer also the phase shift Φ = 2 π δ / λ is accessible. The setup of a Talbot-Lau interferometer is sketched in Figure 1. In this work we used a setup which consists of a conventional X-ray tube of low brilliance, two absorption gratings, one phase grating and a flat-panel X-ray detector. The basic concept relies on the Talbot effect. The phase grating G 1 imprints a phase-shift onto the incoming wavefront. In certain so-called fractional Talbot distances behind the grating, an intensity pattern with maximal contrast can be measured, which reproduces the periodic structure of G 1 [24,25]. Due to the extended focal spot of the X-ray source, a source grating G 0 is needed. The idea is to generate many mutually incoherent slit sources, such that the resulting intensity patterns created by each single slit overlap constructively [6]. As the detector pixel size is larger than the period of the interference pattern, it is not possible to resolve the pattern directly. The third grating G 2 with absorbing lamellae has the same period as the Talbot pattern and is placed at the position of its appearance. By laterally shifting G 2 perpendicular to the beam path and to the grating lines, the intensity modulation is sampled. Thereby, the G 2 grating is moved in fractions of its period p 2 . This process is called phase-stepping. At every phase-step, an image is acquired, which leads to a sinusoidal intensity curve in each pixel as a function of the phase-step position [7]. This phase-stepping curve is measured once for a reference and once for an object measurement. The intensity variation I for different phase-step positions x is given by
I ( x ) = I 0 + A · sin 2 π p 2 x + φ .
The curve parameters mean intensity I 0 , amplitude A and phase φ are reconstructed for each pixel either by Fourier analysis or least-square fit. The contrast or visibility of the curve is defined as V = A / I 0 . The obtained parameters of the measured reference curve and object curve are used to calculate the three mentioned images attenuation Γ , differential phase Δ Φ and dark-field Σ :
Γ : = ln I 0 , obj I 0 , ref , Δ Φ : = φ obj φ ref , Σ : = ln V obj V ref .
The conventional attenuation image reveals the amount of photons absorbed by passing through the sample. The differential phase image describes the first derivative of the phase shift that the sample adds to the incoming X-ray wave front. Thus, edges are enhanced and differences between light elements get apparent [26]. The dark-field image originates from the reduction of contrast in the Talbot pattern. Hereby, a visualisation of structures below the spatial resolution of the imaging system is achieveable [9,10]. Additionally, we introduce the normalised scatter image, which follows the definition of the R-value [27]: R = Σ / Γ . The normalised scatter image is independent of the thickness and particularly enhances scattering properties. In this regard, plotting the dark-field values pixelwise over the attenuation values in a so-called scatter plot enables a differentiation of materials by both attenuation and scattering properties [28].

2.2. Directional X-ray Dark-Field Imaging

Dark-field images include signals which occur due to scattering at micrometer-sized structures, which can not be resolved directly [10,29,30]. A typical Talbot-Lau interferometer uses line gratings, which generates sensitivity to the wave front gradient in the direction perpendicular to the grating bars. Thus, scattering and phase shifts along the direction of the grating lines have no influence on the contrast of the Talbot pattern. The directional dependence of the dark-field image holds the capability of retrieving information about the angular variations of the local scattering power of a sample [12,14]. For that purpose, the object is rotated around the beam axis and at least three images at different angular orientations of the object are acquired. The periodical variation of the dark-field signal Σ depending on the angular orientation α of the sample with respect to the grating bars follows [12]
Σ = A α · cos ( 2 · ( α + Φ α ) ) + I α .
By extracting the parameters A α , Φ α and I α information about the main fibre orientation α = Φ α , the average scattering strength I α , the anisotropic part of the scattering strength A α and the degree of anisotropy V α = A α / I α is obtainable [16,20].

2.3. The Experimental Setup

The measurements of the archaeological findings were performed using a laboratory-based X-ray phase-contrast setup with a MEGALIX CAT Plus 125 medical X-ray tube (Siemens, Munich, Germany). X-ray spectra of maximum peak voltages from 60 to 120 kVp were generated by a tungsten anode and 0.3 mm copper filtration. For all measurements, nine phase-steps over one period were acquired with a Dexela 1512 X-ray flat panel detector (PerkinElmer, Waltham, MA, USA) with 74.8 μ m pixel size in 2 × 2 binning mode. The grating parameters and further setup details are comprised in Table 1. The used grating set is a result of an optimisation process, published in [31]. The gratings are made of gold and are fabricated by the Karlsruhe Nano Micro Facility/Karlsruhe Institute of Technology using deep X-ray lithography [32]. The archaeological findings were fixed to a rotation plate in order to retrieve images at different angular positions by rotating the sample around the beam axis. In addition, the sample tray could be moved in the object plane to cover larger samples and to acquire reference images.
In Figure 2 on the left-hand side the (monochromatic) simulated visibilities, achievable for the used setup parameters (grating details and distances, see Table 1) for energies between 25 to 120 keV, are shown in a so-called visibility curve. Further details about the used wave-field simulation can be found in [33]. The energy spectra for 60 and 120 kVp (provided by [34]) are overlaid to the same plot. Additionally, the shown spectra include a 0.3 mm copper filtration and the detection efficiency of 600 μ m CsI. On the right-hand side the measured reference visibilities in each pixel are depicted in a visibility map for the applied spectra of 60, 80, 100 and 120 kVp. Since the visibility measured by using a broad X-ray spectrum is a weighted average of the contributing monoenergetic visibilities, the shape of the spectrum is significant. Therefore, the spectrum must fit well to the monoenergetic visibility curve depicted in Figure 2 in blue in order to achieve a high reference visibility in the polychromatic case. We obtain the best visibilities for energies around 45 keV, leading to a high measured reference visibility of about 37% for the 60 kVp spectrum. For the further applied spectra of 80, 100 and 120 kVp the reference visibility drops to 22%, 18% and 16%, respectively. For the dark-field image the resulting object visibility compared to the reference visibility is decisive. In case of highly absorbing materials in a sample, beam hardening effects also play an important role for the dark-field signal generation [35,36]. Cutting the lower energies of the spectrum, even higher object visibilities than reference visibilities can be reached in some cases.

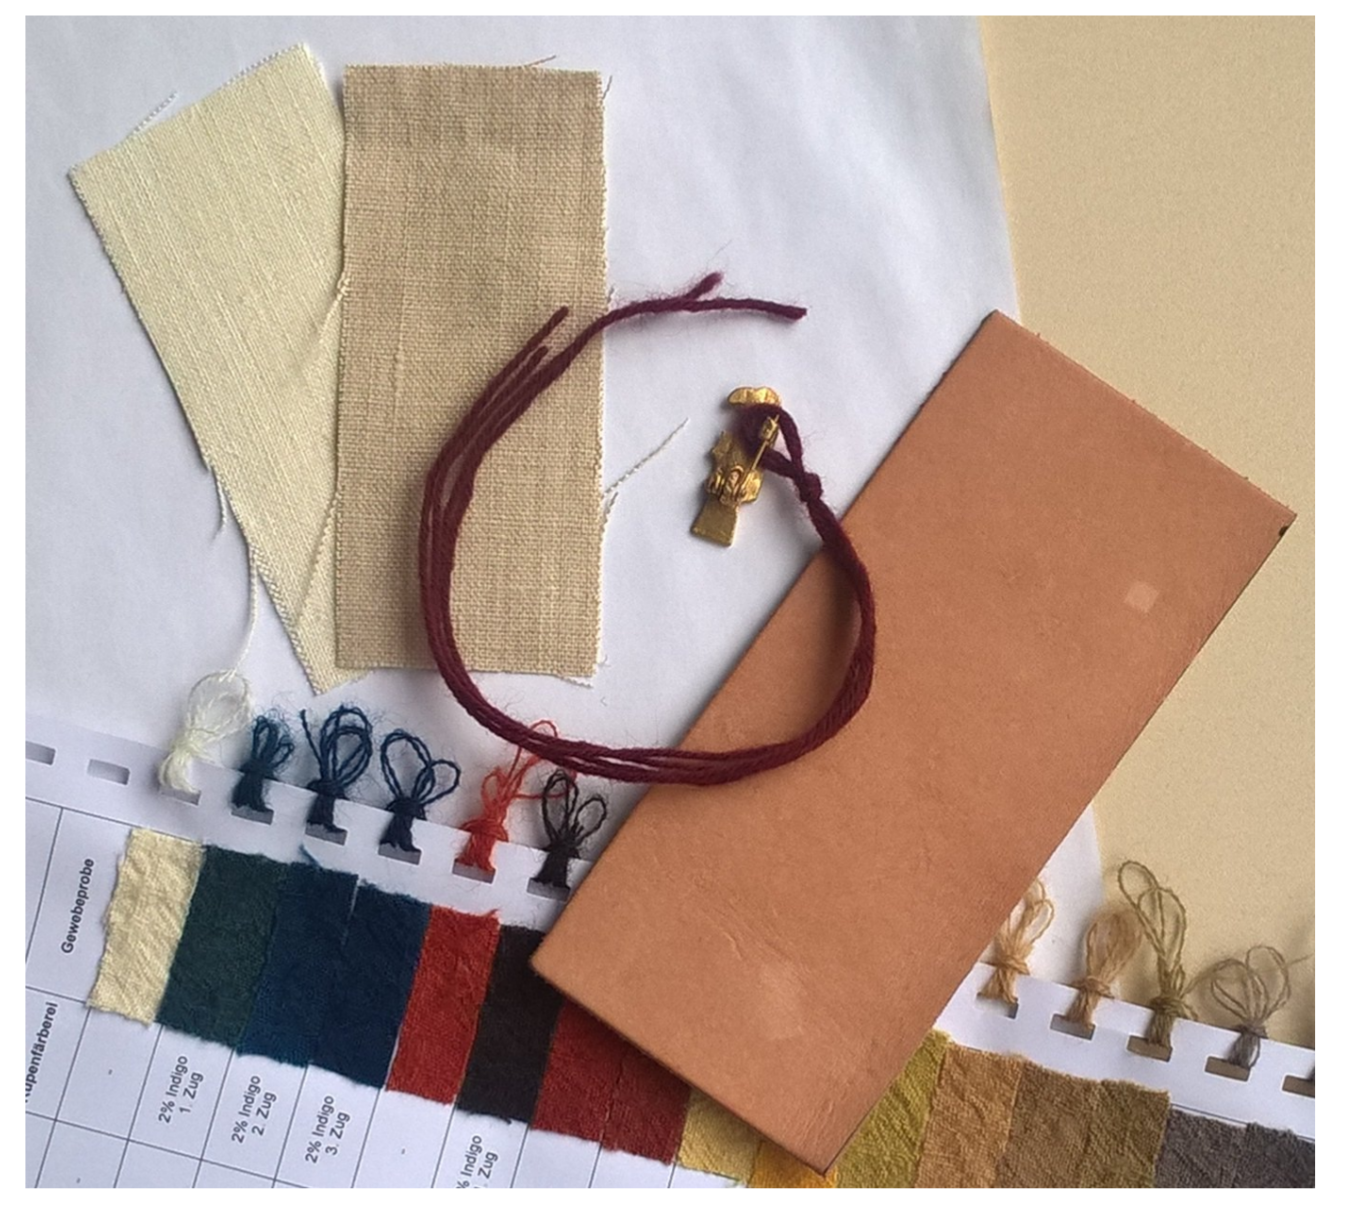
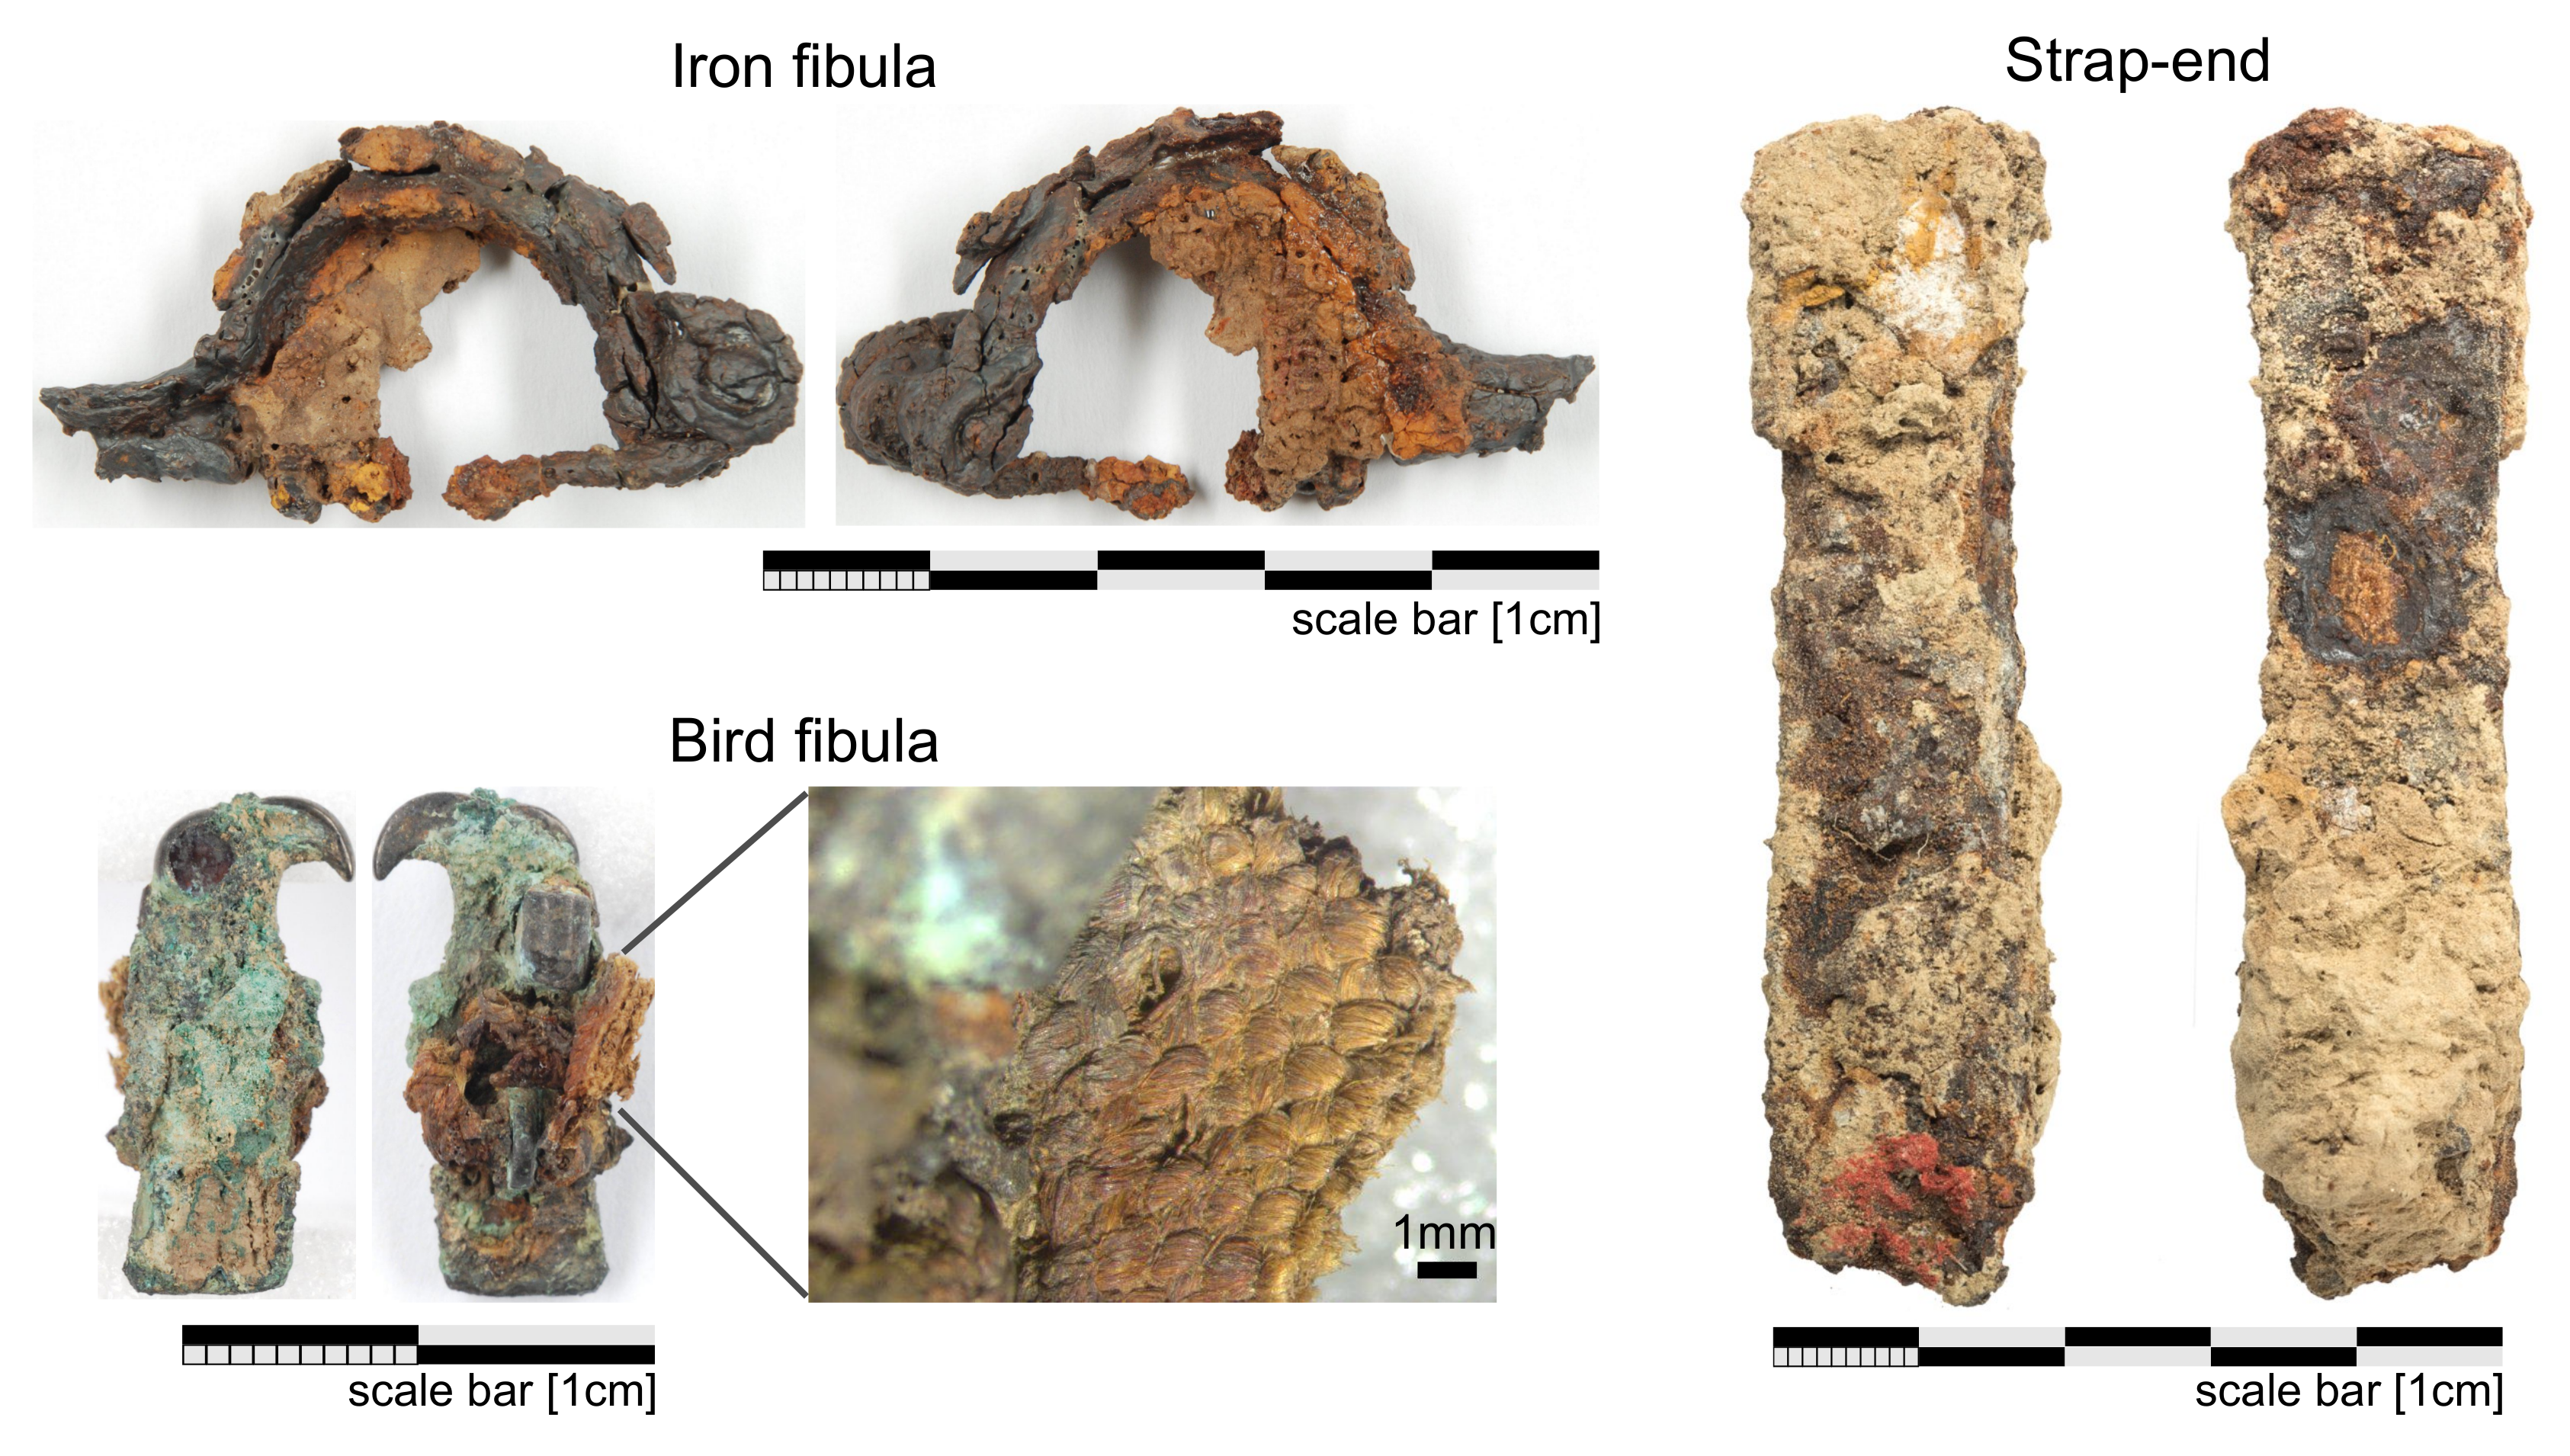
2.4. Details about the Examined Test and Archaeological Samples

The test samples and the archaeological findings were provided by the Bavarian State Office for Heritage Management (BLfD, “Bayerisches Landesamt für Denkmalpflege”). A photography of the test samples is shown in Figure 3. The test samples consist of different types of fabric, comprising woven linen and hemp, single woolen threads dyed with different natural dyestuffs, a piece of cowhide leather and a replicated, non-ferrous metal fibula featuring a bird motif with some woolen threads tied to it. The organic test samples are typical materials expected to occur in a mineralised form attached to metallic findings.
Moreover, we analysed archaeological findings chosen from two early medieval cemeteries (Regensburg-Burgweinting and Baar-Oberbaar) which date back to the sixth century after Christ. The buried persons were pagans to whom the relatives gave their personal belongings for representing their status in the beyond. Therefore, a variety of metal artefacts — weaponry, cloth fasteners or metal applications — is preserved. Metallic parts of findings are preserved due to the processes of corrosion organic materials. Normally, organic materials would have vanished because of decomposition. However, if organic substances are adherent to metallic materials, they are penetrated by soluble corrosion products. A partial or full transformation of the organic material or a negative imprint of the organic structure in the corrosion layer follows. This enables an analysis of textiles and other organic materials which are important for context-related information, e.g., on cultural history or on trade links.
In this work we investigated an iron fibula, an iron strap-end and a bird fibula which are depicted in Figure 4. The iron fibula and the strap-end have a prominent iron core. The bird fibula is made of non-ferrous metal and is gold-plated. The samples represent typical findings of different metals and mineralised organic remains at different stages of processing. The iron fibula shows a fragment of mineralised linen fabrics at the inner side. The nearer the fabric remnants are to the iron parts, the higher is the proportion of metallic elements in the fabric part. Investigations shall be undertaken to determine whether it is feasible to separate different states of mineralised fabrics by the dark-field and the normalised scatter image. While the fibulas are fully exposed, the iron strap-end differs from the other samples by demonstrating soil remnants on the outer parts. Below the layer of soil, organic remnants are presumed. It is necessary to evaluate how much soil particles affect the analysis of X-ray phase-contrast and dark-field images. The bird fibula also represents an interesting sample regarding mineralised fabric remnants, which are visible around the pin. The question is raised as to whether spinning directions in mineralised fabrics are reconstructable. This may be enabled by applying directional X-ray dark-field imaging.

3. Results

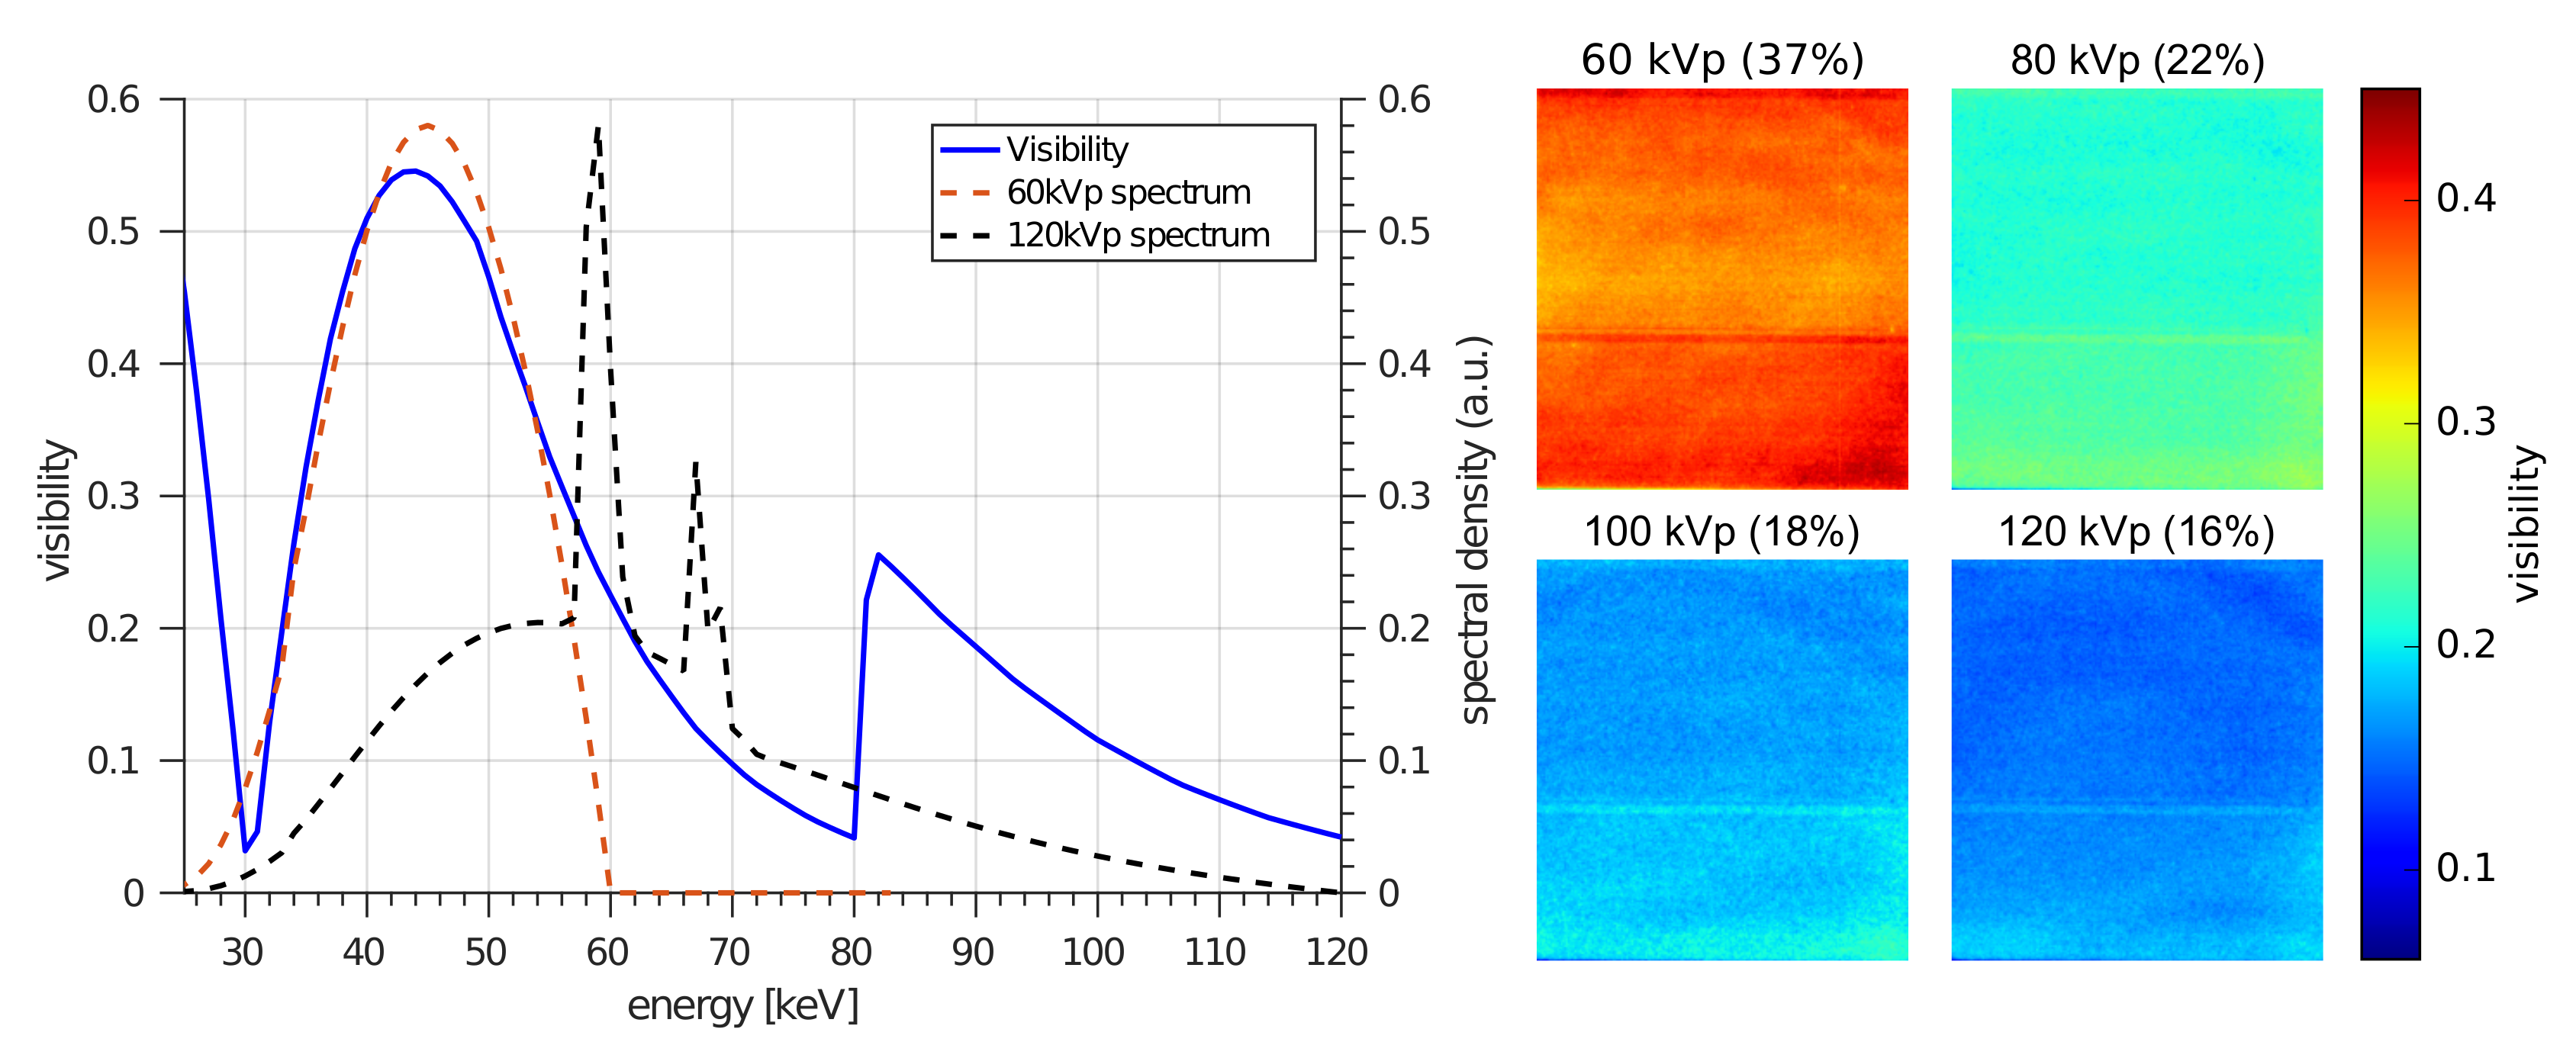
3.1. Pre-Measurements on Test Samples

One aim of the investigation of archaeological findings is the detection and analysis of mineralised fabric remnants. These are potentially visible by dark-field imaging due to their scattering properties compared with non-fibrous materials. In order to test the potential of dark-field and differential phase images for visualisation of organic materials, different test samples (photography Figure 3) are imaged. In Figure 5, the results of the attenuation, differential phase, dark-field and normalised scatter image are shown. In the bottom row, a detailed view of the woven fabrics and some threads is given for the chosen region of interest which is marked by a red rectangle. The applied energy spectrum for the reference materials was 60 kVp and the images were acquired with 7.5 mAs per phase-step. A lower energy spectrum would be more suitable for these reference materials. However, the choice for the used (higher) energy spectrum is motivated by the aspect of imaging iron-based archaeological findings with attached fabric remnants. Because of the low attenuation of woven materials at these energies, the contrast in the attenuation image is quite weak. The differential phase image shows the texture of the woven fabrics fairly well. This is better visible in the detailed view, which reveals the threads. However, the contrast is low. The periodic structure over the whole differential phase image occurs due to Moiré artefacts which can occur due to slight mechanical instabilities during the phase-stepping procedure. These get more obvious due to the small range of depicted differential phase values from −0.06 to 0.06. In the following analysis we will particularly focus on the dark-field image and the normalised scatter image, which offer the best contrast for organic materials, even at the chosen 60 kVp energy spectrum. All types of fabrics of the test samples are clearly visible, including structural information. A defect in the piece of leather on the right side is revealed. Some lines presenting cracks on the surface of the leather are also apparent. The dark-field shows each sling of the threads even those lying on the leather or the woven fabrics. Hence, in particular, the dark-field image and the normalised scatter image have the potential for investigating organic remains in archaeological findings.

3.2. X-ray Phase-Contrast Imaging of Archaeological Findings

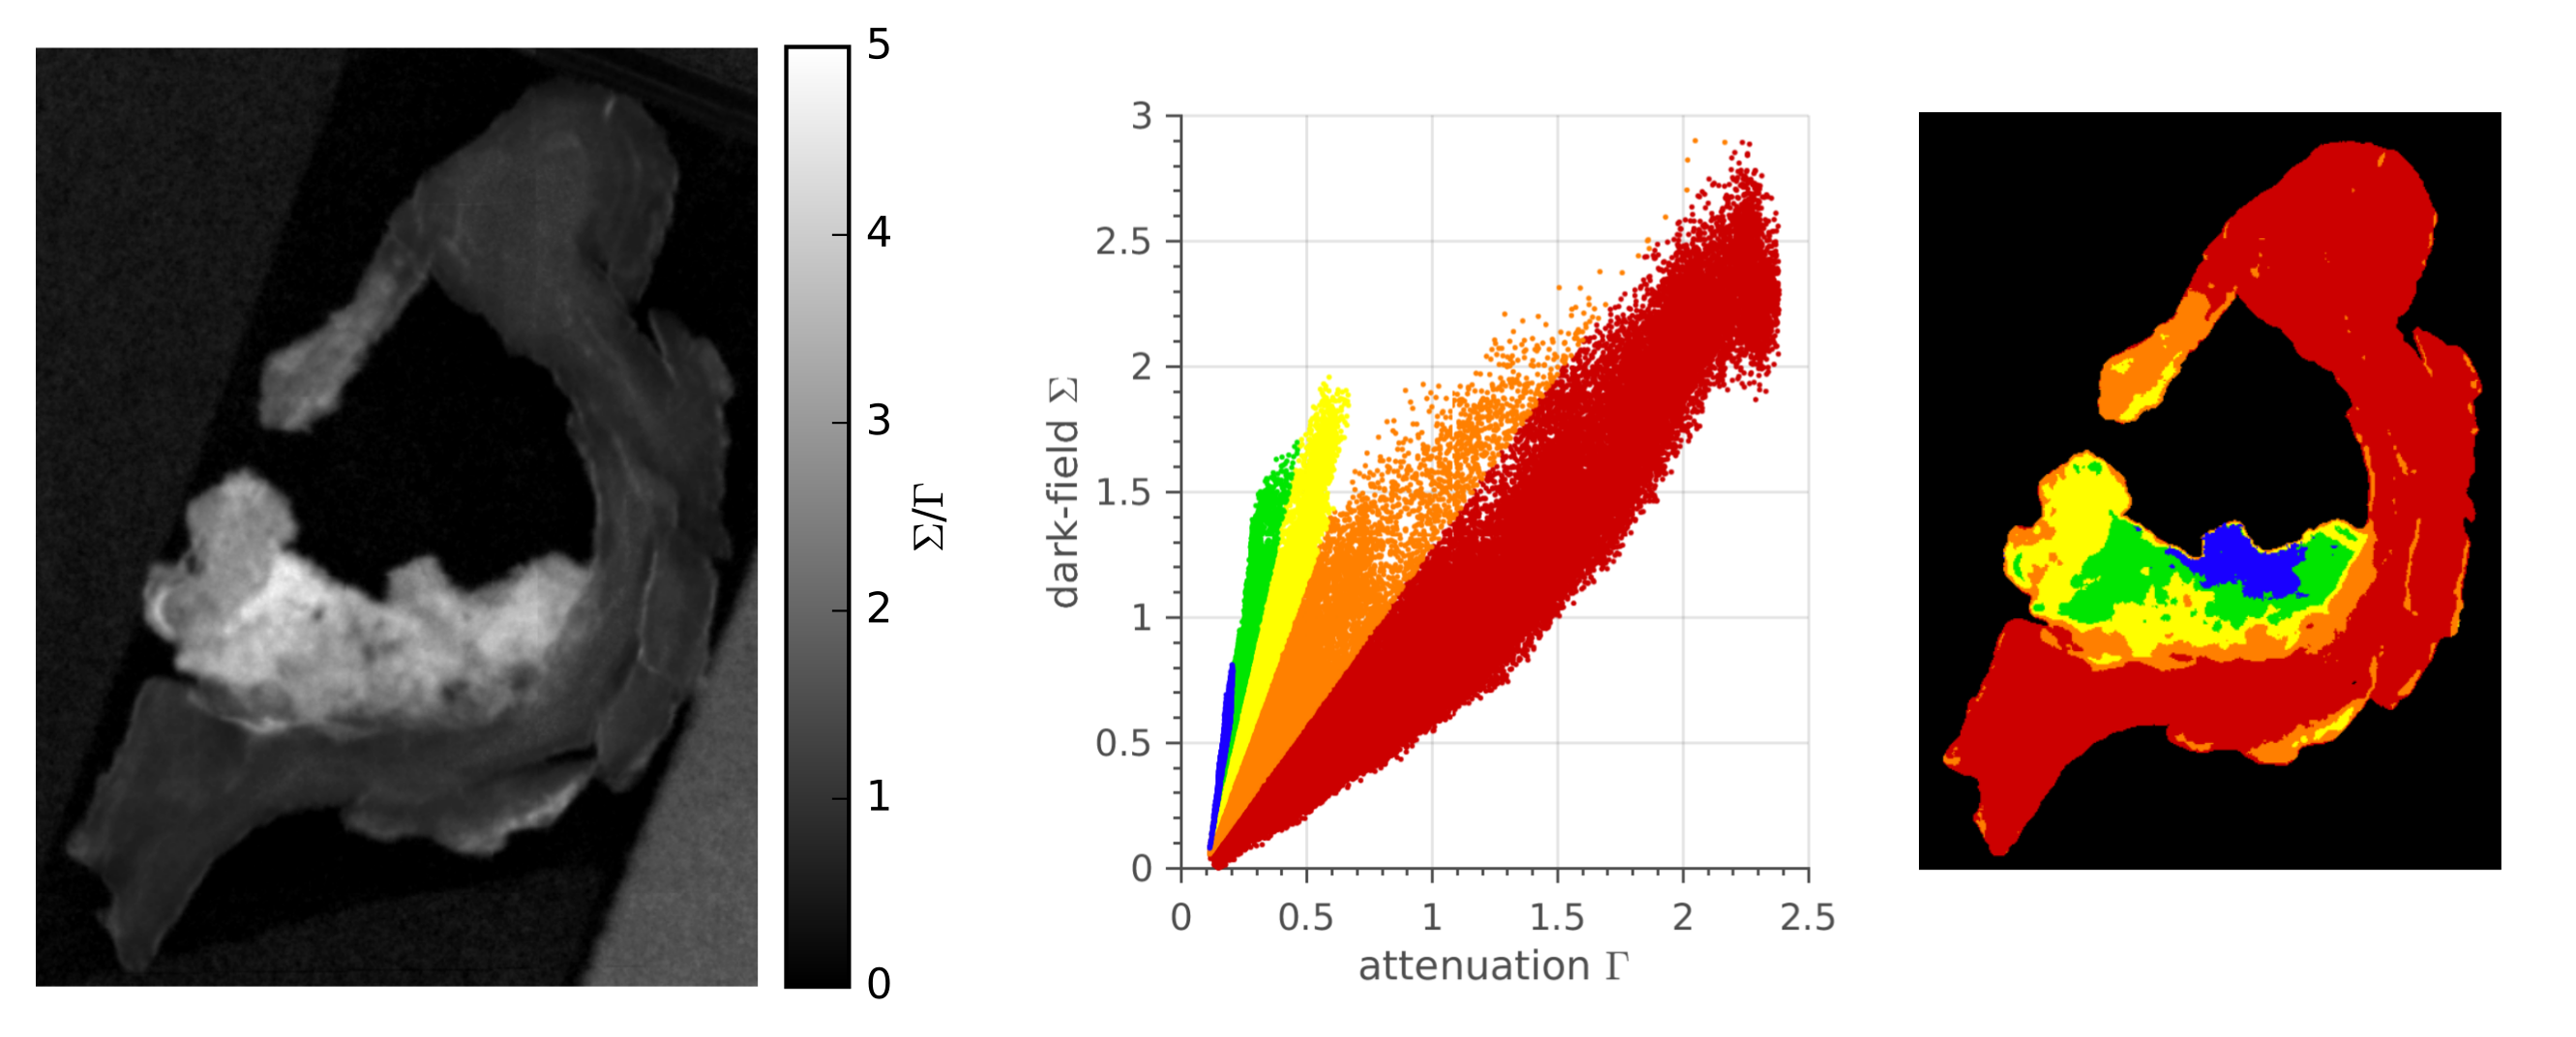
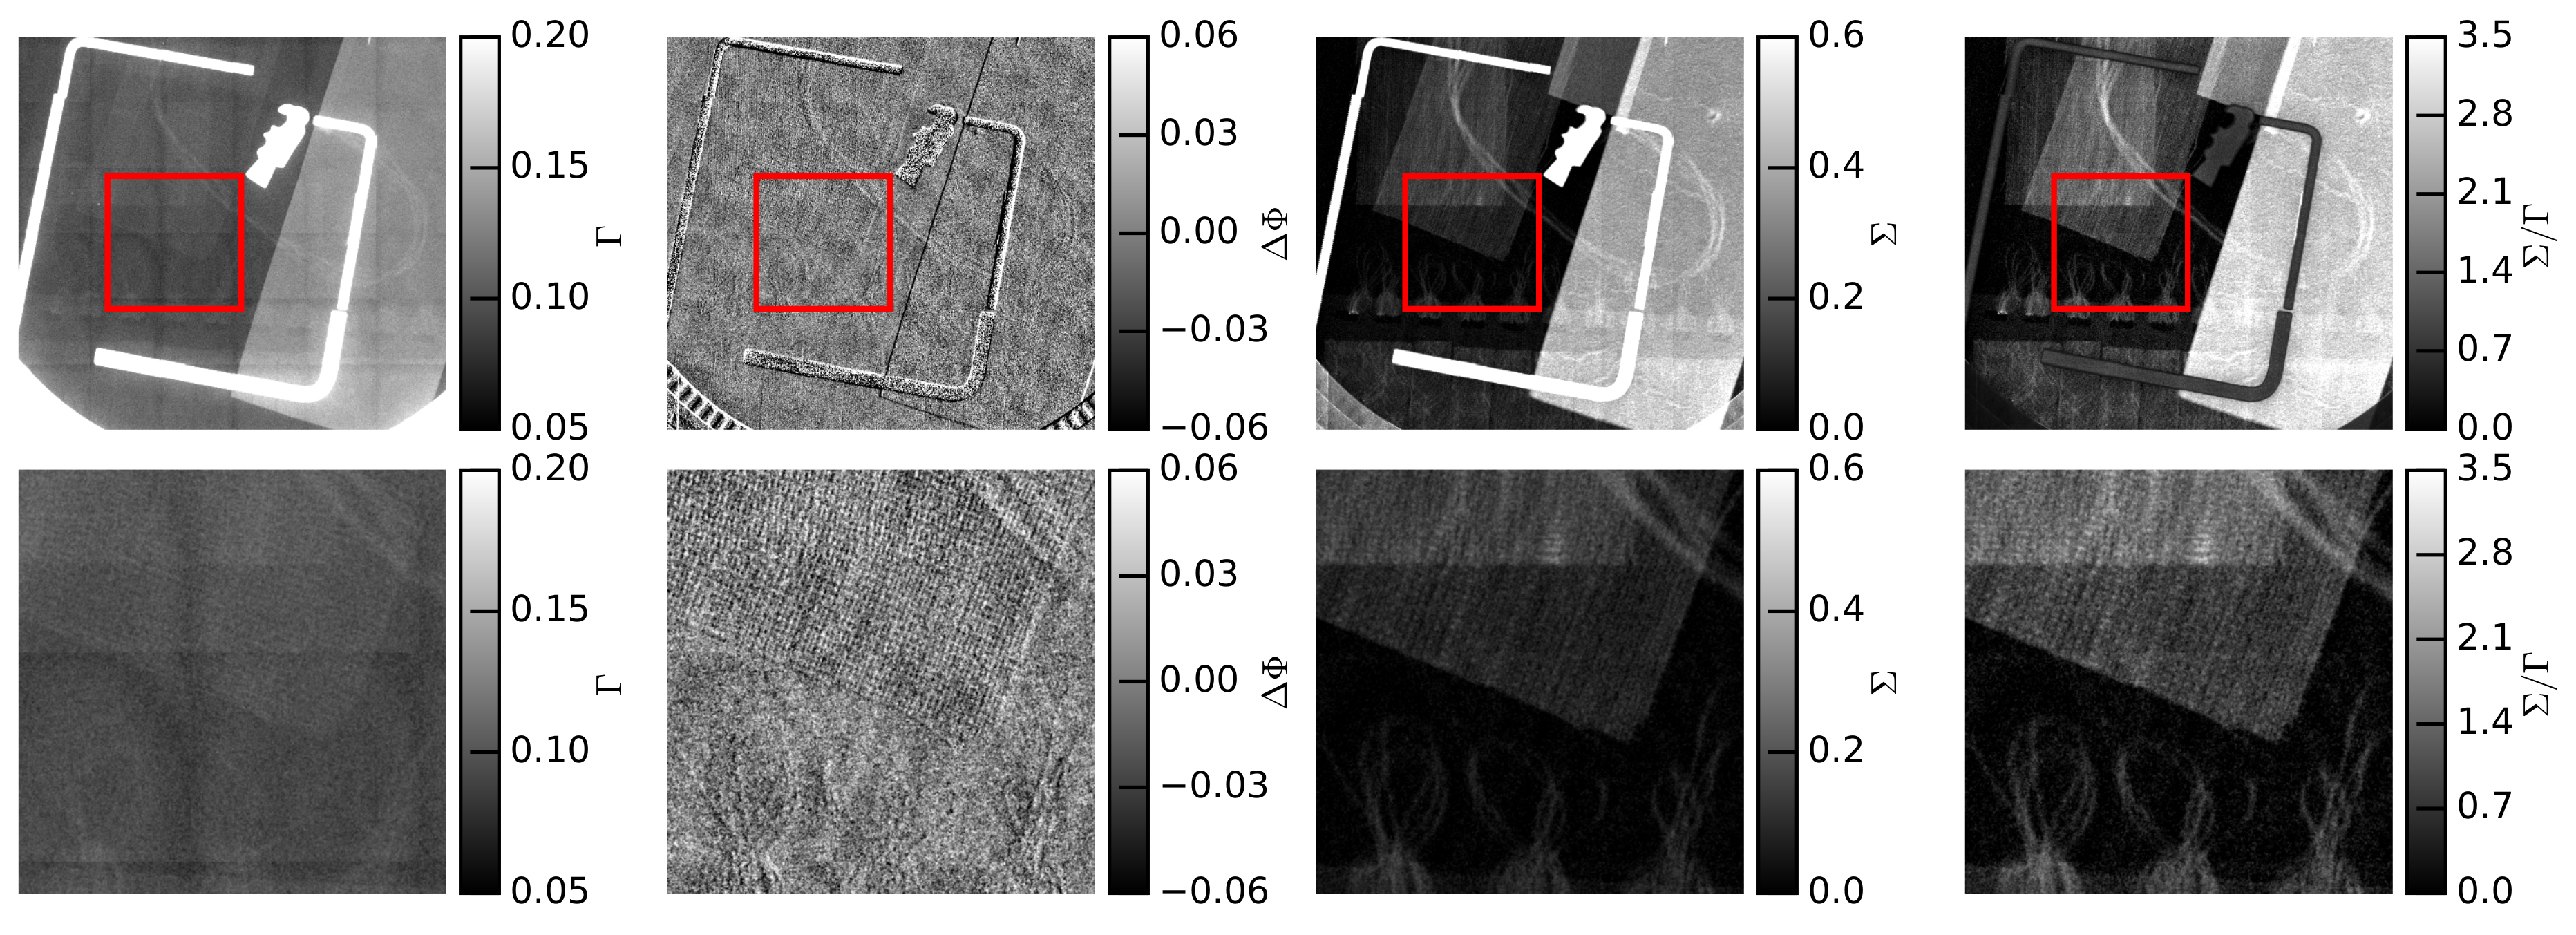
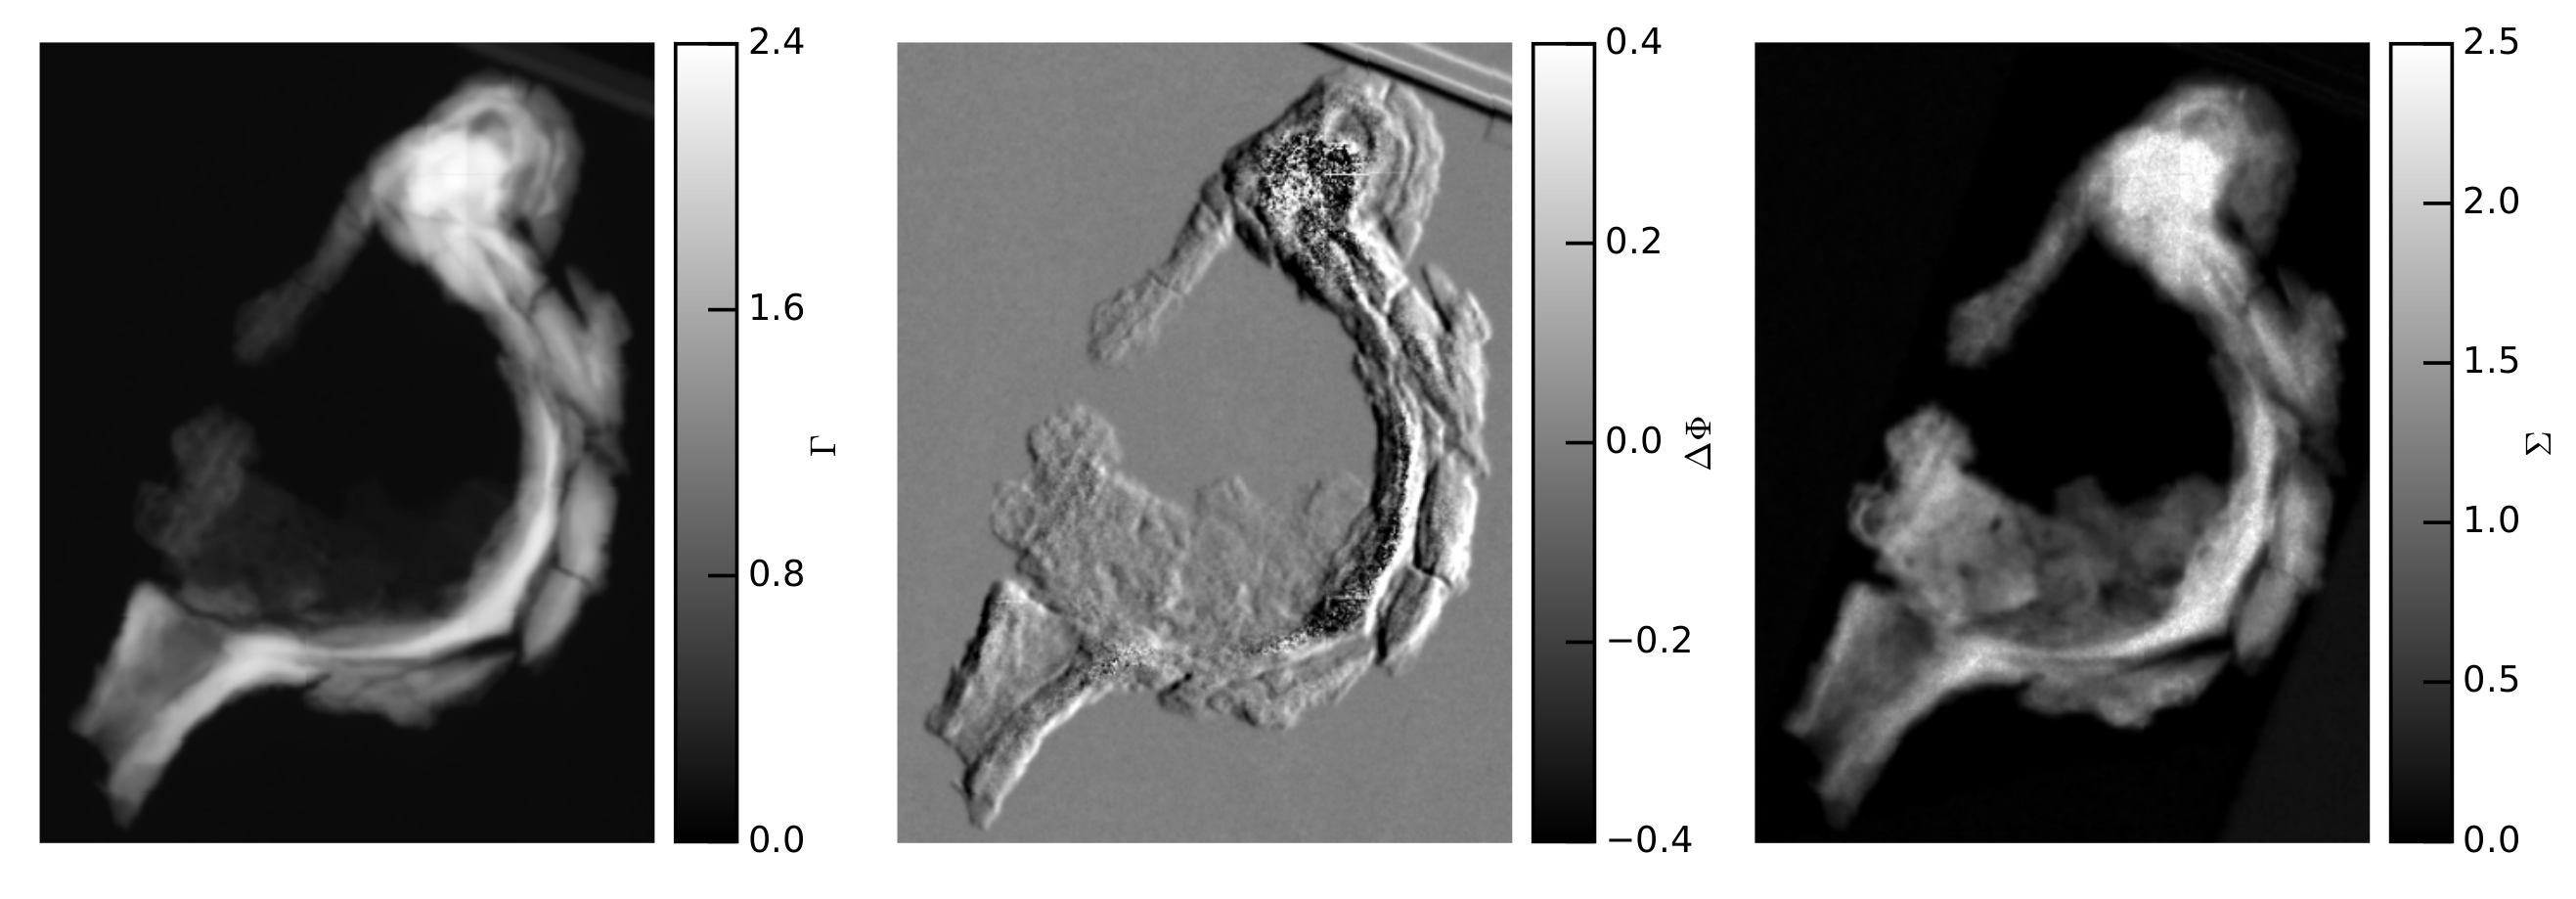
3.2.1. Normalised Scatter Image and Scatter Plot of an Iron Fibula

In Figure 6 attenuation, differential-phase and dark-field images of the iron fibula are shown. The images were acquired at 80 kVp and 22.5 mAs per phase-step. The highly absorbing part, clearly visible in the attenuation image, represents the iron-based bow of the fibula. Due to beam hardening the mean energy of the spectrum is strongly shifted to higher energies resulting in this case in a lower visibility. In addition, the highly absorbing object regions lead to low photon statistics and a noise level surpassing the visibility of the phase-stepping curve. This leads to saturated dark-field values and no reasonable reconstruction of phase information in the iron part of the fibula is possible. Between the pin rest and iron bow of the fibula, some mineralised fabric remains are preserved. These are better visualised in the dark-field and the differential phase image. The structure of the mineralised textile is clearly enhanced by dark-field imaging. Thus, interferometric X-ray imaging can be utilized for further analysis of archaeological findings, especially for non-metal parts of a sample. The differential phase image enhances edges.
To enhance the scattering parts in the iron fibula, the thickness-independent normalised scatter image is viewed (Figure 7, left). The fabric remnants at the inner side of the fibula and also at the outer bottom side are highlighted. The iron part shows sharper contours and a uniform surface in separated segments. Next to the normalised scatter image, the scatter plot for the iron fibula is depicted in Figure 7. The coloured regions in the plot were chosen manually by searching frequent occurrences of certain Σ - Γ -values. The chosen colours in the plot refer to different regions, which are shown in the image on the right. Blue, green and yellow illustrate the mineralised fabrics, which are clearly enhanced by the normalised scatter image. In red and orange the iron part of the fibula and the transitions from iron to mineralised fabric are visible. The fabric remnants nearest to the strong iron core (orange and yellow) reach higher attenuation values than the blue and green region. In particular, the high dark-field values and the low attenuation values are characteristic for the blue area. The degree of mineralisation might be at its lowest, or the kind of fabric differs from the surrounding fabric remains. The appropriate dark-field and attenuation pairs lie on a straight line (blue) on the left-hand side in the scatter plot, indicating similar structural and material properties of the blue region. This shows that analysing the normalised scattering image and the scatter plot might be a helpful tool to examine archaeological findings, in particular, regarding organic remains.

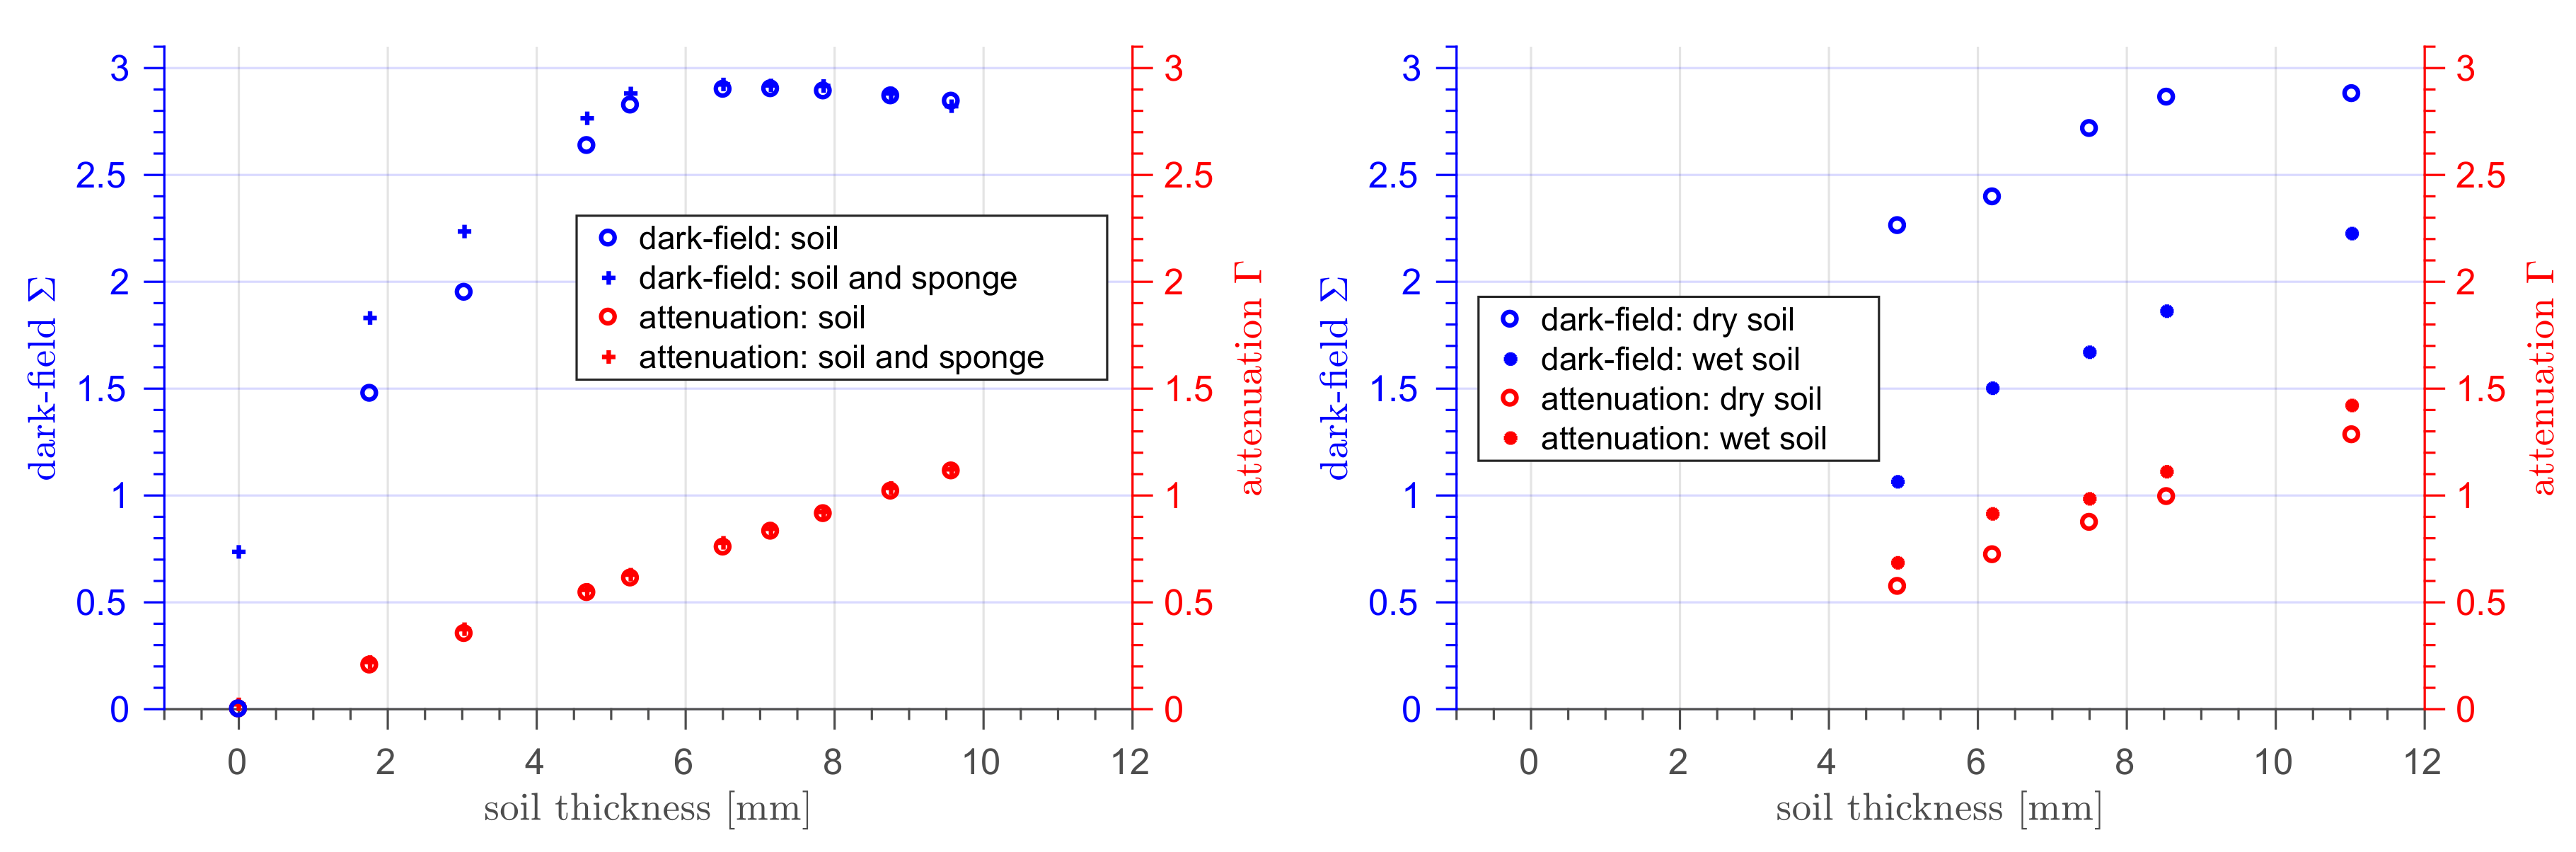
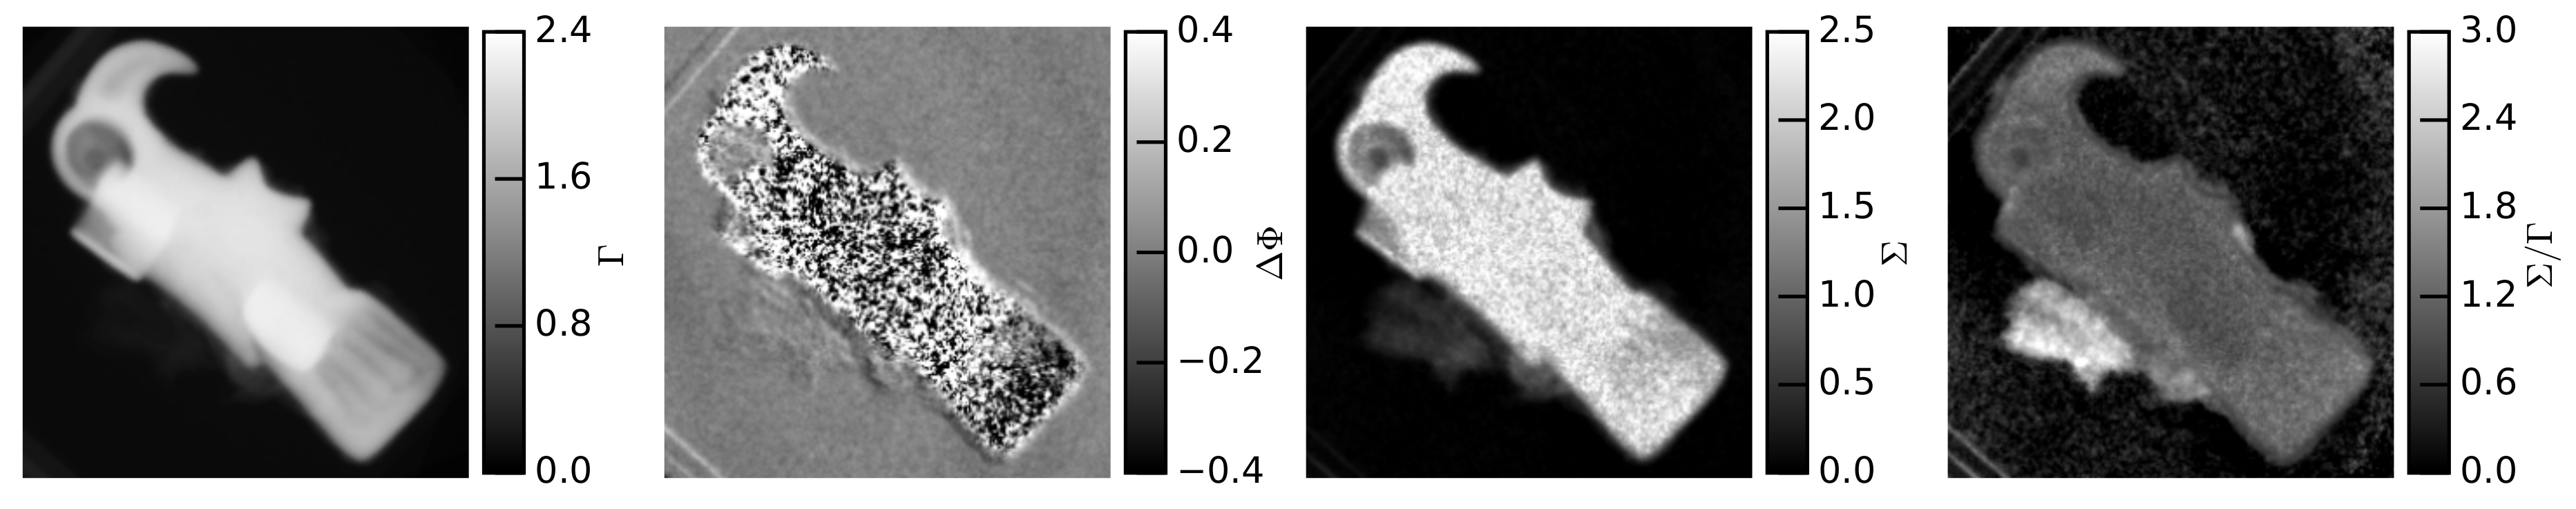
3.2.2. Influence of Soil on Dark-Field Images of a Strap-End

Soil leftovers are usually present, even if the archaeological finding was not taken out by a block excavation. Therefore, we examined how differential phase-contrast and dark-field imaging deals with scattering signals caused by soil particles. This is an important aspect for the applicability regarding the prospection of block excavations.
As a preliminary investigation, a sponge, which causes a clear dark-field signal due to the air-sponge boundaries, is imaged while being placed on varying heights of dry soil. The averaged resulting attenuation and dark-field signals with and without a sponge placed on an increasing amount of soil particles are plotted in Figure 8 on the left-hand side. Note that the thickness of soil shown on the x-axis in the plot has been roughly estimated by the resulting attenuation images. For that purpose the absorption coefficient of concrete obtained from NIST [37] has been assumed. The approximately measured thicknesses for each soil layer was about twice the value in the plot, but was taken to be imprecise because of the unknown degree of compression and variable soil components. Thus, the shown soil layer heights in the plot do not represent quantitative values, but qualitatively demonstrate the influence of the increasing amount of soil particles. The sponge itself (without soil) causes a clear dark-field signal. By adding soil, the contrast between sponge structure and soil particles decreases rapidly. Even a small layer of soil already results in high enough dark-field signals to conceal the signal caused by the sponge. From a soil thickness of around 5 mm and over, a differentiation of soil and soil with sponge is hardly possible. Moreover, the dark-field signal saturates quite fast with increasing soil layer height. This makes it impossible to gain information about objects which are covered by soil. The plot on the right in Figure 8 shows the effect of adding water to the soil. Due to additional attenuation by the water, the attenuation signal increases. However, the dark-field signal clearly decreases. The scattering properties are reduced, because of less scattering at water-soil-boundaries compared to scattering at air-soil-boundaries. Thus, the influence of disturbing soil particles could be reduced slightly by moisturising covering soil layers. However, for the investigation of archaeological findings, moisturising the surrounding soil is no applicable technique. The moisture may increase corroding processes and may cause harmful swelling and shrinkage processes to the adhered organic materials. We conclude that X-ray phase-contrast imaging is not feasible for an analysis of block excavations. However, small remaining layers of soil on an almost fully exposed sample could possibly be handled.
Thus, the strap-end, shown in the photograph in Figure 4, is examined. It is mainly composed of iron and, in addition, leftovers of soil cover the bottom and the lower part of the archaeological finding. Below the layer of soil, organic remains are presumed. As shown before, soil particles induce scattering and hence, a strong dark-field signal, which rapidly saturates and conceals further structures. The resulting attenuation, differential phase, dark-field and the normalised scattering image of the strap-end are presented in Figure 9. Here, 60 mAs were used at a 60 kVp spectrum with the highest reference visibility of 37%. The use of a higher energy spectrum (up to 120 kVp) has been tested. The results are comparable; only slight differences are recognisable with the images at 60 kVp providing little more detail. As a result of the existing soil particles in combination with the occurrence of iron, high dark-field values are caused, especially in the lower part of the strap-end, probably hiding the subjacent structures. The attenuation image indicates a relatively homogeneous material composition with a high percentage of metal. In contrast to the attenuation image, the middle part differs from the upper and lower part of the strap-end in the dark-field image. Assuming a similar influence of the metal over the whole strap-end, the remaining soil particles are responsible for the high dark-field values in the lower part of the strap-end. The higher amount of scattering particles, covering many parts of the strap-end, is also apparent by comparing the differential phase image of the here shown strap-end with the result for the iron fibula of Figure 6. More regions of the strap-end look noisy in the differential phase image, which is caused by scattering to a larger degree than by beam hardening. This is especially observable on the bottom left and on the outer bottom part of the strap-end. Here, the attenuation is comparably small, but the differential phase shows a noisy behaviour, nevertheless. Due to the soil particles, the visibility is reduced to such a large degree that the phase retrieval is not possible. In the normalised scatter image, a circular structure emerges more clearly. We assume it could be a rivet, which is common at strap-ends. At the edges and in particular in the lower outer region on the left, mainly soil remnants are present, which lead to a strong normalised scatter signal. In the lower region of the strap-end, which is covered by soil, some slight variations are recognisable in the normalised scatter image. The further analysis after removing the soil layer from the lower part of the strap-end revealed a piece of leather without further structuring. Whether the signal variations occur due to this organic remnant could not be verified.

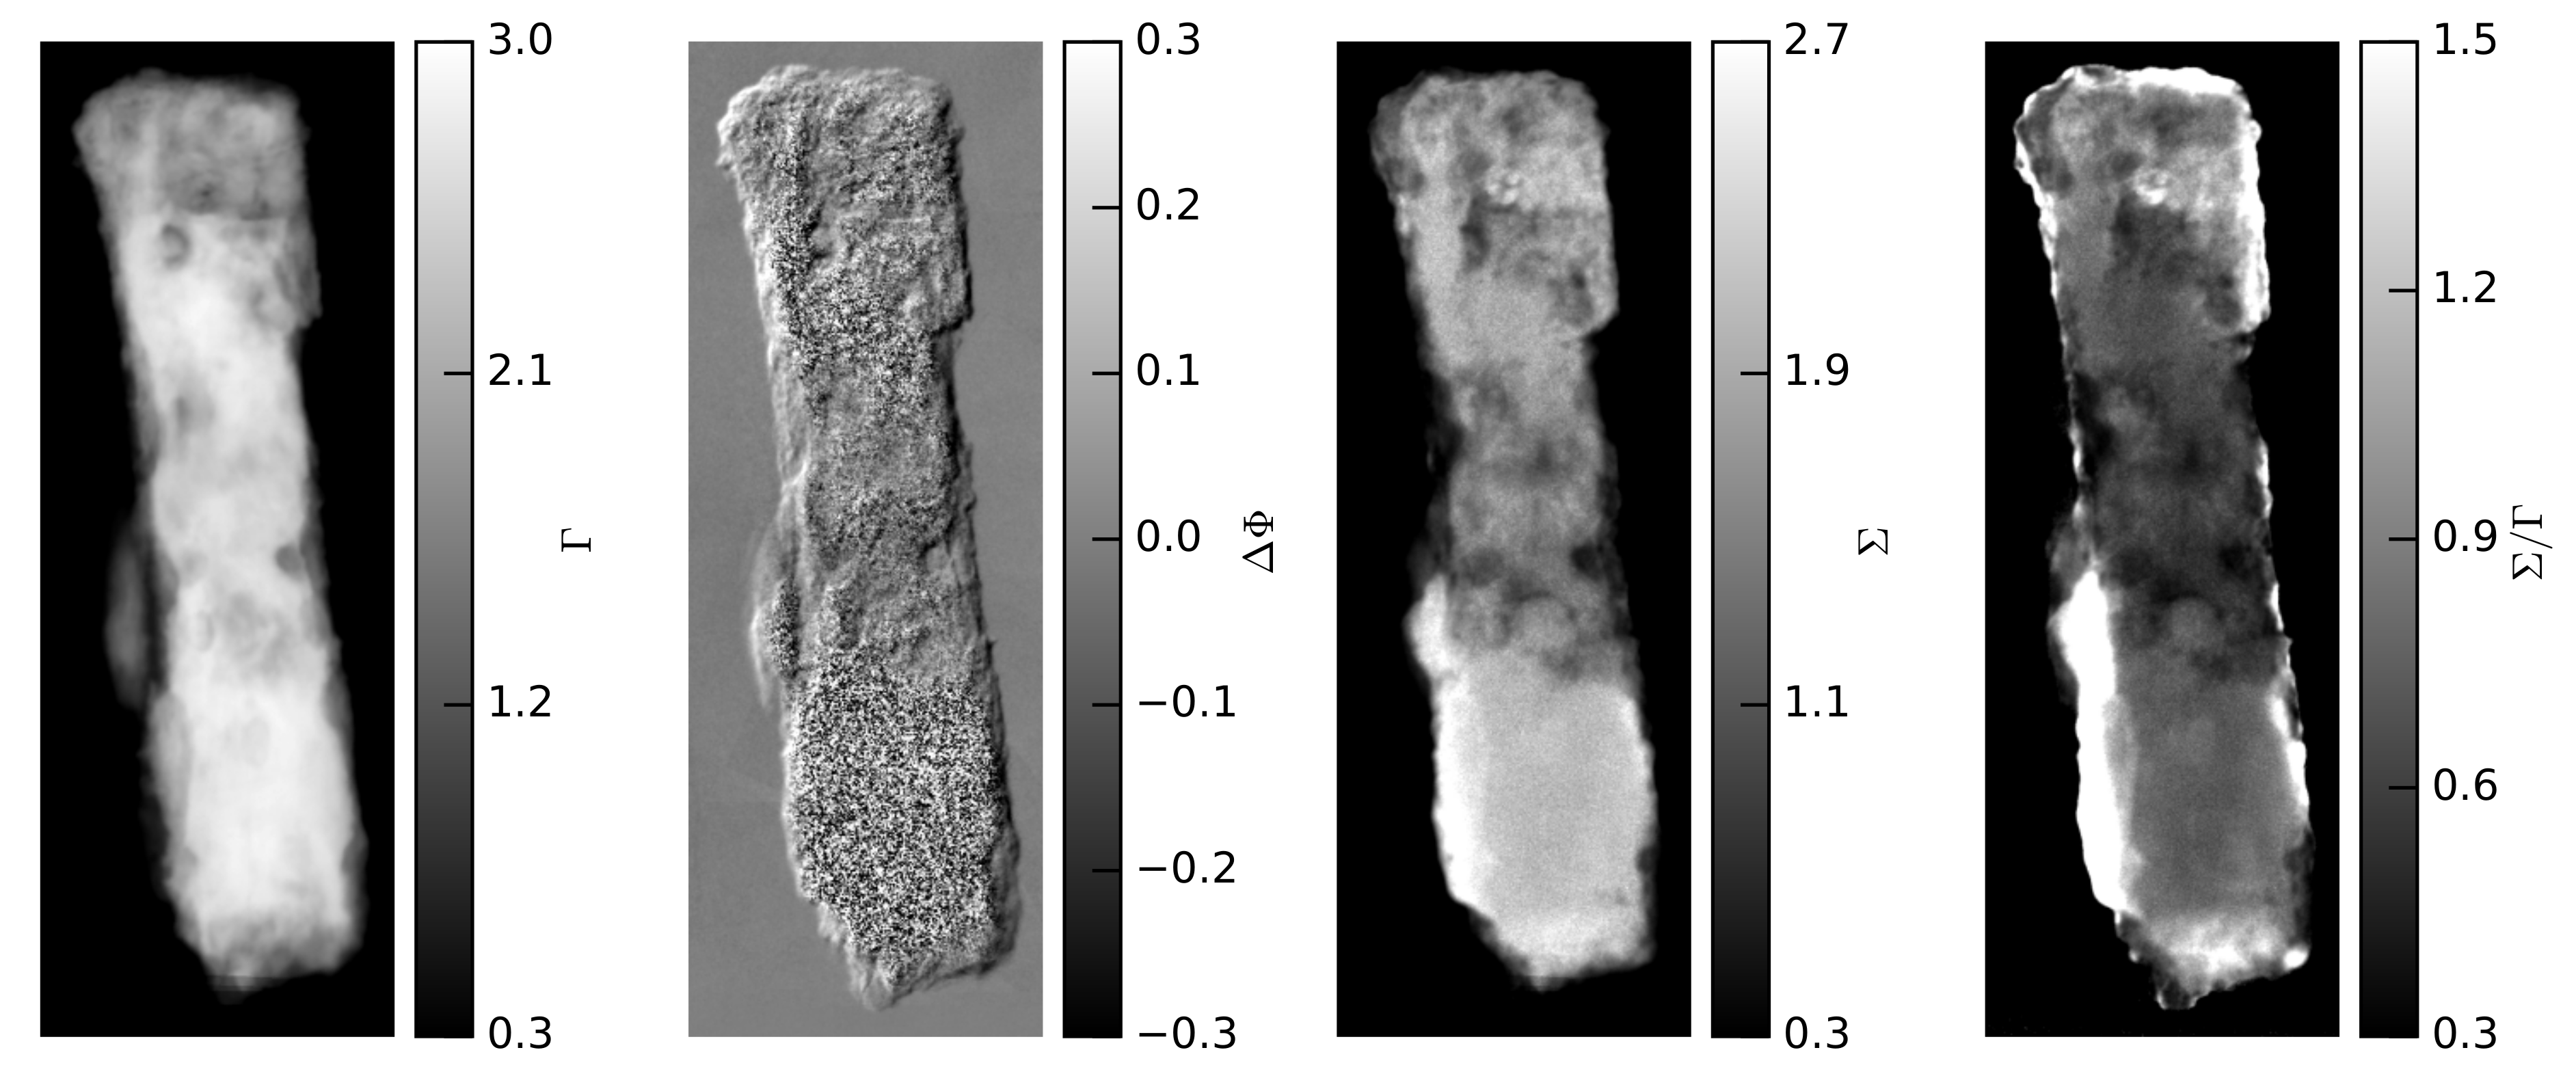
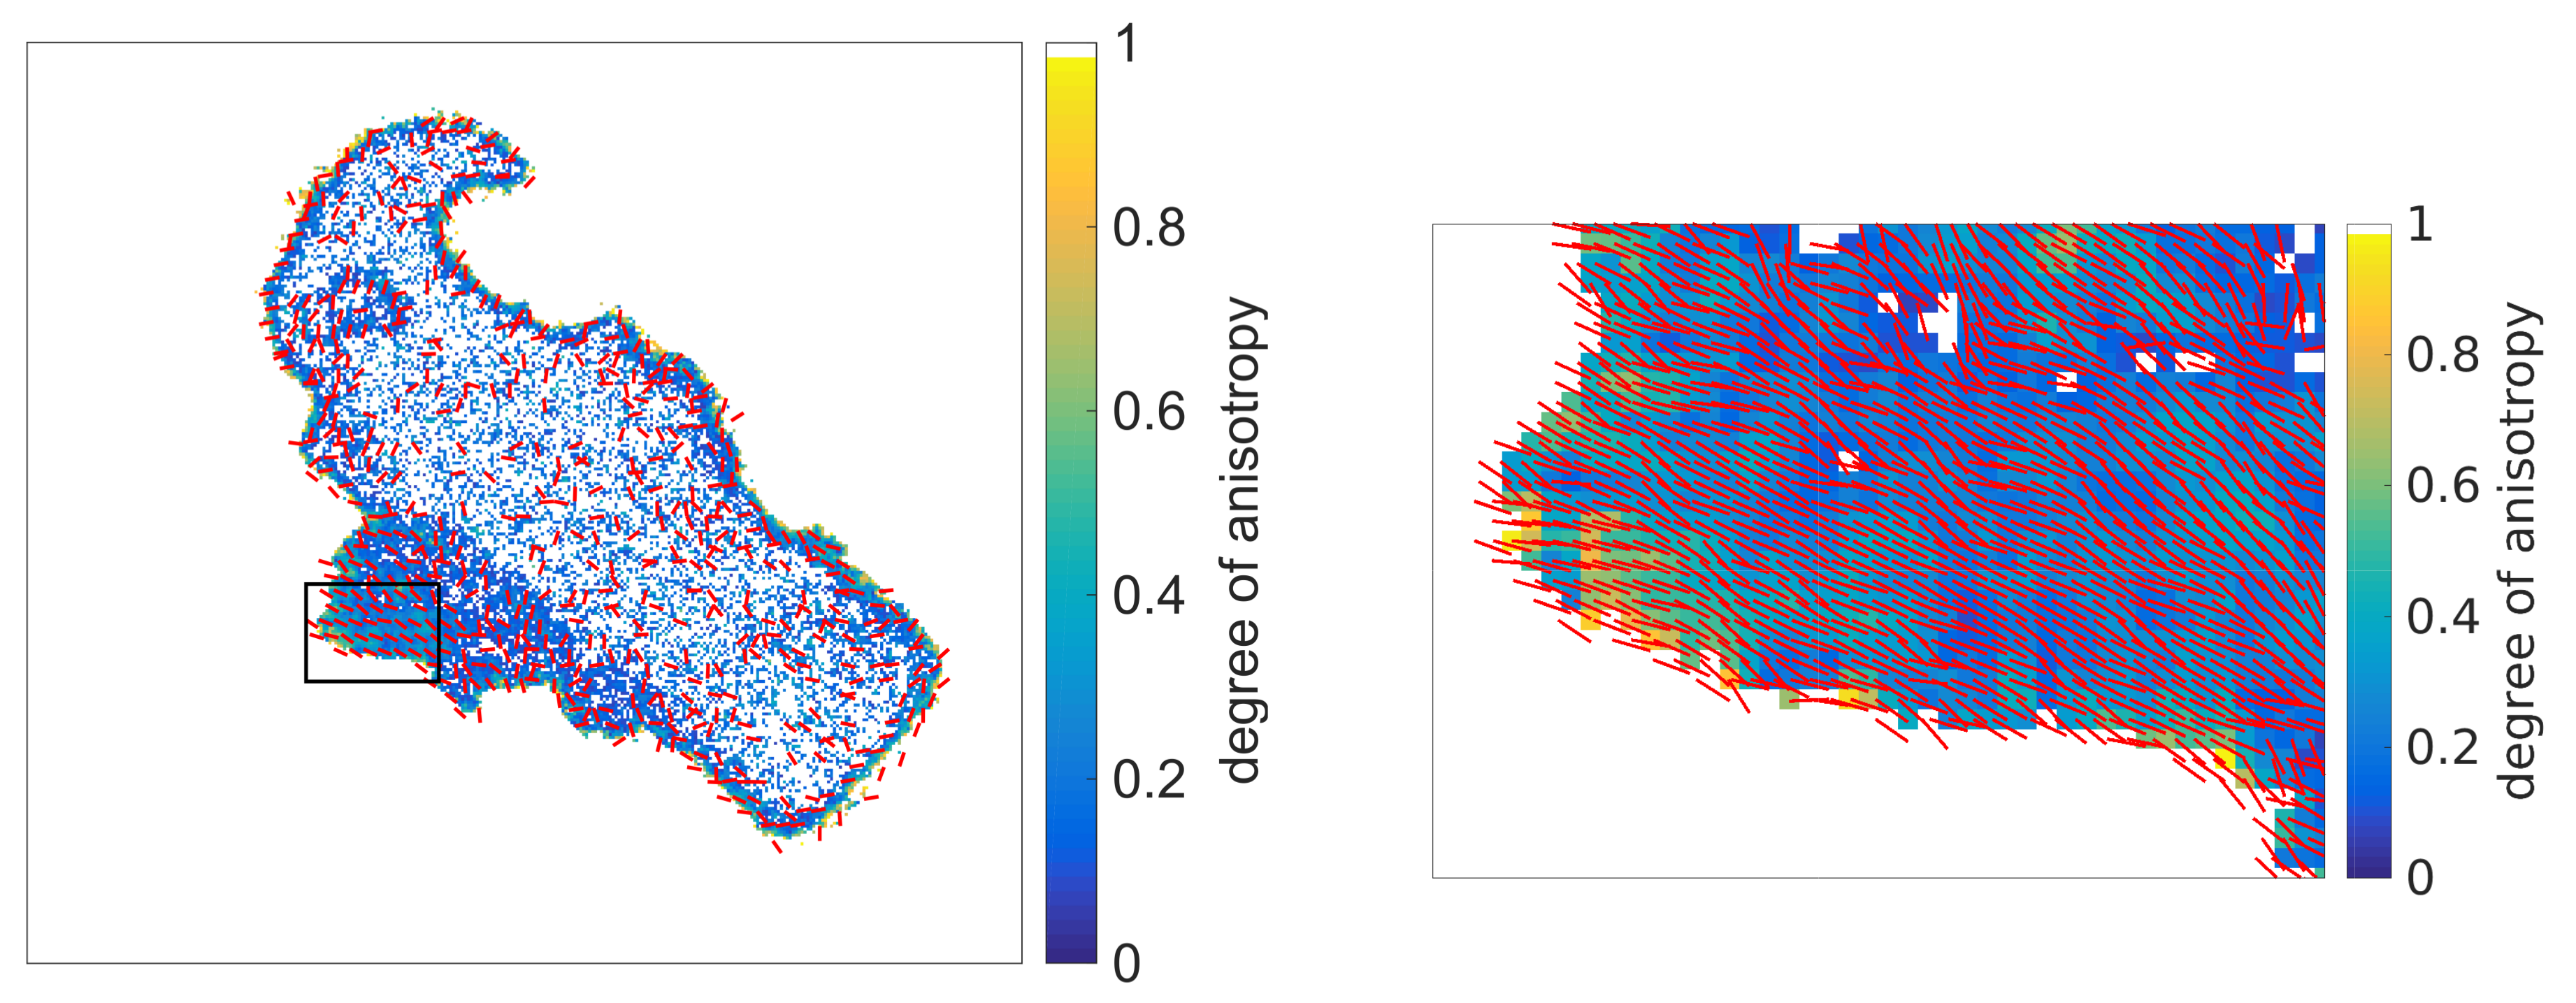
3.2.3. Directional X-ray Dark-Field Imaging of a Bird Fibula

In a process of corrosion, the original organic-based textiles vanish by decomposition, but their structure is mainly preserved in the resulting mineralised remnants of the fabrics. This enables an orientation-dependent analysis by directional dark-field imaging. In Figure 10, the obtained attenuation, differential phase, dark-field and normalised scatter image of the bird fibula from Figure 4 are presented. The images were acquired at 120 kVp and 2 mAs per phase-step. On the backside of the fibula, some mineralised textile remains are preserved next to the pin rest. These are visible, particularly in the dark-field image and even more enhanced in the normalised scatter image. The contrast in the attenuation image of this region is rather low. In the differential phase image, a slightly visible structure is recognisable. Images were acquired at four different orientations of the fibula by rotation around the beam axis. The resulting images are used to apply the directional dark-field imaging method by a pixelwise analysis. The resulting degree of anisotropy and fibre orientation is depicted in Figure 11. The preferred fibre orientations Φ α are presented as lines, pointing in the direction of the main structure alignment and printed on the colour-coded degree of anisotropy, which indicates the amount of aligned fibres with orientation Φ α . The part containing fabric remnants demonstrates a clear directional dependence caused by the mineralised woven material around the pin on the backside of the fibula (compare detailed view in Figure 4). The eye and the tail of the bird also seem to show a directional dependence. In this case, the variation of the dark-field signal during rotation in one analysed pixel probably occurs due to notches and edges. In the process of matching the images of each angular position, it is not possible to obtain a perfect pixelwise overlap. Therefore, in combination with the small number of angular positions, edges create the impression of a similar variation in the dark-field signal strength during rotation as that which would be caused be true fibre alignments. Those variations, however, are casual and could be excluded by measuring a higher number of angular positions of the sample. The analysis of directional dark-field imaging proved here to be a successful method for investigating mineralised fibre structures. An alignment of fibrous structures, which are not visible in any of the three images, could be revealed.

4. Discussion and Conclusions

We employed X-ray differential phase-contrast and dark-field imaging, providing an extended X-ray imaging method, on the non-destructive investigation of archaeological findings. The high amount of metallic parts and soil remains proved to be the main problems in the analysis of the examined samples. However, we obtained additional information for fully exposed findings by the dark-field and normalised scatter image. Moreover, we achieved promising results for the analysis of sub-pixel sized fibre orientations of mineralised fabric remnants by directional X-ray dark-field imaging. Our pre-measurements on test samples of different organic materials demonstrated such that the dark-field image and the normalised scatter image are suitable to visualise fabrics and leather better than the conventional attenuation image. The investigated archaeological findings comprised an iron fibula with mineralised fabric remnants, a strap-end partly covered with soil remains and a bird fibula with well preserved mineralised woven textile structures.
One problem we faced in the analysis of the archaeological findings is the high percentage of metallic parts. High absorbing materials cause beam hardening, which we have obtained in the results of the differential phase and dark-field image of the iron fibula and the strap-end. Higher spectrum energies could be helpful to reduce the influence, but for that purpose, optimised setups have to be developed. The main challenge here is given by obtaining high reference visibilities for high photon energies, which is mainly limited by the achievable height of the analyser grating.
Nevertheless, we demonstrated that an investigation of fully exposed archaeological findings with X-ray dark-field imaging provides additional information, in particular regarding fabric remnants. We showed that it is feasible to separate different materials due to thickness-independent scattering properties. For that purpose, we employed the normalised scatter image and the scatter plot in order to differentiate regions of different degrees of mineralisation and iron parts of the iron fibula. A mapping of regions differing in the degree of mineralisation proved feasible.
Furthermore, we showed that even small layers of soil disturb the obtainable dark-field signals significantly. A differentiation between scattering structures and the occurrence of scattering due to soil particles is hardly possible. This means that X-ray dark-field imaging is not a preferable imaging method for analysing block excavations as an extended X-ray prospection method. A better analysis of partly exposed samples might be possible by reducing the sensitivity of the setup. This could, for example, be simply realised by increasing the distance from the sample to the phase-grating [38]. A smaller sensitivity leads to a reduced dark-field signal. The amount of reduction depends on the size and shape of the scattering structures [39]. There might be a chance to suppress the influence of soil particles, partially in order to reveal scattering structures of quite different sizes than the soil particles. Here, further investigations are necessary.
Finally, we employed the directional dark-field imaging method on a bird fibula showing mineralised woven textile structures. We successfully reconstructed sub-pixel information about the main fibre orientation of the fabric remnants. Therefore, the directional imaging method proved feasible as an additional analysis tool for the examination of organic remains on archaeological findings. We found that X-ray dark-field imaging is useful in particular regarding the examination and discrimination of fabric remnants attached to archaeological findings. We propose a further application of this technique in particular on wet organic archaeological findings, where the textiles themselves are preserved. The distinction of different types of (mineralised) fibre-based materials, such as fabric remnants, wood, ivory or horn could be another promising application. Furthermore, the analysis of samples concealing internal structures, which are not visible from the outside, could be feasible by directional X-ray dark-field imaging. For further analysis, X-ray phase-contrast computed tomography should be considered. In this regard, the application of dual-energy methods seems a possible technique for the separation of different materials [40,41] in archaeological findings. Furthermore, the application of X-ray dark-field tomography is worth considering [42]. Here, tensor tomography extends the directional dark-field imaging to a 3D analysis of isotropic and anisotropic scattering contributions [21,22,43]. In conclusion, we found that especially X-ray dark-field imaging enables access to several additional analysis methods for the investigation of archaeological findings regarding material composition and structure, even at sub-pixel sized length scales.

Acknowledgments

This work was carried out with the support of the Karlsruhe Nano Micro Facility (KNMF), a Helmholtz Research Infrastructure at Karlsruhe Institute of Technology (KIT).

Author Contributions

Georg Pelzer and Jens Rieger conceived and designed the experimental setup; Veronika Ludwig, Tracy Niepold and Julia Ziegler performed the measurements; Tracy Niepold performed the archaeological interpretation of the samples; Maria Seifert contributed to analysis tools and to scientific discussion; Veronika Ludwig analysed the data and wrote the paper; Thilo Michel and Gisela Anton contributed to scientific discussion and supervised the project.

Conflicts of Interest

The authors declare no conflict of interest.

References

  1. Gasteiger, S. Strategien zum Umgang mit archäologischen Eisenfunden in der bayerischen Bodendenkmalpflege. In Fundmassen: Innovative Strategien zur Auswertung Frühmittelalterlicher Quellenbestände; Materialhefte zur Archäologie in Baden-Württemberg 97; Brather, S., Krausse, D., Eds.; Konrad Theiss Verlag: Stuttgart, Germany, 2013; pp. 115–130. [Google Scholar]
  2. Nowak-Böck, B. Erhalt und Erfassung organischer Befunde in der bayerischen Bodendenkmalpflege. In Fundmassen: Innovative Strategien zur Auswertung Frühmittelalterlicher Quellenbestände; Materialhefte zur Archäologie in Baden-Württemberg 97; Brather, S., Krausse, D., Eds.; Konrad Theiss Verlag: Stuttgart, Germany, 2013; pp. 131–143. [Google Scholar]
  3. Casali, F. X-ray and neutron digital radiography and computed tomography for cultural heritage. In Physical Techniques in the Study of Art, Archaeology and Cultural Heritage; Elsevier: Amsterdam, The Netherlands, 2006; Volume 1, pp. 41–123. [Google Scholar]
  4. Morigi, M.; Casali, F.; Bettuzzi, M.; Brancaccio, R.; d’Errico, V. Application of X-ray computed tomography to cultural heritage diagnostics. Appl. Phys. A 2010, 100, 653–661. [Google Scholar] [CrossRef]
  5. Mantler, M.; Schreiner, M. X-ray fluorescence spectrometry in art and archaeology. X-ray Spectrom. 2000, 29, 3–17. [Google Scholar] [CrossRef]
  6. Pfeiffer, F.; Weitkamp, T.; Bunk, O.; David, C. Phase retrieval and differential phase-contrast imaging with low-brilliance X-ray sources. Nat. Phys. 2006, 2, 258–261. [Google Scholar] [CrossRef]
  7. Weitkamp, T.; Diaz, A.; David, C.; Pfeiffer, F.; Stampanoni, M.; Cloetens, P.; Ziegler, E. X-ray phase imaging with a grating interferometer. Opt. Express 2005, 13, 6296–6304. [Google Scholar] [CrossRef] [PubMed]
  8. Revol, V.; Jerjen, I.; Kottler, C.; Schütz, P.; Kaufmann, R.; Lüthi, T.; Sennhauser, U.; Straumann, U.; Urban, C. Sub-pixel porosity revealed by X-ray scatter dark field imaging. J. Appl. Phys. 2011, 110. [Google Scholar] [CrossRef]
  9. Pfeiffer, F.; Bech, M.; Bunk, O.; Kraft, P.; Eikenberry, E.F.; Brönnimann, C.; Grünzweig, C.; David, C. Hard-X-ray dark-field imaging using a grating interferometer. Nat. Mater. 2008, 7, 134–137. [Google Scholar] [CrossRef] [PubMed]
  10. Yashiro, W.; Terui, Y.; Kawabata, K.; Momose, A. On the origin of visibility contrast in X-ray Talbot interferometry. Opt. Express 2010, 18, 16890–16901. [Google Scholar] [CrossRef] [PubMed]
  11. Yashiro, W.; Momose, A. Effects of unresolvable edges in grating-based X-ray differential phase imaging. Opt. Express 2015, 23, 9233–9251. [Google Scholar] [CrossRef] [PubMed]
  12. Jensen, T.H.; Bech, M.; Bunk, O.; Donath, T.; David, C.; Feidenhans’l, R.; Pfeiffer, F. Directional X-ray dark-field imaging. Phys. Med. Biol. 2010, 55, 3317. [Google Scholar] [CrossRef] [PubMed]
  13. Jensen, T.H.; Bech, M.; Zanette, I.; Weitkamp, T.; David, C.; Deyhle, H.; Rutishauser, S.; Reznikova, E.; Mohr, J.; Feidenhans’l, R.; et al. Directional X-ray dark-field imaging of strongly ordered systems. Phys. Rev. B 2010, 82, 214103. [Google Scholar] [CrossRef]
  14. Bayer, F.; Zabler, S.; Brendel, C.; Pelzer, G.; Rieger, J.; Ritter, A.; Weber, T.; Michel, T.; Anton, G. Projection angle dependence in grating-based X-ray dark-field imaging of ordered structures. Opt. Express 2013, 21, 19922–19933. [Google Scholar] [CrossRef] [PubMed]
  15. Potdevin, G.; Malecki, A.; Biernath, T.; Bech, M.; Jensen, T.H.; Feidenhans, R.; Zanette, I.; Weitkamp, T.; Kenntner, J.; Mohr, J.; et al. X-ray vector radiography for bone micro-architecture diagnostics. Phys. Med. Biol. 2012, 57, 3451. [Google Scholar] [CrossRef] [PubMed]
  16. Schaff, F.; Malecki, A.; Potdevin, G.; Eggl, E.; Noël, P.B.; Baum, T.; Garcia, E.G.; Bauer, J.S.; Pfeiffer, F. Correlation of X-ray vector radiography to bone micro-architecture. Sci. Rep. 2014, 4, 3695. [Google Scholar] [CrossRef] [PubMed]
  17. Baum, T.; Eggl, E.; Malecki, A.; Schaff, F.; Potdevin, G.; Gordijenko, O.; Garcia, E.G.; Burgkart, R.; Rummeny, E.J.; Noël, P.B.; et al. X-ray Dark-Field Vector Radiography—A Novel Technique for Osteoporosis Imaging. J. Comput. Assist. Tomogr. 2015, 39, 286–289. [Google Scholar] [CrossRef] [PubMed]
  18. Revol, V.; Kottler, C.; Kaufmann, R.; Neels, A.; Dommann, A. Orientation-selective X-ray dark field imaging of ordered systems. J. Appl. Phys. 2012, 112, 114903. [Google Scholar] [CrossRef]
  19. Revol, V.; Plank, B.; Kaufmann, R.; Kastner, J.; Kottler, C.; Neels, A. Laminate fibre structure characterisation of carbon fibre-reinforced polymers by X-ray scatter dark field imaging with a grating interferometer. NDT E Int. 2013, 58, 64–71. [Google Scholar] [CrossRef]
  20. Prade, F.; Schaff, F.; Senck, S.; Meyer, P.; Mohr, J.; Kastner, J.; Pfeiffer, F. Nondestructive characterization of fiber orientation in short fiber reinforced polymer composites with X-ray vector radiography. NDT E Int. 2017, 86, 65–72. [Google Scholar] [CrossRef]
  21. Malecki, A.; Potdevin, G.; Biernath, T.; Eggl, E.; Willer, K.; Lasser, T.; Maisenbacher, J.; Gibmeier, J.; Wanner, A.; Pfeiffer, F. X-ray tensor tomography. Europhys. Lett. 2014, 105, 38002. [Google Scholar] [CrossRef]
  22. Bayer, F.L.; Hu, S.; Maier, A.; Weber, T.; Anton, G.; Michel, T.; Riess, C.P. Reconstruction of scalar and vectorial components in X-ray dark-field tomography. Proc. Nat. Acad. Sci. USA 2014, 111, 12699–12704. [Google Scholar] [CrossRef] [PubMed]
  23. Vogel, J.; Schaff, F.; Fehringer, A.; Jud, C.; Wieczorek, M.; Pfeiffer, F.; Lasser, T. Constrained X-ray tensor tomography reconstruction. Opt. Express 2015, 23, 15134–15151. [Google Scholar] [CrossRef] [PubMed]
  24. Arrizón, V.; López-Olazagasti, E. Binary phase grating for array generation at 1/16 of Talbot length. J. Opt. Soc. Am. A 1995, 12, 801–804. [Google Scholar] [CrossRef]
  25. Suleski, T.J. Generation of Lohmann images from binary-phase Talbot array illuminators. Appl. Opt. 1997, 36, 4686–4691. [Google Scholar] [CrossRef] [PubMed]
  26. Fitzgerald, R. Phase-sensitive X-ray imaging. Phys. Today 2000, 53, 23–26. [Google Scholar] [CrossRef]
  27. Wang, Z.; Stampanoni, M. Quantitative X-ray radiography using grating interferometry: A feasibility study. Phys. Med. Biol. 2013, 58, 6815–6826. [Google Scholar] [CrossRef] [PubMed]
  28. Scherer, K.; Braig, E.; Ehn, S.; Schock, J.; Wolf, J.; Birnbacher, L.; Chabior, M.; Herzen, J.; Mayr, D.; Grandl, S.; et al. Improved Diagnostics by Assessing the Micromorphology of Breast Calcifications via X-Ray Dark-Field Radiography. Sci. Rep. 2016, 6, 36991. [Google Scholar] [CrossRef] [PubMed]
  29. Nesterets, Y.I. On the origins of decoherence and extinction contrast in phase-contrast imaging. Opt. Commun. 2008, 281, 533–542. [Google Scholar] [CrossRef]
  30. Revol, V.; Kottler, C.; Kaufmann, R.; Cardot, F.; Niedermann, P.; Jerjen, I.; Lüthi, T.; Straumann, U.; Sennhauser, U.; Urban, C. Sensing small angle scattering with an X-ray grating interferometer. In Proceedings of the 2010 IEEE on Nuclear Science Symposium Conference Record (NSS/MIC), Knoxville, TN, USA, 30 October–6 November 2010; pp. 892–895. [Google Scholar]
  31. Rieger, J.; Meyer, P.; Horn, F.; Pelzer, G.; Michel, T.; Mohr, J.; Anton, G. Optimization procedure for a Talbot-Lau X-ray phase-contrast imaging system. J. Instrum. 2017, 12, P04018. [Google Scholar] [CrossRef]
  32. Meyer, P.; Schulz, J. Chapter 16—Deep X-ray Lithography. In Micromanufacturing Engineering and Technology, 2nd ed.; Qin, Y., Ed.; Micro and Nano Technologies, William Andrew Publishing: Boston, MA, USA, 2015; pp. 365–391. [Google Scholar]
  33. Ritter, A.; Bartl, P.; Bayer, F.; Gödel, K.C.; Haas, W.; Michel, T.; Pelzer, G.; Rieger, J.; Weber, T.; Zang, A.; et al. Simulation framework for coherent and incoherent X-ray imaging and its application in Talbot-Lau dark-field imaging. Opt. Express 2014, 22, 23276–23289. [Google Scholar] [CrossRef] [PubMed]
  34. Siemens.com. Simulation of X-ray Spectra. 2016. Available online: www.siemens.com/x-ray-spectra (accessed on 28 March 2018).
  35. Yashiro, W.; Vagovič, P.; Momose, A. Effect of beam hardening on a visibility-contrast image obtained by X-ray grating interferometry. Opt. Express 2015, 23, 23462–23471. [Google Scholar] [CrossRef] [PubMed]
  36. Pelzer, G.; Anton, G.; Horn, F.; Rieger, J.; Ritter, A.; Wandner, J.; Weber, T.; Michel, T. A beam hardening and dispersion correction for X-ray dark-field radiography. Med. Phys. 2016, 43, 2774–2779. [Google Scholar] [CrossRef] [PubMed]
  37. Hubbell, J.H.; Seltzer, S.M. National Institute of Standards and Technology, X-Ray Mass Attenuation Coefficients. 2017. Available online: https://physics.nist.gov/PhysRefData/XrayMassCoef/ComTab/concrete.html (accessed on 28 February 2018).
  38. Donath, T.; Chabior, M.; Pfeiffer, F.; Bunk, O.; Reznikova, E.; Mohr, J.; Hempel, E.; Popescu, S.; Hoheisel, M.; Schuster, M.; et al. Inverse geometry for grating-based X-ray phase-contrast imaging. J. Appl. Phys. 2009, 106, 054703. [Google Scholar] [CrossRef]
  39. Strobl, M.; Betz, B.; Harti, R.; Hilger, A.; Kardjilov, N.; Manke, I.; Gruenzweig, C. Wavelength-dispersive dark-field contrast: Micrometre structure resolution in neutron imaging with gratings. J. Appl. Crystallogr. 2016, 49, 569–573. [Google Scholar] [CrossRef]
  40. Johnson, T.R. Dual-energy CT: General principles. Am. J. Roentgenol. 2012, 199, S3–S8. [Google Scholar] [CrossRef] [PubMed]
  41. Kottler, C.; Revol, V.; Kaufmann, R.; Urban, C. Dual energy phase contrast X-ray imaging with Talbot-Lau interferometer. J. Appl. Phys. 2010, 108, 114906. [Google Scholar] [CrossRef]
  42. Bech, M.; Bunk, O.; Donath, T.; Feidenhans, R.; David, C.; Pfeiffer, F. Quantitative X-ray dark-field computed tomography. Phys. Med. Biol. 2010, 55, 5529. [Google Scholar] [CrossRef] [PubMed]
  43. Sharma, Y.; Wieczorek, M.; Schaff, F.; Seyyedi, S.; Prade, F.; Pfeiffer, F.; Lasser, T. Six dimensional X-ray Tensor Tomography with a compact laboratory setup. Appl. Phys. Lett. 2016, 109, 134102. [Google Scholar] [CrossRef]
Figure 1. Sketch of a Talbot-Lau interferometer with an X-ray source S, the source grating G 0 , an object, the phase grating G 1 , the analyser grating G 2 and a flat-panel X-ray detector D. The pattern in front of G 2 illustrates the Talbot intensity pattern, which is produced by G 1 and distorted by the object.
Jimaging 04 00058 g001
Figure 2. Simulated visibility (left) shown in blue for the used setup for energies from 25 to 120 keV, referring to the left vertical axis. The dashed lines represent the applied 60 kVp (red) and 120 kVp (black) spectrum, filtered with 0.3 mm copper and an included detection efficiency of 600 μ m CsI, referring to the right axis. The measured reference visibility maps are shown for 60, 80, 100 and 120 kVp spectra (right). The retrieved average visibility of the polychromatic measurement is denoted in the brackets.
Jimaging 04 00058 g002
Figure 3. Photography of the examined test samples. Two different types of woven fabrics made of linen and hemp are shown in the top left corner. On the right side lies a piece of cowhide leather. Between the cloth and the leather, a replicated bird fibula is placed. The bottom row shows strands of dyed wool.
Jimaging 04 00058 g003
Figure 4. Photography of the examined archaeological findings: Iron fibula, strap-end and bird fibula. Photographies provided by the Bavarian State Office for Heritage Management (BLfD), Tracy Niepold, Julia Ziegler, Helmut Voss.
Jimaging 04 00058 g004
Figure 5. From left to right: Attenuation, differential phase, dark-field image and normalised scatter image of the test samples from Figure 3, taken at 60 kVp and 7.5 mAs per phase-step. The region marked by a red square is shown in detail in the bottom row.
Jimaging 04 00058 g005
Figure 6. Attenuation (left), differential phase (middle) and dark-field image (right) of the iron fibula from Figure 4, taken at 80 kVp and 22.5 mAs per phase-step.
Jimaging 04 00058 g006
Figure 7. Normalised scatter image of the iron fibula, acquired at 80 kVp and 22.5 mAs per phase-step (left). The scatter plot and image (right) show the abundance of measured Γ - and Σ -values for the iron fibula with the colours referring to different regions in the Γ - Σ -plain, respectively in the fibula image on the right.
Jimaging 04 00058 g007
Figure 8. Attenuation (red) and dark-field values (blue) obtained by different heights of soil with two sponges (plus) and without (circle) are plotted over the thickness of soil (left). The first plus signs (soil thickness equal to zero) represent the dark-field and attenuation signal that the sponges generate. The effect on the attenuation (red) and dark-field values (blue) of dry soil (circle) and wet soil (filled circle) is compared for increasing heights of soil (right).
Jimaging 04 00058 g008
Figure 9. From left to right: Attenuation, differential phase, dark-field and normalised scatter image of the strap-end from Figure 3, acquired at 60 kVp and 60 mAs per phase-step.
Jimaging 04 00058 g009
Figure 10. From left to right: Bird fibula shown in attenuation, differential phase, dark-field and normalised scatter image, acquired at 120 kVp and 2 mAs per phase-step.
Jimaging 04 00058 g010
Figure 11. Reconstruction of fibre orientations (left) caused by the mineralised textile structures at the pin of the bird fibula (photography in Figure 4). A zoom on the region in the left figure marked with a black rectangle is shown (right). The red lines point in the main direction of aligned structures and are plotted on the colour-coded degree of anisotropy.
Jimaging 04 00058 g011
Table 1. Parameters of the used gratings (left) and distances (right). In this configuration a magnification factor of 1.87 is obtained.
GratingPeriod ( μ m)Height ( μ m)Duty CycleDistances (cm)
G013.312000.5 d G 0 - G 1 90 d focus - G 0 16
G15.716.30.3 d G 1 - G 2 68 d G 0 - object 79.5
G2102000.5 d G 2 - detector 6.1

