Review

Neutron Imaging at Compact Accelerator-Driven Neutron Sources in Japan

by
Yoshiaki Kiyanagi
Research Laboratory of Accelerator-Based BNCT System, Graduate School of Engineering, Nagoya University, Nagoya 464-8603, Japan
J. Imaging 2018, 4(4), 55; https://doi.org/10.3390/jimaging4040055
Submission received: 8 November 2017 / Revised: 28 February 2018 / Accepted: 22 March 2018 / Published: 27 March 2018
(This article belongs to the Special Issue Neutron Imaging)

Abstract

:
Neutron imaging has been recognized to be very useful to investigate inside of materials and products that cannot be seen by X-ray. New imaging methods using the pulsed structure of neutron sources based on accelerators has been developed also at compact accelerator-driven neutron sources and opened new application fields in neutron imaging. The world’s first dedicated imaging instrument at pulsed neutron sources was constructed at J-PARC in Japan owing to the development of such new methods. Then, usefulness of the compact accelerator-driven neutron sources in neutron science was recognized and such facilities were newly constructed in Japan. Now, existing and new sources have been used for neutron imaging. Traditional imaging and newly developed pulsed neutron imaging such as Bragg edge transmission have been applied to various fields by using compact and large neutron facilities. Here, compact accelerator-driven neutron sources used for imaging in Japan are introduced and some of their activities are presented.

1. Introduction

Neutron imaging in Japan has been used mainly for inspection of industrial products and for visualizing distribution or movement of hydrogenous materials [1] and this situation is similar to the rest of the world [2]. Such traditional imaging is mainly performed in nuclear reactor facilities. JRR-3 at Japan Atomic Energy Agency and KUR at KURRI (Kyoto University Research Reactor Institute) used to be major facilities. The neutron flux was highest at JRR-3 and medium flux is attained at KUR although more flexible measurements are possible at KUR. These two facilities have supported imaging measurements in Japan for a long time. However, JRR-3 is still shut down after the big earthquake in 2011. However, KUR was restarted in the end of August of 2017. On the other hand, a new imaging method using pulsed structure of the neutron source was developed at a compact accelerator-driven neutron source at Hokkaido University, HUNS [3]. This new method enabled us to reveal crystallographic characteristics of materials, and to perform elemental analysis, temperature measurements, and magnetic field measurements, for example. Based on this new method we received approval from J-PARC to construct a new imaging instrument, RADEN, which was in 2008 [4]. RADEN has attracted researchers in various fields and contributed to expand users. After J-PARC construction, the importance of compact accelerator-driven neutron sources (CANSs) was realized. Kyoto University Accelerator-driven Neutron Source (KUANS) was constructed in 2011 and then RIKEN Accelerator-driven Neutron Source (RANS) in 2013 [5]. KUANS has been used for device development, neutron imaging, and education. RANS has mainly focused on industrial applications, where neutron imaging and neutron diffraction methods were used, and RANS has contributed to expanding industrial applications and users [6,7,8,9,10]. KURRI-LINAC at KURRI recently started imaging measurements and for this the target-moderator-reflector system was renewed [11]. Aomori Prefecture Quantum Science Center is the newest facility in Japan that has neutron imaging capability. Furthermore, a commercial use of neutron imaging has been performed at SHI-ATEX Co. Ltd. (Saijo, Japan) from 1979 and it is used for check of aerospace parts and other applications.
Demand for neutron imaging seems to be increasing and application fields are expanding in Japan. For such requirement CANSs are very useful since they exist usually near the users. At the same time, improvement or development of the new methods are required to obtain more information on the objects. In the world, some compact accelerator-driven neutron sources are used for neutron imaging. Representative examples are LENS (Low Energy Neutron Source) at Indiana University in the USA [12], CPHS (Compact Pulsed Hadron Source) at Tsinghua University [13] and PKUNIFTY (Peking University Neutron Imaging Facility) [14] in China. LENS is used not only for imaging, but also other neutron scattering applications. CPHS and PKUNIFTY are still upgrading the accelerators. On the other hand, in Japan a new CANS imaging facility has been constructed and many CANS imaging facilities works effectively. This application is rapidly expanding. Therefore, in the present paper we describe neutron facilities used for imaging and introduce the activity at CANS facilities in Japan.

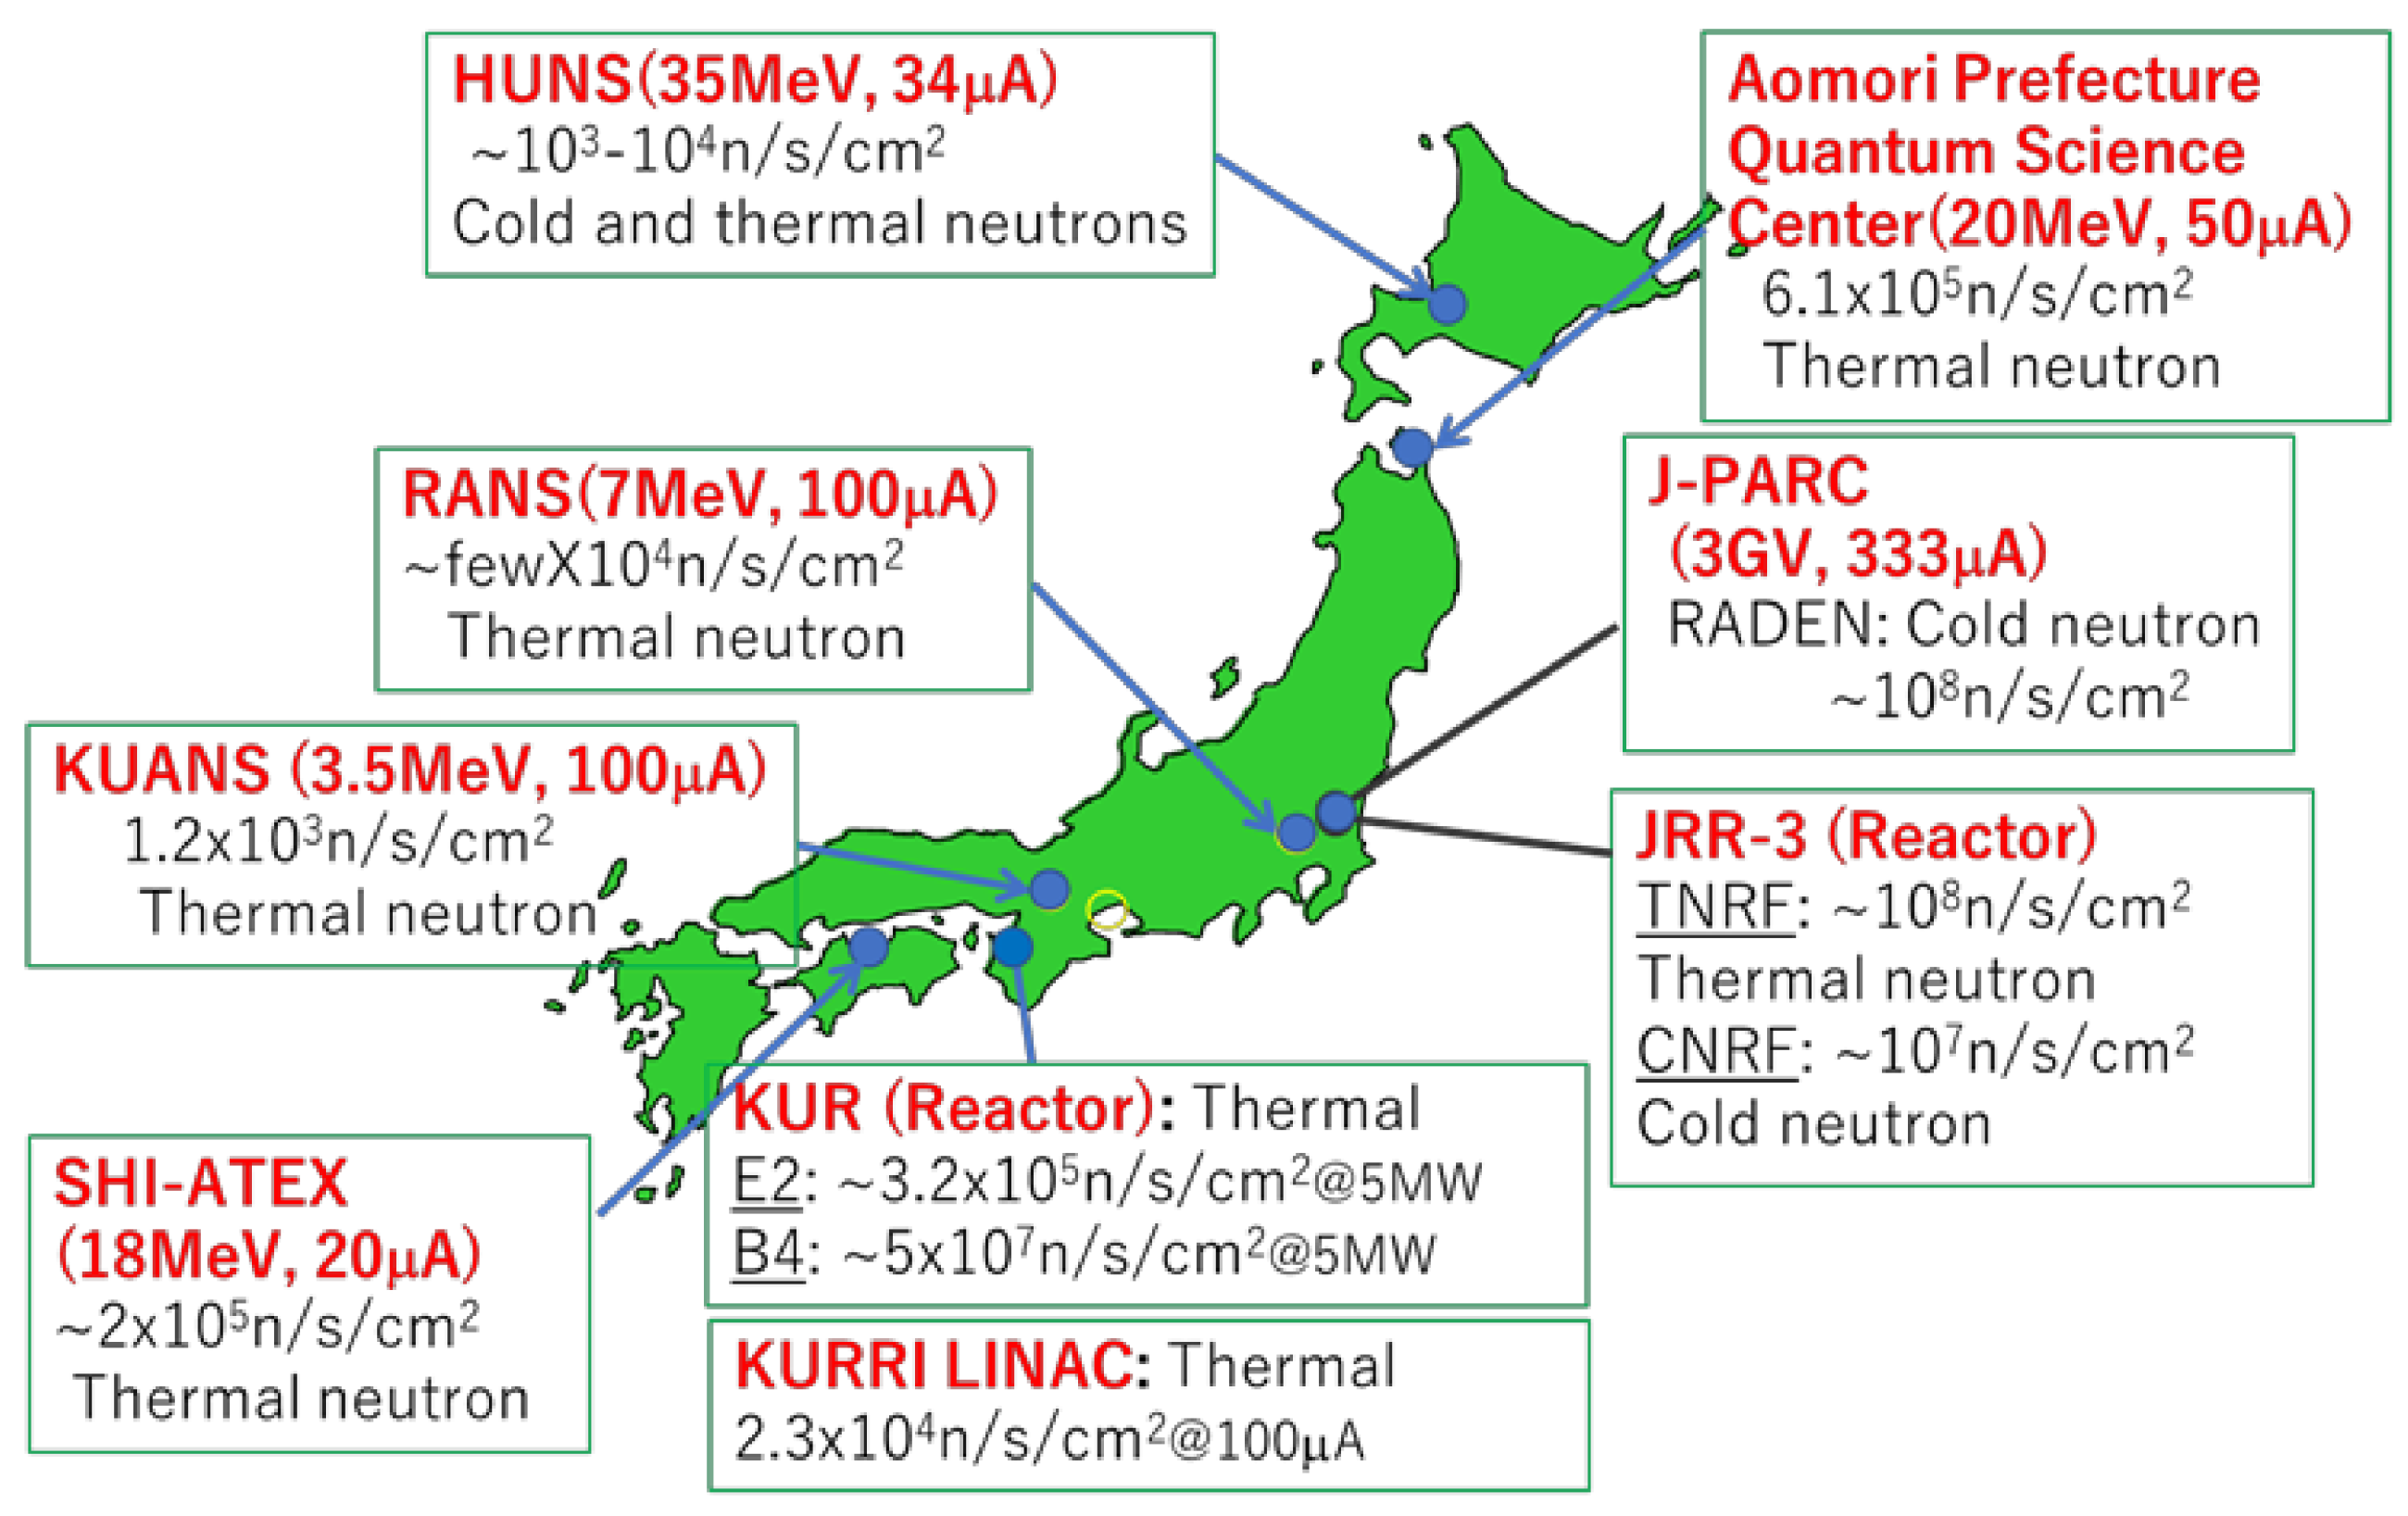
2. Neutron Facilities in Japan

Neutron facilities used for imaging are shown in Figure 1. There are two reactor facilities in Japan, JRR-3 and KUR. JRR-3 is a 20 MW research reactor and there are two imaging beam lines viewing thermal and cold moderators, TNRF and CNRF, respectively. The neutron flux at TNRF is about 108 n/s/cm2, which is the highest intensity in Japan. However, the reactor is not operating now. KUR re-started end of August in 2017 and operated at 5 MW while boron neutron capture therapy (BNCT) is performed and at 1 MW while experiments other than the BNCT are performed. There are two imaging beam lines, E2 and B4. The neutron fluxes are 4.8 × 10⁵ and 5 × 10⁷ n/s/cm2 at 5 MW reactor power, respectively, and they are not as high as JRR-3, but sample handling is much more flexible than in JRR-3.
There are seven accelerator-driven neutron sources for neutron imaging. Specifications of the facilities based on accelerators are summarized in Table 1. In the table we also listed L/D values, an important index to indicate performance. L/D is defined as ‘(a length from an aperture to an imaging detector: L)/(a size of an aperture: D)’. This value corresponds to beam divergence and ultimately relates to the imaging spatial resolution. The biggest facility is the J-PARC/MLF (Material Life Science Experimental Facility) [15] and the imaging instrument RADEN provides a cold neutron flux about 2.6 × 10⁷ n/s/cm2 at 1 MW at L/D = 180. Now, the power is about 0.3 MW. This instrument is mostly used for imaging using pulsed structure, such as Bragg edge imaging and resonance imaging. However, it was also designed to have capability of high L/D measurement that cannot be done at other imaging facilities in Japan, since the maximum L/D value was 175 in Japan. Various types of neutron detectors are available [16], such as an n-GEM (boron-coated Gas Electron Multiplier) detector [17], a μ-NID (Micro-pixel chamber-based Neutron Imaging Detector) [18], a pixel-type detector [19], and neutron color imaging intensifiers [20]. Spatial resolutions are 800, few 100 s, 2000~3000, and few 100 μm, respectively. The accelerator-driven neutron sources HUNS [21] is the oldest one used for imaging which construction was completed in 1973, and SHI-ATEX was established in 1979 that has commercially provided neutrons for imaging. KURRI-LINAC was installed in 1965, but neutron imaging application started recently [11]. KUANS and RANS are new neutron sources in Japan. Furthermore, the Aomori Prefecture Quantum Science Center has constructed a multi-purpose proton accelerator, where one of main application is imaging. In the next chapter we explain in more detail the compact accelerator-driven neutron sources and their activities from north to south in Japan.

3. Compact Accelerator-Driven Neutron Sources and Their Activities

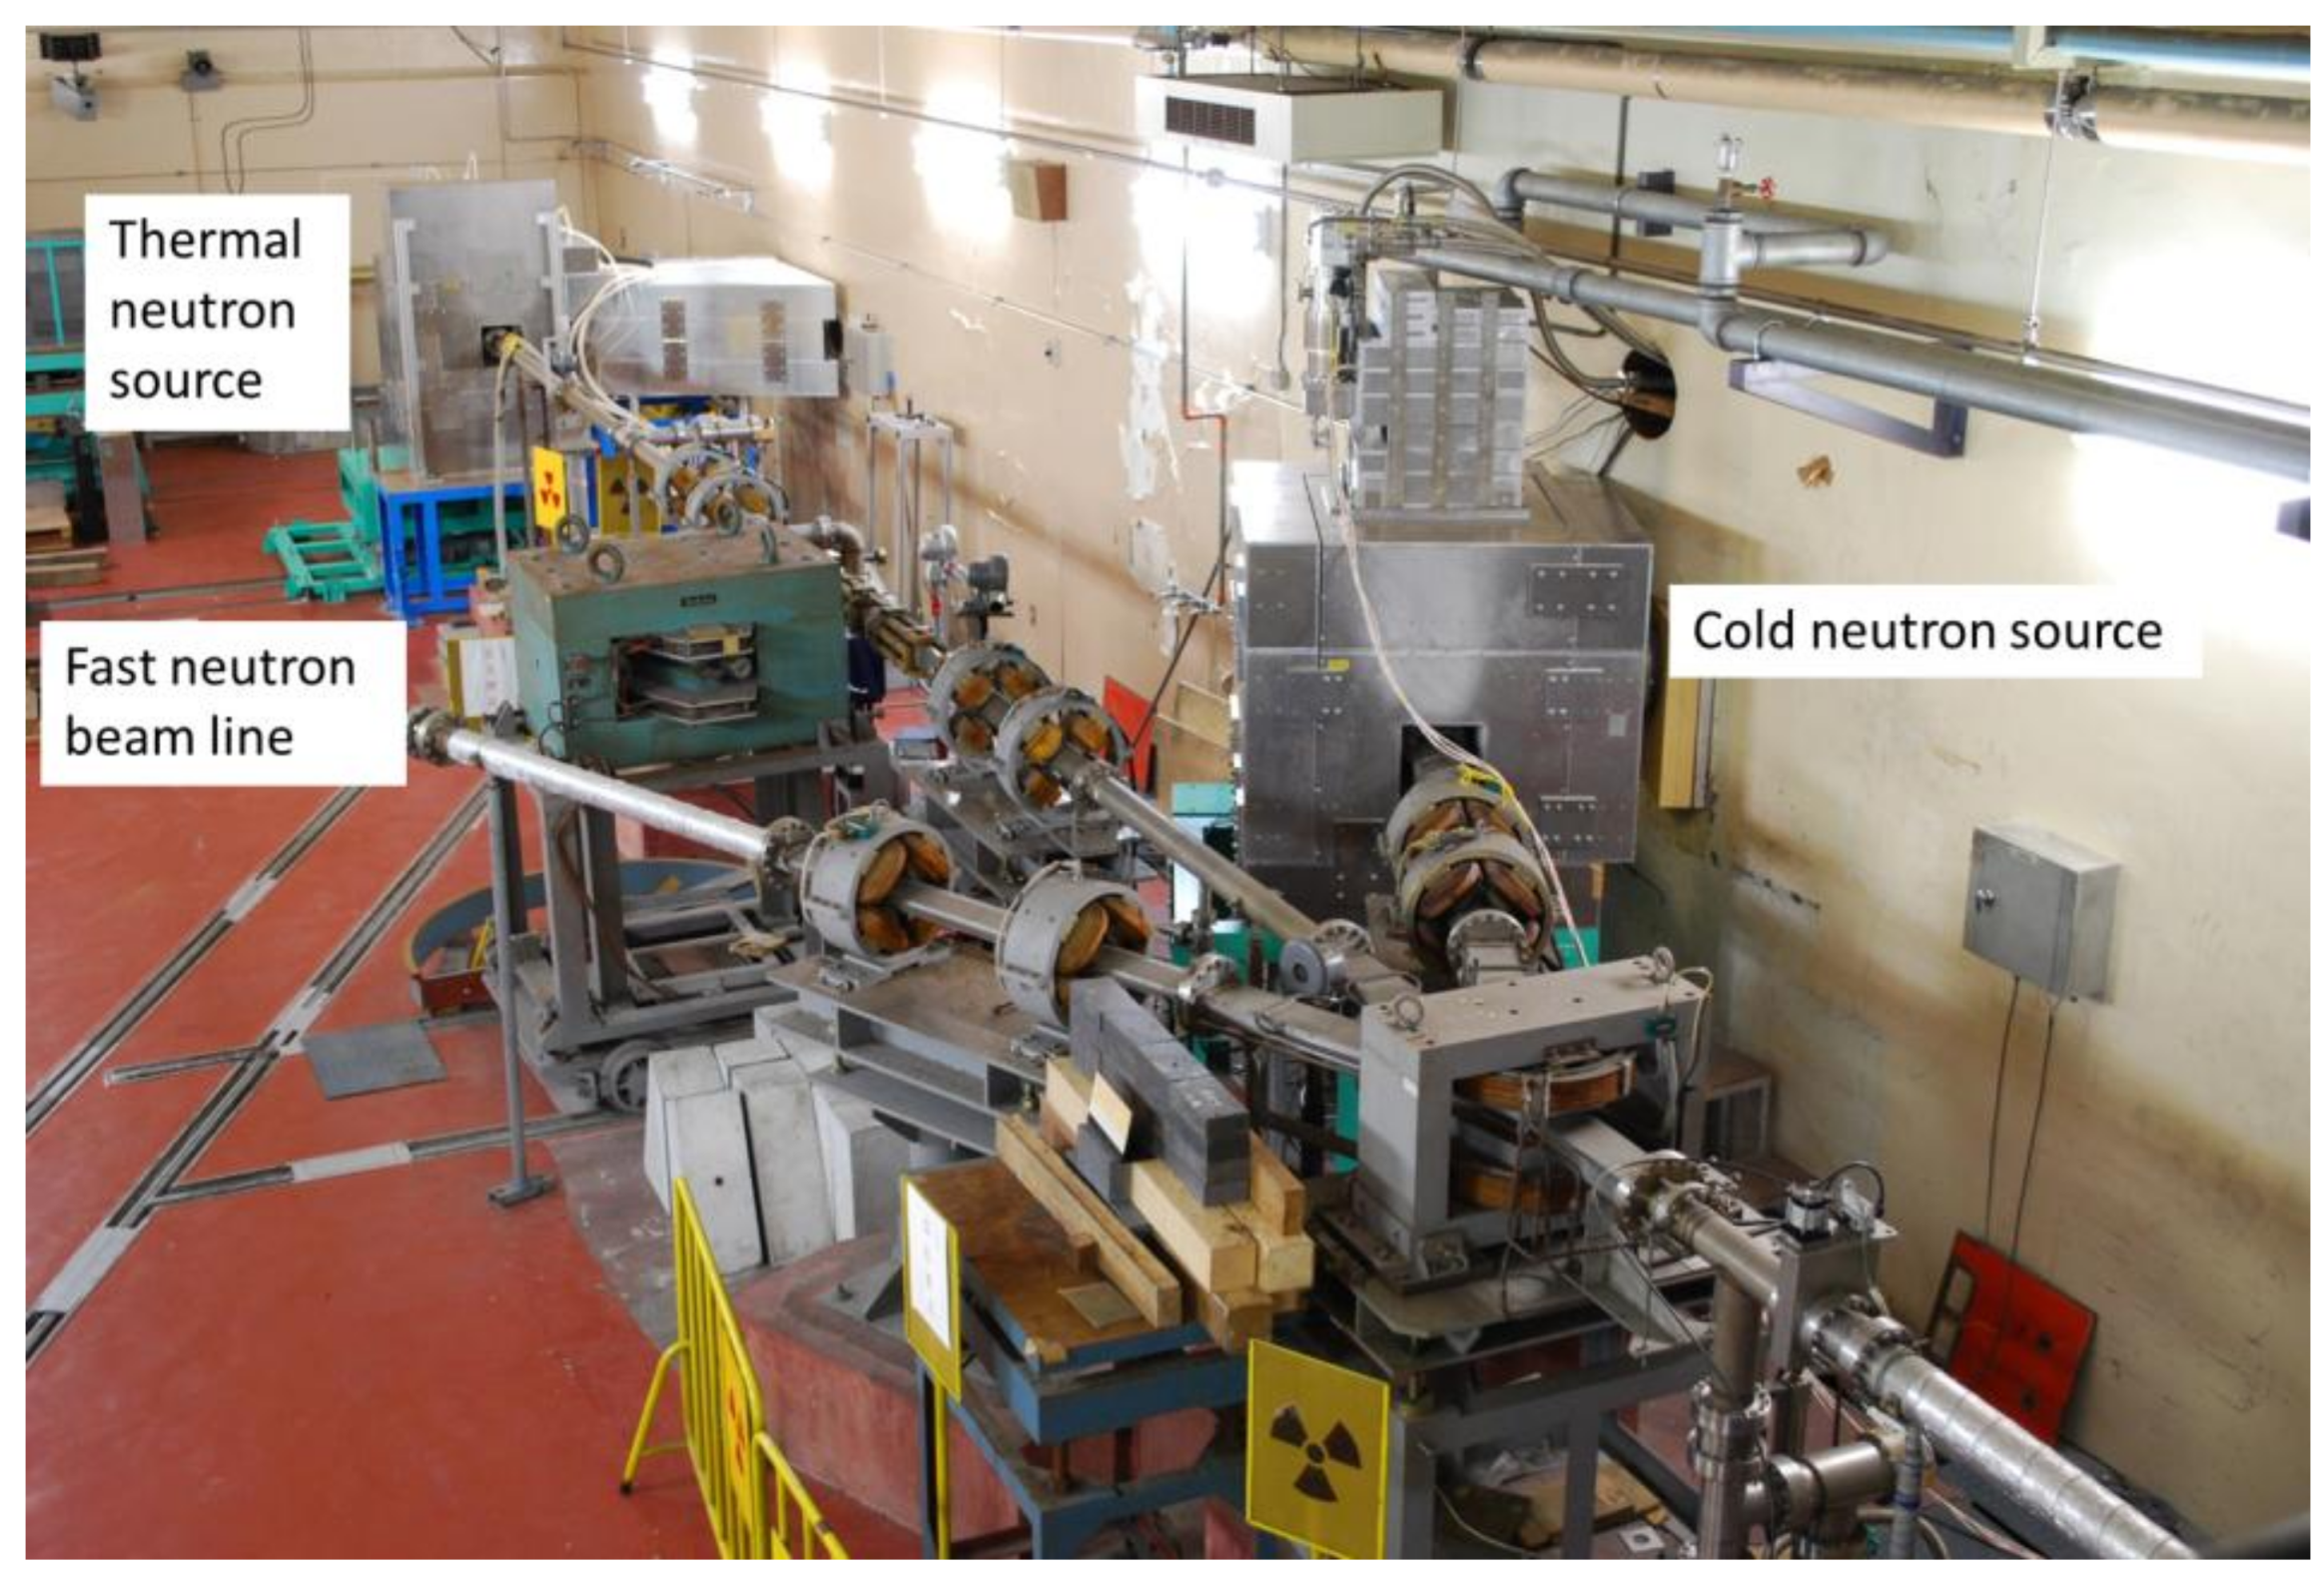
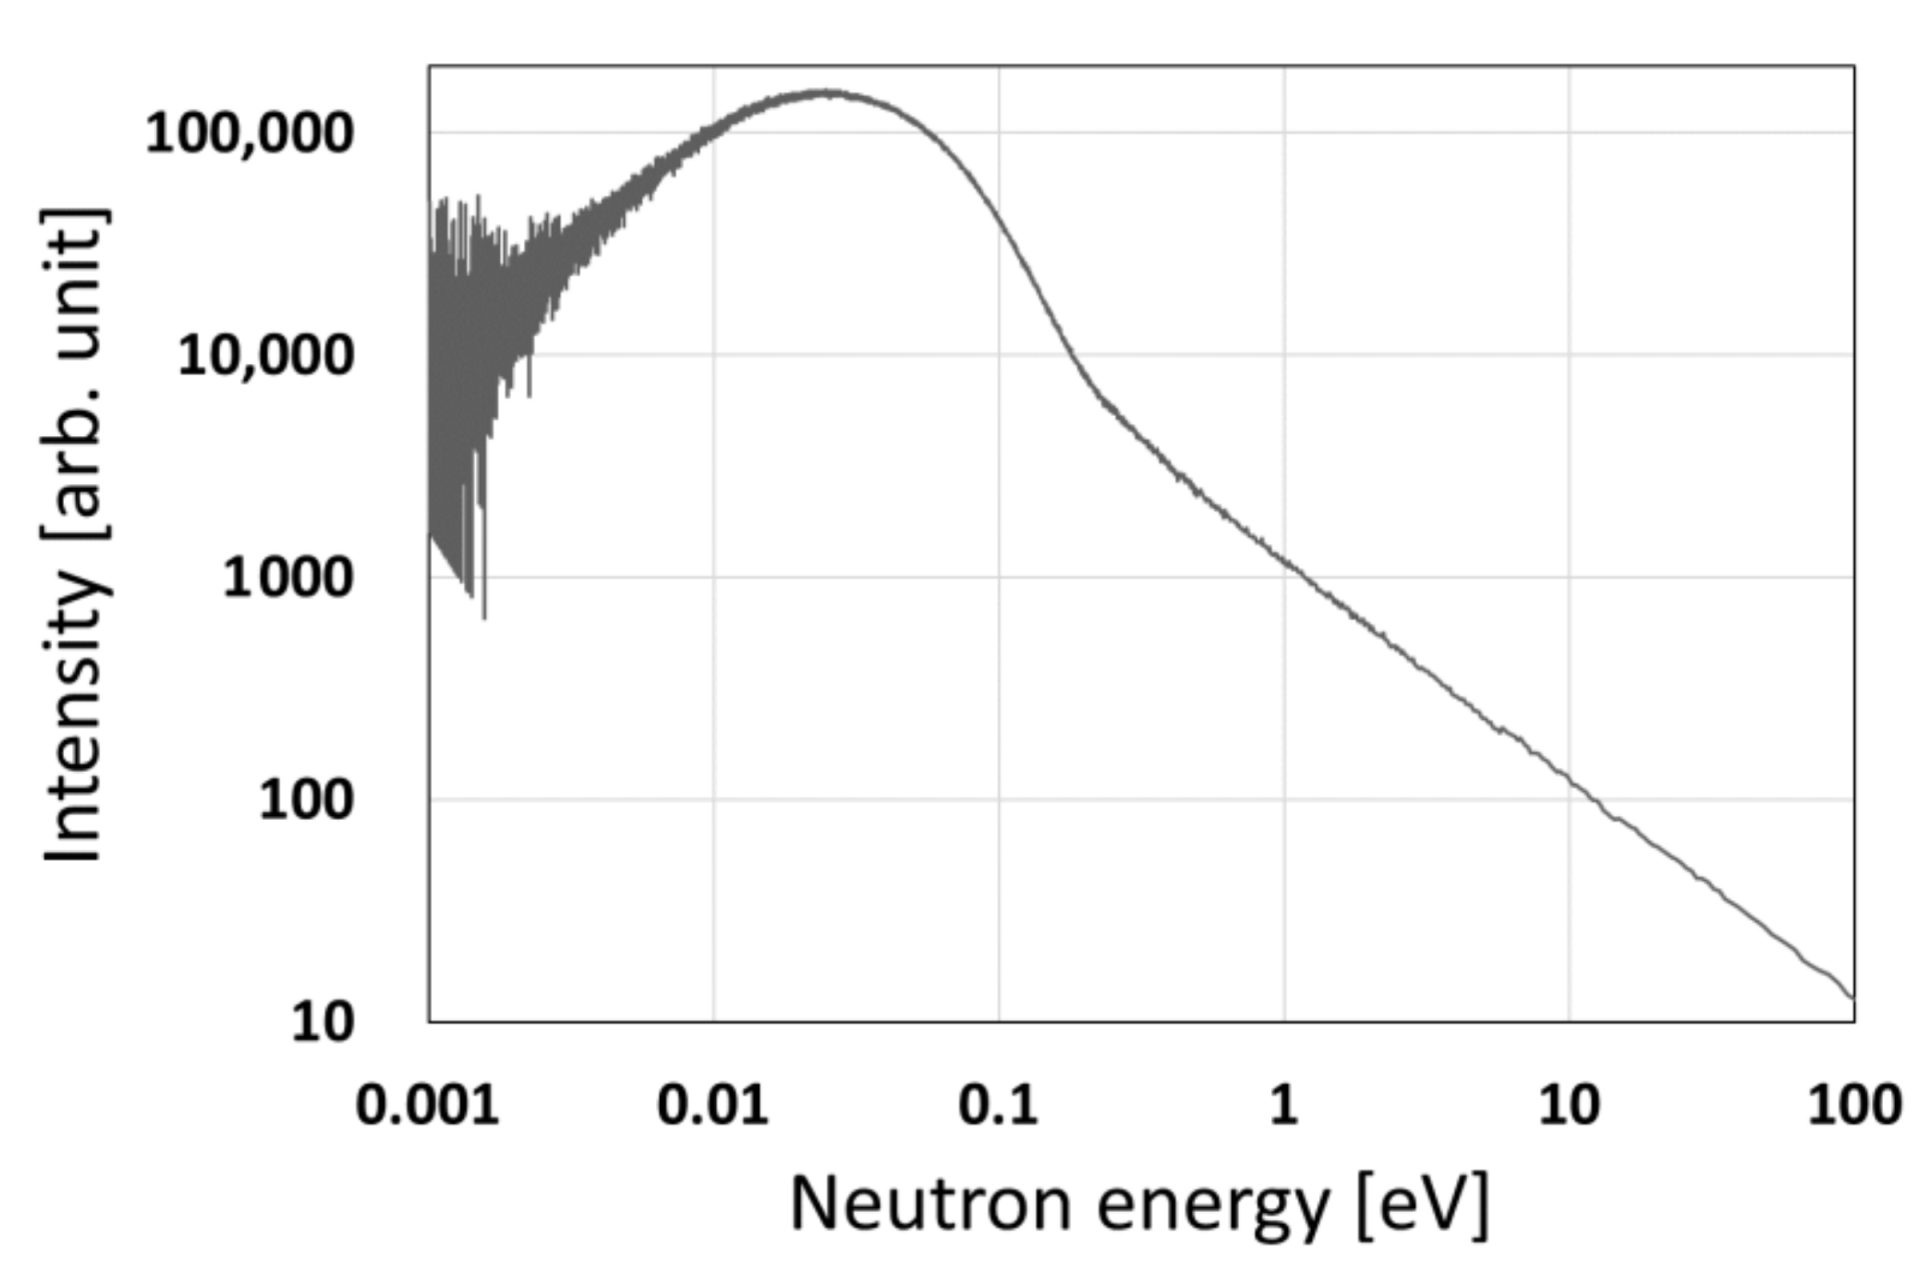
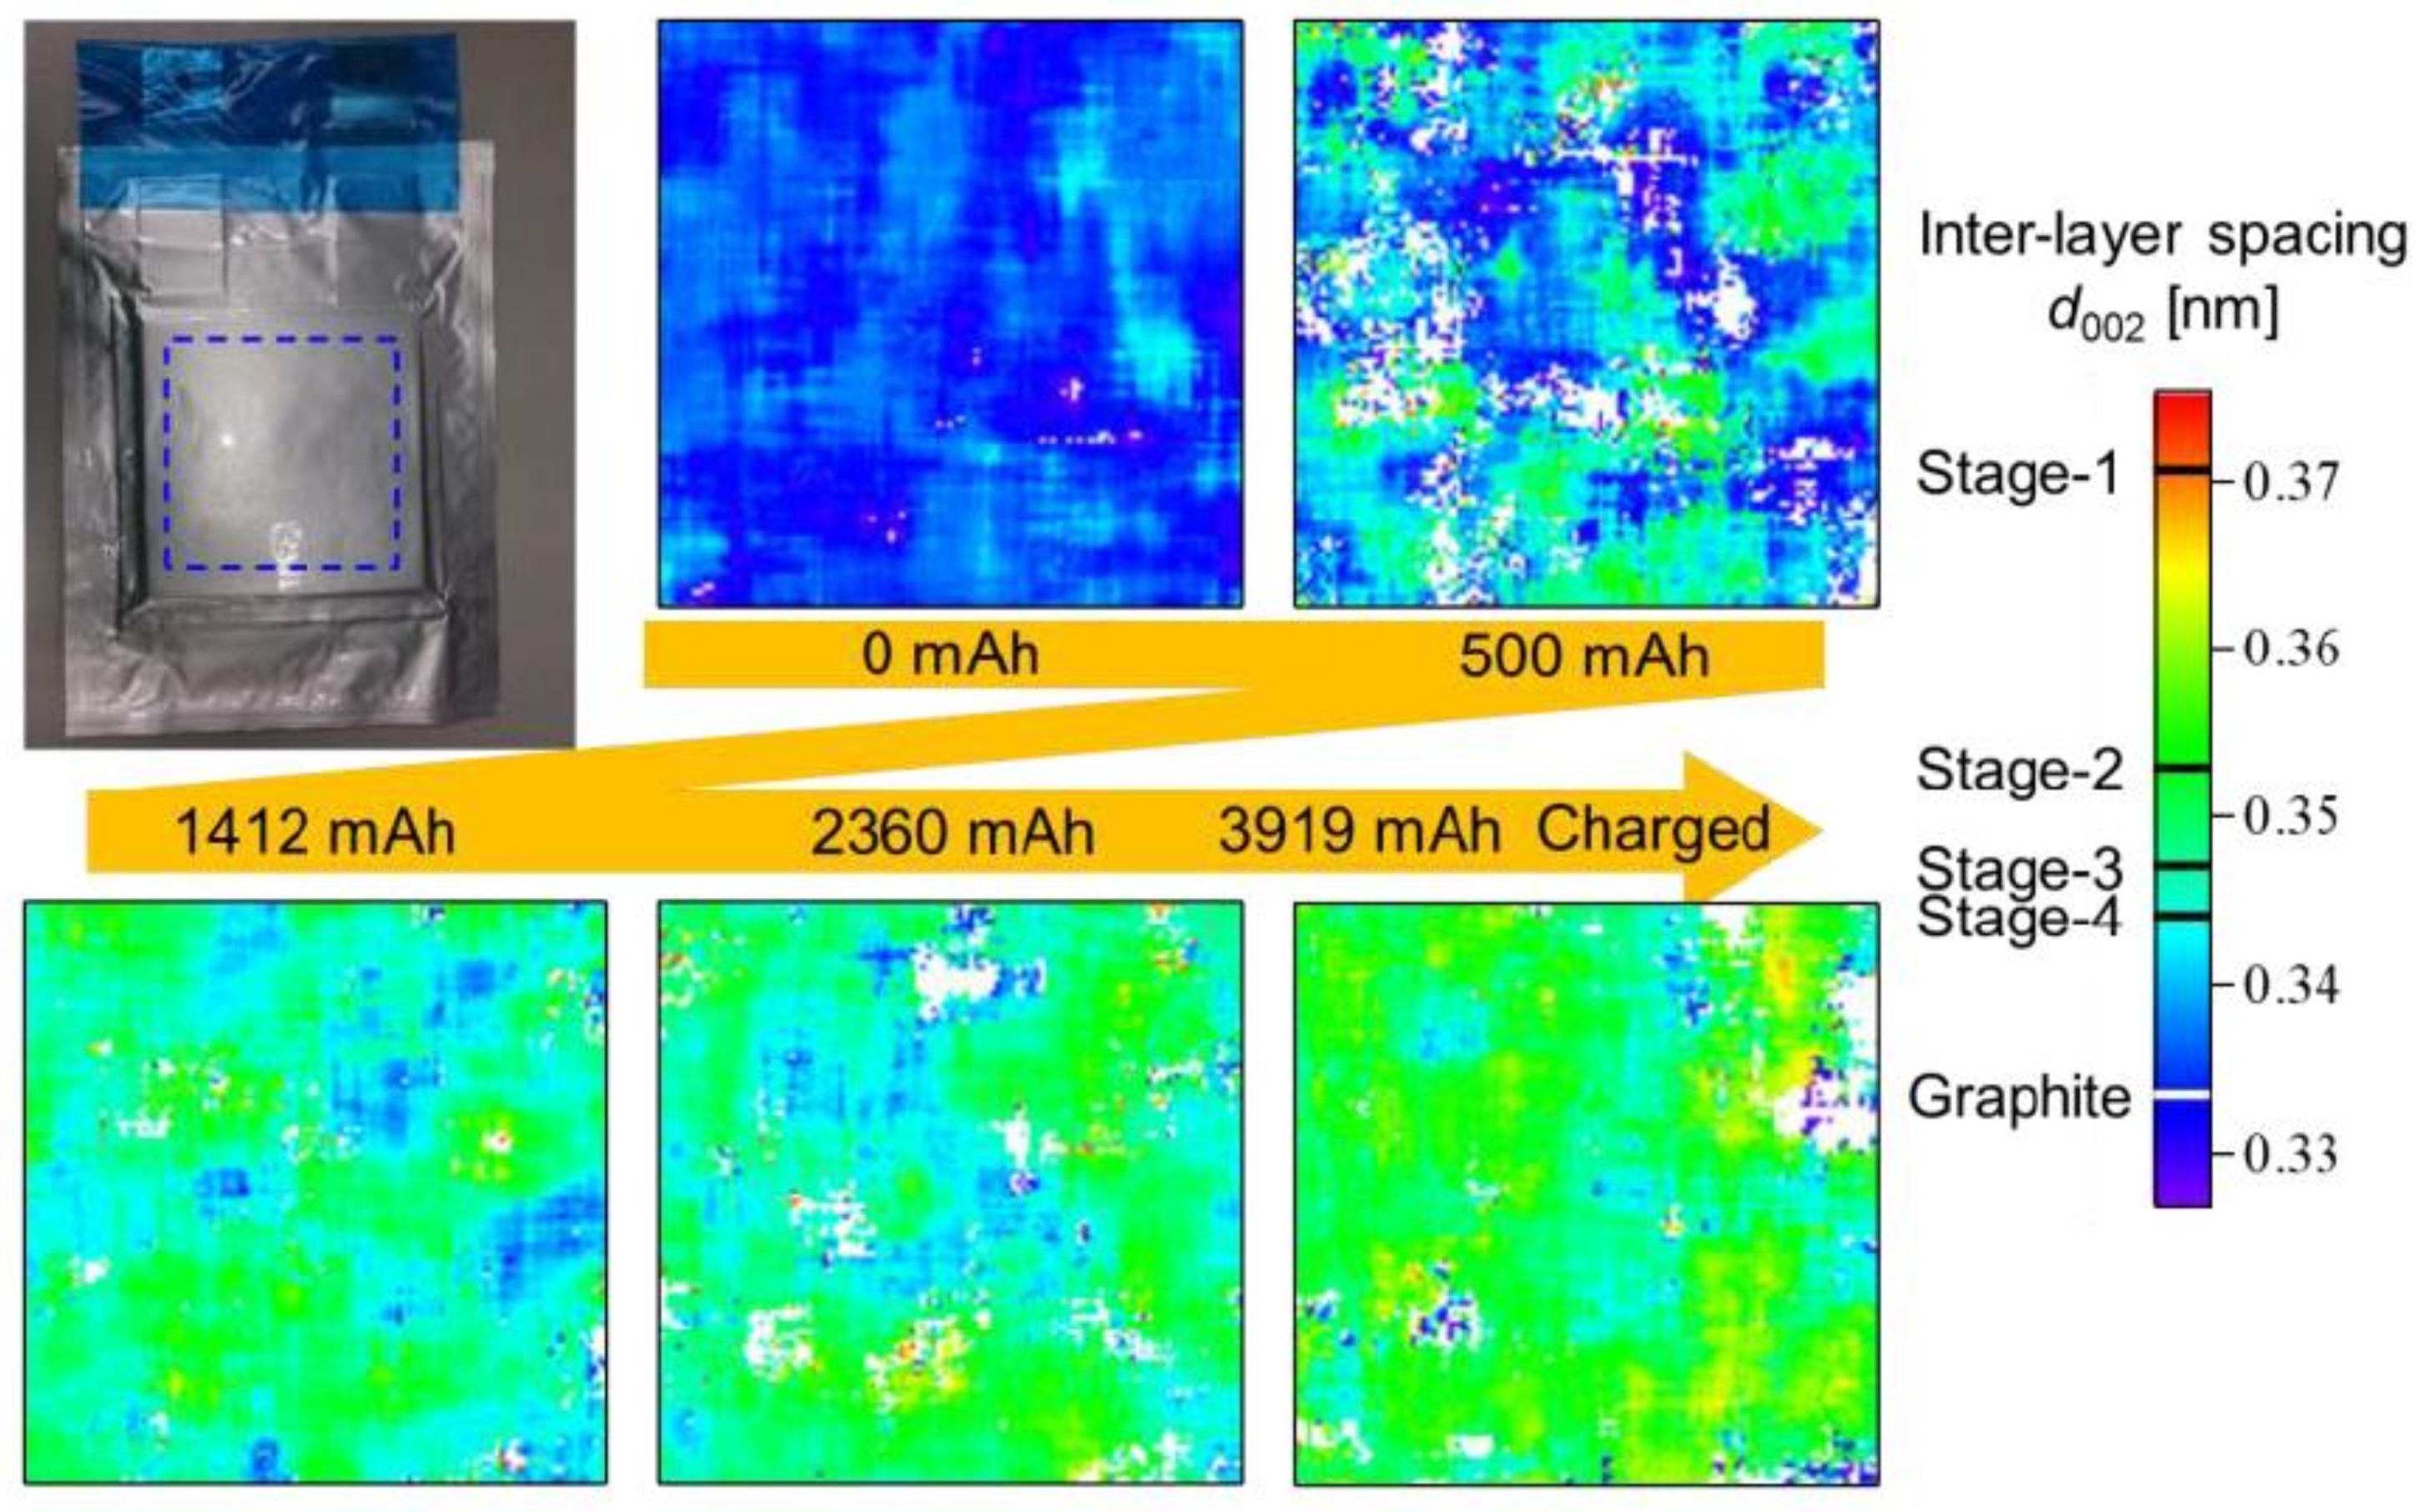
3.1. Hokkaido University Neutron Source (HUNS)

An electron accelerator with a maximum acceleration energy 45 MeV is used at Hokkaido University for producing the neutrons by photo-neutron reaction ((e, X), (X, n)). Construction of this facility was finished in 1973. Electron beam lines are shown in Figure 2. There are three beam ports called center, right and left. At the center and the right beam lines, target-moderator-reflector systems exist. The left beam line used to be used for fast neutron experiments relating to nuclear reactor physics. At the right beam line, a cold neutron moderator made the world’s first accelerator-driven cold neutron source. The moderator is now coupled mesitylene. Neutron flux at the measurement point is about 104 n/s/cm2. Bragg edge analysis and magnetic field analysis using the pulsed neutron transmission are performed at the cold neutron beam line. On the thermal neutron beam line, a polyethylene moderator is used, and it is possible to couple with a 3.6 Qc super mirror. Thermal neutron flux is about 103 n/s/cm2. By using the thermal moderator, resonance imaging and temperature measurement are performed with the aid of the time-of-flight method. The energy spectrum of neutrons from the thermal moderator is shown in Figure 3. The L/D value is approximately 60 for both beam lines. Furthermore, medium angle scattering, and acceleration test of soft error induced by fast neutrons are also performed. This facility is being upgraded to increase the power from 1 to 3 kW and will restart around May of 2018.
Various kinds of detectors are available, n-GEM detector (10 cm viewed field, 0.8 mm pixel size) [17], neutron imaging intensifier, Color I.I. (9 inches, few 100 μm pixel size) [20], and pixel type detector (2 or 5 cm in width, and 2 or 3 mm in pixel size) [19].
The first example of the pulsed neutron imaging is Bragg edge transmission imaging. We studied welded iron to indicate crystallographic characteristics of the welded region and examine the difference between welded and non-welded regions [22]. Measurements were performed at HUNS with the use of a cold moderator at a time of flight resolution of about 2%. Figure 4 shows analyzed results of the Bragg edge transmission; preferred orientation, degree of anisotropy and crystallite size. The degree of the anisotropy (texture) is represented by ‘R’, where R = 1 corresponds to isotropic, and as the value decreases, the texture becomes strong. The upper-left photo shows the samples. Top plates are the base iron plates, the center part is a cut piece of the welded iron plate, and the lower part is the welded iron. In the welded sample you can see the welded region at the center. The center cut piece between base iron plates and welded iron was prepared by cutting a 6 mm piece from the welded plate and put to be seen the cutting surface. The iron plates were rolled steel. Therefore, the neutron beam direction was perpendicular to rolling direction for the welded sample, and parallel for the center cut piece. The preferred crystal orientation of the non-welded region is <111> and in the center cut piece the orientation is <110>. In the welded region, the preferred orientations are mixed as shown in the center cut piece and the lower welded plate. The degree of the anisotropy, texture, is strong in the non-welded region and becomes more isotropic in the welded region. The crystallite size is large in non-welded region and becomes smaller in the welded region. In the center cut piece, the crystallite size other than a welded area is larger than all other areas due to the rolling process of the iron making.
The second example used a Li ion battery [23]. We measured a commercial battery during charging and observe the interlayer lattice spacing of d002 (lattice plane distance of {002} planes of graphite). Figure 5 shows a photo of the sample and the results. The viewed area is 90 mm × 90 mm. The lattice spacing d002 is originally the graphite one and increases with charging from Stage 4 to 1 [24]. Here, the stage scale is shown at the right side of the figure. This measurement is not so easy especially at CANS, since Li is a strong neutron absorber and the transmission becomes very small at a neutron wavelength of 0.67 nm corresponding to d002. Therefore, very low background measurement was required. Another difficulty came from scattering from hydrogenous materials and to reduce such scattered neutrons, we looked for the optimal setting position of the sample. We succeeded in observing the d002 Bragg edge and analyzed the transmission by using the RITS code [22]. It indicated that with increasing charge, the stage goes up midway between stage 3 and 4. The distribution of interlayer spacing is not uniform and size of regions with similar d002 value is more than a few mm.
The third application at HUNS is elemental distribution measurements and temperature measurements. In this application resonance peaks of materials were used to identify elements and to evaluate temperature. By using Ta resonance peak, it was already shown that a resonance peak was broadened with increasing temperature and spectrum analysis of this peak gives temperature information of a Ta sample. The temperature obtained by the resonance broadening was almost consistent with actual temperature above about 250 K [25]. A model cylindrical sample is shown in Figure 6, which consists of In and Ta (outer shell) and Ta (core) mixed with Al oxide [26]. In this measurement we measured prompt γ-rays as a function of neutron flight time at a time of flight resolution of about 0.2%. Position dependent data were obtained by scanning the sample to deduce a CT image. Using the resonance peak energy, elemental distributions of In (1.44 eV) and Ta (4.28 eV) were obtained. The results are shown as upper images of Figure 6. Furthermore, to measure a temperature distribution we put a line heater at the center of the rod. With the aid of doppler broadening analysis of Ta resonance peak, the temperature distribution was deduced. Lower half of Figure 6 indicates the temperature distribution. The left figure maps temperature and the right figure indicates one dimensional distribution. A solid line shows the temperature distribution of a simulation. The experimental result is similar to the calculated one but there exists a wavelike oscillation. This is mainly due to the large spatial resolution (about 2 mm in width) of each measuring point for CT.

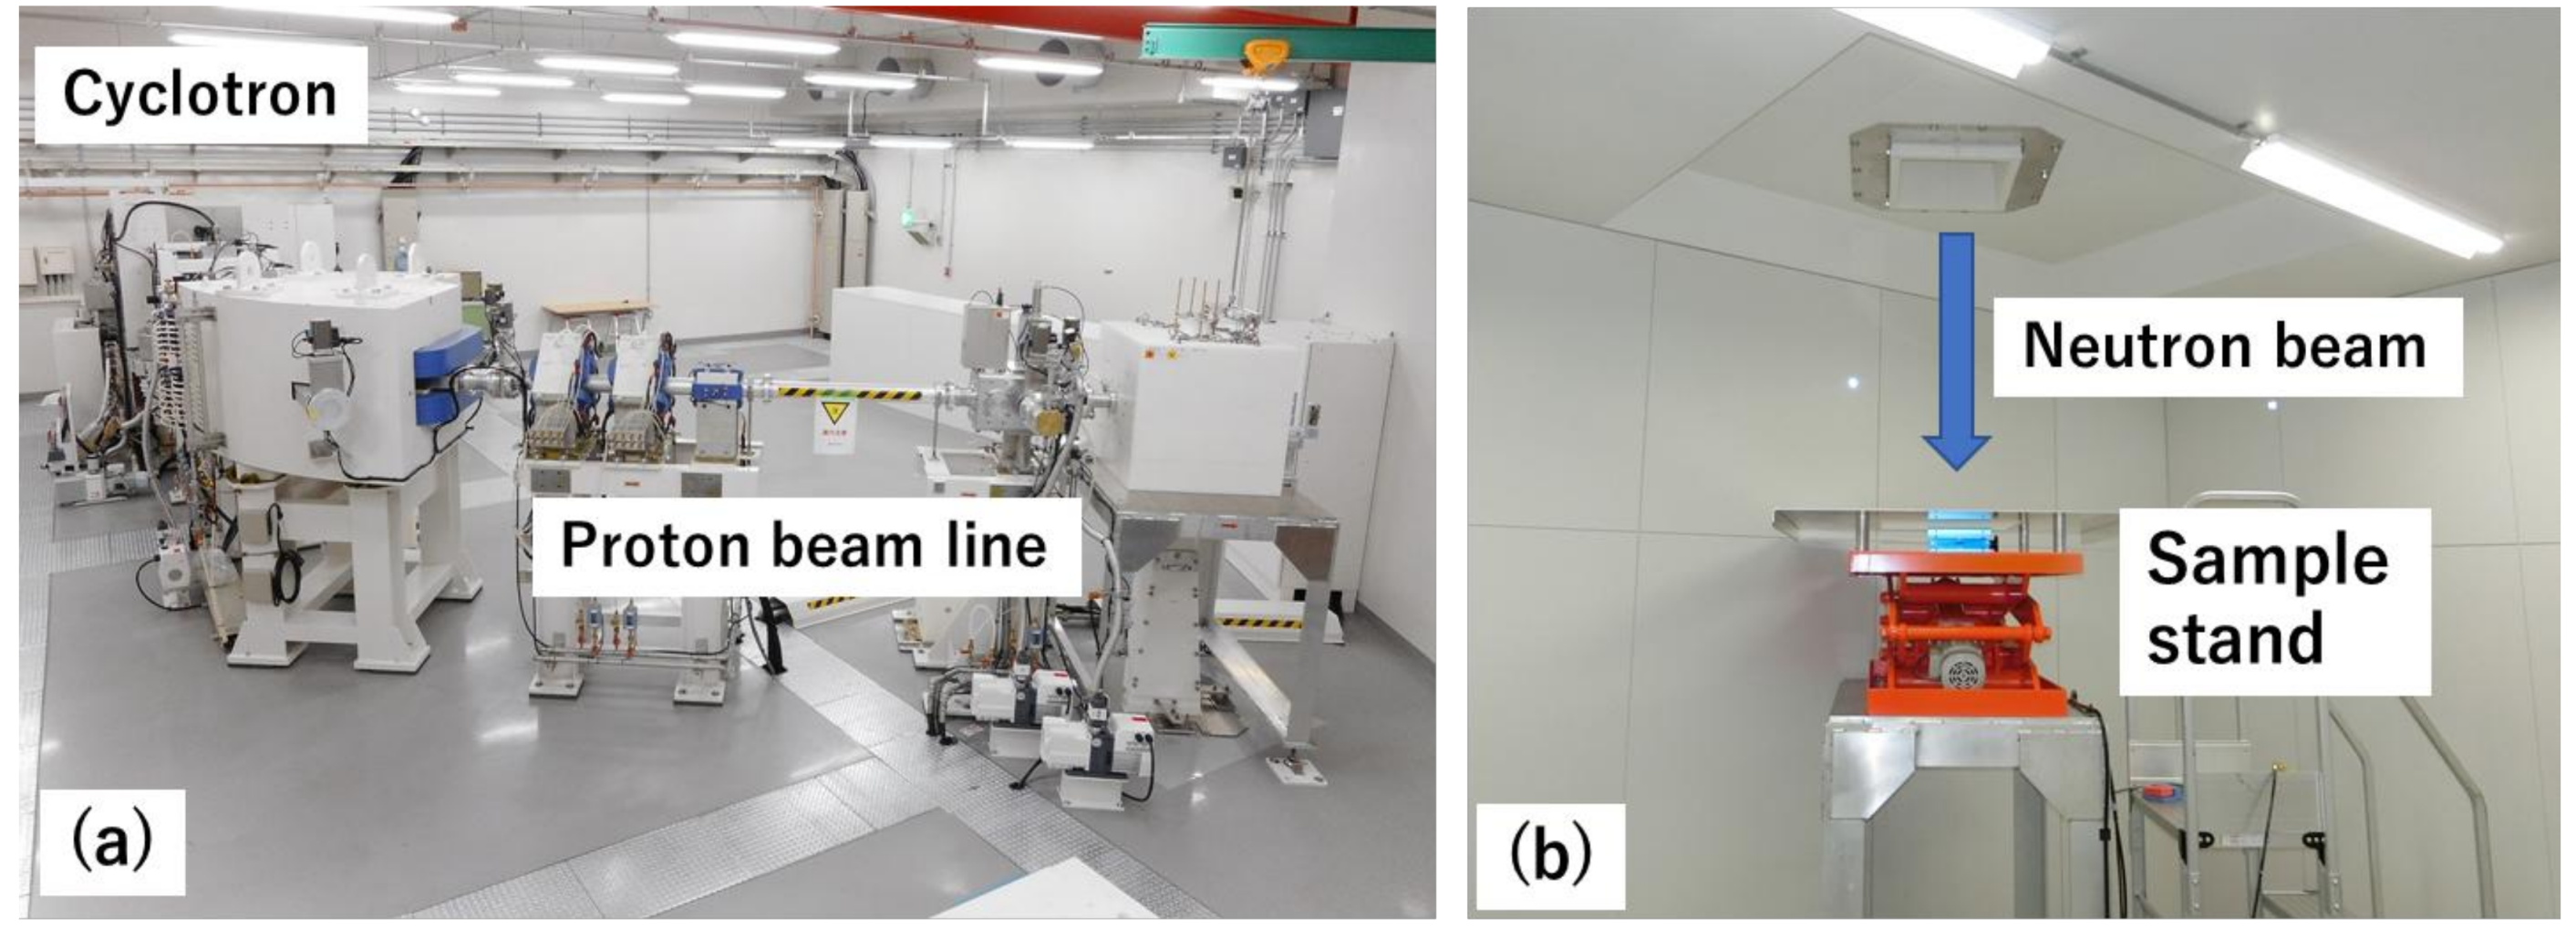
3.2. Aomori Prefecture Quantum Science Center

This new facility opened in October 2017 and is still under commissioning. This is multi-purpose proton accelerator facility that includes neutron imaging. Figure 7a shows a photo of the accelerator and proton beam line, and Figure 7b a vertical irradiation room. A cyclotron accelerator with 20 MeV and 50 μA is used for neutron generation and the neutron target is Be. There are horizontal and vertical beam lines, both viewing a thermal moderator. The thermal neutron flux at 2.333 m from the moderator is 6.1 × 10⁵ n/s/cm2. L/D value is about 44 and a film method is used for neutron imaging measurement. The applications include plastic detection in metal materials and imaging of water in plants.

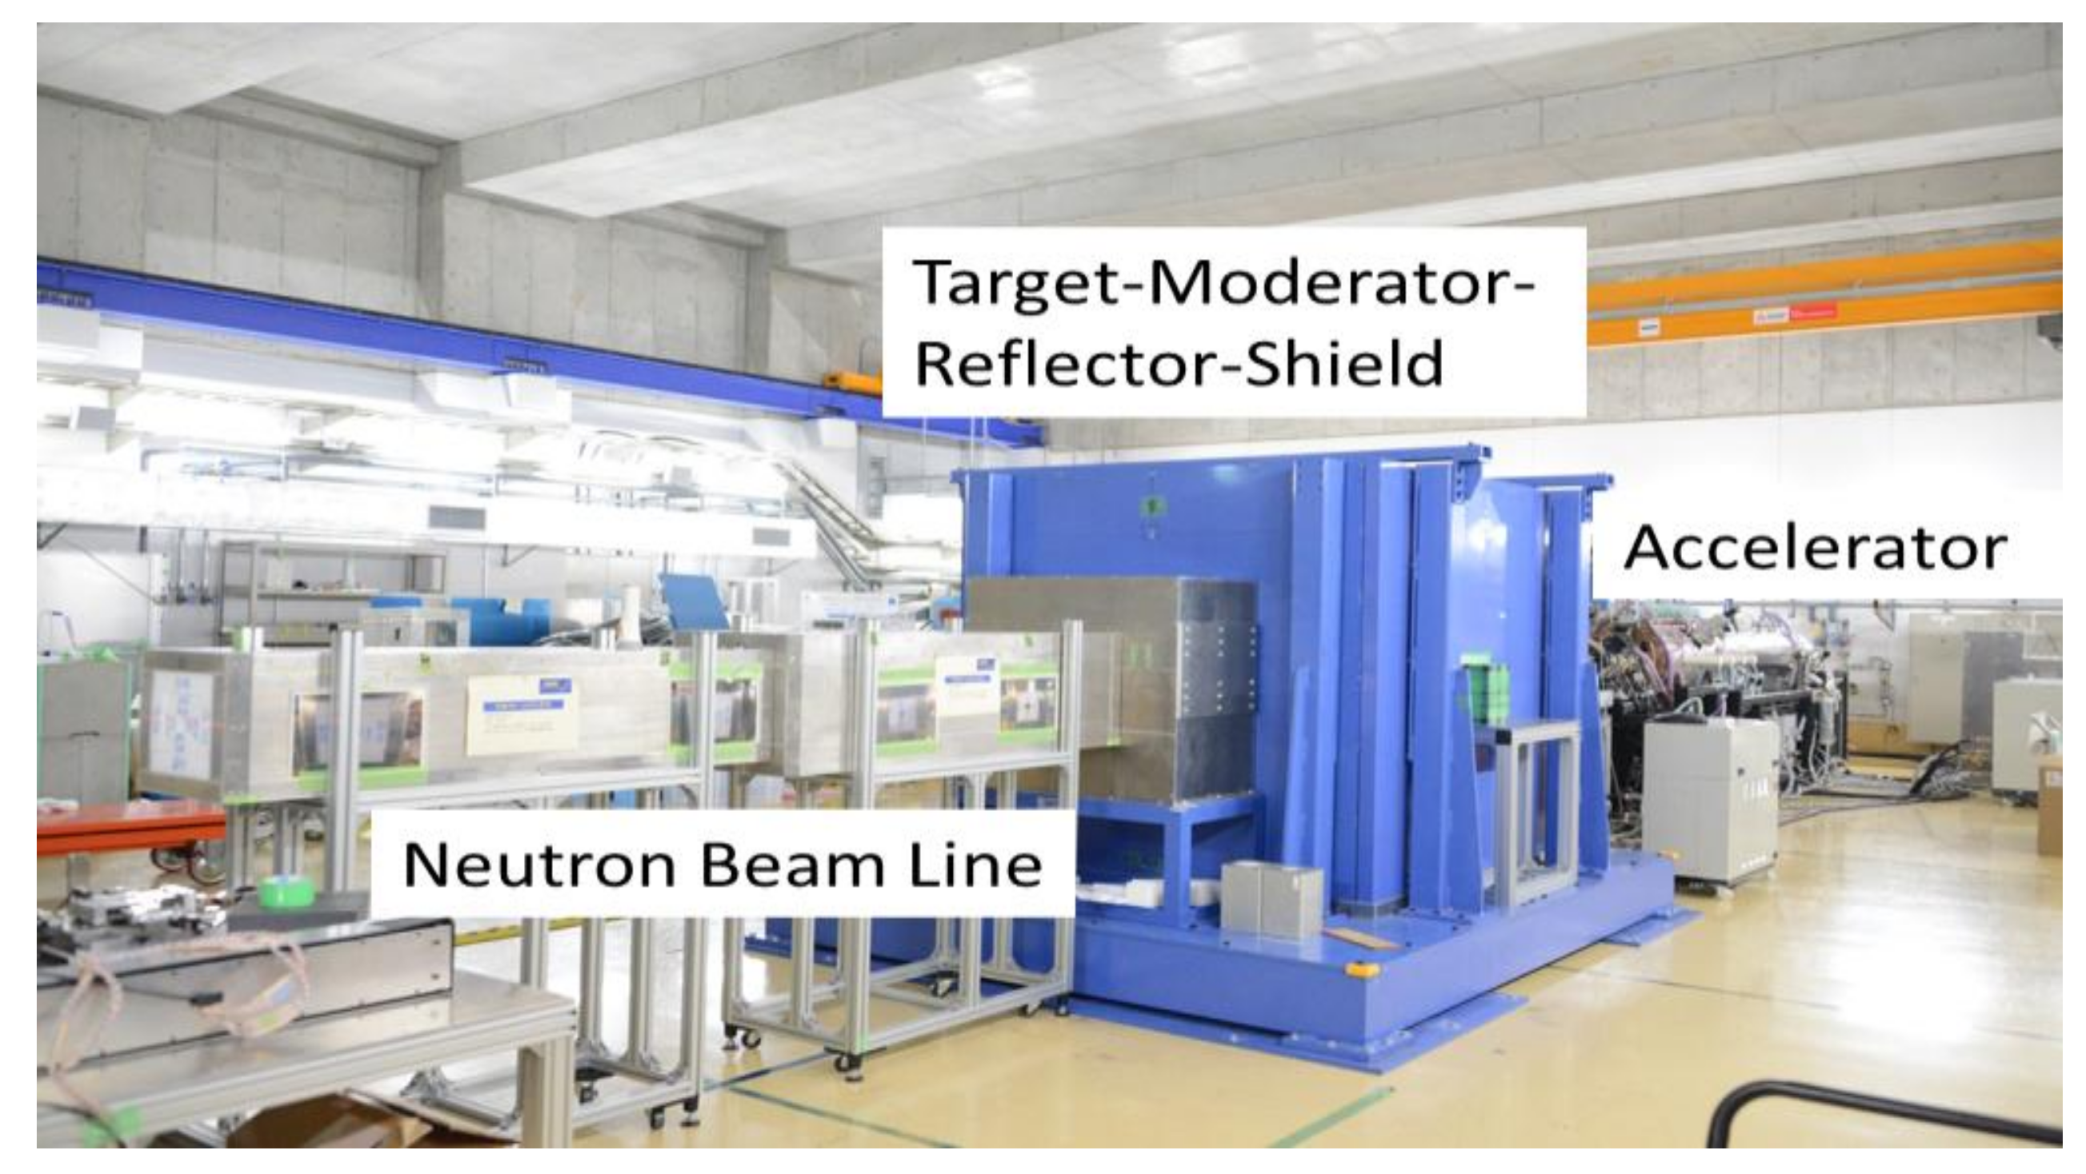
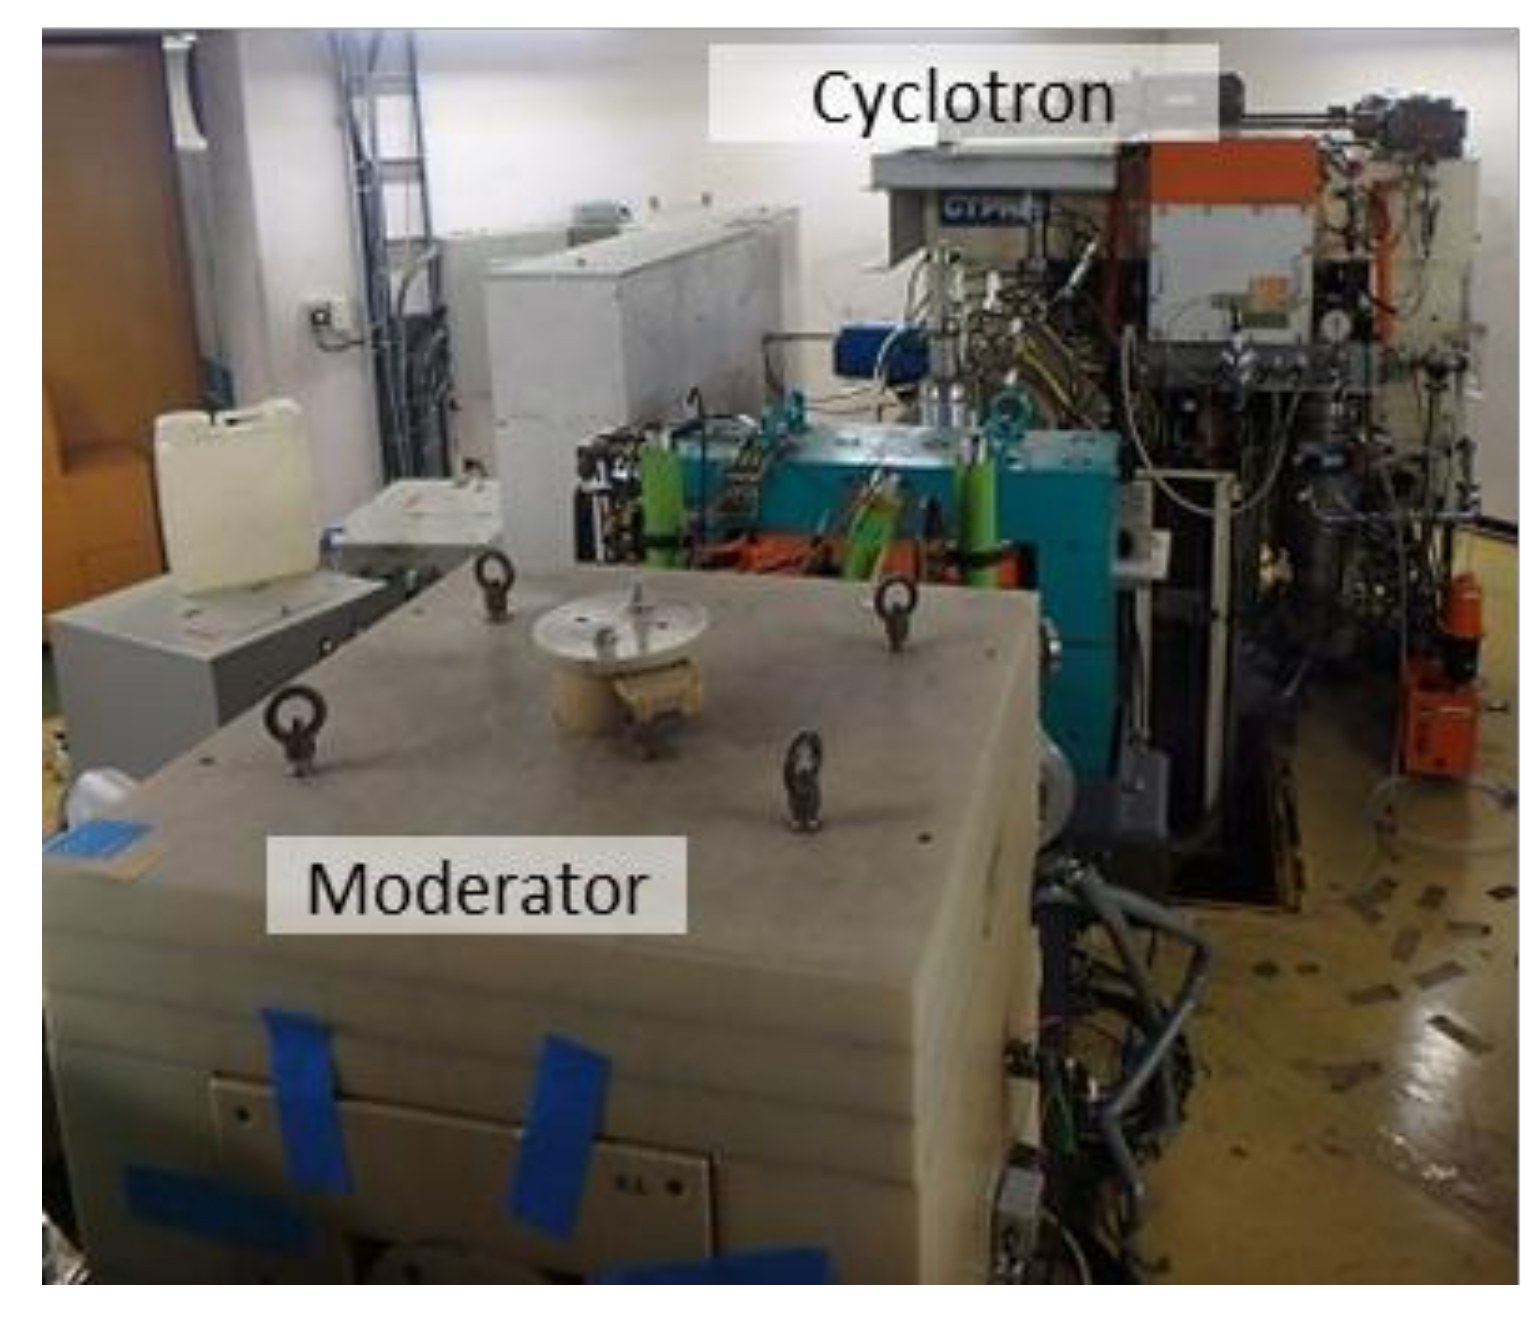
3.3. RIKEN Compact Accelerator-Driven Neutron Source (RANS)

A proton linac whose maximum energy is 7 MeV and current 100 μA was installed at RIKEN, and the first beam was delivered in 2013 [5]. A photo of the linac, the target-moderator-reflector system with a shield and neutron beam line is shown in Figure 8. The neutron intensity produced at a Be target is around 1012 n/s. Thermal neutron flux is about ~104 n/s/cm2. L/D values possible at RANS are listed in Table 2. The L/D can be changed from 21 to 781 by using different path lengths and collimators. Various detectors are available as shown in Table 3, and the last two can be used for the time-of-flight method. The neutron beam is also used for neutron diffraction and neutron device development.
Imaging experiments were firstly performed for normal steel and corrosion-resistant alloy to observe rust under a paint film. Figure 9 shows transmission images of corrosion at fully wet and dry conditions of a corroded normal steel sample [9,10]. The L/D value was 33 and a neutron camera was used for the measurement. This indicated that neutron imaging can observe a corrosion region as well as a water region. Time-dependent water images of painted steel samples with under-film corrosion were obtained for 150 min while samples were dried. The alloy sample contained less water than the normal sample and the water in the alloy escaped more rapidly than that in the normal steel. As a result, it was demonstrated that the alloy steel had better corrosion resistance [10].
The sond example is water penetration in a concrete block. This has been an important item for a long time and now relates to infrastructure soundness. Figure 10 shows transmission images of the concrete block and penetrated water [27,28]. They were measured by using the neutron color I.I. detector at L/D = 21. The penetration of water was clearly observed from 3.3 to 187.2 h.

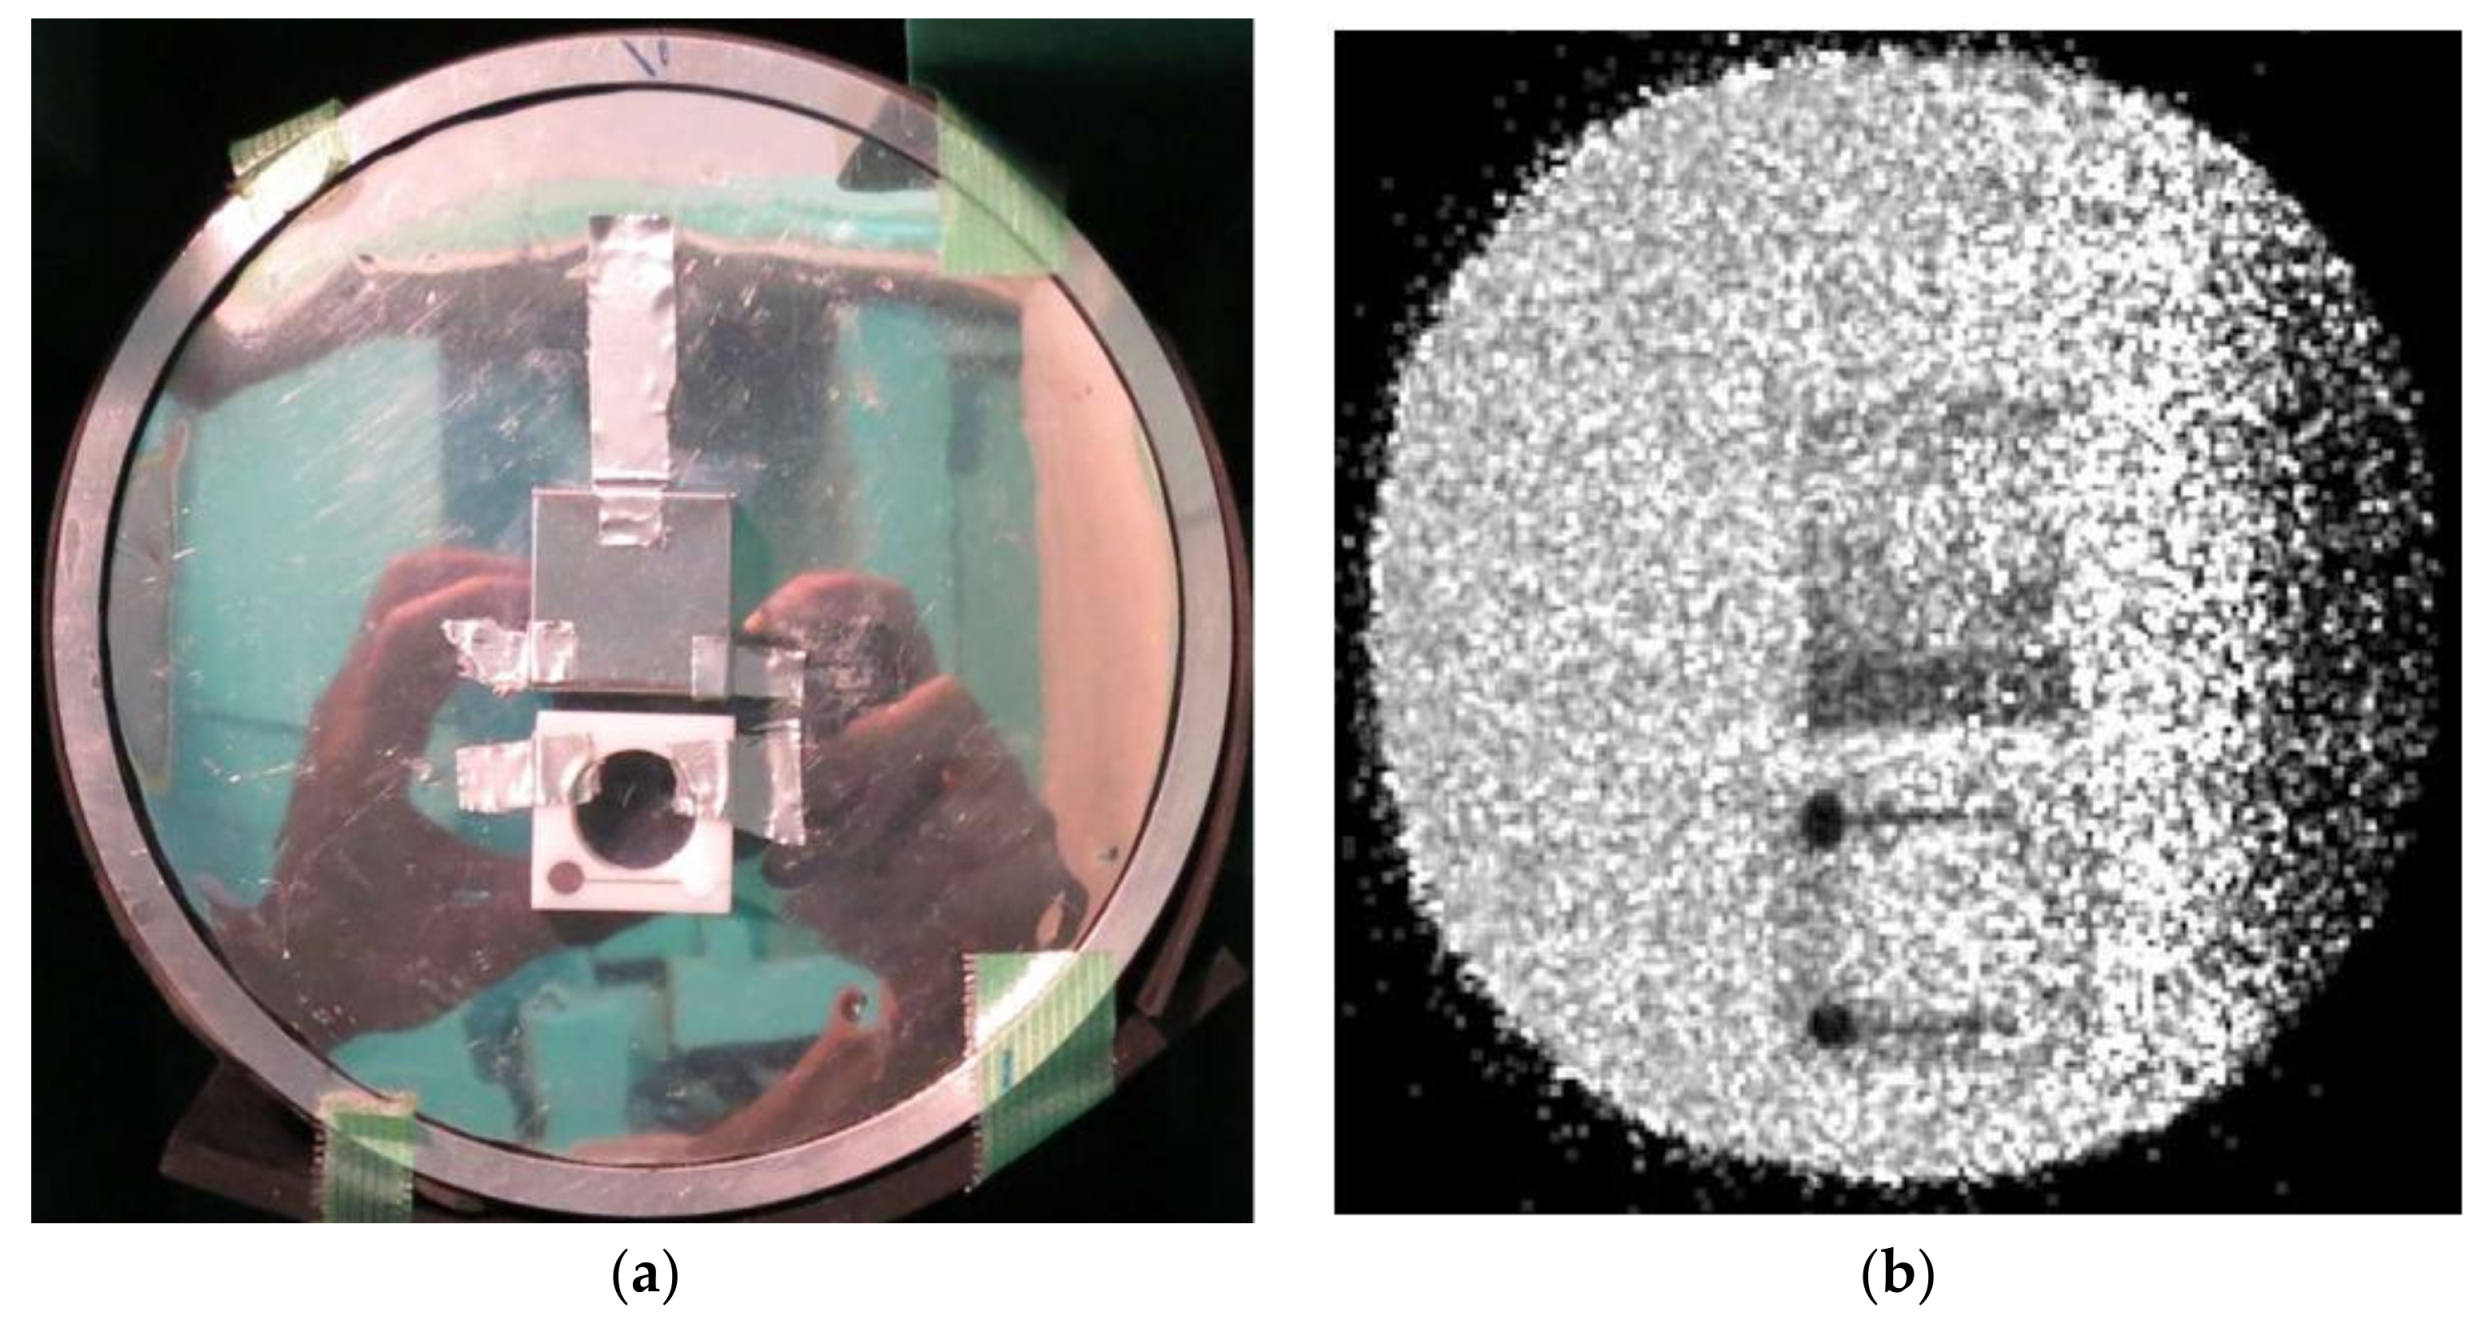
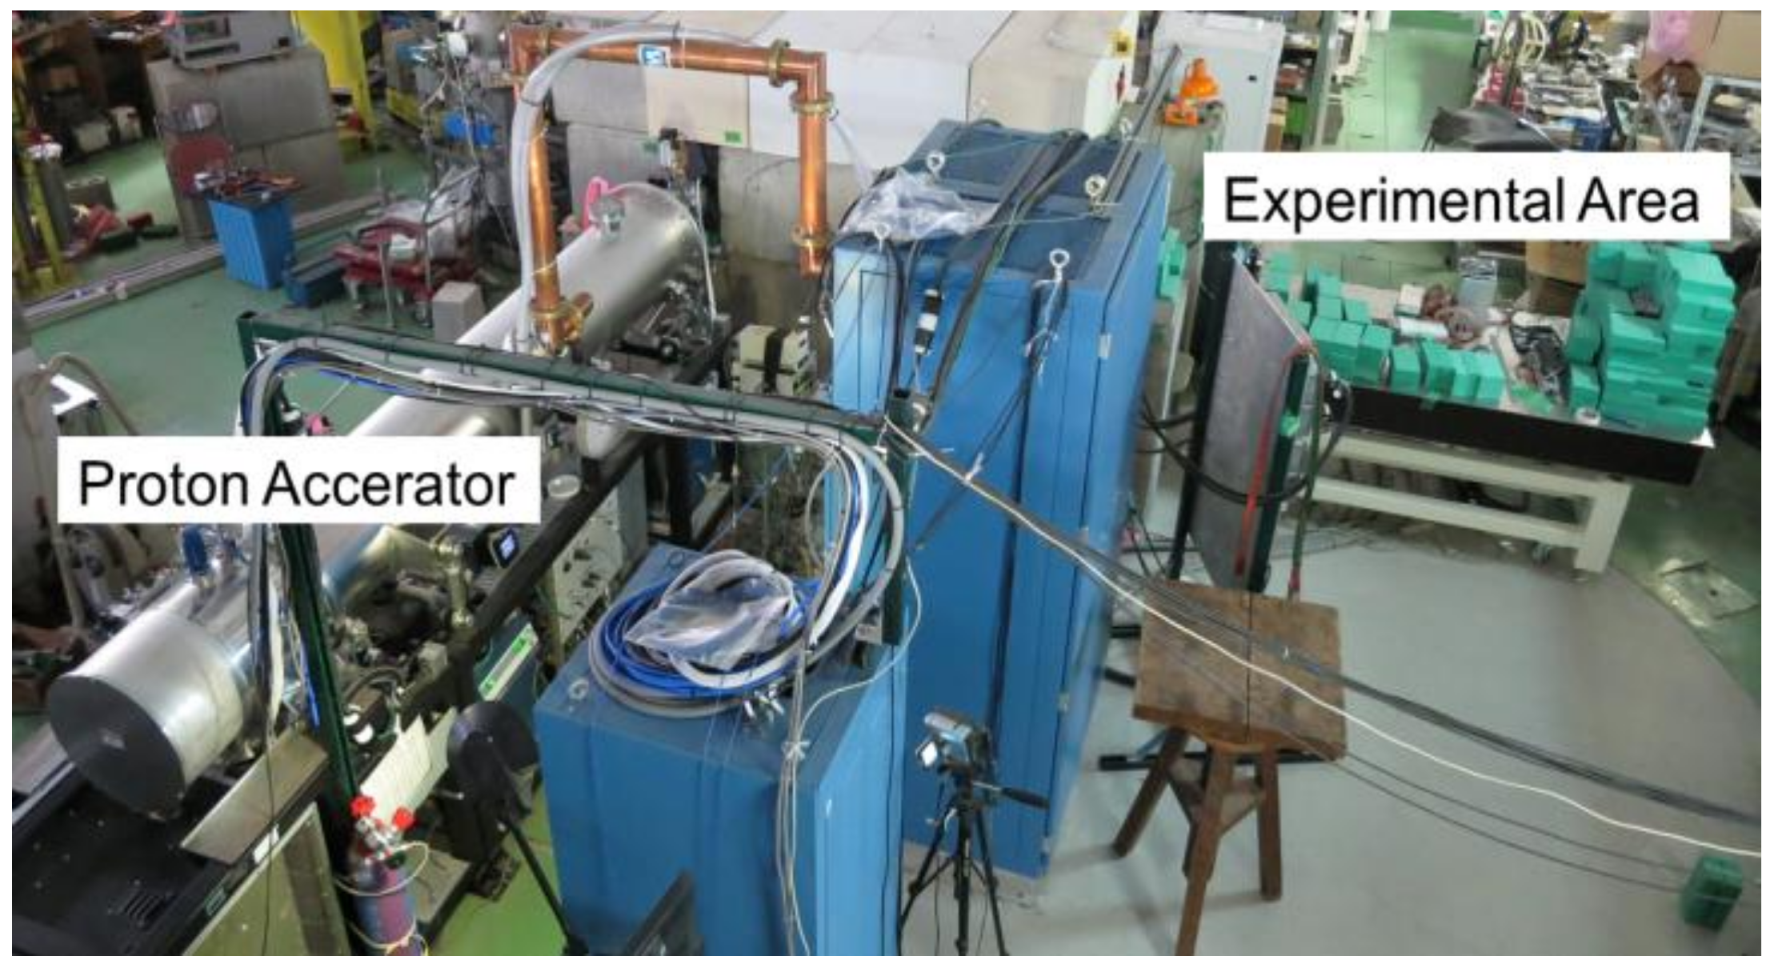
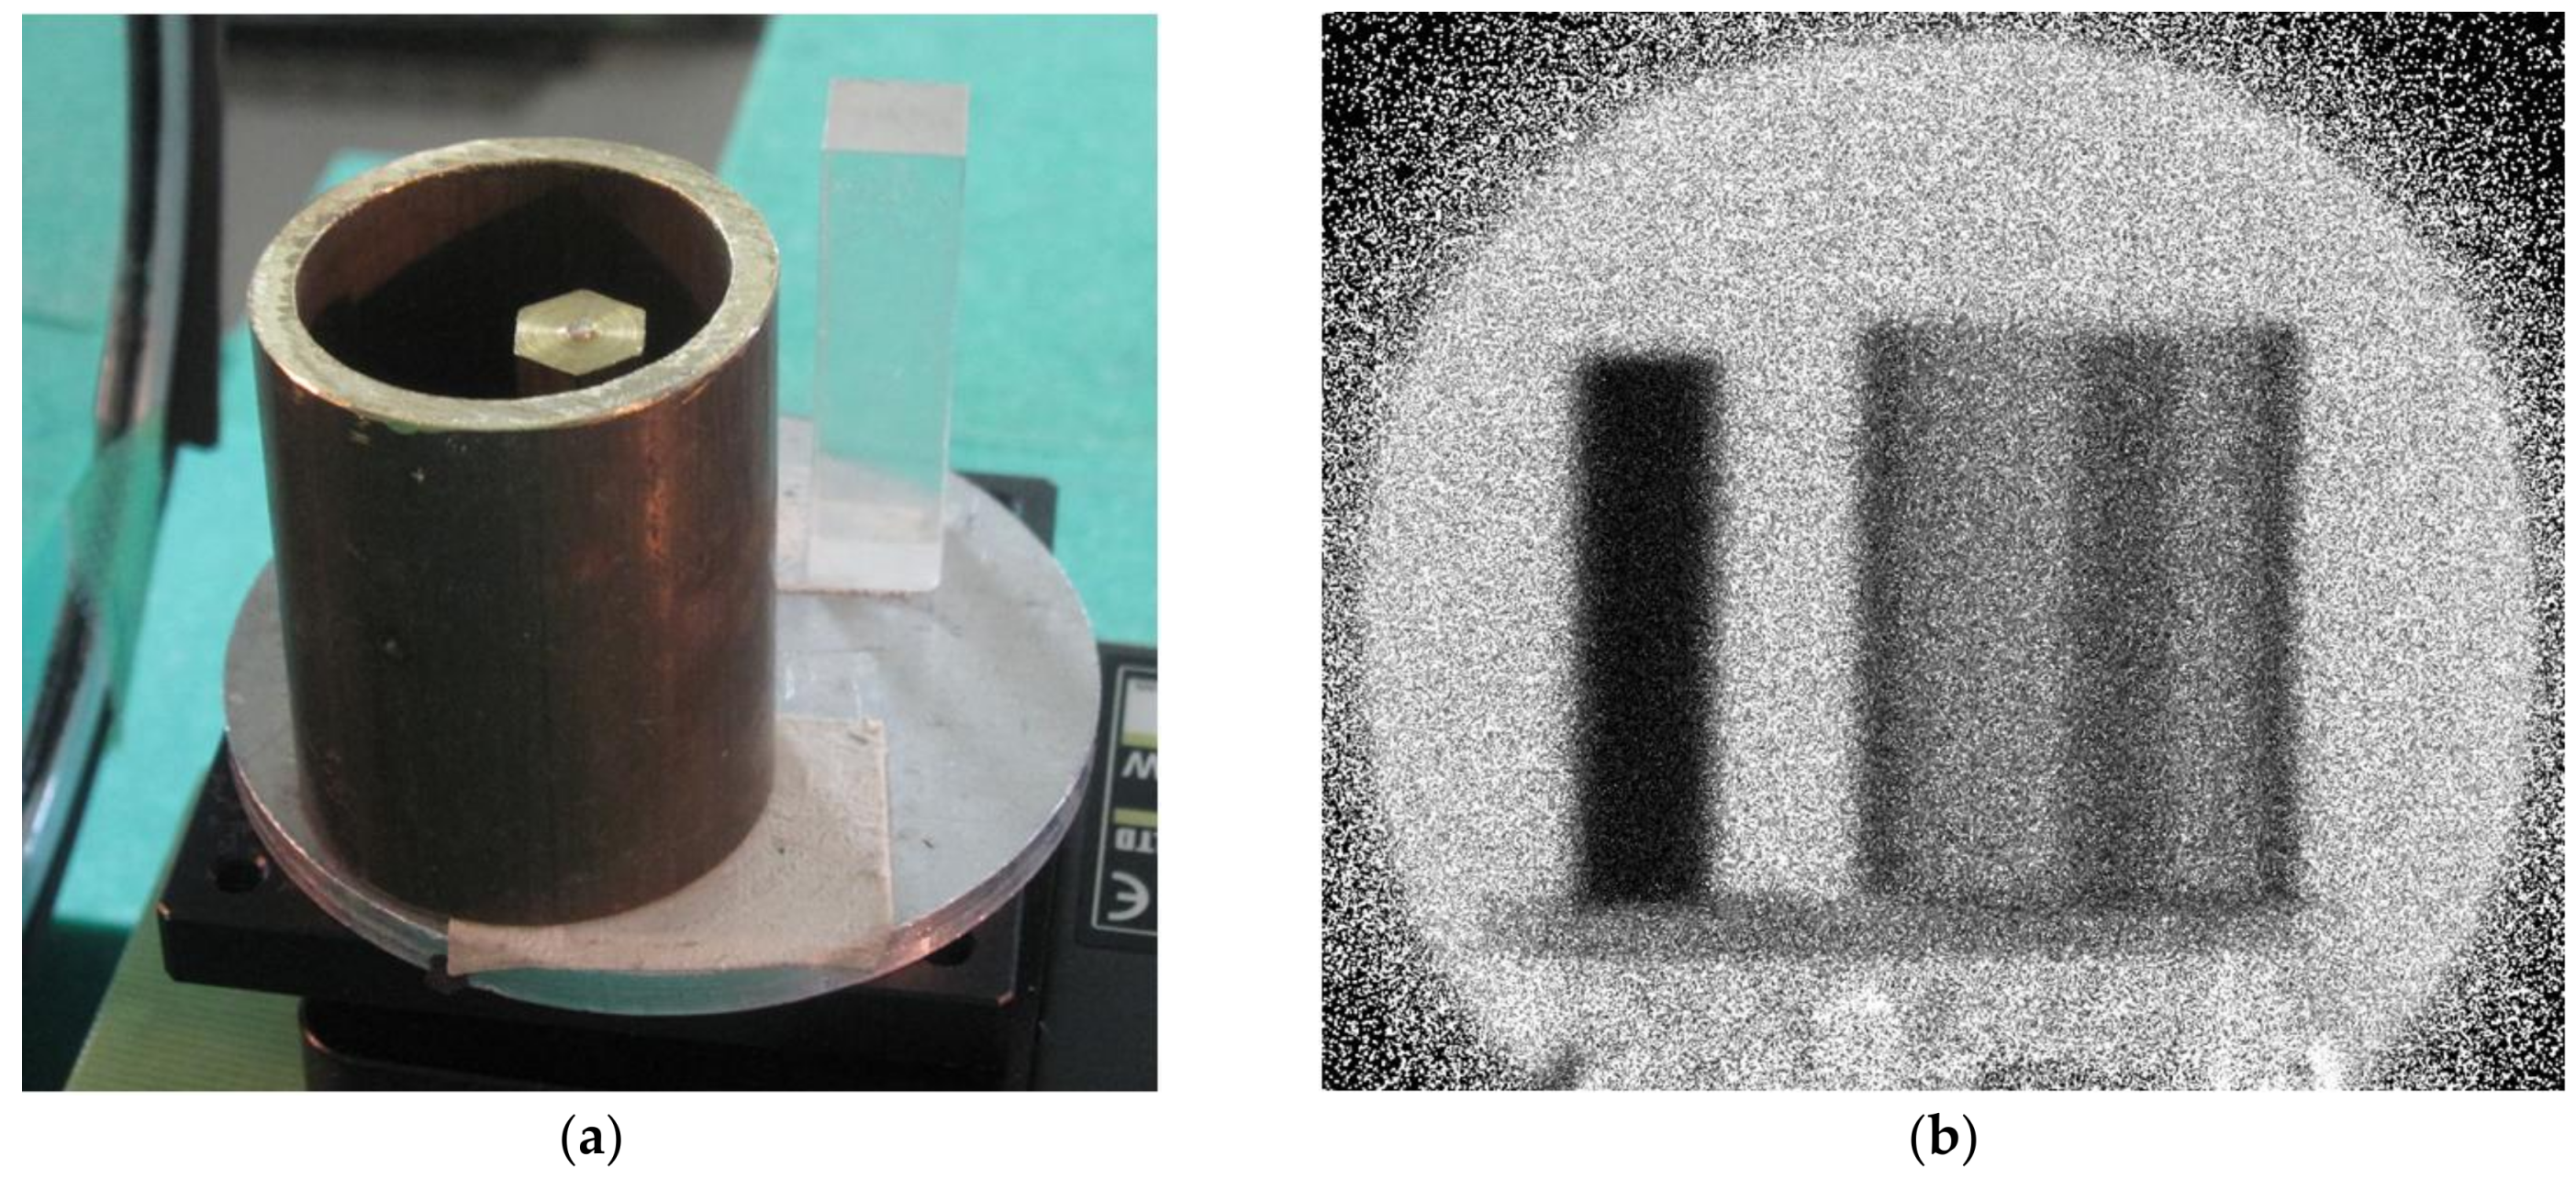
3.4. Kyoto University Accelerator-Driven Neutron Source (KUANS)

A proton linac with 3.5 MeV and 100 μA is used for neutron generation and was installed in 2011. The power of this accelerator is half that of RANS and the neutron intensity (~1011 n/s) is smaller than that of RANS by about one order of magnitude due to a low proton energy. Figure 11 shows a photo of accelerator room. The neutron flux is 1.2 × 10³ n/s/cm2 at a wavelength region over 0.1 nm at a position of 1.945 m from the moderator. At this position the L/D value is 20. A detector consisting of a Li scintillator coupled with a position sensitive photomultiplier tube is used for imaging and time-of-flight measurement can be done. Therefore, wavelength dependent images can be obtained with a time resolution of about 8%. The pixel size is 0.5 mm and the active area is 70 mm in diameter. Here, neutron device development and basic test of the reflectometers have been performed.
Figure 12 shows transmission results of standard samples of the ASTM (American Society for Testing and Materials) for neutron imaging. A part of a step wedge (upper image) and neutron absorbing samples (lower image) were observed as shown in Figure 12. The exposure time was 30 min at L/D = 30 (3 m from the moderator). Figure 13 shows a transmission image example of a brass rod in a copper cylinder and an acrylic column.

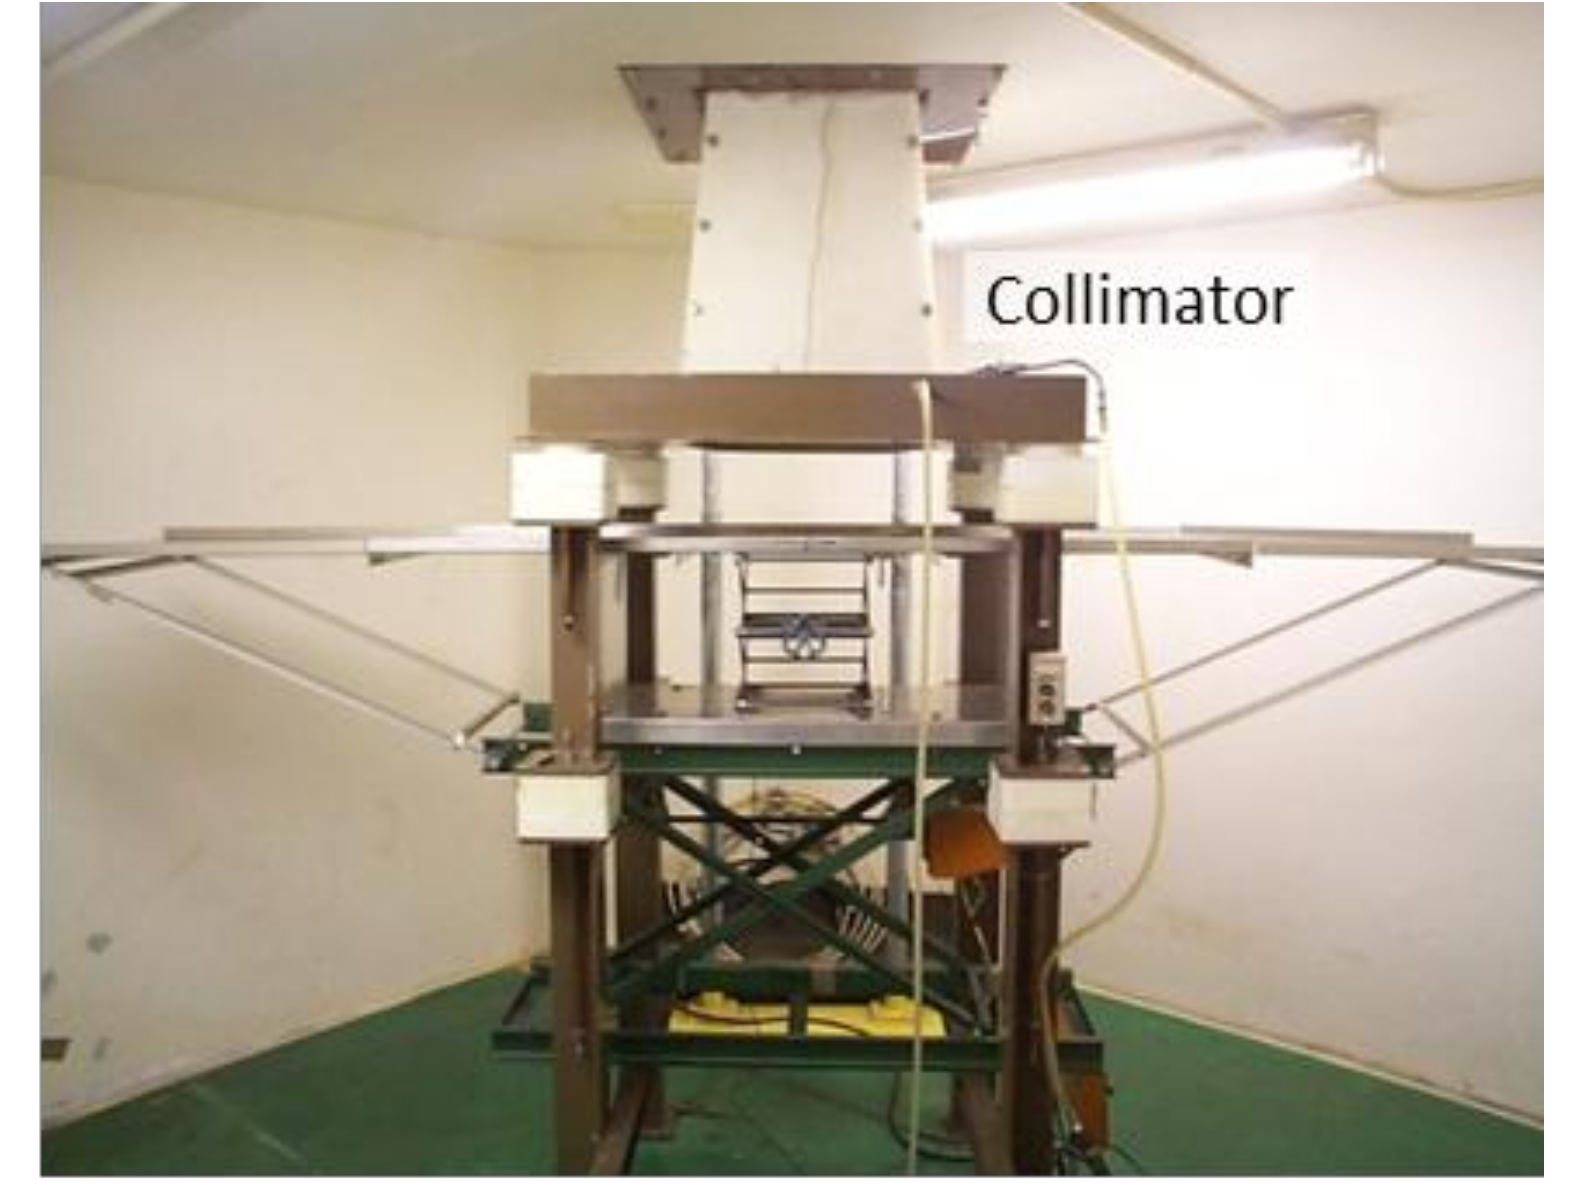
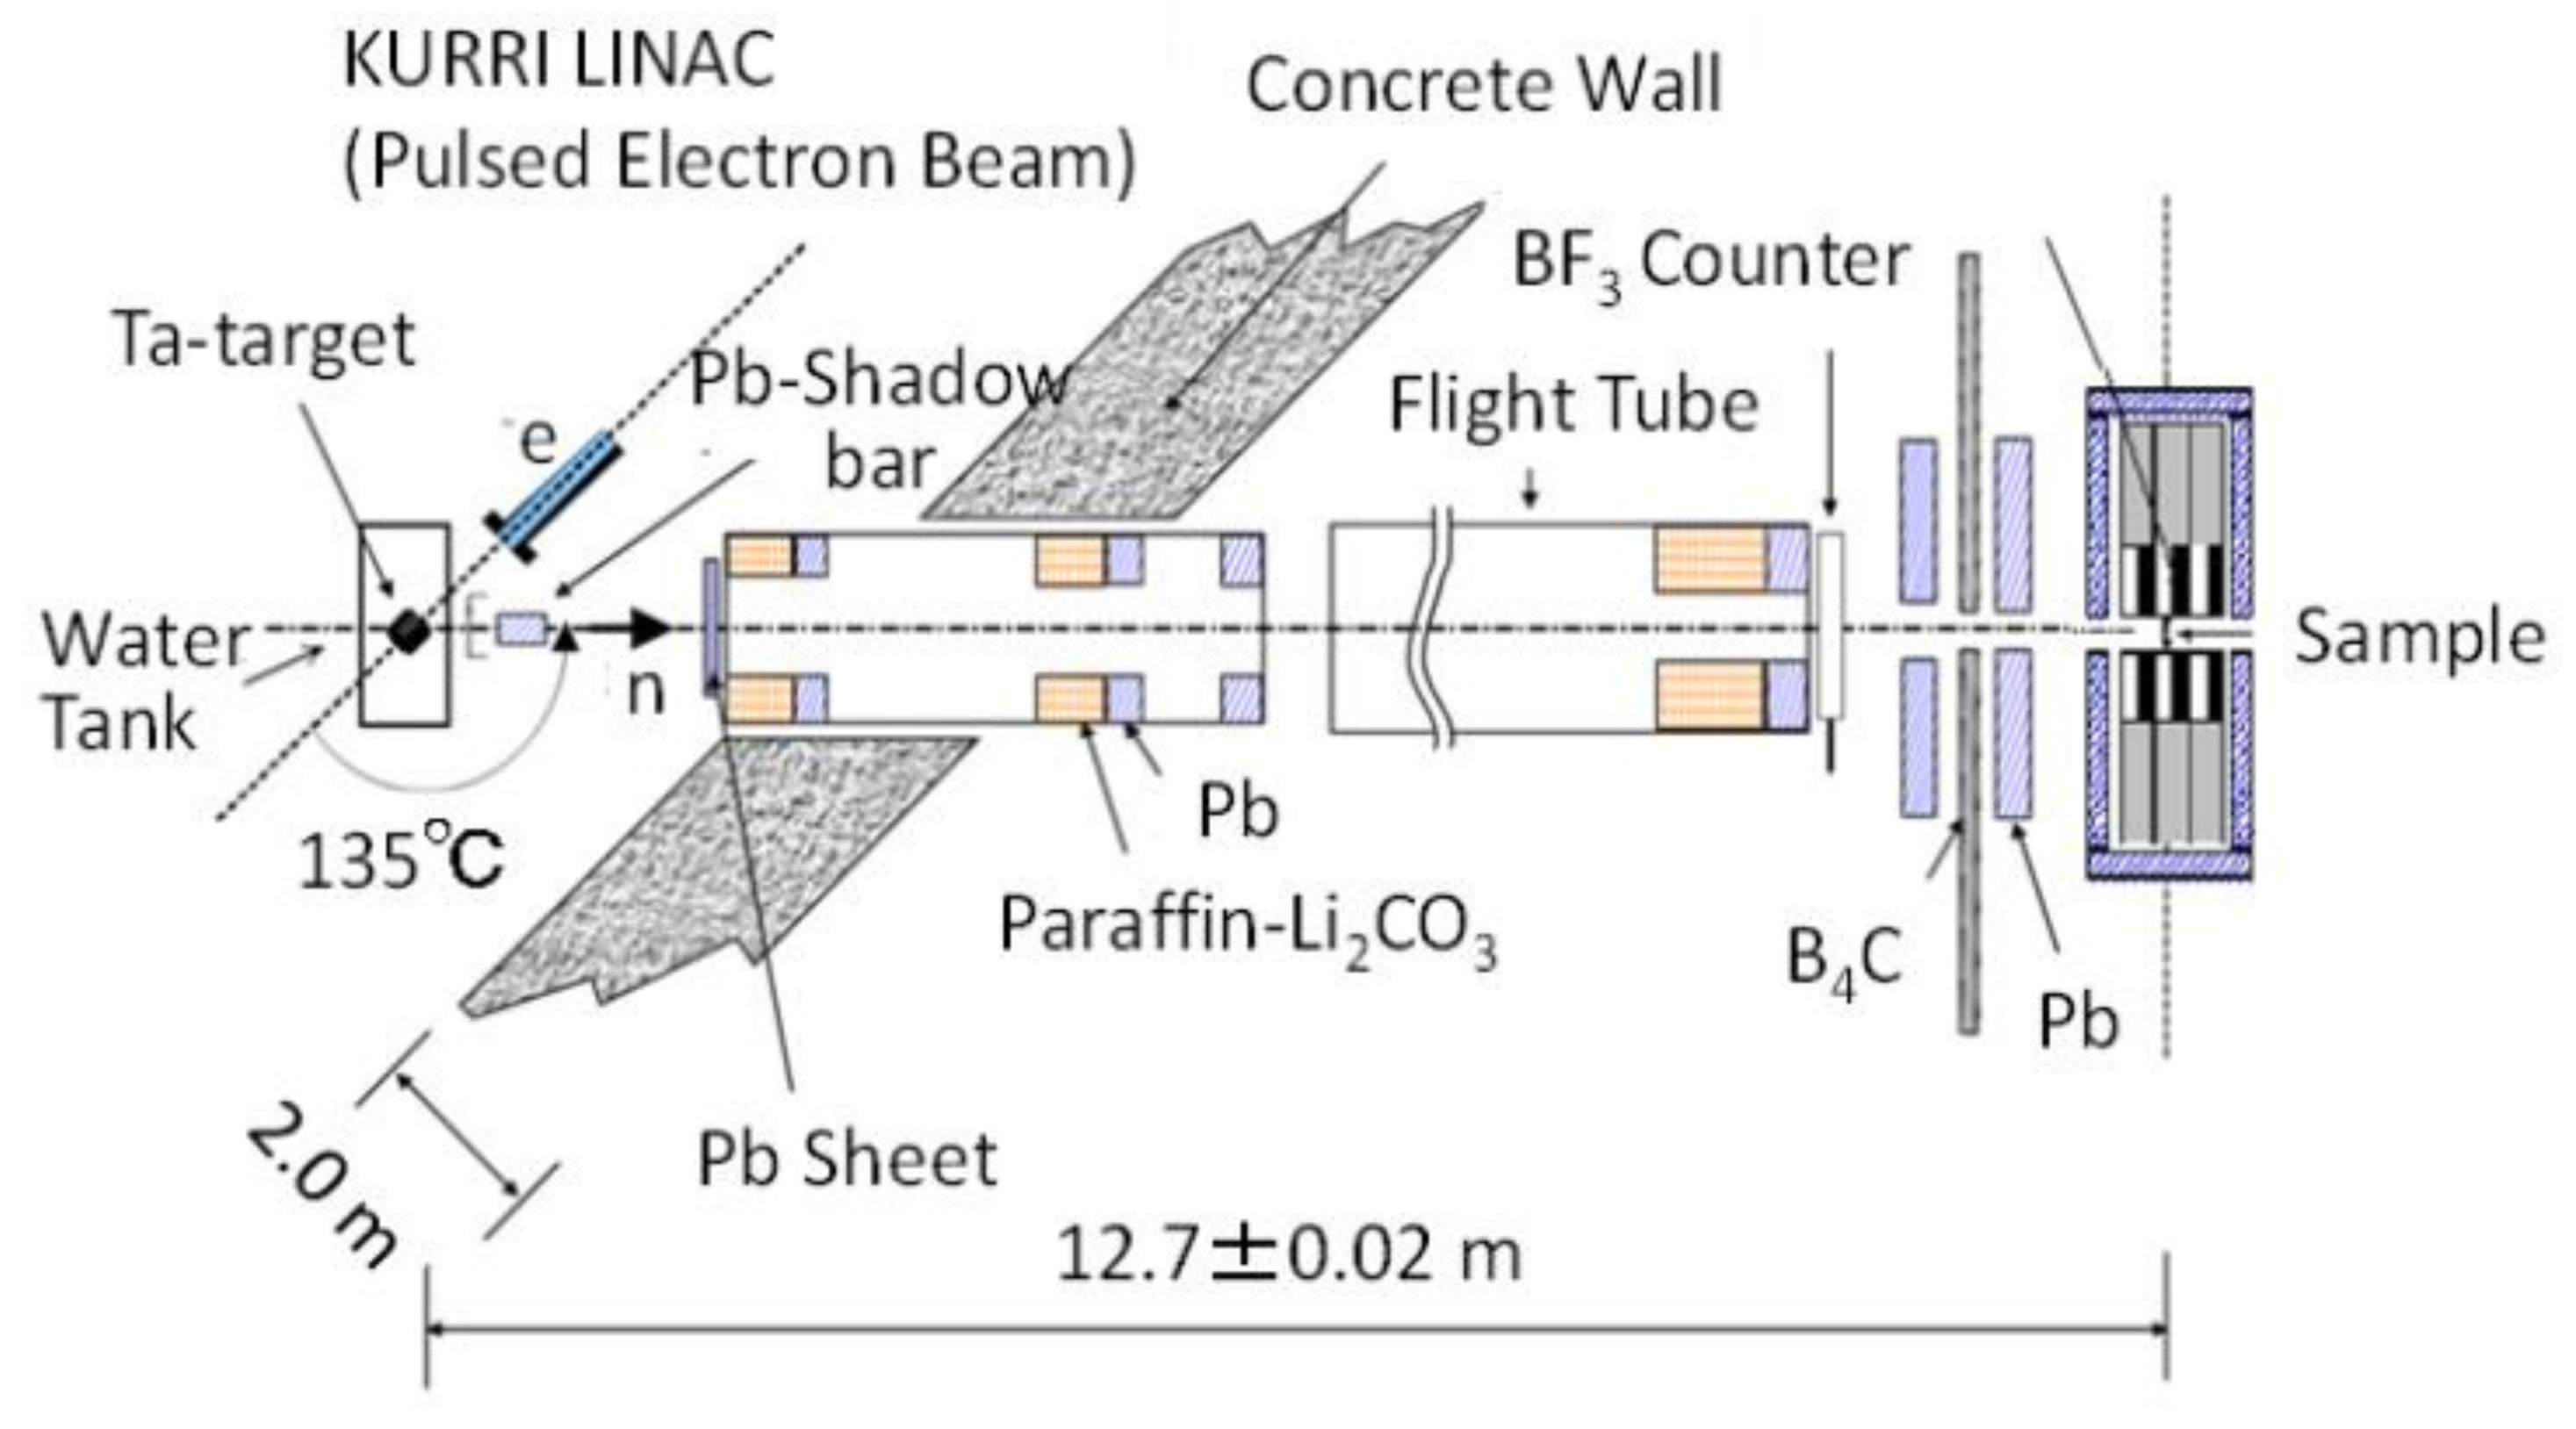
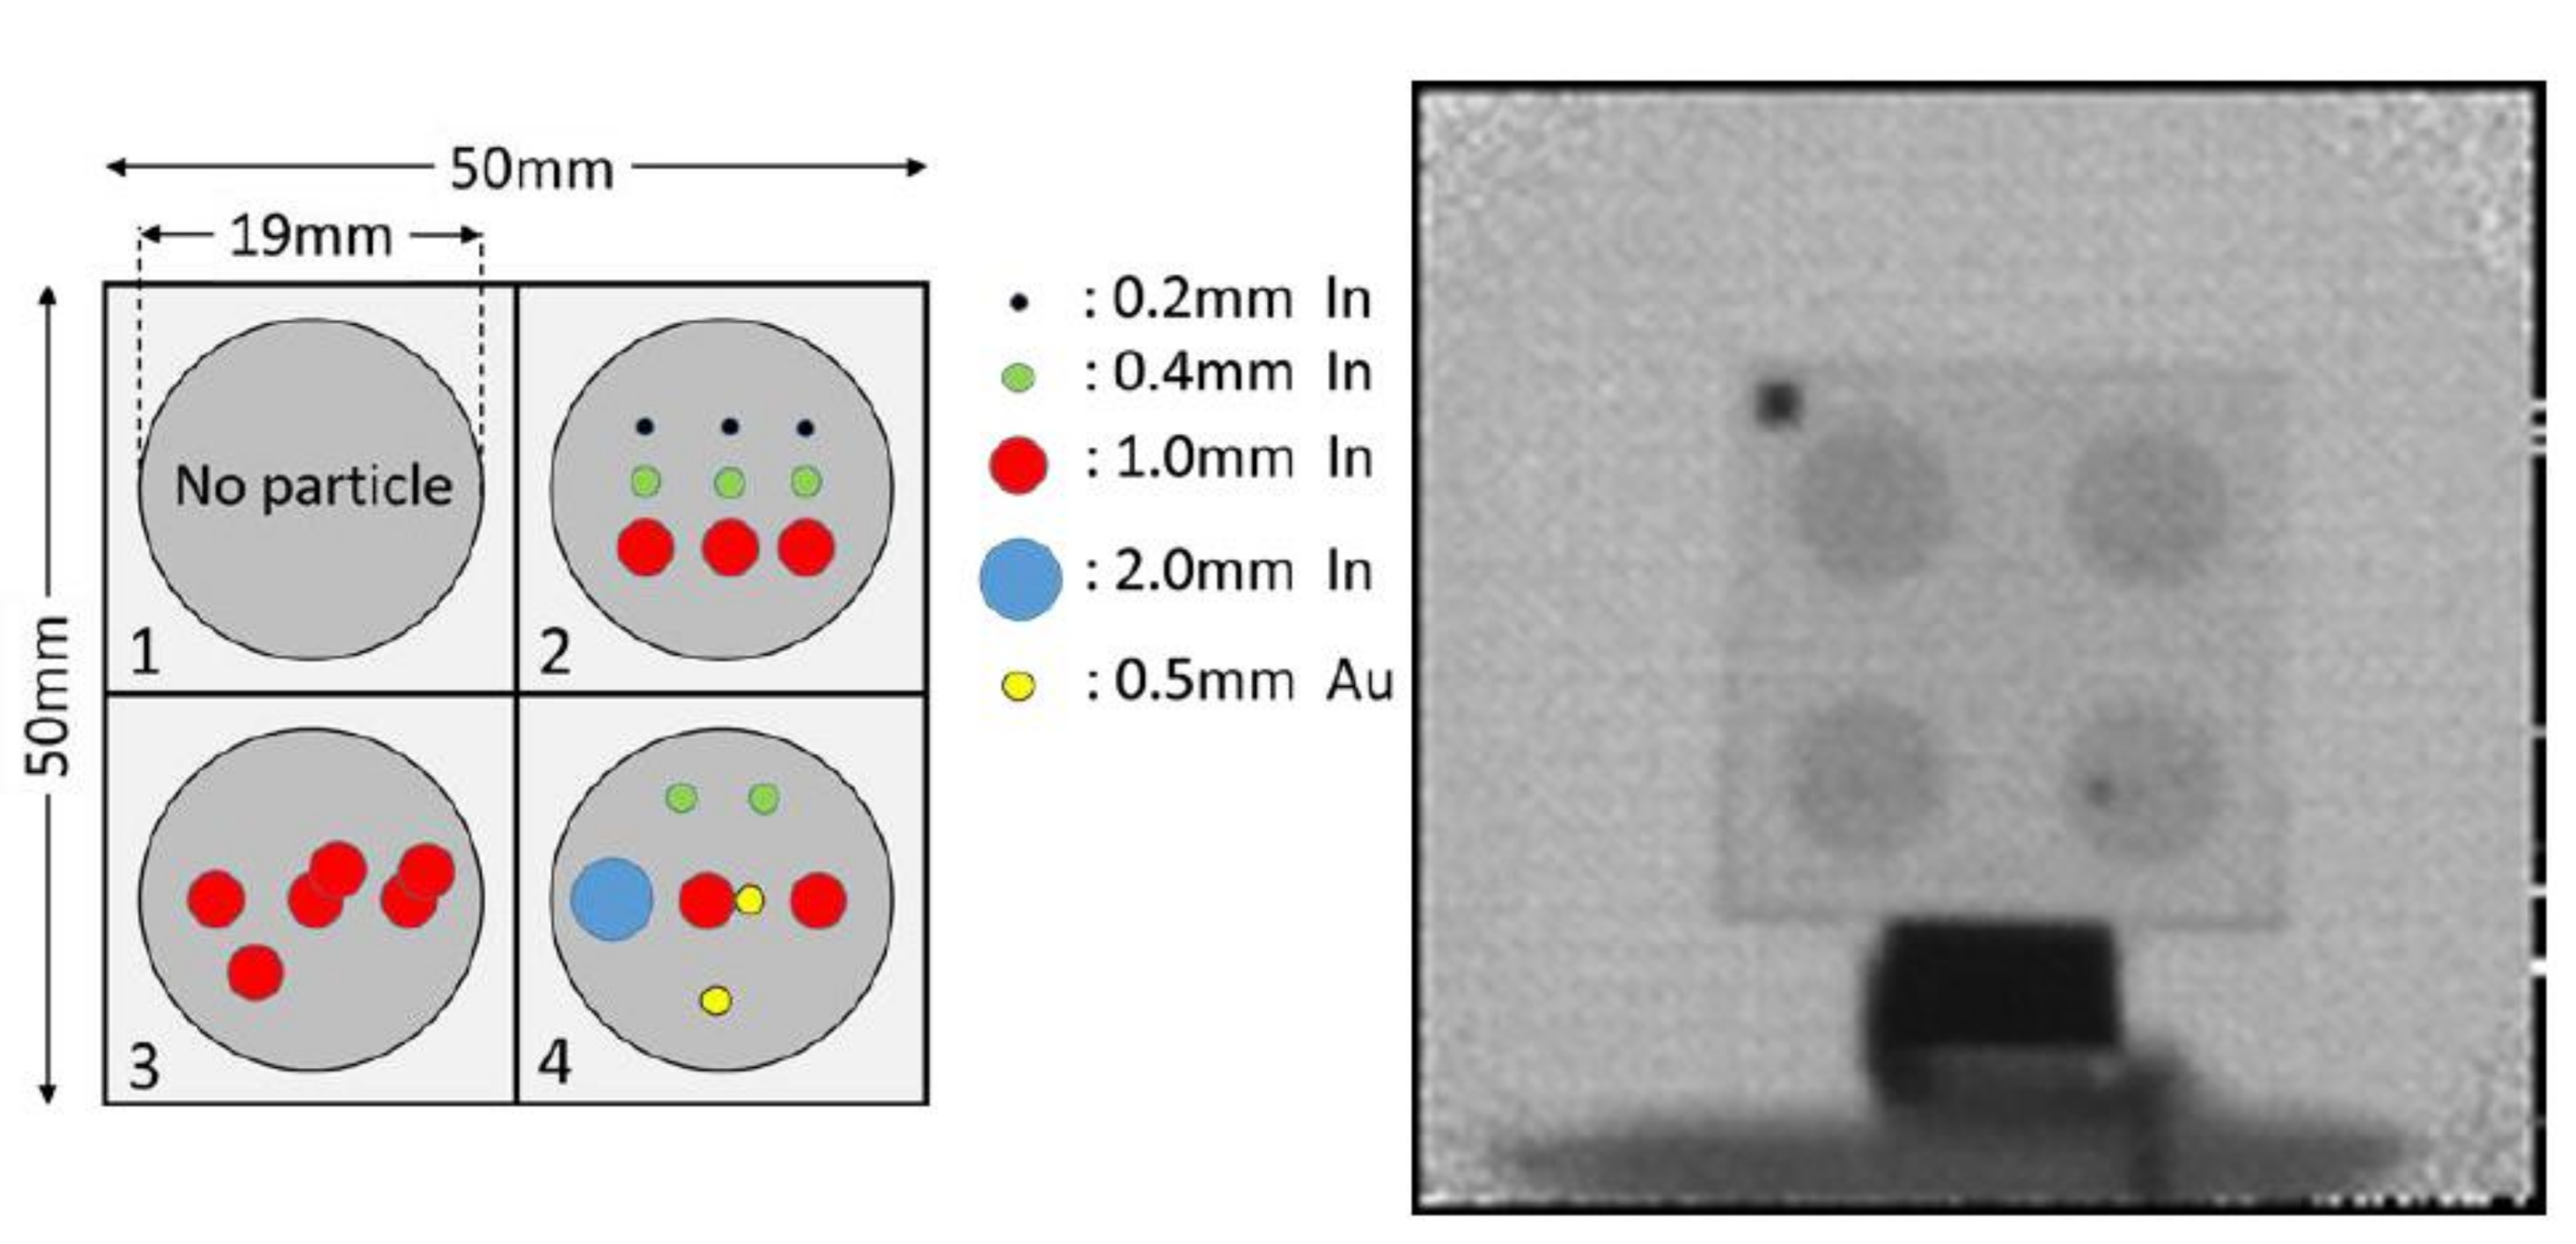
3.5. Kyoto University Research Reactor Institute LINAC (KURRI-LINAC)

Here, an electron linac is used for neutron production. This facility was established in 1965 and the neutrons have been mainly used for nuclear engineering fields, such as reactor physics and nuclear data measurements. Recently neutron imaging experiments started for nondestructive test of nuclear fuel [11]. The maximum energy is 46 MeV and the maximum current 200 μA. Figure 14 shows the layout of the beam line, and Figure 15 shows the target-moderator-reflector system and the inlet of the flight path. The flight path length is about 12.7 m.
The thermal neutron flux is 2.36 × 10⁴ n/s/cm2 at the sample position. The L/D value is about 80 at minimum. To observe impurities and voids in a nuclear fuel, various size pieces of In and Au were placed in a simulated fuel sample composed of Bi2O3 and Nd2O3. A transmission measurement was performed by using a GEM detector. Figure 16 show results from a preliminary experiment, and the thermal neutron transmission image indicated that a size of 2 mm In could be detected in this system.

3.6. Sumitomo Heavy Industry ATEX (SHI-ATEX)

A proton cyclotron accelerator is used for neutron production, and this is a steady neutron source. This was established in 1979 and is the only commercial neutron source in Japan. Figure 17 shows the cyclotron accelerator and moderator. Figure 18 shows the irradiation area and sample stand. The proton energy is 18 MeV and the maximum current is 20 μA. The thermal neutron flux is 2.0 × 10⁵ n/s/cm2 at a distance of 2.20 m from the moderator. The L/D value is 44 and the field of view is 350 mm × 430 mm. The imaging detectors used are a neutron imaging plate and a Gd converter combined with X-ray film. This facility has been used for aerospace applications, such as checking explosive devices, extraneous materials in casting and inspection of shield materials. Acceleration tests of soft errors induced by neutrons are also performed.

4. Summary

Neutron imaging is becoming popular for investigating materials and industrial objects. Neutron imaging is valuable enough that easier and more frequent access to these facilities would pay large dividends. Compact accelerator-driven neutron sources are compact, cheap, and capable enough to meet this demand. We show several examples of such facilities, their detectors, and sample results. Usefulness of neutron imaging is now much more recognized than before in Japan.

Acknowledgments

The author sincerely appreciate H. Sato and T. Kamiyama at Hokkaido University, A. Taketani and Y. Otake at RIKEN, S. Tasaki, D. Ito, Y. Takahashi and T. Sano at Kyoto University, and Uno at SHI-ATEX, and Uwano at Aomori prefecture for providing information of each facility. Figure 15 is a result of “Development of Non-Destructive Methods Adapted for Integrity test of Next generation nuclear fuels” entrusted to the Kyoto University by MEXT Japan.

Conflicts of Interest

The author declares no conflict of interest.

References

  1. Murakawa, H.; Sugimoto, K.; Miyata, K.; Asano, H.; Takenaka, N.; Yasuda, R. Visualization of water behavior in the in-plane and through-plane directions in a PEFC using a neutron image intensifier. Phys. Procedia 2013, 43, 277–281. [Google Scholar] [CrossRef]
  2. Lehmann, E.H.; Peetermans, S.; Betz, B. Instrumentation in neutron imaging—A world-wide overview. Neutron News 2015, 26, 6–10. [Google Scholar] [CrossRef]
  3. Kiyanagi, Y.; Sato, H.; Kamiyama, T.; Shinohara, T. A new imaging method using pulsed neutron sources for visualizing structural and dynamical information. J. Phys. Conf. Ser. 2012, 340, 012010. [Google Scholar] [CrossRef]
  4. Shinohara, T.; Kai, T.; Oikawa, K.; Segawa, M.; Harada, M.; Nakatani, T.; Ooi, M.; Aizawa, K.; Sato, H.; Kamiyama, T.; et al. Final design of the Energy-Resolved Neutron Imaging System “RADEN” at J-PARC. J. Phys. Conf. Ser. 2016, 746, 012007. [Google Scholar] [CrossRef]
  5. Otake, Y. A Compact proton linac neutron source at RIKEN. In Applications of Laser-Driven Particle Acceleration; CRC Press, Taylor and Francis Group: Boca Raton, FL, USA, 2018. [Google Scholar]
  6. Sunaga, H.; Takamura, M.; Ikeda, Y.; Otake, Y.; Hama, T.; Kumagai, M.; Suzuki, H.; Suzuki, S. Texture evaluation in ductile fracture process by neutron diffraction measurement. J. Phys. Conf. Ser. 2016, 734 Pt B. [Google Scholar] [CrossRef]
  7. Takamura, M.; Ikeda, Y.; Sunaga, H.; Taketani, A.; Otake, Y.; Suzuki, H.; Kumagai, M.; Hama, T.; Oba, Y. Non-destructive Texture Measurement of Steel Sheets with Compact Neutron Source “RANS”. J. Phys. Conf. Ser. 2016, 734 Pt B. [Google Scholar] [CrossRef]
  8. Ikeda, Y.; Taketani, A.; Takamura, M.; Sunaga, H.; Kumagai, M.; Oba, Y.; Otake, Y.; Suzuki, H. Prospect for application of compact accelerator-based neutron source to neutron engineering diffraction. Nucl. Instrum. Methods A 2016, 833, 61–67. [Google Scholar] [CrossRef]
  9. Yamada, M.; Otake, Y.; Taketani, A.; Sunaga, H.; Yamagata, Y.; Wakabayashi, T.; Kono, K.; Nakayama, T. Non-Destructive Inspection of Under-Film Corroded Steels using A Compact Neutron Source. Tetsu-to-Hagane 2014, 100, 429–431. [Google Scholar] [CrossRef]
  10. Taketani, A.; Yamada, M.; Ikeda, Y.; Hashiguchi, T.; Sunaga, H.; Wakabayashi, Y.; Ashigai, S.; Takamura, M.; Mihara, S.; Yanagimachi, S.; et al. Visualization of Water in Corroded Region of Painted Steels at a Compact Neutron Source. ISIJ Int. 2017, 57, 155–161. [Google Scholar] [CrossRef]
  11. Takahashi, Y.; Kiyanagi, Y.; Watanabe, K.; Uritani, A.; Sano, T.; Hori, J.; Nakajima, K. Development of a neutron source for imaging at the electron linac facility in Kyoto University Research Reactor Institute. Physica B 2018. submitted. [Google Scholar]
  12. Baxter, D.V.; Rinckel, T. Status report on the Low Energy Neutron Source for 2015. Il Nuovo Cimento C 2016, 38, 183. [Google Scholar] [CrossRef]
  13. Wang, X.; Loong, C.K.; Guan, X.; Du, T. Recent Progress of the Compact Pulsed Hadron Source Project and Related Activities at Tsinghua University. Phys. Procedia 2014, 60, 97–100. [Google Scholar] [CrossRef]
  14. Guo, Z.; Lu, Y.; Zou, Y.; Zhu, K.; Peng, S.; Zhao, I.; Gao, S.; Wen, W.; Li, H.; Zhou, Q.; et al. Progress of PKUNIFTY—A RFQ Accelerator based Neutron Imaging Facility at Peking University. Phys. Procedia 2013, 43, 79–85. [Google Scholar] [CrossRef]
  15. Futakawa, M.; Maekawa, F.; Sakamoto, S. 1-MW Pulsed Spallation Neutron Source (JSNS) at J-PARC. Neutron News 2011, 22, 15–19. [Google Scholar] [CrossRef]
  16. Parker, J.D.; Harada, M.; Hayashida, H.; Hiroi, K.; Kai, T.; Matsumoto, Y.; Nakatani, T.; Oikawa, K.; Segawa, M.; Shinohara, T.; et al. Development of Energy-Resolved Neutron Imaging Detectors at RADEN. JPS Conf. Proc. 2018. submitted. [Google Scholar]
  17. Uno, S.; Uchida, T.; Sekimoto, M.; Murakami, T.; Miyama, K.; Shoji, M.; Nakano, E.; Koike, T.; Morita, K.; Satoh, H.; et al. Two-dimensional Neutron Detector with GEM and its Applications. Phys. Proc. 2012, 26, 142–152. [Google Scholar] [CrossRef]
  18. Parker, J.D.; Harada, M.; Hayashida, H.; Hiroi, K.; Kai, T.; Matsumoto, Y.; Oikawa, K.; Segawa, M.; Shinohara, T.; Su, Y.; et al. Development of the next-generation micro pixel chamber-based neutron imaging detector (μNID) for energy-resolved neutron imaging at the J-PARC/MLF. In Proceedings of the IEEE Nuclear Science Symposium, Medical Imaging Conference and Room-Temperature Semiconductor Detector Workshop (NSS/MIC/RTSD), Strasbourg, France, 29 October–6 November 2016. [Google Scholar] [CrossRef]
  19. Mizukami, K.; Sato, S.; Sagehashi, S.; Ohnuma, S.; Ooi, M.; Iwasa, H.; Hiraga, F.; Kamiyama, T.; Kiyanagi, Y. Measurements of Performance of a Pixel-Type Two-Dimensional Position Sensitive Li-glass Neutron Detector. Nucl. Instrum. Methods Phys. Res. A 2004, 529, 310–312. [Google Scholar] [CrossRef]
  20. Nittoh, K.; Konagai, C.; Noji, T.; Miyabe, K. New feature of the neutron color image intensifier. Nucl. Instrum. Methods Phys. Res. A 2009, 605, 107–110. [Google Scholar] [CrossRef]
  21. Furusaka, M.; Sato, H.; Kamiyama, T.; Ohnuma, M.; Kiyanagi, Y. Activity of Hokkaido University neutron source, HUNS. Phys. Procedia 2014, 60, 167–174. [Google Scholar] [CrossRef]
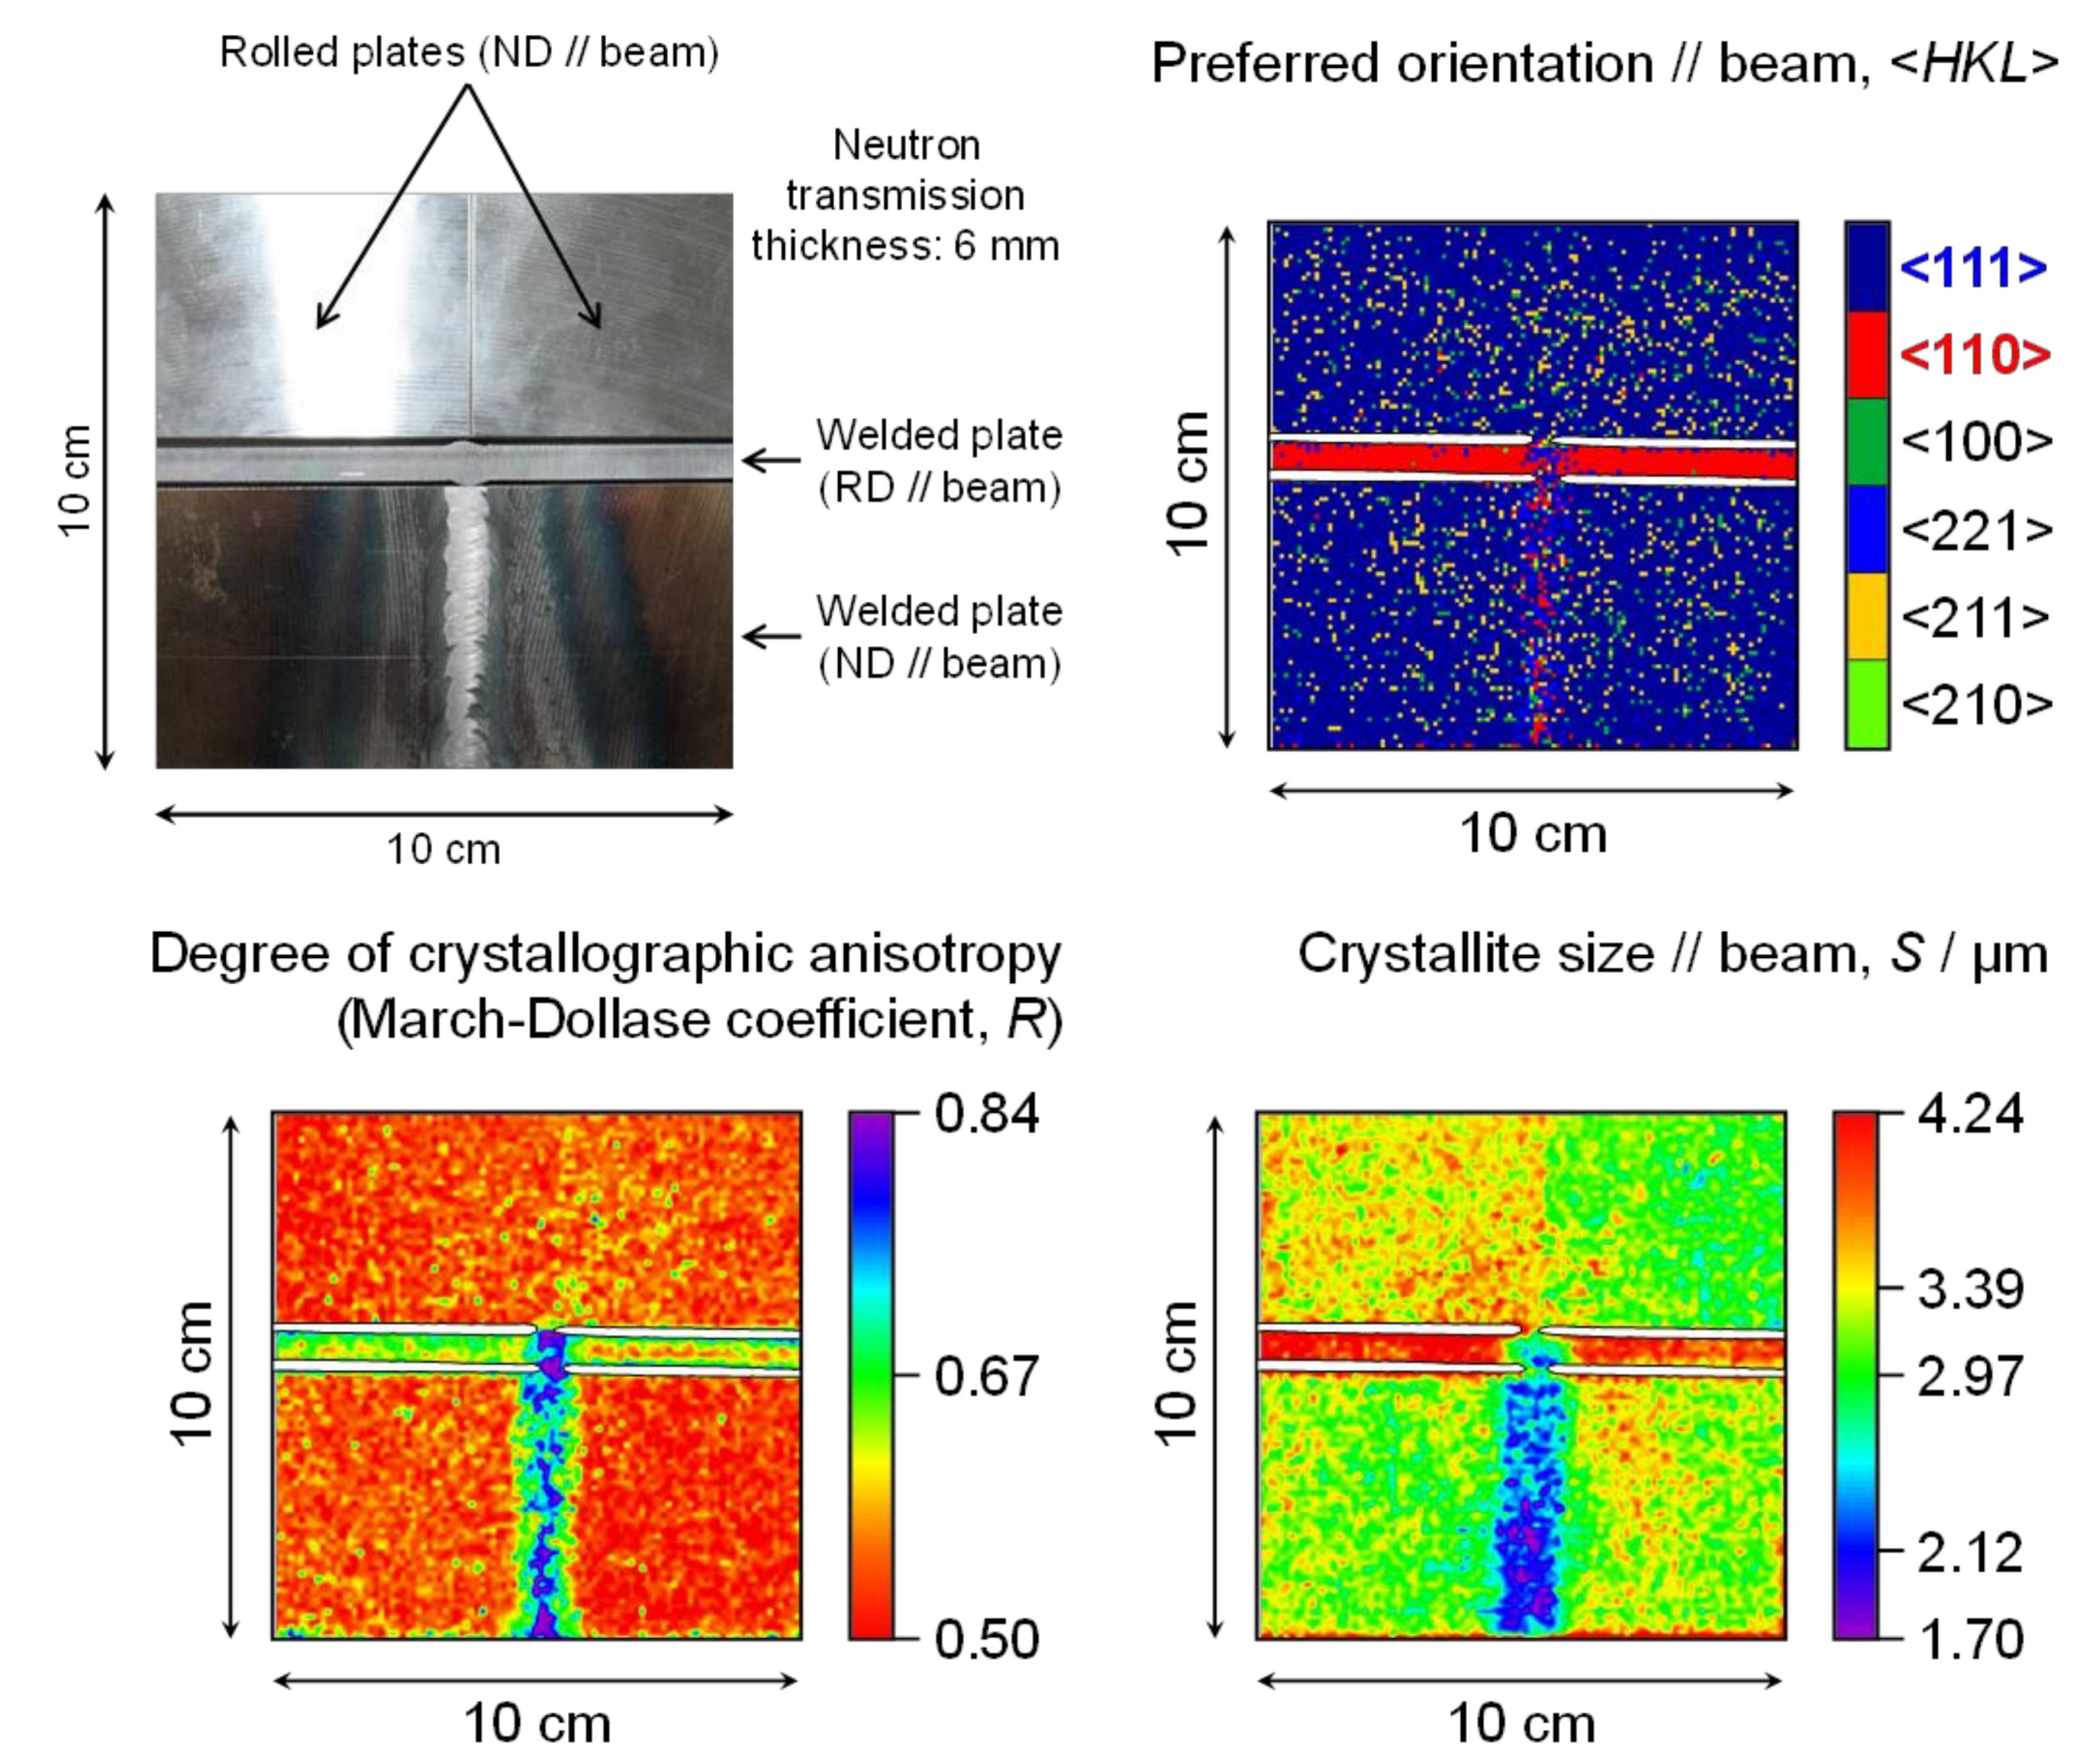
  22. Sato, H.; Kamiyama, T.; Kiyanagi, Y. A Rietveld-Type Analysis Code for Pulsed Neutron Bragg-Edge Transmission Imaging and Quantitative Evaluation of Texture and Microstructure of a Welded α-Iron Plate. Mater. Trans. 2011, 52, 1294–1302. [Google Scholar] [CrossRef]
  23. Kamiyama, T.; Narita, Y.; Sato, H.; Ohnuma, M.; Kiyanagi, Y. Structural change of carbon anode in a lithium-ion battery product associated with charging process observed by neutron transmission Bragg-edge imaging. Phys. Procedia 2017, 88, 27–33. [Google Scholar] [CrossRef]
  24. Sethuraman, V.A.; Hardwick, L.J. Surface structural disordering in graphite upon lithium intercalation/deintercalation. J. Power Sources 2010, 195, 3655–3660. [Google Scholar] [CrossRef]
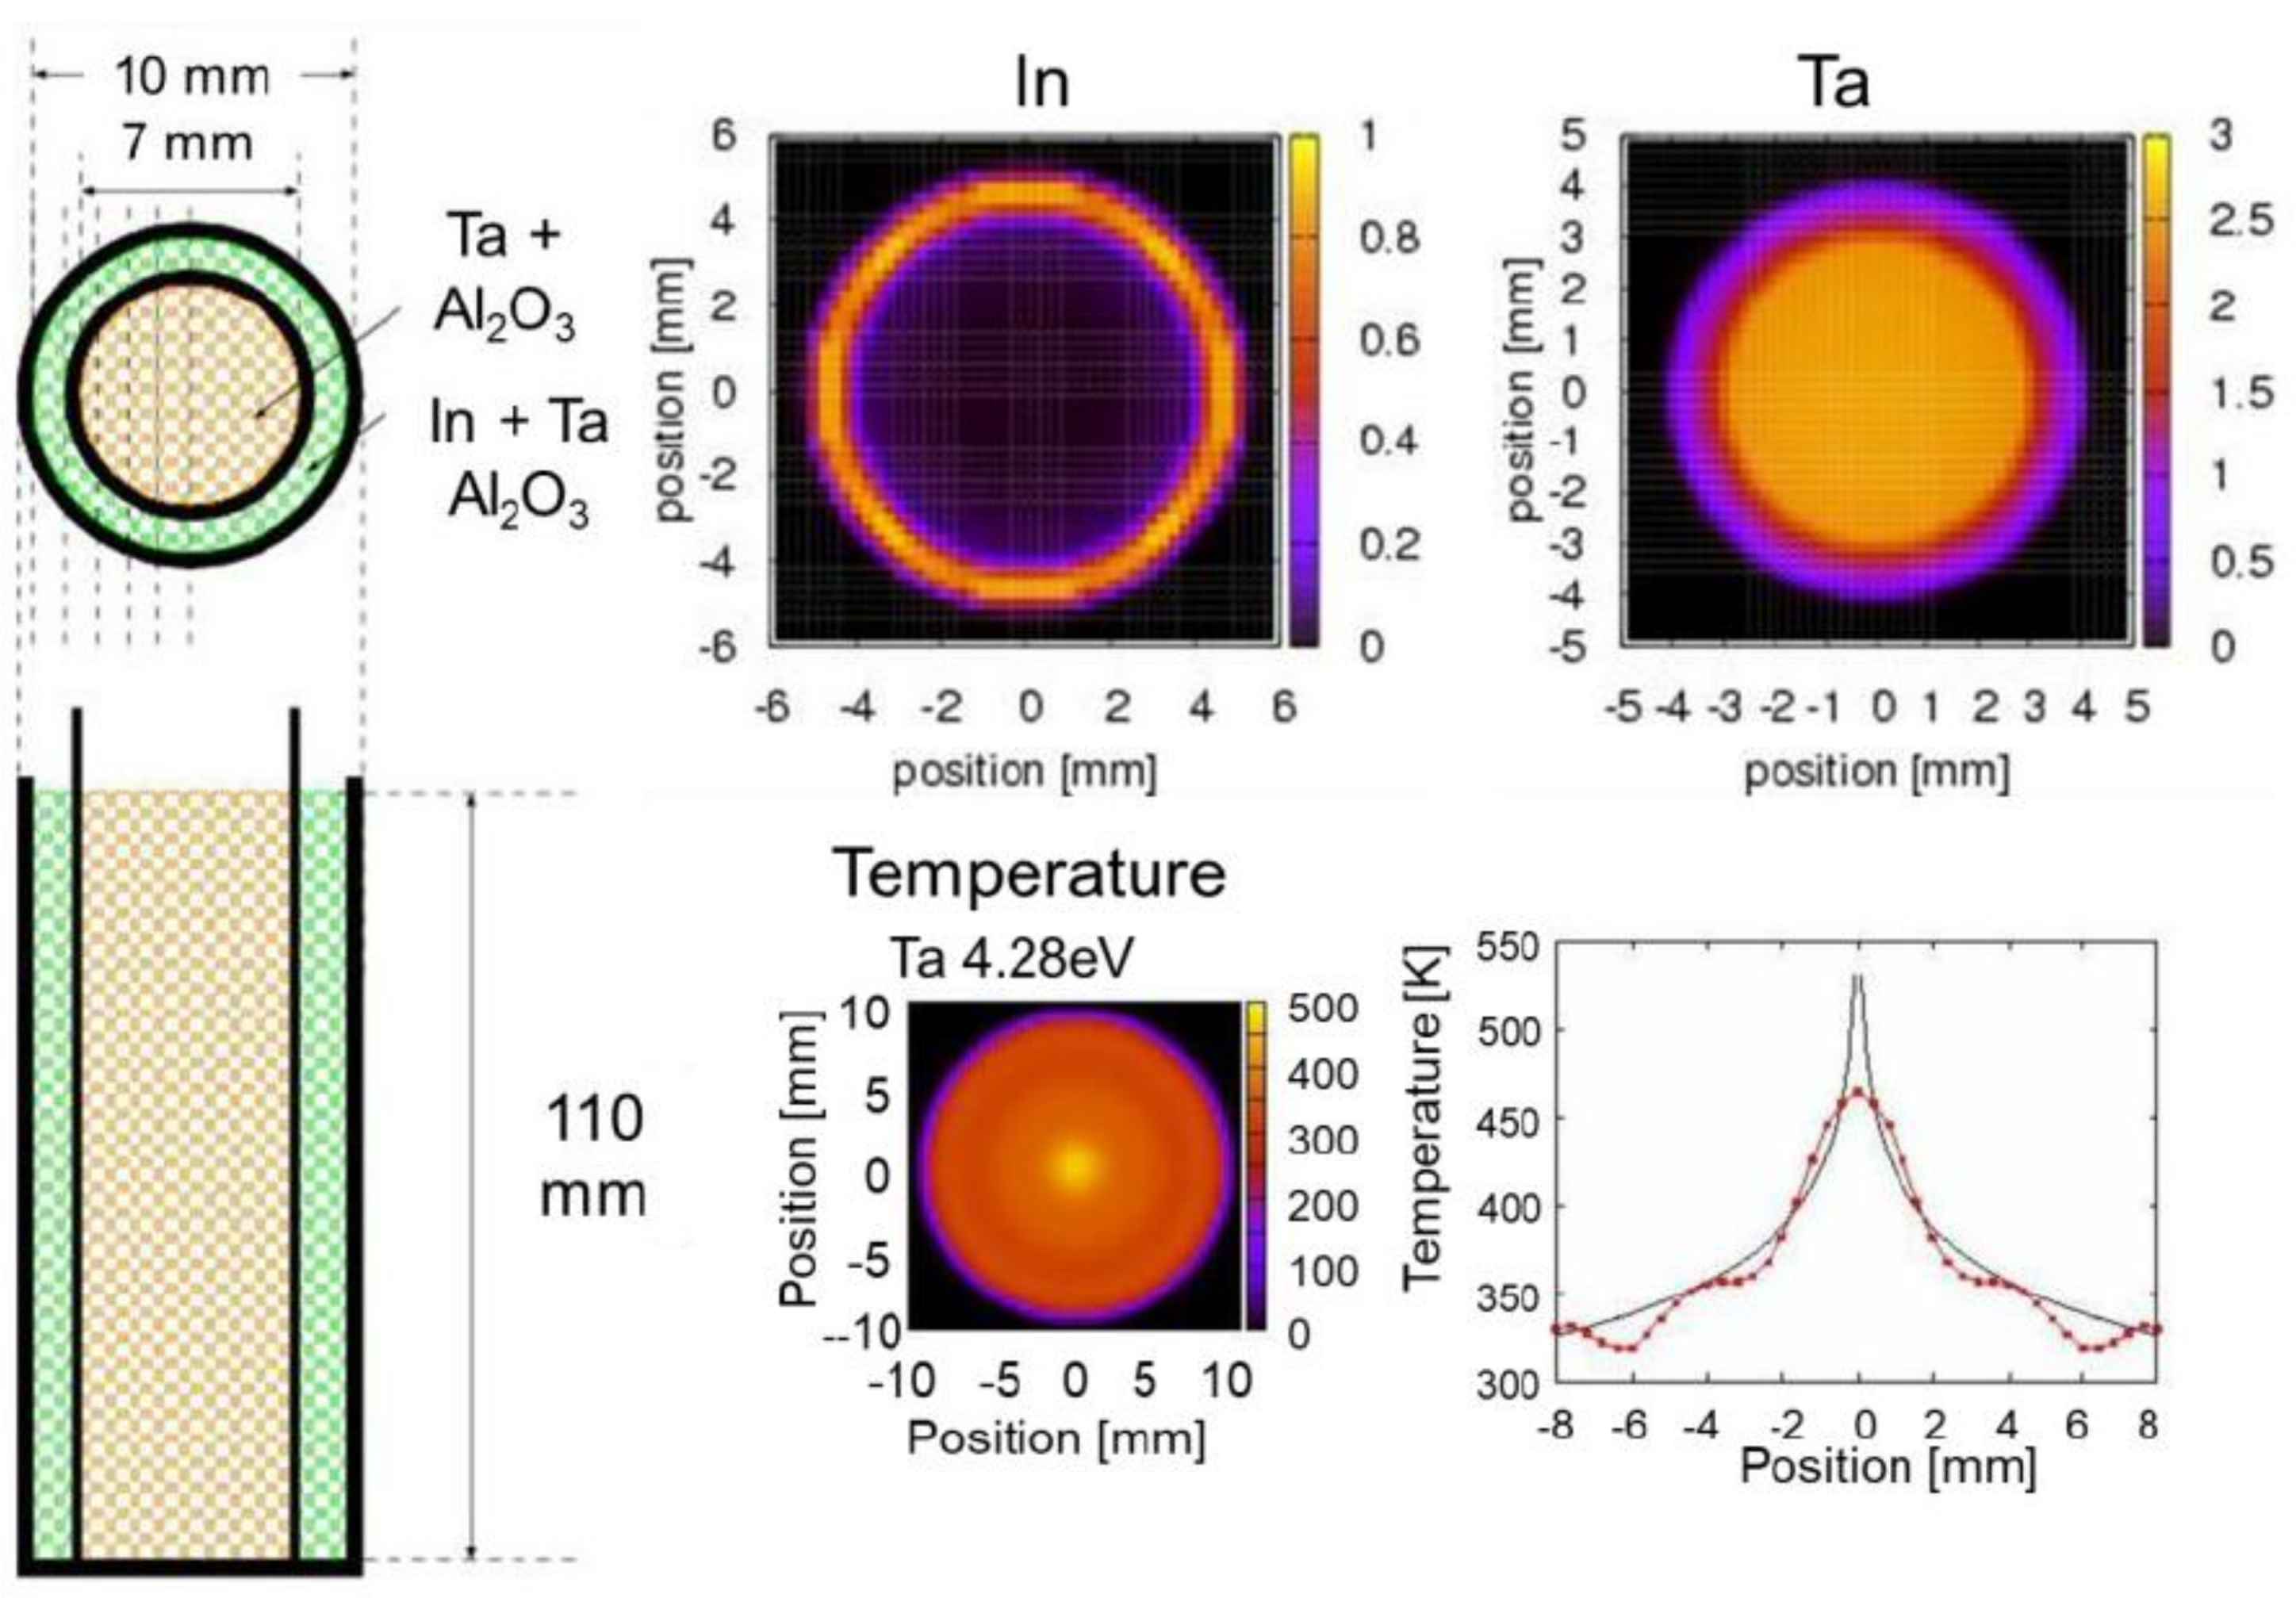
  25. Kamiyama, T.; Noda, H.; Ito, J.; Iwasa, H.; Kiyanagi, Y.; Ikeda, S. Remote-sensing, Non-destructive, and Computed-tomography-assisted Thermometry by Neutron Resonance Absorption Spectroscopy. J. Neutron Res. 2005, 13, 97–101. [Google Scholar] [CrossRef]
  26. Kamiyama, T.; Miyamoto, N.; Tomioka, S.; Kozaki, T. Epithermal neutron tomography using compact electron linear accelerator. Nucl. Instrum. Methods Phys. Res. Sect. A 2009, 605, 91–94. [Google Scholar] [CrossRef]
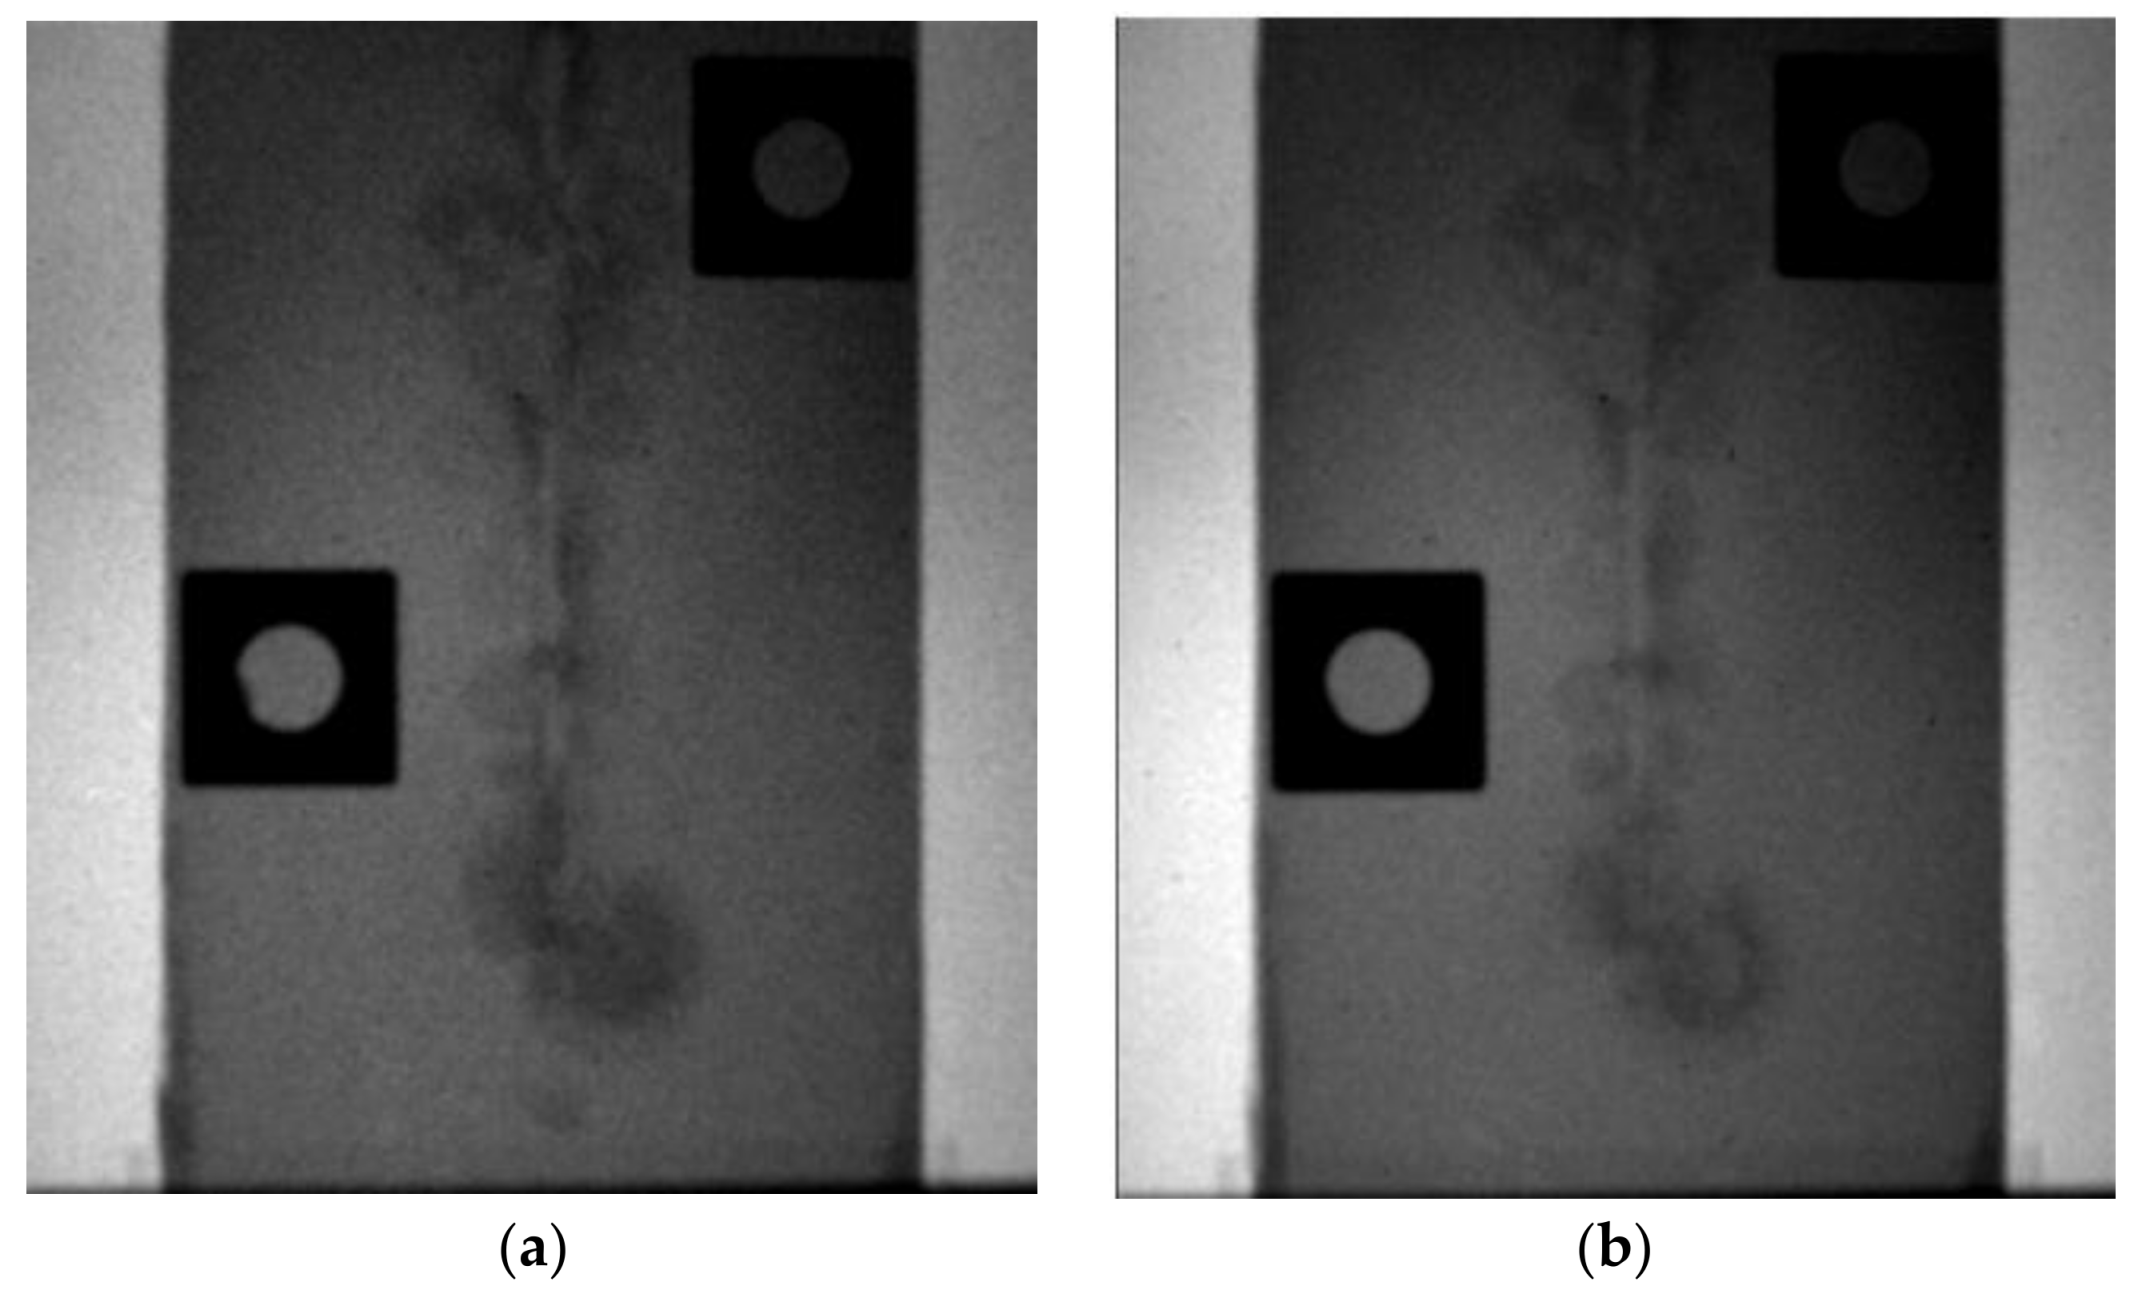
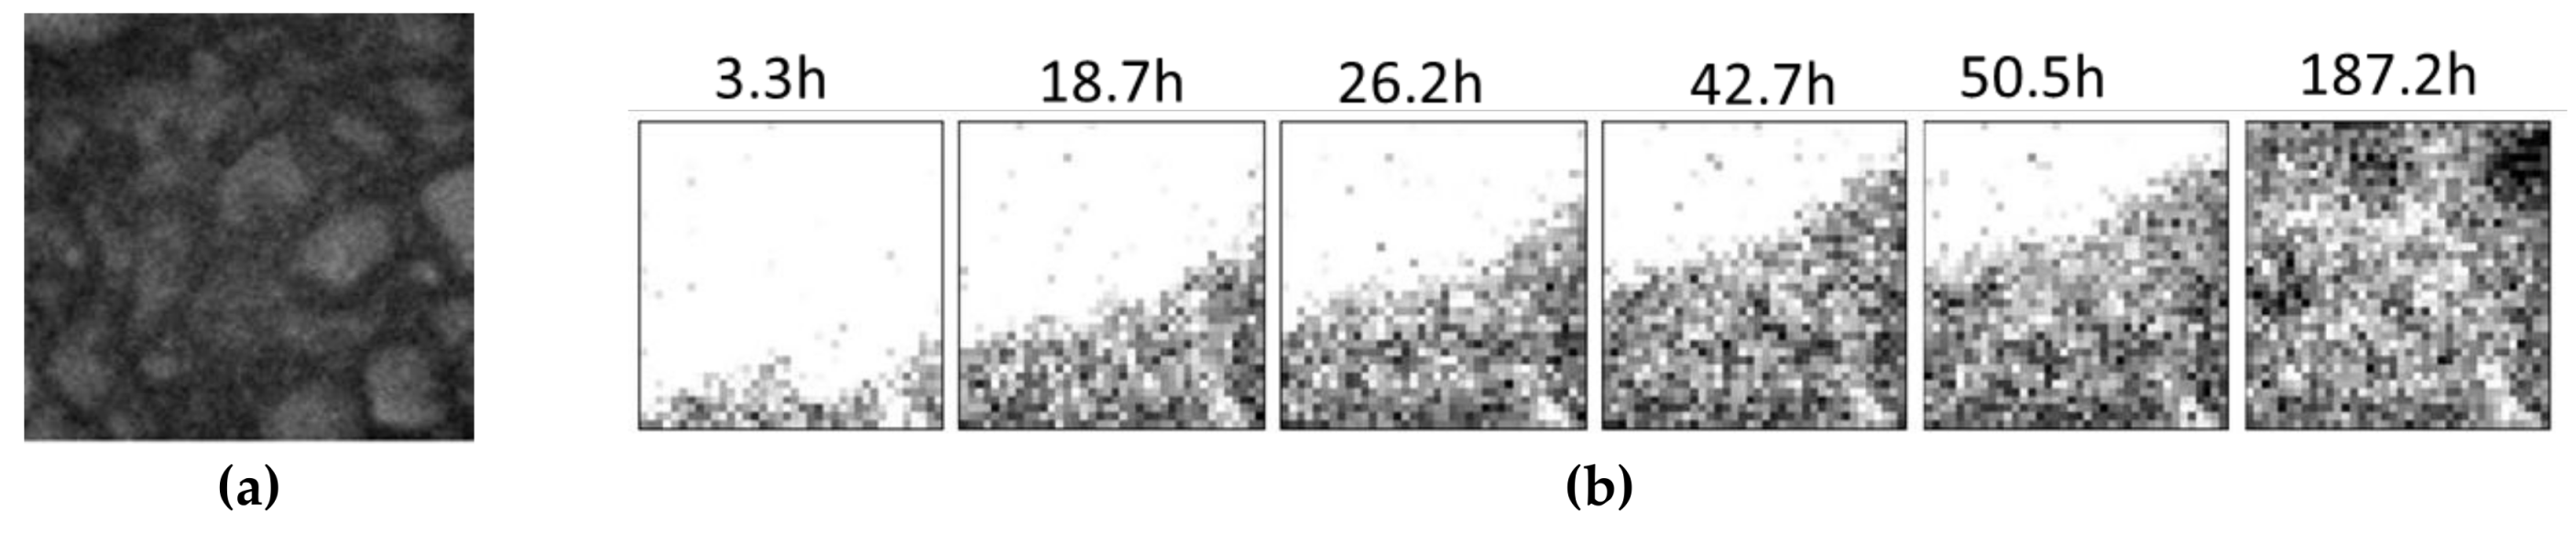
  27. Yoshimura, Y.; Mizuta, M.; Sunaga, H.; Otake, Y. Study on Water Penetration Measurement in Concrete using Compact Neutron Source. Proc. Jpn. Concr. Inst. 2017, 39, 613–618. Available online: http://data.jci-net.or.jp/data_html/39/039-01-1095.html (accessed on 26 March).
  28. Yoshimura, Y.; Mizuta, M.; Sunaga, H.; Otake, Y.; Hayashizaki, N. Measurement of Water in Concrete by a Compact Accelerator-driven Neutron Source. In Proceedings of the 17th JSMS Symposium on Concrete Structure Scenarios, Kyoto, Japan, 12–13 October 2017. [Google Scholar]
Figure 1. Neutron sources in Japan. Two reactor neutron sources, JRR-3 and KUR are also indicated. The neutron fluxes are typical value at a sample position. The values change depending on experimental conditions. The values of current are the maximum or typical ones. All the neutron sources other than SHI-ATEX belong to academia.
Jimaging 04 00055 g001
Figure 2. Electron accelerator beam lines at Hokkaido University neutron source. The center beam line is used for thermal neutron experiments, the right for cold neutron ones, and the left for fast neutron ones.
Jimaging 04 00055 g002
Figure 3. Thermal neutron spectrum at HUNS.
Jimaging 04 00055 g003
Figure 4. Bragg edge transmission results of a welded iron sample. The upper left panel is a photo of the sample, the upper right shows the preferred orientation, the lower left panel the degree of anisotropy (texture) and the lower right panel the crystallite size [22].
Jimaging 04 00055 g004
Figure 5. Change of lattice plane distance with increasing of charge of a Li battery [23].
Jimaging 04 00055 g005
Figure 6. Elemental distribution and temperature distribution of a model sample [24].
Jimaging 04 00055 g006
Figure 7. Cyclotron accelerator and proton beam line (a) and a vertical irradiation room (b).
Jimaging 04 00055 g007
Figure 8. Accelerator, target-moderator-reflector system with shield, and neutron beam line.
Jimaging 04 00055 g008
Figure 9. Images of fully wet (a) and dry (b) conditions. Distribution of hydrogen in rust is mainly indicated in the dry case, and that of hydrogen in water is superimposed on the wet case [10].
Jimaging 04 00055 g009
Figure 10. Transmission image of concrete (a) and water penetration into concrete (b) [27,28].
Jimaging 04 00055 g010
Figure 11. Accelerator and experimental area.
Jimaging 04 00055 g011
Figure 12. Photo of ASTM samples (a) and transmission image (b).
Jimaging 04 00055 g012
Figure 13. Imaging example of a brass rod in a copper cylinder and an acryl column.
Jimaging 04 00055 g013
Figure 14. Layout of the beam line of KURRI-LINAC.
Jimaging 04 00055 g014
Figure 15. Target-moderator-reflector and neutron flight path.
Jimaging 04 00055 g015
Figure 16. Transmission image of In and Au with various thicknesses.
Jimaging 04 00055 g016
Figure 17. Cyclotron and moderator.
Jimaging 04 00055 g017
Figure 18. Irradiation area and sample stand.
Jimaging 04 00055 g018
Table 1. Specifications of accelerator-based imaging facilities in Japan.
Facility NameAccelerator TypeAcceleration Particle (Energy)Accelerator Power (kW)Moderator TypeNeutron Flux (n/cm2/s)L/D
HUNSLinacElectron
(35 MeV)
~1Thermal
Cold
~few × 103
~few × 104
~60
Aomori Prefecture
Quantum Science Center
CyclotronProton
(20 MeV)
1Thermal6.1 × 10544
J-PARC RADENSynchrotronProton
(3000 MeV)
1000Cold2.6 × 107180~7000
RANSLinacProton
(7 MeV)
0.7Thermal~few × 10421~781
KUANSLinacProton
(3.5 MeV)
0.35Thermal1.2 × 103~20
KURRI-LINACLinacElectron
(40 MeV)
6Thermal2.4 × 104~85
SHI-ATEXCyclotronProton
(18 MeV)
0.36Thermal2.0 × 10544
Table 2. L/D values and their conditions.
L/DDetector Position L from Moderator (mm)Viewing Moderator Size D (mm)
335000150
21~331350010–170
781 (max)800010
Table 3. Available detectors.
DetectorConverterPhoto SensorSpatial Resolution
Neutron CameraLiF/ZnS(Ag)Cooled CCD sensor40 μm
Color I.I. 1Gd2O3CMOS or45 μm
Color I.I. 2B4CCooled CCD sensor45 μm
3He Position Sensitive Detector3He 10 atom3He Gas chamber1 cm
RPMTLiF/ZnS
Li grass
Position sensitive Photomultiplier Tube1 mm

