Abstract
We present image processing algorithms for a new technique of ceramic proppant crush resistance characterization. To obtain the images of the proppant material before and after the test we used X-ray microtomography. We propose a watershed-based unsupervised algorithm for segmentation of proppant particles, as well as a set of parameters for the characterization of 3D particle size, shape, and porosity. An effective approach based on central geometric moments is described. The approach is used for calculation of particles’ form factor, compactness, equivalent ellipsoid axes lengths, and lengths of projections to these axes. Obtained grain size distribution and crush resistance fit the results of conventional test measured by sieves. However, our technique has a remarkable advantage over traditional laboratory method since it allows to trace the destruction at the level of individual particles and their fragments; it grants to analyze morphological features of fines. We also provide an example describing how the approach can be used for verification of statistical hypotheses about the correlation between particles’ parameters and their crushing under load.
1. Introduction
Proppant or propping agent is a solid granular material applied during hydraulic fracturing of a source rock [1]. The procedure is widely used in the oil industry. The aim of the proppant is to prevent fracture closure under the natural stress in a rock after decreasing the fracturing fluid pressure, thereby enabling hydrocarbons to reach the production well. Sand is the cheapest and, therefore, the most popular type of proppant. However, in some cases, it can be beneficial to use a proppant with a reduced density but with and increased grains strength relatively to natural sand. Annually, hundreds of thousands of tons of ceramic proppant are produced globally. The particles of ceramic proppant are granules of spherical shape with a size of about 1 mm.
Mechanical strength and conductivity are the most important attributes of proppant pack required for an optimal fracturing job design. The fraction of crushed particles depends on both the closure stress and the proppant characteristics. Therefore, a crush test is one of the procedures used for proppant quality characterization. As per standard American Petroleum Institute (API) requirements [2], a proppant grains crush test should be performed at an axial stress of up to 100 MPa (15,000 psi). The conventional approach to measuring the percentage of grains crushed during the test is based on sieving and weighing.
In this work, algorithms for an image-based assessment of structure evolution and degradation under stress conditions are developed. Imaging of proppant structure is performed using X-ray micro-tomography (microCT) technique [3,4,5]. The popularity of X-ray microCT has significantly increased during the last few decades. Nowadays, it is actively used for studying the interior of natural rocks and granular materials [6,7,8,9]. The effectiveness of this technique is determined by the unique combination of its properties—nondestructive three-dimensional imaging of opaque samples, (sub)microscale spatial resolution, and compact tabletop setup. Among different applications of X-ray tomography, we would like to highlight multiple image-based approaches for analysis and evaluation of material properties and behavior in 3D. Digital rock physics is one such technique. It is used in geology and is developed by numerous groups worldwide [10,11,12,13,14]. One of the most exciting things about this digital concept is its capability to simulate various pore-scale processes (multiphase flow, electrical, nuclear magnetic resonance response, thermal, and mechanical loading, etc.) and specific scenarios of rock treatment [15,16,17] at different conditions, starting from a single sample structure (so-called digital rock model constructed from 3D microCT image).
Recently an application of microCT imaging for flow modeling [18,19] in proppant pack and measuring deformation [20] was considered. Existing investigations examine characteristics of the entire proppant pack. We formulated a more ambitious goal: In addition to the analysis of the entire pack, we intended to track each individual particle and to estimate its characteristics during the crush test. In the proposed digital crush test, we focus on detailed quantitative analysis of the crushing process at the level of a grain. We would like to know the “fate” of each proppant particle, i.e., whether it will be broken/damaged or survive, which characteristics of a particle affect its survival rate, which fines it will generate and how these fines will be distributed.
To achieve our goal, it is necessary to create sophisticated algorithms, which should be able to: (1) segment particles and their fragments in 3D images in an automatic manner; (2) calculate shape factors, sizes and porosity of each connected region, and (3) find one-to-one correspondence between the particles in the images before and after the stress. The main contribution of the paper is algorithms for (1) unsupervised segmentation of 3D microCT images of ceramic proppant; (2) calculation of parameters of particles, such as compactness and lengths of projections to axes of equivalent ellipsoid, and (3) one-to-one matching of particles between 3D images before and after the load.
2. Materials and Methods
2.1. General Idea
Capturing by MicroCT several hundreds of proppant particles placed in a specially designed high-pressure X-ray transparent cell [21] makes it possible to measure the characteristics of each particle, as well as their fragments, before and after the load. For the digital crush test, we obtain a pair of grayscale volumetric images (or 3D images): First, X-ray microCT scanning of slightly loaded proppant pack is performed. After that, the proppant pack is heavily loaded, and the scanning is performed again. Hereafter, by images, we mean 3D volumetric images. All image processing steps are applied in 3D unless otherwise is explicitly specified. However, for clarity, most of the figures represent just 2D slices (or even fragments) of 3D images.
In the first image (before the load) all particles are unbroken; their structure is not damaged (see Figure 1a). While in the second image (after the load), one can see some corrupted particles (see Figure 1b). We refer to the first and the second image as A and B, respectively. Images A and B depict the same particles, but a part of them has fragmented in B. Our goals are as following:
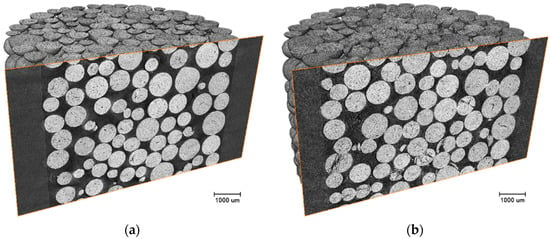
Figure 1.
A ceramic proppant pack: (a) slightly loaded; (b) after axial stress impact.
- to find one-to-one matching between the particles in A and B that allows the classification of each particle in A as crushed or survived, as well as it makes possible to detect unbroken particles and fines in B;
- to evaluate the crush resistance, i.e., the number and volume fraction of particles in proppant batch A, which are later crushed;
- to measure the distribution of sizes of fines in B;
- to make assumptions about the influence of different microstructural features on the “fate” of the particle:
- which parameters of particles affect their survival rate;
- how the crush test changes the characteristics of survived particles.
2.2. Hardware and Software
The SkyScan 1172 microCT system (Bruker MicroCT: Kontich) was utilized. The scanner set up had the following parameters: X-ray tube mode—100 kV and 100 µA, pixel size of 1.3–2.5 µm, reconstructed image has size 4000 × 4000 × 2000 and bit depth 8 bits per voxel. The imaging was performed in 180°-mode with angular step of 0.1°. Note that the spot size of the X-ray tube is about 5 µm. However, microCT scanning with almost two times smaller effective pixel size value is meaningful due to distinctly higher detail detectability.
We conducted experiments with dozens of proppant types from MaxPROP family (www.slb.com/resources/other_resources/product_sheets/stimulation/maxprop-hsp-ps.aspx). Figure 1 demonstrates the damage occurred in the pack at 70 MPa. More clearly the particles’ crushing can be observed in magnified 2D slices (see Figure 2). The load is directed perpendicular to the slice plane.
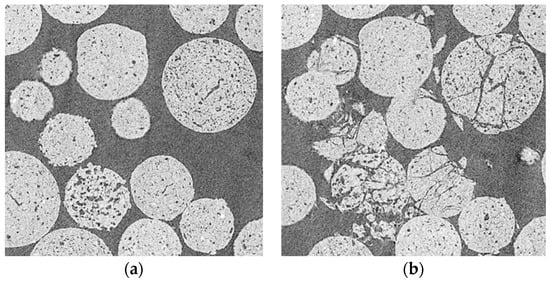
Figure 2.
Corresponding fragments of 2D slices: (a) slightly loaded; (b) after axial stress impact.
Modern open-source Python libraries allow rapid prototyping of software for processing of microtomography data [22]. We made a set of Python scripts for segmentation and analysis of 3D microCT images using NumPy ver. 1.11 [23], scikit-image ver. 0.14 [24] libraries as well as Matplotlib ver. 2.2.2 [25] for visualization of outcomes. Python version 3.6 was used.
For the image processing, we used a personal workstation with the following characteristics: 2 CPU Intel Xeon E5-2650v3 (20 CPU cores) 2.3 GHz, RAM 64 Gb, SSD 512 Gb, Windows 10. In spite of a relatively large memory size, we were unable to process 4000 × 4000 × 2000 3D image corresponding to the highest resolution, due to the high memory consumptions by some functions from the Python libraries, in particular, distance transform and segmentation by watershed [26]. To satisfy memory limitation, we performed a four times downsampling by averaging to image size 1000 × 1000 × 500.
2.3. Image Processing Pipeline
Figure 3 demonstrates the general data processing pipeline of the digital crush test. We start with downscaling of the 3D grayscale images A and B. Then, it is necessary to segment and label particles in both images. The segmentation task comprises of two stages: Distinction of particles voxels from the background, that corresponds to voids and holder, and separation of contacting particles and their fragments. Usually, just the first stage is discussed in the literature devoted to microCT images processing. It is worth noting, that some level of uncertainty about segmentation outcome is inevitable for X-ray microtomographic images, due to the partial volume effect that causes blur between substances and voids [27]. The root cause of partial volume is a limited resolution, for example, unresolved micro or sub-voxel porosity decreases the absorption and consequently the gray level of voxels. According to surveys [28,29] of techniques for segmentation of microtomographic images, Indicator Kriging (IK) [30,31] and Markov Random Fields (MRF) [32] provide the best segmentation outcomes in the majority of cases, especially for multiphase substances. However, simpler segmentation methods by thresholding are applicable for images having high contrast between mineral and voids. Fortunately, intensities of ceramic particles strongly differ from intensities of the background. It makes possible to apply adaptive thresholding [33,34] for the setting of voxels of ceramic proppant to 1 and voxels of background to 0.
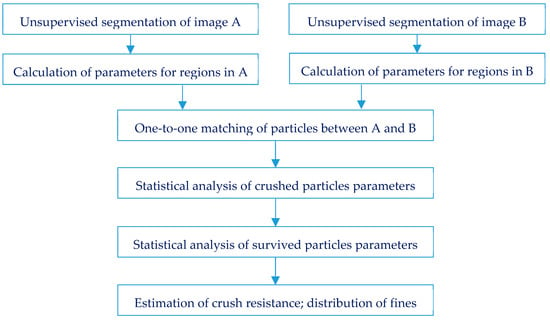
Figure 3.
General data processing pipeline in a digital crush test.
The next segmentation step is splitting of touching regions belonging to different particles and their fragments. There are several techniques based on a watershed algorithm for separating contacting convex regions in 2D and 3D [35]. The marker-controlled watershed is a typical way to avoid strong over-segmentation [36]. The method for markers generation has several parameters, which have a crucial influence on segmentation outcome. The subjective choice of the parameters can lead to under-segmentation or over-segmentation. It is preferable to use unsupervised (or non-reference, or blind) segmentation criterion. Unsupervised metrics score a segmentation by quantifying the desired properties of the segmented image itself. There are two goals: Increasing the quality of the segmentation algorithm and reducing the subjectivity caused by parameter selection by the user. The shape of the particles of the ceramic proppant is close to a sphere. We use this fact for the formulation of unsupervised segmentation metrics: Average compactness of segmented regions should be maximal, where compactness characterizes similarity of the shape to a sphere.
During the next stage, parameters should be calculated for segmented regions of images A and B. The features characterize the position of each connected region in a 3D image; volume, size and shape factor of the region; and various types of pores. The parameters are used for matching the particles in A and B images as well as for statistical analysis of crush test results.
For one-to-one matching of the particles, we calculate the similarity between each particle from A and several particles from B located in some limited sub-volume. The similarity is based on a weighted sum of differences of several parameters. If the similarity is greater than a threshold, then the particles with maximal similarity among considered pairs are matched to each other. We designate connected regions in images A and B as follows:
- particles in A and B, which were matched, as survived;
- particles in A, which were not matched, as crushed/broken in B;
- all connected regions in B, except survived, as fines.
Such classification on crushed and survived particles, as well as fines, makes it possible to do subsequent detailed analyses. To prove our assumptions about causes of a particle’s crush we show distributions of parameters of crushed particles as well as formulate nonparametric statistical hypotheses and check it. For example, we assume that the porosity of a particle and its shape factor can be influential factors. On the other hand, most likely, the volume of the particle has little importance in its destruction. In addition, we analyze how the parameters of survived particles change during the crush test. Distribution of the volume fraction of segmented 3D regions (that is grain size distribution) allows the comparison of outcomes of the digital crush test with a conventional technique using sieves.
2.4. Segmentation of Particles
2.4.1. Marker-Controlled Watershed
Figure 4 demonstrates the flow-chart of our segmentation algorithm. Lighter voxels of ceramic particles differ from dark voxels of background and holder. The histogram of intensities of the image is bi-modal (see Figure 5). For images with such histograms, thresholding by the Otsu algorithm [33] is a good solution to distinguish voxels of particles from the background. After thresholding, we obtain a binary image T, where voxels of solid are designated by 1 and voxels of voids are designated by 0. Figure 6a shows the thresholding outcome for a slice of image T.
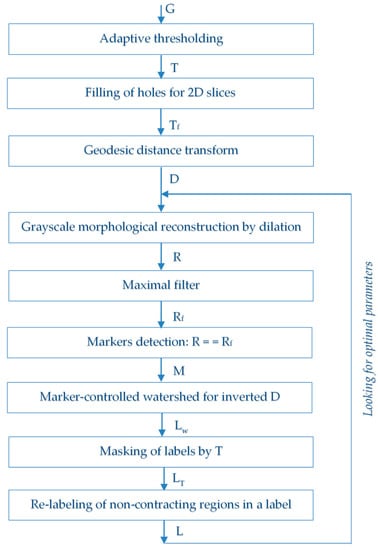
Figure 4.
Flow-chart of segmentation procedure.
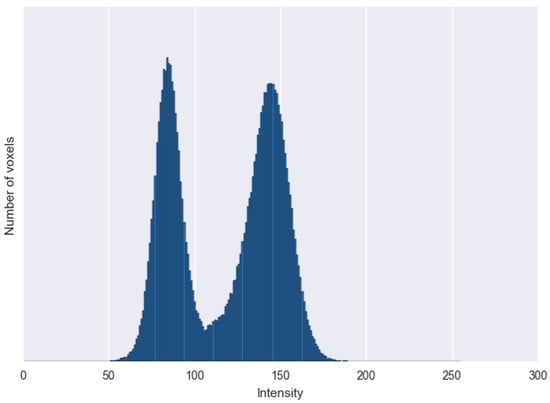
Figure 5.
Histogram of intensities of a central fragment of grayscale image G.
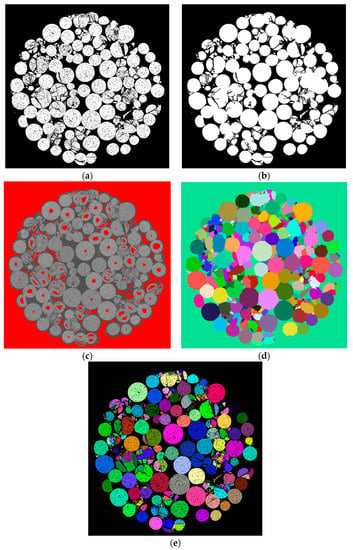
Figure 6.
Examples of segmentation stages outcomes for B image: (a) Thresholded image; (b) Result of holes filling in 2D; (c) Markers; (d) Labels after watershed; (e) Labeled image.
Splitting regions formed by touching particles in T image is required. The conventional way for the separation of overlapping or contacting convex regions without holes is an application of the watershed algorithm to the inverted outcome of the geodesic (or topographic) distance transform [37]. The general idea of the watershed algorithm is as follows: An image is considered as a geological relief; a water source is placed in each regional minimum in the relief to flood the entire relief from sources and build barriers in the place where different water sources meet. The resulting set of barriers constitute a watershed by flooding. For volumetric 3D images, the watershed algorithm operates identically to 2D one.
Before application of distance transform, we need to fill the holes that correspond to pores in particles. At the same time, morphological filling of holes in 3D keeps unchanged those pores which are connected with background voids. Filling of holes for 2D slices is required. Theoretically, the filling of holes should be done for slices in all three mutually perpendicular directions. Such approach ensures that the open pores, which penetrate a particle and are parallel to image axes, are filled. However, in practice open pores are tortuous. Thus, it is enough to fill the holes for 2D slices in one direction only. Binary image Tf is the outcome of slice-by-slice filling of holes for T image. It is worth to note, that filling of holes in 2D can lead to filling of space between touching particles. Fortunately, such events are rare and have no negative impact on the next processing steps. Figure 6b shows a slice of image Tf.
At the next stage, geodesic distance transform builds the distance map D by calculation of the Euclidean distance to the nearest zero value voxel for each voxel of Tf image. Inverted D plays the role of relief for the watershed algorithm. Local minima on (-D) are basins origins. Frequently, there are several local minima inside a connected region because even survived particles have non-ideal convex shape, and a lot of fragments of crushed particles are concave. This leads to over-segmentation. To avoid over-segmentation due to the huge number of local minima the marker-controlled watershed is used, where markers play the role of water sources [36].
There are numerous approaches for marker generation, for instance, calculation of curvatures via eigenvalues of shape matrix [38], application of ultimate erosion [39], usage of h-minima morphological operator [40]. We tried several of them and conclude that the best outcome is obtained through the following steps. The first step is grayscale morphological reconstruction by dilation [41]. Morphological reconstruction by dilation uses two images: “seed” image (D–delta_h), which specifies the values that spread, and “mask” image D, which gives the maximum allowed value in each voxel. The mask image limits the spread of high-intensity values. The reconstructed image R looks exactly like the seed image, but with the peaks cut off, where delta_h determines the height of the peaks. Difference (D − R) is referred to as ‘h-dome’ operator, and ((D − R) > 0) as ‘h-maxima’ operator, respectively. Figure 6c shows markers (in red) for a slice of image R.
Figure 7 demonstrates an example of marker generation for the simple image (see Figure 7a) containing two contacted regions. Figure 7b shows the distance map. Figure 7c shows the plot of the profile for the distance map along axis K. One can see four local maxima in the plot. Where three local maxima relate to the right region, we need to suppress the redundant local maxima. Adjustment of delta_h mitigates the issue of several local maxima for some particles, for example, two local maxima of the central peak are combined to a single region. However, increasing of delta_h cannot solve the issue completely, e.g., the rightmost peak has a local maximum that should be ignored. Application of maximal filter to image R and comparison of filtration outcome Rf with R employ the suppression of the most of redundant local maxima. Binary image M containing markers is: M = (R == Rf) (see Figure 7c). The maximal filter uses a cubical structural element with max_filter_size size. These three parts of Figure 7 illustrate the meaning of parameters delta_h and max_filter_size.
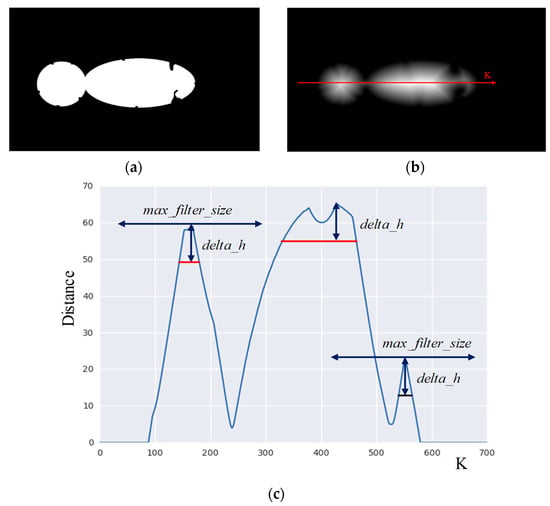
Figure 7.
Illustration of parameters for generation of markers. (a) binary image; (b) distance map; (c) profile of intensity along K axis.
The next stage is a marker-controlled watershed for inverted D and markers from M, where each connected region has a unique label. Image Lw is the outcome of segmentation by watershed (see Figure 6d). To obtain labelled particles it is necessary to multiply Lw by T. After watershed, a few non-contacting regions can have the same label. As a rule, it might happen for small concave fines. Re-labeling assigns a unique label to such regions. Figure 6e demonstrates labels in a slice of image L.
2.4.2. Unsupervised Segmentation Quality Metrics
The segmentation outcome relies on markers, which depend on parameters delta_h and max_filter_size. The decrease of both leads to over-segmentation because regions of granules split into fragments. An increase of both leads to under-segmentation because neighboring particles and fragments merge. We iteratively optimized segmentation quality metrics to find the best parameters.
How to set the parameters delta_h and max_filter_size properly? Subjective choice based on visual analysis of segmentation result is troublesome. Due to the 3D nature of the data, it is hard to find optimal parameters visually. How to automatically choose the optimal parameter values, based only on the analyzed image? The survey in Reference [42] describes a few dozens of unsupervised metrics for estimation of segmentation quality of 2D images. All of them are not universal but depend on the task being solved. If segmented regions have more or less the same shape, then the shape factor can be used as metrics.
We know a priori that studied particles have a shape close to a sphere. This fact has been used for the formulation of the criterion of unsupervised segmentation. A sphere is the most compact body in three-dimensional space. For image A, maximal average compactness of segmented regions corresponds to the best segmentation. So, segmentation criterion can be based on the average compactness. However, for image B, there is a situation when several big fragments are merged to a conglomerate with high compactness. It leads to a biased We need to avoid such undesirable matter. An appropriate solution is the penalization of quality metrics in the case of segmented regions in image B, which have a volume greater than the biggest region in image A or some reasonable threshold originated from our a priori knowledge about the tested proppant. So, segmentation quality metrics is:
where N is the number of segmented regions having a volume greater than Vmin; is compactness of i-th region; is the number of regions having a volume greater than Vmax. The threshold Vmin is introduced to exclude from the consideration too small fragments to avoid the question about compactness of the regions containing just a few voxels. The threshold Vmax is used to penalize segmentation that produces too big conglomerates.
Let us consider how changes in the case of improper segmentation. Over-segmentation is the splitting of spherical regions. It decreases the average compactness. Under-segmentation is the merging of spherical regions. Usually, it leads to the decrease of average compactness too except for forming compact conglomerates from fragments. We need to maximize to provide the best segmentation outcomes.
Note, the proposed segmentation criterion is correct in the assumption of the existence of, at least, several tens of survived spherical particles in the image after the load. If almost all particles are crushed, the metrics are ineffective.
2.5. Calculation of Parameters of 3D Particles
2.5.1. Compactness
Many 3D shape factors are a natural extension of corresponding measures for 2D images. Compactness in 2D is sometimes called the circularity or the roundness. Shape compactness in 2D is generally understood as the degree to which a given shape differs from a region bounded by a circle. There are numerous publications, which describe compactness as the ratio of the area of the region to the squared perimeter. Analogous definition of compactness for 3D regions is the ratio of the squared volume to the area of the surface of a region in cubic power [43]:
where V is the 3D region volume, and S is its surface area.
Drawbacks of originate from the calculation of the surface area. First, an error appears in the surface area calculation due to the sampling effect. Second, there are uncertainties regarding how to find the surface and to calculate its area. There are several approaches for the calculation of surface area. For example, the paper [44] considers the marching cubes algorithm [45] for estimation of the outer surface area. A surface area can be estimated as the number of voxels in the outer shell, where the shell is the difference in the region and the result of its erosion with a 3 × 3 × 3 structural element in the form of a cube (26-connectivity), or a ball (18-connectivity), or a cross (6-connectivity). All pores have to be filled in advance. The benefits of each method are arguable. Third, to exclude an influence of pores/holes and to consider the outer surface only, it is necessary to fill holes beforehand. Finally, any noise, small cavities, and outliers on the surface lead to a relatively wide distribution of compactness values for repeated evaluation of the same particle.
Bribiesca [46] defined compactness for 3D regions that are different from , however, the definition is also based on volume and surface area. Bribiesca’s compactness has the same shortcomings as , but is less sensitive to small distortions of the surface.
Zunic et al. [47] proved the properties of 3D shapes compactness based on second-order central geometric moments and demonstrated its advantages over other algorithms for compactness calculation. The approach is based on outcomes from Mamistvalov’s theory for recognition of n-dimensional solids via geometric moment invariants [48].
where central geometric moments are:
and geometric moments are:
where is a function indicating if the voxel belongs to the region; I equals one for voxels belonging the region, and I is zero otherwise.
Zero-order geometric moments equal to the particle volume: . The first-order geometric moments are centroids (or centers of gravity). lies in the range from 0 to 1. Compactness of an ideal sphere equals 1. Ratio is the so-called first 3D moment invariant based on the second-order central geometric moments. The invariant is constant or changes slightly for origin translation, uniform scaling, and rotation [49]. is the inverted first 3D moment invariant multiplied by the constant, so, it is an invariant for translation, rotation, and scaling as well. In general, geometric moments are widely used in statistics for a description of the probability density function form and in classic rigid-body mechanics to measure the mass distribution of a body. Usage of moment invariants is a prospective direction in image processing for creation of shape factors as well as for the development of algorithms for shapes analysis and recognition.
To demonstrate the advantage of over alternative approaches, we calculated various compactness values for spheres of different radii with different random noises such as protuberances and surface cavities. Figure 8 shows a slice of the sphere with typical noise on the surface. In the next experiment, we determined which method for compactness calculation allows us to better distinguish a sphere from a region formed by cutting off segments of different sizes from the sphere.
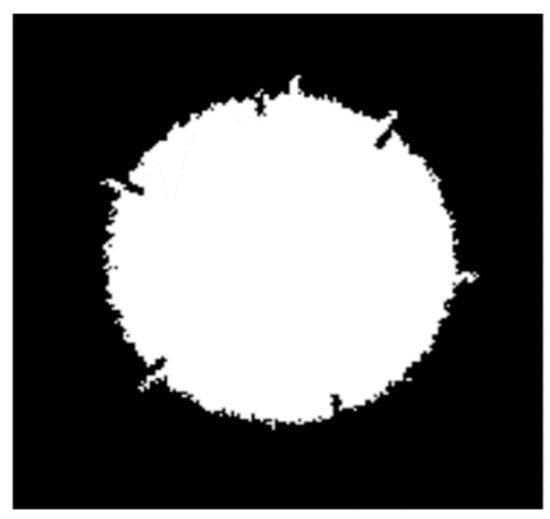
Figure 8.
Slice of a sphere with cavities and outliers on a surface.
Plots in Figure 9 show various compactness values depending on sphere radius: (1) ; (2) , where the surface area is calculated by the marching cubes algorithm; (3) , where the surface area is calculated by means of erosion; (4) Bribiesca’s compactness; (5) theoretical ideal case, where compactness equals 1. for both considered approaches are sufficiently different from 1 and have significant fluctuations. is close to 1 except for spheres of radius less than 10. Bribiesca’s compactness is close to 1 in all range of considered radiuses.
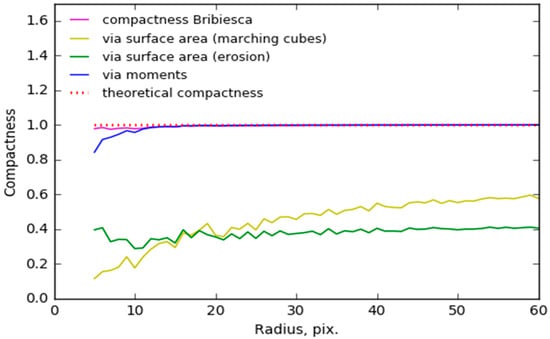
Figure 9.
Compactness of spheres of different radii with a noisy surface.
Plots in Figure 10 show compactness values for bodies from hemisphere (L = 60) to sphere (L = 0). Figure 11 illustrates the meaning of L parameter. and allow to distinguish sphere and sphere with the clipped segment. Bribiesca’s compactness is too similar even for sphere and hemisphere.
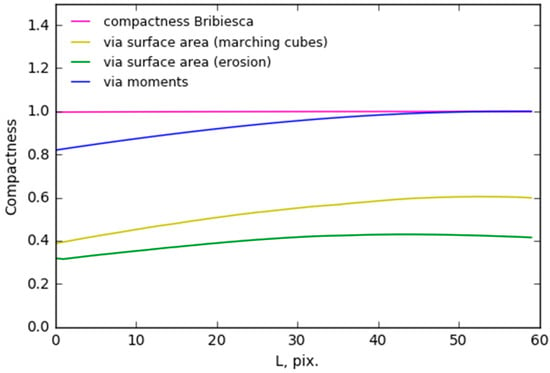
Figure 10.
Compactness when the shape of the body changes from the hemisphere to the sphere.

Figure 11.
Illustration of the meaning of L parameter for Figure 6.
Application of compactness calculated via the second -order central geometrical moments has obvious advantages in comparison with well-known approaches based on 3D region surface area and volume. In addition, has robustness to the presence of a modest number of pores in contrast to .
2.5.2. Calculation of Sizes of a Particle
We need to demonstrate that the result of our digital crush test matches the result of conventional sieves-based method. The crush test outcome by sieving is dependent on the particles shape. Particles passing through a sieve can be in one dimension larger than the size of the sieve apertures [50]. Paper [51] demonstrates that usage of the ellipsoid model for the description of a particle is preferable for image-based estimation of grain size distribution for particles of any shape. Indeed, particles of ceramic proppant have a shape close to a sphere, but fragments after crushing can be of any shape.
There are numerous publications which apply the model of the equivalent ellipsoid to describe linear sizes of a region. For example, in Reference [52], lengths of axes of the ellipsoid are used to characterize the size of an individual pore. The ellipsoid is called equivalent (or reference) for the region when it has the same geometric moments up to the second-order as the region. Inertia tensor allows to find lengths of axes of the equivalent ellipsoid. The technique originates from the physics of a rigid body. Traditionally, the inertia tensor is designated as:
where Iij are second-order central moments of inertia relative to corresponding axes.
Based on the designations of central geometric moments in Equation (4), matrix Equation (6) can be rewritten as [49]:
Inertia tensor for the ellipsoid is known from mechanics:
where a, b, and c are lengths of semi-axes of the ellipsoid; here we omitted the mass term.
So, it is possible to find principal axes of inertia by solving the eigenvalue problem for matrix from Equation (7), then to solve the system of equations, that is formed by comparing of corresponding principal axes from matrices and (8). Lengths of semi-axes of equivalent ellipsoids are:
where are eigenvalues of the matrix ; all are real numbers due to the symmetry of .
Because of the arbitrary orientation of a connected region, the statement is not always true. To obtain the equivalent ellipsoid the lengths of its major, medial, and minor axis, respectively, we need to sort doubled a, b, and c in descending order.
For convex ellipsoidal regions, length of the medial axis can be used as a good fit to estimate if a particle passes through a squared cell sieve. However, for particles with a complex shape, we propose to use the median value from lengths of the projections to principal axes as an estimate. Monograph [49] describes an elegant way for orientation of a region along principal axes. We obtain eigenvectors u1, u2, and u3 for during the solution to the eigenvalue problem. The eigenvectors form a rotation matrix R, because the vectors are orthogonal due to the symmetry of the matrix :
The inverse of matrix R−1 = RT rotates the region into so-called normalized position, i.e., it orients the image along principal axes. As one can see, the approach has a clear analogy with Principal Component Analysis (PCA). Calculation of lengths of projections for a rotated region is straightforward: We just calculate the difference between maximal and minimal values for the respective coordinate of voxels of the region. The median value of three projection lengths can be used as an estimate if the particle passes through the sieve.
It is worth noting, that covariance matrix containing the second-order central geometrical moments can be used instead of inertia tensor:
The matrix has the same eigenvectors as to within a permutation, but their eigenvalues differ. The alternative way for getting eigenvectors from the covariance matrix can be used in the case when there is not the necessity to calculate the lengths of an equivalent ellipsoid axes.
Lengths of projections to principal axes characterizes linear sizes of particle perfectly. However, sometimes it is convenient to use more rough estimation, for example, an equivalent diameter (ED), i.e., the diameter of a sphere with the same volume V:
2.5.3. Various Types of Porosity
Porosity (also called voidage) is the fraction of the porous sample bulk volume that is occupied by pore or void space [53]. When we talk about the porosity of a proppant pack, we can differentiate intergranular porosity of whole pack and intragranular porosity of each individual particle. The intergranular porosity is extremely important for estimation of permeability of the proppant pack by fluid. The contribution of intragranular porosities of particles to the permeability of pack is negligible. On the other hand, intragranular porosity is important to characterize a particle.
Particles of ceramic proppant are porous, and their pores can be divided into two types: interconnected (or effective or open) and isolated (or closed) depending on their connection with the external void space. A pore connected with external voids is called interconnected. The opposite, a pore is called isolated, when it is not connected with external voids. In turn, interconnected pores are divided into through and dead-end. A dead-end pore has only one connection with the particle’s surfaces. Such pores are filled with liquid or gas during filtration but do not contribute to the porous material permeability. The total intragranular porosity comprises both effective and isolated pores.
We propose the following set of algorithms for extraction of 3D images containing different types of pores from image L. An image LIP containing isolated pores is the difference between the outcome of the 3D holes’ filling operation L3Dh and image L:
LIP = L3Dh − L
Operation of 3D holes filling does not fill effective pores, which are connected with the external background. 2D holes’ filling operation for all slices should be performed to fill both effective and isolated pores. Strictly speaking, the 2D filling should be done in three mutually perpendicular directions. Such approach ensures that pores, which penetrate a particle and are parallel to the image axes, are filled. An image LTP containing all pores is the difference between the outcome of the disjunction of slice-by-slice 2D holes’ filling operations in XY, XZ, and YZ planes and image L:
LTP = (L2DhXY OR L2DhXZ OR L2DhYZ) − L
An image LEP containing effective pores is the difference between the image with all pores LTP and the image containing isolated pores LIP:
LEP = LTP − LIP
We can apply the following algorithm to classify each effective pore as through or dead-end:
- Making morphological dilation of image LEP(i) of i-th connected region from LEP with cubic structure element B having size 3 by 3 by 3:
- Counting the number of connected regions in image D:
- If only one connected region (for 26-connectivity) does exist in image D, then the pore is a dead-end one. Otherwise, the pore is classified as a through.
For a particle, we calculate the total volume of all intragranular pores and sum volumes for each type of pores: isolated, through, and dead-end. Moreover, we analyze normalized distributions of volumes of pores and distributions of the location of pores inside the body of a particle for each type of pores.
2.6. Matching of Particles
Our algorithm for matching of particles in images A and B is based on the following two observations:
- particles relocation between A and B is not too big, especially in XY plane;
- several features of corresponding regions remain approximately constant.
We calculate similarity S between regions a and b as:
where V is the volume of a region; RI is rotation invariant based on the second-order central geometrical moments:
is a sum of volumes of isolated pores of a particle, wi are weights tuned for existing experimental data: w1 = w2 = 0.4, w3 = 0.2.
The matching algorithm comprises the following steps:
- calculation of similarities for each particle from A and several particles from B located in some limited sub-volume; if the similarity for label a from A and label b from B is greater than threshold P, then the similarities accompanied by a and b labels are added to the list;
- while the list is not empty, repeat the following:
- labels a and b match each other when the labels relate to the maximal similarity in the list;
- removing from the list all the similarities with labels from A equal to a or with labels from B equal to b.
Figure 12 shows slices with matched particles from A and B images. Matched particles are designated by the same color. To be honest, there is an ambiguity with the definition: Is the particle broken or not? How big should be a fragment, which splits from the particle to make it “crushed”? The increase of threshold P allows the detection matched particles which, no doubt, survived the load. The decrease of P leads to the matching of more particles, which look similar, accordingly, unmatched particles in image A are definitely broken in B. Figure 13 demonstrates how changing P influences the number of matched particles.
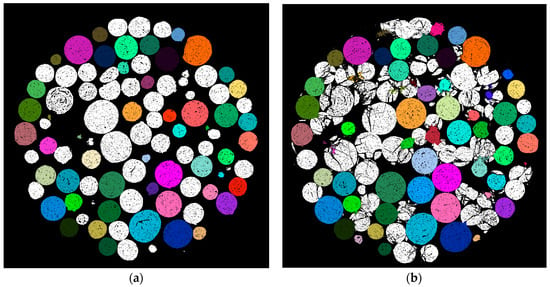
Figure 12.
Slices with matched particles: (a) from image A; (b) from image B.
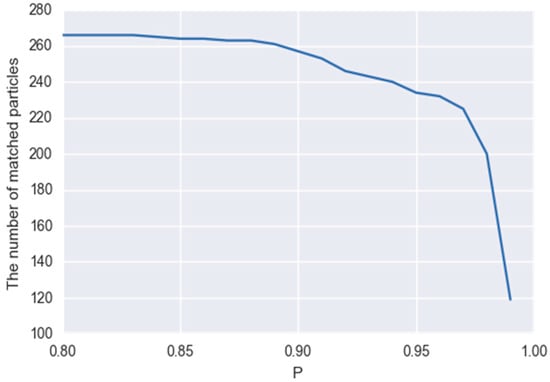
Figure 13.
The number of matched particles versus threshold P.
Despite good results in matching, it is reasonable to continue the investigation with the aim to find a set of parameters that can serve as particle fingerprint and, therefore, can be used for matching of initial particle and their crushed fragments.
3. Results and Discussion
The unique possibility to obtain a 3D image of the proppant pack under stress using the experimental technique described above allows modeling of mechanical (stresses redistribution, elastic, and plastic deformation), chemical (acidizing and chemical precipitation), and hydrodynamic phenomena (single and two-phase filtrations, fines migration with fluid flow) using the real geometry of the media. This type of modeling can be crucial for different application design like enhanced oil recovery or long-term prediction of hydraulic fracture performance prediction. Various results about properties of the entire proppant pack, as well as individual particles of ceramic proppant of different types, were obtained by the described algorithms. For instance, flow simulation in proppant pack under stress was carried out by a direct hydrodynamic (DHD) simulator [54]. However, below we focus mostly on the results, which are related to algorithmic and software implementation problems.
3.1. Unsupervised Segmentation
For an estimation of the benefits of the proposed unsupervised segmentation technique, we processed five 3D images with fixed parameters delta_h and max_filter_size as well as with parameters obtained by the maximization of metrics. Those fixed parameters were optimal according to the criterion for two images segmented previously. Figure 14 shows the metrics depending on parameters delta_h and max_filter_size.
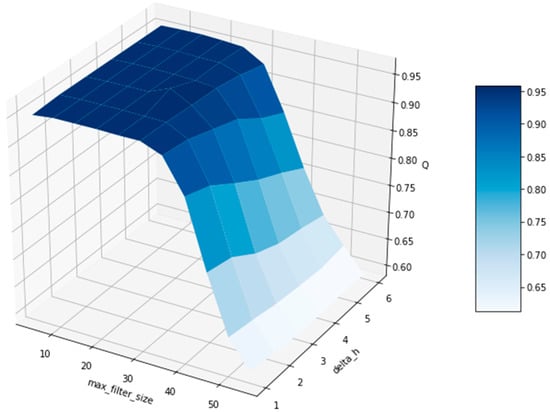
Figure 14.
Example of quality metrics Q depending on parameters delta_h and max_filter_size.
Table 1 contains the number of erroneously segmented particles obtained by segmentation with fixed parameters and by the proposed unsupervised segmentation for each tested 3D image. The total number of particles in each 3D image is 615. Segmentation with fixed parameters leads to 30–50 errors. Figure 15a shows a slice of segmented and labeled image by segmentation with fixed parameters. As one can see, one ellipsoidal particle was segmented as two regions, ten pairs of neighboring particles were pairwise combined into one region. Unsupervised segmentation had no errors or just one or two errors in the worst case. Figure 15b demonstrates the same slice, where unsupervised segmentation was applied. Segmentation outcome is fully correct. So, the proposed unsupervised criterion for the segmentation of 3D images of ceramic proppant performs high-quality segmentation in automatic mode.

Table 1.
The number of erroneously segmented particles.
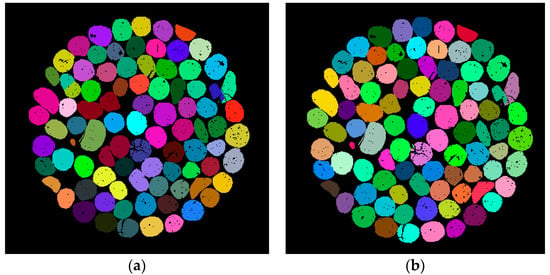
Figure 15.
Slices of segmented image: (a) fixed parameters; (b) parameters by maximization of Q.
A relatively long processing time is an attribute for good segmentation results because we iteratively repeated segmentation with various parameters and selected the outcome with the highest . We need to decrease the number of the iterations and to speed up a segmentation pass. Unfortunately, sometimes surface is non-convex and there are several local maximums. Paper [55] considers the selection of parameters for ‘ideal’ segmentation as an optimization problem. Obviously, an exhaustive search can find the global maximum, but it is the longest approach. An application of genetic algorithm (GA) [56] looks unreasonably complicated for optimization of just two parameters, and GA cannot find extremum in a few iterations. Considering that surface is convex frequently, we apply the gradient descent algorithm [57] for looking for maximal . To avoid detection of local maximum instead of global one, we start the gradient descent procedure from several (from two to five) starting points and select the maximum from found out extremums. In spite of this approach, which worked well for dozens of test images, we continued looking for an appropriate optimization method, that is a fast and ensures detection of global extremum.
Implementation of watershed algorithm is a bottleneck from processing time point of view [26]. A promising way is the development of parallel watershed implementation, for instance, based on parallel priority-flood depression filling [58].
Proposed algorithms were developed for almost spherical porous particles of ceramic proppant. Evidently, described digital crush test workflow for non-porous sand grains is also feasible, but with modified segmentation and one-to-one matching procedures.
3.2. Validation of Parameters Influential to Crushing
The proposed workflow allows manufacturers of ceramic proppant to carry out fully digitized mechanical tests of different types of proppant giving quantitative information on the factors influencing proppant performance under stress, couple mechanical tests results with stress distribution modeling and pointing out what manufacturing processes should be changed for performance enhancement. Undoubtedly, the proppant pack crush process is a complex collective phenomenon of proppant particles’ interactions under general loading stress. The same particle can crush or not depending on where it is located, how many neighbors are located around it and by which points it interacts with the other particles, etc. Thus, individual properties of a particle can be less important in comparison with the overall geometric configuration. Nevertheless, with the presented technique, we are capable of performing the analysis of individual features, while collective effects can be studied in the future.
In this sub-section ‘sample’ denotes a subset of observations drawn from a certain set. Below we provide an example of statistical analysis that helps to understand which features of particles can affect the crushing. The analysis makes comparison of two samples: (1) The values of a feature for crushed and (2) for survived particles. Distributions of these samples are compared using Kolmogorov–Smirnov nonparametric two-sample test as a measure of goodness-of-fit [59]. The null-hypothesis H0 is that two samples are subject to the same distribution. If H0 is rejected, we suppose studied features can be influential on crushing. Both samples should be significant, that is at least several dozens of particles should be crushed; just several broken particles are not enough. That is why we were unable to apply such statistical analysis for strong proppants with extremely high crush resistance. Nevertheless, it can be done by increasing stress.
In practice, we check the influence of about twenty parameters mostly related to shape factors of a particle and pores inside the particle, for example, we consider the volume of the biggest pores inside a particle, region elongation calculated as the ratio of minor and major principal axes. Let us examine the following parameters to demonstrate the workability of our approach: equivalent diameter ED, intragranular porosity, and compactness . From common sense, we can make assumptions about the influence of these features on breakage of the particles. We assume the size of particles has no influence on crushing. Contrary, porosity and shape of particles can be the affecting factors.
Histograms of considered features for crushed and survived particles are shown in Figure 16, Figure 17 and Figure 18 correspondingly. Table 2 contains the outcomes of applying the Kolmogorov–Smirnov test for checking the hypothesis about equivalent distributions of two samples. The results confirm our assumptions: ED cannot be the cause of crushing, but intragranular porosity and compactness can be. Table 2 is sorted by p-value to show the significance of the features relative to each other. Such analysis helps to rate different structural features according to the significance of their impact on crush. Output depends on proppant type and requires similar study in each case.
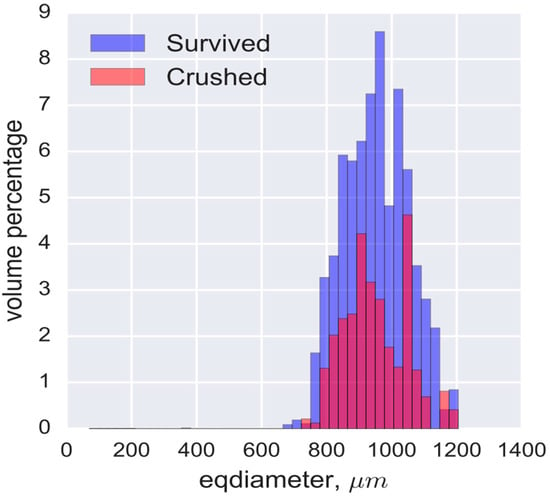
Figure 16.
Volume-weighted histograms of Equivalent Diameters for crushed and survived particles.
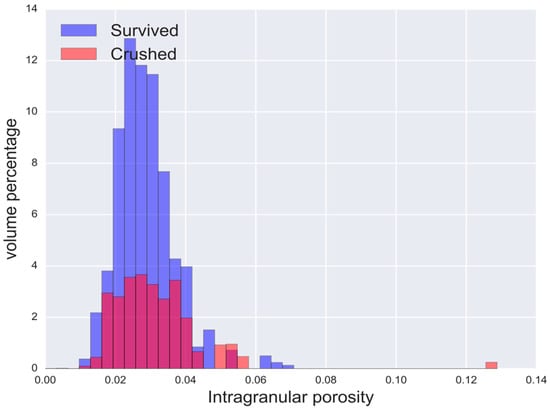
Figure 17.
Volume-weighted histograms of intragranular porosity for crushed and survived particles.
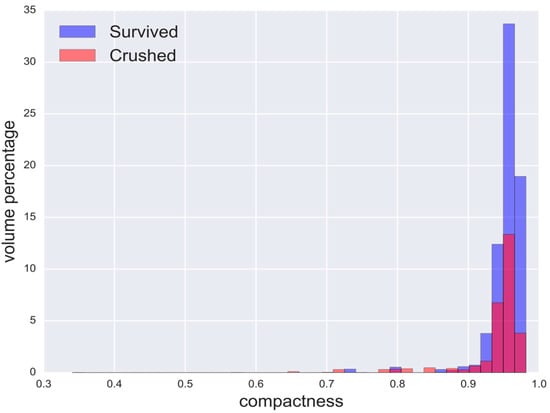
Figure 18.
Volume-weighted histograms of compactness for crushed and survived particles.

Table 2.
Kolmogorov–Smirnov two-sample test for features of survived and crushed particles.
3.3. Evaluation of Crush Resistance and Grain Size Distribution
Our digital crush test provides a good agreement with conventional laboratory method by sieving and weighting. Table 3 contains the comparison of laboratory and microCT image-based crush resistance tests for three types of ceramic proppants. Observed relative errors between image-based and laboratory crush resistance values are within spread range of conventional laboratory tests series data points. Our technique handles much fewer proppant particles in comparison with the conventional method. It can lead to bias in the repeatability of measurement results. Measurement System Analysis (MSA) [60], as well as the estimation of accuracy and standard deviation for our digital crush test, are in the list of future tasks. In contrast to conventional laboratory method, we provide the possibility to do detailed morphology analysis of the shape of particles and fines during loading, for example, as it was done for microCT images natural sand in Reference [61].

Table 3.
Comparison of laboratory and image-based crush resistance tests for three proppant types.
Grain size distribution is an important characteristic of granular material. Specification of ceramic proppant contains a table with particles size distribution obtained by sieving and weighting. Table 4 depicts grain size distribution for CarboProp NRT 16/30 proppant. Figure 19 shows the volume-weighted grain size distribution for the same proppant by our method. Median value from lengths of the projections to principal axes (size_medial_pr) is used as grain size characterization. One can see, the distributions are close to each other. Some disagreements can be explained by a smaller amount of tested proppant in the digital crush test. The other possible cause is an error in estimation of the volume of a particle by our method. Due to limited resolution, MicroCT cannot resolve micro-pores. Moreover, currently, due to huge memory consumption and high computational complexity we are only able to deal with a downsampled copy of image. So, we cannot take into account small pores; and our algorithm has a tendency to overestimate volume of a particle a little bit. The development of software for segmentation of microCT images in the highest resolution is a topical but challenging problem.

Table 4.
Grain size distribution for CarboProp NRT 16/30 by sieve-based analysis.
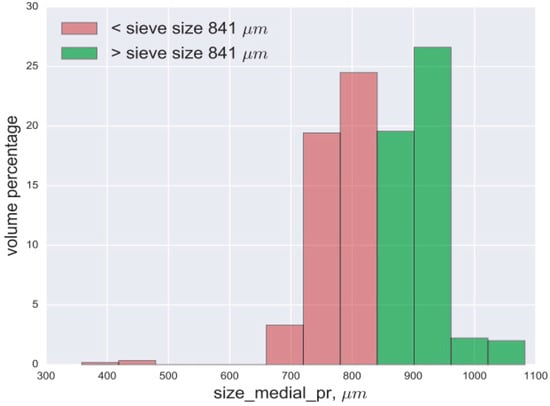
Figure 19.
Volume-weighted grain size distribution for CarboProp NRT 16/30 by our method.
To achieve a good correspondence with tests by sieves, we need to find appropriate features for the characterization of the size of 3D particles. Paper [62] compares grain size distributions of particles of natural sand obtained by microCT and by sieving. It is claimed that the sieve size correlates well with the intermediate principal axis length. We agree with that statement for particles having a shape like an ellipsoid. We argue intermediate length from lengths of projections to principal axes are preferable because the parameter is suitable for both convex and concave shapes. At least, we used this parameter for the building of grain size distribution and obtained reasonable outcomes.
4. Conclusions
We have presented algorithms for digital crush test using X-ray microtomography. Initially, our workflow was intended for characterization of ceramic proppant, but it can be adjusted for dealing with other types of proppant, for example, natural sand. Good agreement with laboratory tests proves that the developed system and algorithms for automatic 3D image segmentation, description of regions by parameters, and one-to-one particles matching between images before and after stress works well. In addition to overall crush resistance value achievable in the laboratory, the digital concept provides complementary information not available with conventional technique using sieves:
- characterization of proppant internal 3D microstructure;
- precise determination of generated fines size distribution;
- analysis of exactly the same proppant pack under consecutively increasing loading pressure, i.e., we can obtain a set of 3D microCT images of the sample under different stresses without unloading high-pressure cell;
- statistical analysis of the data collected in future can enable quantitative prediction of proppant crush resistance base on its initial characteristics including internal microstructure;
- a 3D microCT image of proppant pack under stress can be converted into a digital model and can be used for numerical simulations of different physical phenomena, e.g., multiphase fluid flow.
Key algorithmic findings for processing of volumetric images of proppant particles are the following:
- compactness that characterizes similarity of the shape to a sphere, should be calculated via second-order geometric moments instead of surface area and volume;
- unsupervised criterion based on average compactness can provide the best segmentation outcomes in automatic processing and avoid subjectivity of the operator;
- the proposed set of parameters allows to perform one-to-one matching of particles between microCT images before and after stress;
- median value from lengths of the projections to principal axes of an equivalent ellipsoid is a good estimate of correspondence to sieve cell size.
Author Contributions
V.A. was responsible for the task conceptualization and project administration as well as validation of obtained outcomes. I.Y. created methodology of data acquisition and worked on image visualization. I.S. developed described algorithms and software. I.S. and I.Y. worked on original draft preparation
Funding
This research received no external funding.
Conflicts of Interest
The authors declare no conflict of interest.
References
- Economides, M.J.; Nolte, K.G. Reservoir Stimulation, 3rd ed.; Wiley: New York, NY, USA, 2000; ISBN 978-0471491927. [Google Scholar]
- API RP 19D: Measuring the Long-Term Conductivity of Proppants; American Petroleum Institute: Washington, DC, USA, 2008.
- Kak, A.C.; Slaney, M. Principles of Computerized Tomographic Imaging; Society of Industrial and Applied Mathematics: Philadelphia, PA, USA, 2001. [Google Scholar]
- Buzug, T.M. Computed Tomography: From Photon Statistics to Modern Cone-Beam CT; Springer: New York, NY, USA, 2008; ISBN 978-3540394082. [Google Scholar]
- Withers, P.J. X-ray nanotomography. Mater. Today 2007, 10, 26–34. [Google Scholar] [CrossRef]
- Ketcham, R.A.; Carlson, W.D. Acquisition, optimization and interpretation of X-ray computed tomographic imagery: Applications to the geosciences. Comput. Geosci. 2001, 27, 381–400. [Google Scholar] [CrossRef]
- Armstrong, R.T.; Porter, M.L.; Wildenschild, D. Linking pore-scale interfacial curvature to column-scale capillary pressure. Adv. Water Resour. 2012, 46, 55–62. [Google Scholar] [CrossRef]
- Varfolomeev, I.; Yakimchuk, I.; Sharchilev, B. Segmentation of 3D image of a rock sample supervised by 2D mineralogical image. In Proceedings of the 3rd IAPR Asian Conference on Pattern Recognition (ACPR), Kuala Lumpur, Malaysia, 3–6 November 2015; pp. 346–350. [Google Scholar]
- Beletskaya, A.; Chertova, A.; Abashkin, V.; Willberg, D.; Korobkov, D.; Yakimchuk, I.; Dovgilovich, L. Image-Based Evaluation of Retained Proppant Pack Permeability. In Proceedings of the SPE Russian Petroleum Technology Conference, Moscow, Russia, 15–17 October 2018. [Google Scholar]
- Blunt, M.J.; Bijeljic, B.; Dong, H.; Gharbi, O.; Iglauer, S.; Mostaghimi, P.; Paluszny, A.; Pentland, C. Pore-scale imaging and modelling. Adv. Water Resour. 2013, 51, 197–216. [Google Scholar] [CrossRef]
- Koroteev, D.A.; Dinariev, O.; Evseev, N.; Klemin, D.V.; Safonov, S.; Gurpinar, O.M.; Berg, S.; van Kruijsdijk, C.; Myers, M.; Hathon, L.A.; et al. Application of digital rock technology for chemical EOR screening. In Proceedings of the SPE Enhanced Oil Recovery Conference, Kuala Lumpur, Malaysia, 2–4 July 2013. [Google Scholar]
- Botha, P.W.; Sheppard, A.P. Mapping permeability in low-resolution micro-CT images: A multiscale statistical approach. Water Resour. Res. 2016, 52, 4377–4398. [Google Scholar] [CrossRef]
- Bultreys, T.; De Boever, W.; Cnudde, V. Imaging and image-based fluid transport modeling at the pore scale in geological materials: A practical introduction to the current state-of-the-art. Earth-Sci. Rev. 2016, 155, 93–128. [Google Scholar] [CrossRef]
- Lunati, I.; Prodanovic, M.; Porter, M.L. Special issue in Advances in Water Resources: Pore-scale modeling and experiments. Adv. Water Resour. 2016, 95, 1–2. [Google Scholar] [CrossRef]
- Koroteev, D.; Dinariev, O.; Evseev, N.; Klemin, D.; Nadeev, A.; Safonov, S.; Gurpinar, O.M.; Berg, S.; van Kruijsdijk, C.; Armstrong, R.; et al. Direct hydrodynamic simulation of multiphase flow in porous rock. Petrophysics 2014, 55, 294–303. [Google Scholar]
- Shandrygin, A.; Shelepov, V.; Ramazanov, R.; Andrianov, N.; Klemin, D.; Nadeev, A.; Safonov, S.; Yakimchuk, I. Mechanism of Oil Displacement During Polymer Flooding in Porous Media with Micro-Inhomogeneities (Russian). In Proceedings of the SPE Russian Petroleum Technology Conference and Exhibition, Moscow, Russia, 24–26 October 2016. [Google Scholar]
- Shandrygin, A.; Shelepov, V.; Ramazanov, R.; Andrianov, N.; Klemin, D.; Nadeev, A.; Yakimchuk, I. Mechanism of oil displacement during WAG in porous media with micro-inhomogeneities. In Proceedings of the SPE Russian Petroleum Technology Conference, Moscow, Russia, 26–28 October 2015. [Google Scholar]
- Sanematsu, P.; Shen, Y.; Thompson, K.; Yu, T.; Wang, Y.; Chang, D.L.; Alramahi, B.; Takbiri-Borujeni, A.; Tyagi, M.; Willson, C. Image-based Stokes flow modeling in bulk proppant packs and propped fractures under high loading stresses. J. Pet. Sci. Eng. 2015, 135, 391–402. [Google Scholar] [CrossRef]
- Arshadi, M.; Zolfaghari, A.; Piri, M.; Al-Muntasheri, G.A.; Sayed, M. The effect of deformation on two-phase flow through proppant-packed fractured shale samples: A micro-scale experimental investigation. Adv. Water Resour. 2017, 105, 108–131. [Google Scholar] [CrossRef]
- Walsh, S.D.; Smith, M.; Carroll, S.A.; Crandall, D. Non-invasive measurement of proppant pack deformation. Int. J. Rock Mech. Min. Sci. 2016, 87, 39–47. [Google Scholar] [CrossRef]
- Yakimchuk, I.V.; Safonov, I.V.; Serkova, E.P.; Evstefeeva, V.Y.; Korobkov, D.A. Ceramic Proppant Microstructure Characterization by X-Ray Microtomography. In Proceedings of the Bruker Micro-CT User Meeting 2018, Gent, Belgium, 16–19 April 2018; pp. 17–23. [Google Scholar]
- Gouillart, E.; Nunez-Iglesias, J.; van der Walt, S. Analyzing microtomography data with Python and the scikit-image library. Adv. Struct. Chem. Imaging 2016, 2, 18. [Google Scholar] [CrossRef] [PubMed]
- Van der Walt, S.; Colbert, S.C.; Varoquaux, G. The NumPy array: A structure for efficient numerical computation. Comput. Sci. Eng. 2011, 13, 22–30. [Google Scholar] [CrossRef]
- Van der Walt, S.; Schönberger, J.L.; Nunez-Iglesias, J.; Boulogne, F.; Warner, J.D.; Yager, N.; Gouillart, E.; Yu, T. Scikit-image: Image processing in Python. PeerJ 2014, 2, 453. [Google Scholar] [CrossRef] [PubMed]
- Hunter, J.D. Matplotlib: A 2D graphics environment. Comput. Sci. Eng. 2007, 9, 90–95. [Google Scholar] [CrossRef]
- Kornilov, A.; Safonov, I. An Overview of Watershed Algorithm Implementations in Open Source Libraries. J. Imaging 2018, 4, 123. [Google Scholar] [CrossRef]
- Kato, M.; Kaneko, K.; Takahashi, M.; Kawasaki, S. Segmentation of multi-phase X-ray computed tomography images. Environ. Geotech. 2015, 2, 104–117. [Google Scholar] [CrossRef]
- Wang, W.; Kravchenko, A.N.; Smucker, A.J.M.; Rivers, M.L. Comparison of image segmentation methods in simulated 2D and 3D microtomographic images of soil aggregates. Geoderma 2011, 162, 231–241. [Google Scholar] [CrossRef]
- Iassonov, P.; Gebrenegus, T.; Tuller, M. Segmentation of X-ray computed tomography images of porous materials: A crucial step for characterization and quantitative analysis of pore structures. Water Resour. Res. 2009, 45, W09415. [Google Scholar] [CrossRef]
- Oh, W.; Lindquist, W.B. Image thresholding by indicator kriging. IEEE Trans. Pattern Anal. Mach. Intell. 1999, 21, 590–602. [Google Scholar]
- Houston, A.N.; Otten, W.; Baveye, P.C.; Hapca, S. Adaptive-window indicator kriging: A thresholding method for computed tomography images of porous media. Comput. Geosci. 2013, 54, 239–248. [Google Scholar] [CrossRef]
- Berthod, M.; Kato, Z.; Yu, S.; Zerubia, J. Bayesian image classification using Markov random fields. Image Vis. Comput. 1996, 14, 285–295. [Google Scholar] [CrossRef]
- Otsu, N. A threshold selection method from gray-level histograms. IEEE Trans. Syst. Man Cybern. 1979, 9, 62–66. [Google Scholar] [CrossRef]
- Kapur, J.N.; Sahoo, P.K.; Wong, A.K. A new method for gray-level picture thresholding using the entropy of the histogram. Comput. Vis. Gr. Image Process. 1985, 29, 273–285. [Google Scholar] [CrossRef]
- Vincent, L.; Soille, P. Watersheds in digital spaces: An efficient algorithm based on immersion simulations. IEEE Trans. Pattern Anal. Mach. Intell. 1991, 6, 583–598. [Google Scholar] [CrossRef]
- Beucher, S.; Meyer, F. The morphological approach to segmentation: The watershed transformation. Opt. Eng. 1992, 34, 433–433. [Google Scholar]
- Soille, P. Morphological Image Analysis: Principles and Applications; Springer: New York, NY, USA, 2004; ISBN 978-3540429883. [Google Scholar]
- Atta-Fosu, T.; Guo, W.; Jeter, D.; Mizutani, C.M.; Stopczynski, N.; Sousa-Neves, R. 3D Clumped Cell Segmentation Using Curvature Based Seeded Watershed. J. Imaging 2016, 2, 31. [Google Scholar] [CrossRef] [PubMed]
- Safonov, I.V.; Mavrin, G.N.; Kryzhanovsky, K.A. Segmentation of convex cells with partially undefined boundaries. Pattern Recognit. Image Anal. 2006, 16, 46–49. [Google Scholar] [CrossRef]
- Jung, C.; Kim, C. Segmenting clustered nuclei using H-minima transform-based marker extraction and contour parameterization. IEEE Trans. Biomed. Eng. 2010, 57, 2600–2604. [Google Scholar] [CrossRef] [PubMed]
- Vincent, L. Morphological grayscale reconstruction in image analysis: Applications and efficient algorithms. IEEE Trans. Image Process. 1993, 2, 176–201. [Google Scholar] [CrossRef] [PubMed]
- Zhang, H.; Fritts, J.E.; Goldman, S.A. Image segmentation evaluation: A survey of unsupervised methods. Comput. Vis. Image Underst. 2008, 110, 260–280. [Google Scholar] [CrossRef]
- Montero, R.S.; Bribiesca, E. State of the art of compactness and circularity measures. Int. Math. Forum 2009, 4, 1305–1335. [Google Scholar]
- Zhao, B.; Wang, J. 3D quantitative shape analysis on form, roundness, and compactness with μCT. Powder Technol. 2016, 291, 262–275. [Google Scholar] [CrossRef]
- Lorensen, W.E.; Cline, H.E. Marching cubes: A high resolution 3D surface construction algorithm. ACM Siggraph Comput. Gr. 1987, 21, 163–169. [Google Scholar] [CrossRef]
- Bribiesca, E. An easy measure of compactness for 2D and 3D shapes. Pattern Recognit. 2008, 41, 543–554. [Google Scholar] [CrossRef]
- Žunić, J.; Hirota, K.; Martinez-Ortiz, C. Compactness measure for 3d shapes. In Proceedings of the IEEE Informatics, Electronics and Vision Conference (ICIEV), Dhaka, Bangladesh, 18–19 May 2012; pp. 1180–1184. [Google Scholar]
- Mamistvalov, A.G. N-dimensional moment invariants and conceptual mathematical theory of recognition n-dimensional solids. IEEE Trans. Pattern Anal. Mach. Intell. 1998, 20, 819–831. [Google Scholar] [CrossRef]
- Flusser, J.; Suk, T.; Zitova, B. 2D and 3D Image Analysis by Moments; John Wiley & Sons: New York, NY, USA, 2016; ISBN 978-1119039358. [Google Scholar]
- Kwan, A.K.; Mora, C.F.; Chan, H.C. Particle shape analysis of coarse aggregate using digital image processing. Cem. Concr. Res. 1999, 29, 1403–1410. [Google Scholar] [CrossRef]
- Arasan, S.; Akbulut, S.; Hasiloglu, A.S. Effect of particle size and shape on the grain-size distribution using Image analysis. Int. J. Civ. Struct. Eng. 2011, 1, 968–985. [Google Scholar]
- Claes, S.; Soete, J.; Cnudde, V.; Swennen, R. A three-dimensional classification for mathematical pore shape description in complex carbonate reservoir rocks. Math. Geosci. 2016, 48, 619–639. [Google Scholar] [CrossRef]
- Dullien, F.A. Porous Media: Fluid Transport and Pore Structure; Academic Press: New York, NY, USA, 1992; ISBN 9780122236518. [Google Scholar]
- Dinariev, O.; Evseev, N. Multiphase flow modeling with density functional method. Comput. Geosci. 2016, 20, 835–856. [Google Scholar] [CrossRef]
- Bhanu, B.; Lee, S.; Das, S. Adaptive image segmentation using genetic and hybrid search methods. IEEE Trans. Aerosp. Electron. Syst. 1995, 31, 1268–1291. [Google Scholar] [CrossRef]
- Mitchell, M. An Introduction to Genetic Algorithms; MIT Press: Cambridge, MA, UAS, 1996; ISBN 9780585030944. [Google Scholar]
- Yu, N. Introductory Lectures on Convex Optimization: A Basic Course; Springer: New York, NY, USA, 2004; ISBN 1402075537. [Google Scholar]
- Barnes, R. Parallel Priority-Flood depression filling for trillion cell digital elevation models on desktops or clusters. Comput. Geosci. 2016, 96, 56–68. [Google Scholar] [CrossRef]
- Sheskin, D.J. Handbook of Parametric and Nonparametric Statistical Procedures; CRC Press: Boca Raton, FL, USA, 2011; ISBN 9781439858011. [Google Scholar]
- Montgomery, D.C. Introduction to Statistical Quality Control, 7th ed.; John Wiley and Sons: New York, NY, USA, 2013; ISBN 9781118146811. [Google Scholar]
- Zhao, B.; Wang, J.; Coop, M.R.; Viggiani, G.; Jiang, M. An investigation of single sand particle fracture using X-ray micro-tomography. Géotechnique 2015, 65, 625–641. [Google Scholar] [CrossRef]
- Fonseca, J.; O’Sullivan, C.; Coop, M.R.; Lee, P.D. Non-invasive characterization of particle morphology of natural sands. Soils Found 2012, 52, 712–722. [Google Scholar] [CrossRef]
© 2018 by the authors. Licensee MDPI, Basel, Switzerland. This article is an open access article distributed under the terms and conditions of the Creative Commons Attribution (CC BY) license (http://creativecommons.org/licenses/by/4.0/).