1. Introduction
Flat panel displays (FPDs) have become an essential component in consumer electronics, and their market is expected to expand at a compound annual growth rate (CAGR) of 5.8% by 2020. This is due to the proliferation of smart devices such as televisions, monitors, laptops, tablets, smart-phones, and digital cameras [
1]. Thin film transistor-liquid crystal displays (TFT-LCDs) are the most popular FPDs, and organic light-emitting diodes (OLEDs) have increasingly been used in smart-phones in recent years. However, the use of plasma display panels (PDPs) has decreased in the market. For the purpose of mass production and product quality, automatic optical inspection (AOI) is generally promoted by manufacturing vendors [
2]. FPDs are usually large, but the size of defects on them is of the order of hundreds of micrometers. As such, the manual inspection of FPDs is not suitable [
3].
The AOI process identifies defects, such as dents, scratches, black spots, white spots, swollen areas, and craters in FPDs using vision systems [
2,
4]. These defects are detected in an image using mathematical algorithms, such as adaptive thresholding [
2], the Fourier-based method [
4], discrete cosine transformation [
5], a rule-based method [
6], a periodic reference pattern [
7], studentized residuals [
8], Hough transformation [
9], Gabor wavelet [
10], neural networks [
11] and image-to-image methods [
12]. These techniques have been applied to TFT-LCD inspection, as well as Active-Matrix Organic Light-Emitting Diode (AMOLED) inspection [
13].
These studies however only reported on defect detection, and as such, there are only a few studies on the image quality during acquisition. The conventional inspection of semiconductors usually involves the examination of specific areas; however, AOI typically entails examination of the entire area of FPDs. AOIs have a larger field of view (FOV) and, therefore, it is more difficult to set up optical conditions for AOI than in the case of semiconductor inspections. Line light sources are mostly used in AOI systems to illuminate inspection regions during scanning. However, commercial line light sources have a non-uniform distribution of the luminance, and the light angle is usually adjusted by hand. After appropriate adjustment of the image focus of the line cameras, the color and luminance of the light source are determined based on previous experience with regard to image quality. AOI systems normally generate a large image from multiple cameras and light sources. It is therefore difficult and repetitive to establish optimal inspection conditions [
13]. Lighting conditions greatly affect the image quality, and they are crucial to the performance of AOI systems [
4].
Previous studies on FPD inspection focused on defect detection based on acquired images, but little attention has been paid to the determination of the light color and intensity with the aim of maximizing image quality. Light control for TFT-LCD inspection was investigated in a study by Wang. However, he did not outline a detailed approach for light control [
14]. Furthermore, most studies have relied on the use of single color sources rather than multiple color sources with a large number of dimming level combinations, obtained via the involution of the different colors. This makes it difficult to determine the dimming level required to maximize image quality.
This study proposed an automatic color lighting algorithm for determining the light color and intensity for inspecting FPD images. The algorithm controls the activation of the mixed light source, the acquisition of scanning images, correction of non-uniform luminance, calculation of image quality index (IQI), and the adjustment of the dimming level of the light source. This algorithm was derived under the assumption of an arbitrary number of colors in the mixed light source. The raw images acquired after scanning usually exhibit vertical patterns due to non-uniform luminance; hence, brightness correction was performed [
13]. The acquired image is sufficiently large and has small periodic patterns, and thus the Tenenbaum gradient was applied to calculate the index, instead of the sharpness, which was used in previous studies [
15,
16]. The dimming level for maximizing the image quality was determined by iterating the simplex search method (SSM). Automatic color lighting was proposed in our previous studies; however, the focus was on non-repetitive patterns in a small area [
17]. As such, they are not suitable for these FPD inspection processes.
The proposed algorithm was applied to a scanning stage to inspect an AMOLED panel. A red-green-blue-white (RGBW) source was used to illuminate the AMOLED panel, and the SSM was used to determine the dimming levels of the RGBW source with respect to the scanning images. Therefore, the automatic lighting process used in the experiments was based on searching and determining the light color and intensity required for inspecting the AMOLED panel. This paper is organized as follows.
Section 2 instructs how to obtain image index from a raw image and
Section 3 presents the simplex search method to determine the optimal lighting conditions. Experimental setup and results are shown in
Section 4. A conclusion is made in
Section 5.
2. Image Correction and Index
The camera and the optical assembly inspect a large area, and the charge-coupled device (CCD) pixels of the camera are generally sensitive to light conditions. Compared with the inspection units, the mixed light source and the beam expander are not as precise, which causes non-uniform illumination and vertical patterns in a scanning image. This phenomenon is usually adjusted using image correction [
7,
13]. After image correction, light color and intensity must be determined for the maximum of the image quality index (IQI). IQI has been discussed in image quality assessment measured in the absence of reference image. Hence the no-reference model has been presented in previous research [
18]. The IQI in industrial machine vision can be evaluated using focus indices [
15,
16]. Several no-reference models of IQI have been applied to aspects of image processing, such as sharpness/blurriness [
18,
19,
20,
21], contrast [
22], noise [
23], and image spectrum [
24,
25]. Sharpness is the inverse of blurriness and many sharpness metrics are related to focus indices. Contrast is also evaluated using focus indices. Machine vision cameras have low-noise levels and acquire still images; hence, noise and image spectra do not have many effects on an AOI system. Image quality can be evaluated using the image index, which is normally based on a pixel level operation. Tens of image indices have been proposed for automatic focusing algorithms in microscopy [
26]. The index is usually called the sharpness and the focusing method is used to investigate the peak of the sharpness when optical conditions are adjusted [
27]. Several focusing methods for inspecting TFT-LCDs using sharpness has been proposed in previous reports. Indices based on variance and fast Fourier transform (FFT) are advantageous for large and non-repetitive patterns in semiconductors. Lee’s study considered various focus estimators to inspect small, periodic and regular (SPR) patterns on TFT-LCDs [
28]. However, the gradient-based index is advantageous for the SPR patterns [
29]. The sharpness for focusing was used for light control in previous studies [
15,
16,
17,
30], the gradient-based index was considered for lighting, and the Tenenbaum gradient was finally chosen [
31].
2.1. Image Acquisition with a Mixed Color Source
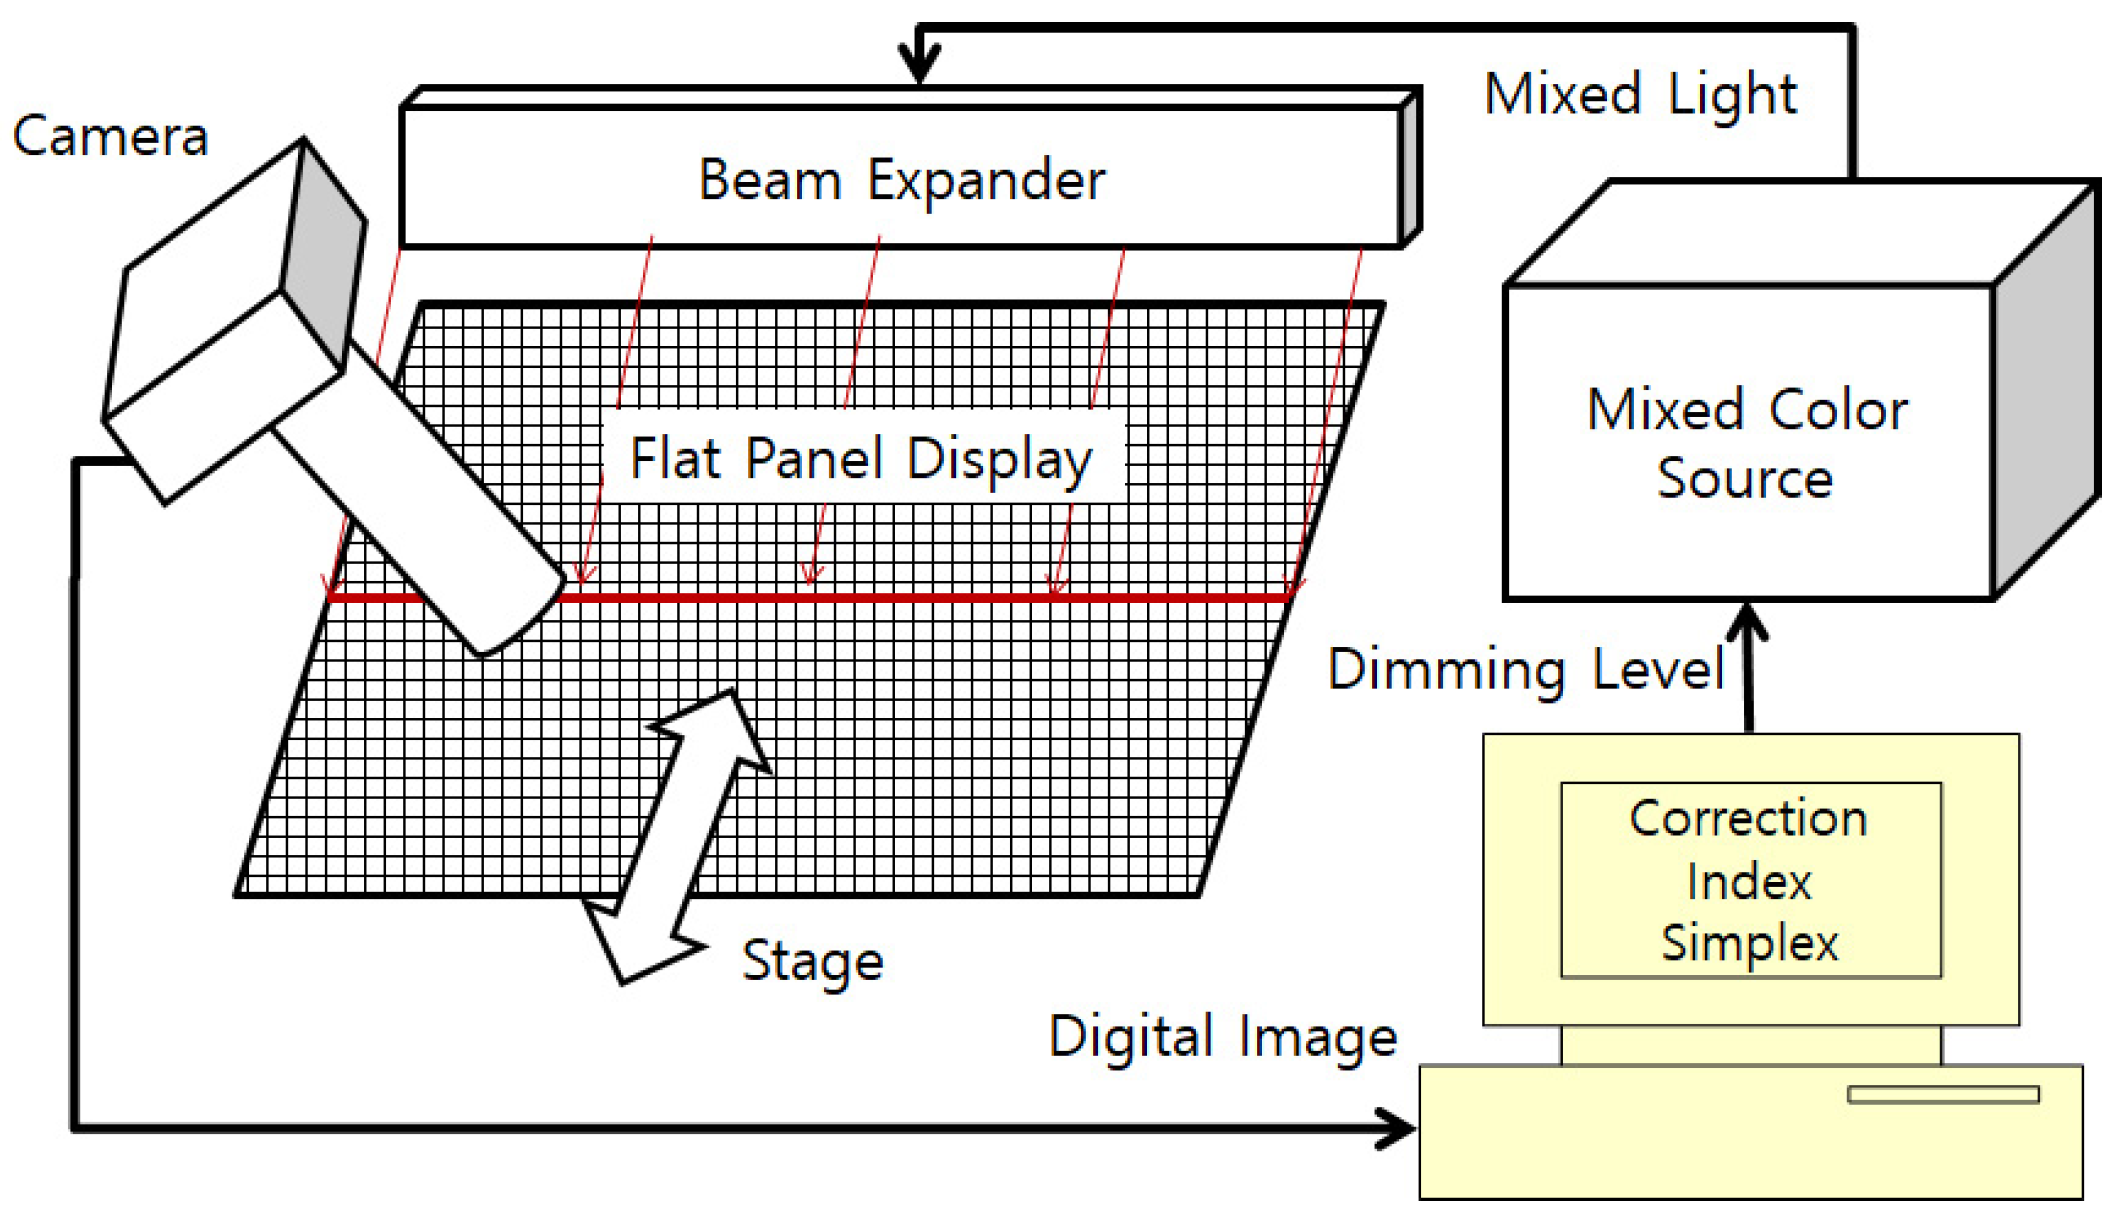
Images of FPDs are typically acquired using a line scan camera. The line scan camera has a linear CCD array with pixel sizes ranging from 2000 to 64,000. An optical assembly with a long main scope tube is attached to the front of the camera. The FOV of the optical assembly is much larger than that of conventional area cameras. FPDs are placed on a stage and translated in a vertical direction along the pixel array to obtain a scanning image. A line light is generated in the FOV of the line camera, and the light and the linear camera are aligned by adjusting the optical components. The image focus is also determined by adjusting the optical assembly. The line image can be acquired after the setup. It is transferred to a frame-grabber, and subsequently stored in computer memory. As these images accumulate in the memory during scanning, a large and continuous image of the FPD is constructed. The automatic color lighting algorithm performs image correction, index calculation and simplex searching. After the dimming level is determined, the mixed color source drives color light emitting diodes (LEDs) whose intensities are proportional to the dimming level.
The light from the color LEDs is integrated into a mixed color light using optical components, and the mixed light is transferred outward using an optical fiber [
30]. The optical fiber is connected to a beam expander and generates a linear light in the FOV. This procedure from image acquisition to the generation of a linear light source forms a feedback loop.
Figure 1 shows a conceptual diagram of an AOI system for the case of a mixed color source, and the feedback loop is established using the scanning image and mixed light generation.
2.2. Image Correction
Non-uniform illumination was also caused in the AOI system and image correction was required.
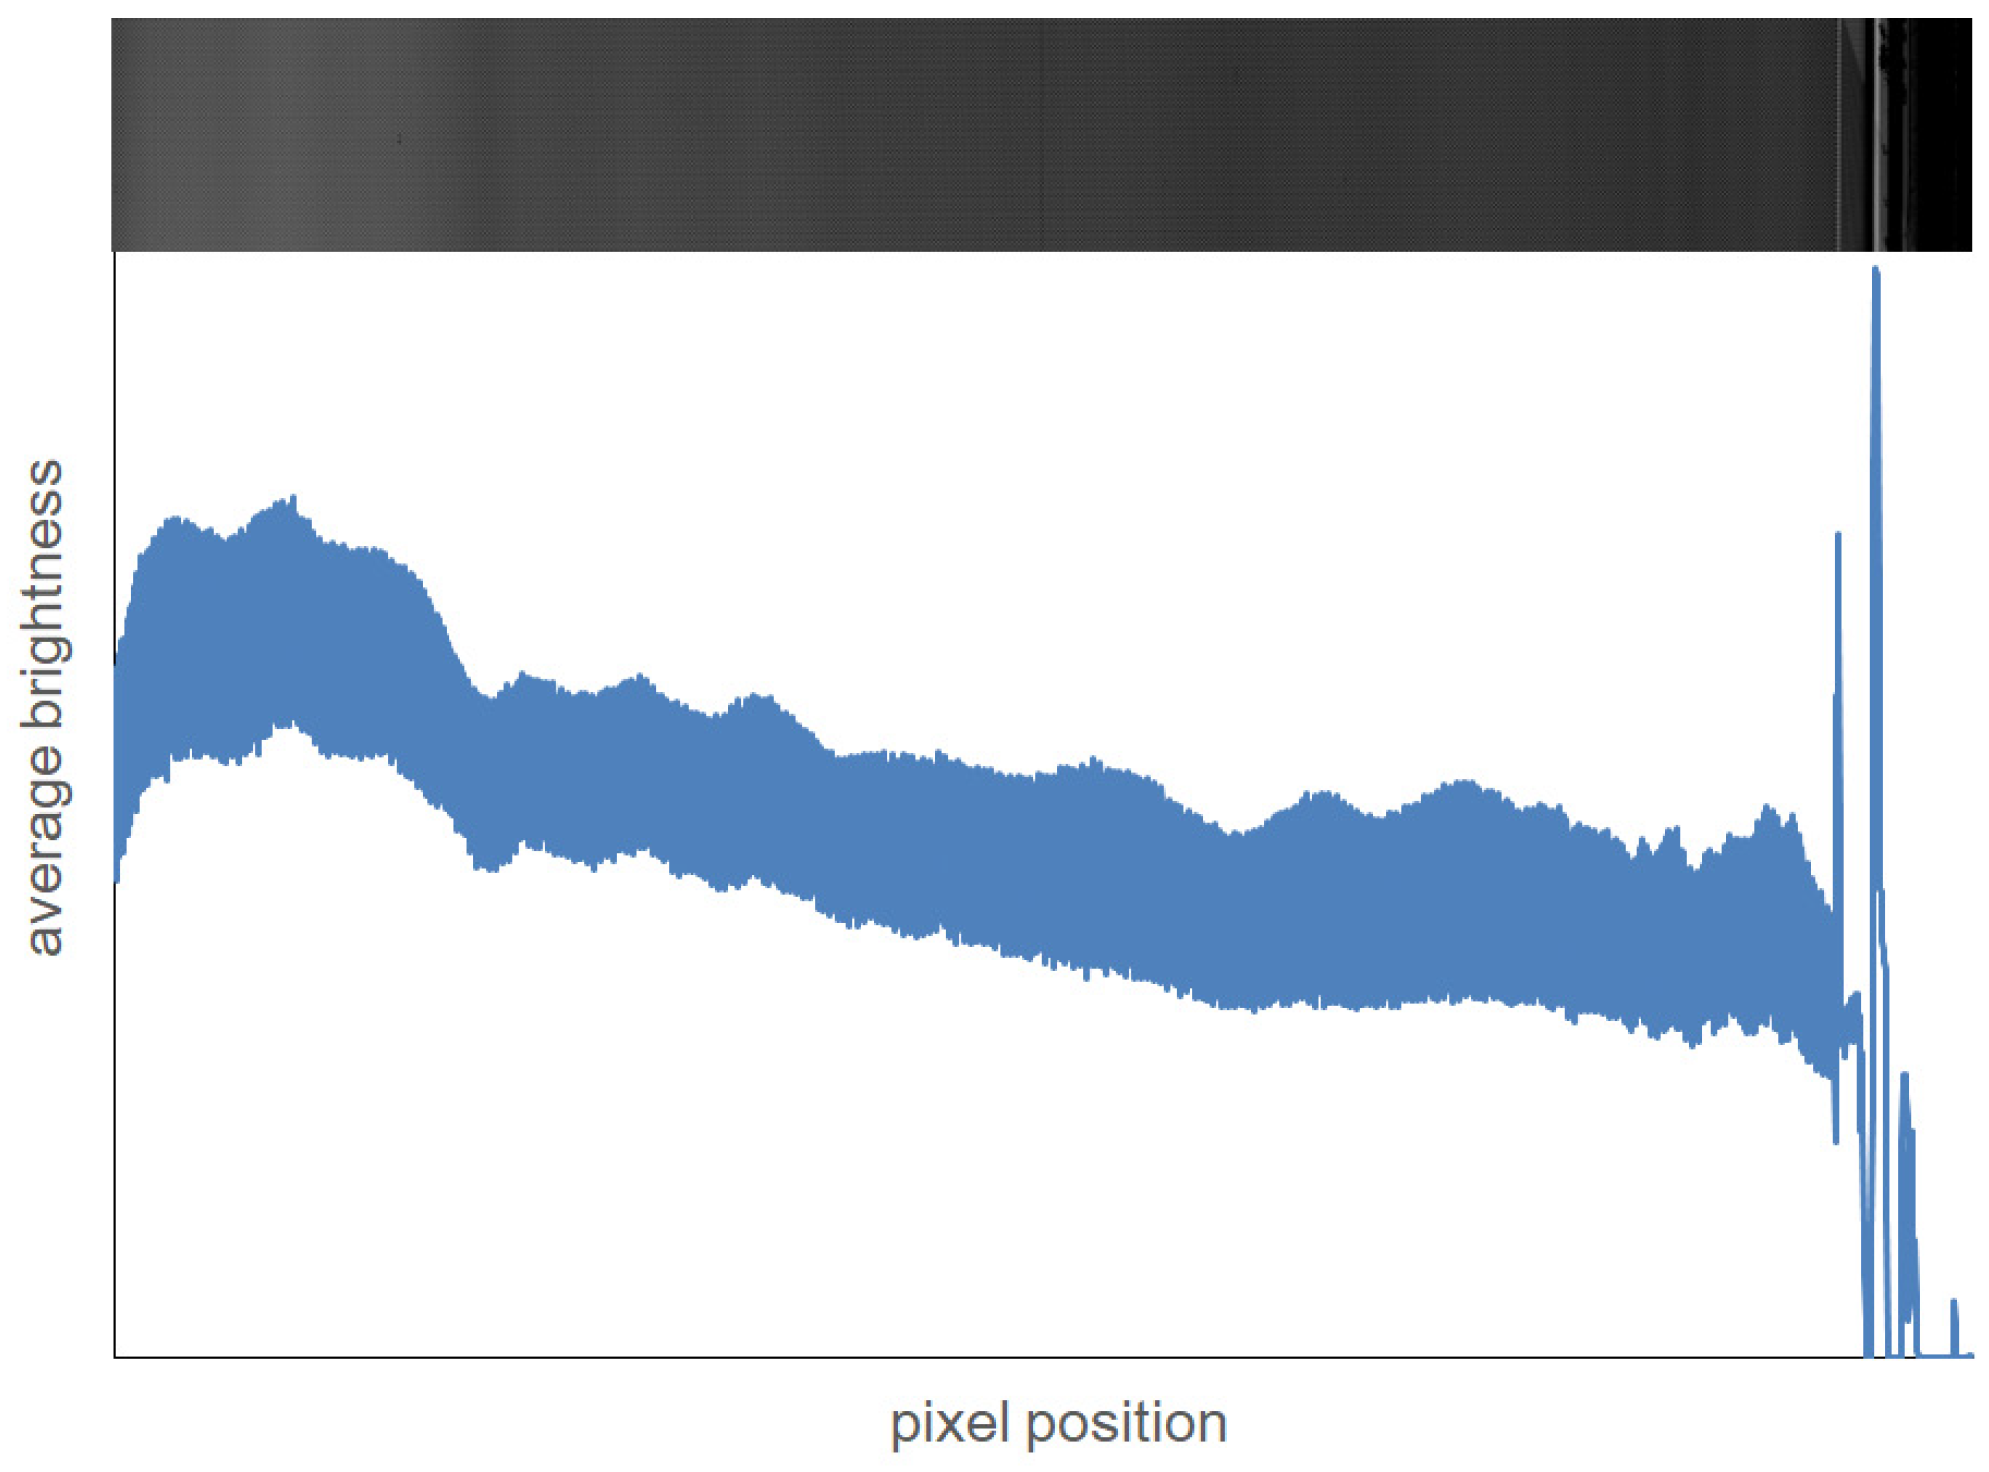
Figure 2 shows a raw image of an AMOLED panel after scanning. The raw image contains SPR patterns in the AMOLED panel, and brightness is varied along the horizontal pixel position. The average brightness of a horizontal pixel can be written as follows.
where
I is the grey level of a pixel,
is the pixel coordinate in an image, and
N is the vertical pixel number of the image.
Figure 2 also shows the variation of the average brightness. Because the image is filled with SPR patterns, the variation must be small. However, the chart shows that there is a brightness variation, and hence, it must be corrected. The reference value for the correction is the brightness of an entire image, which can be obtained by averaging the grey levels as follows:
where
M is the horizontal pixel number of the image.
The correction coefficient of the horizontal position,
, is given by the ratio of the brightness of the entire image to that of a horizontal position as follows:
The correction coefficient is applied to grey levels over the entire image, and then a corrected image,
, can be achieved such that.
This image correction is typically conducted using a reference sheet. However, the images were corrected after each scan in this study because the images mostly consisted of SPR patterns and the IQI is evaluated using no-reference model.
2.3. Image Index
The Tenenbaum gradient is obtained by using the convolution of the horizontal and vertical Sobel operators. The Sobel operator is a popular computational tool used in machine vision, which is defined as follows:
The Tenenbaum gradient can be calculated from the square sum after the horizontal and vertical Sobel operation, as shown below:
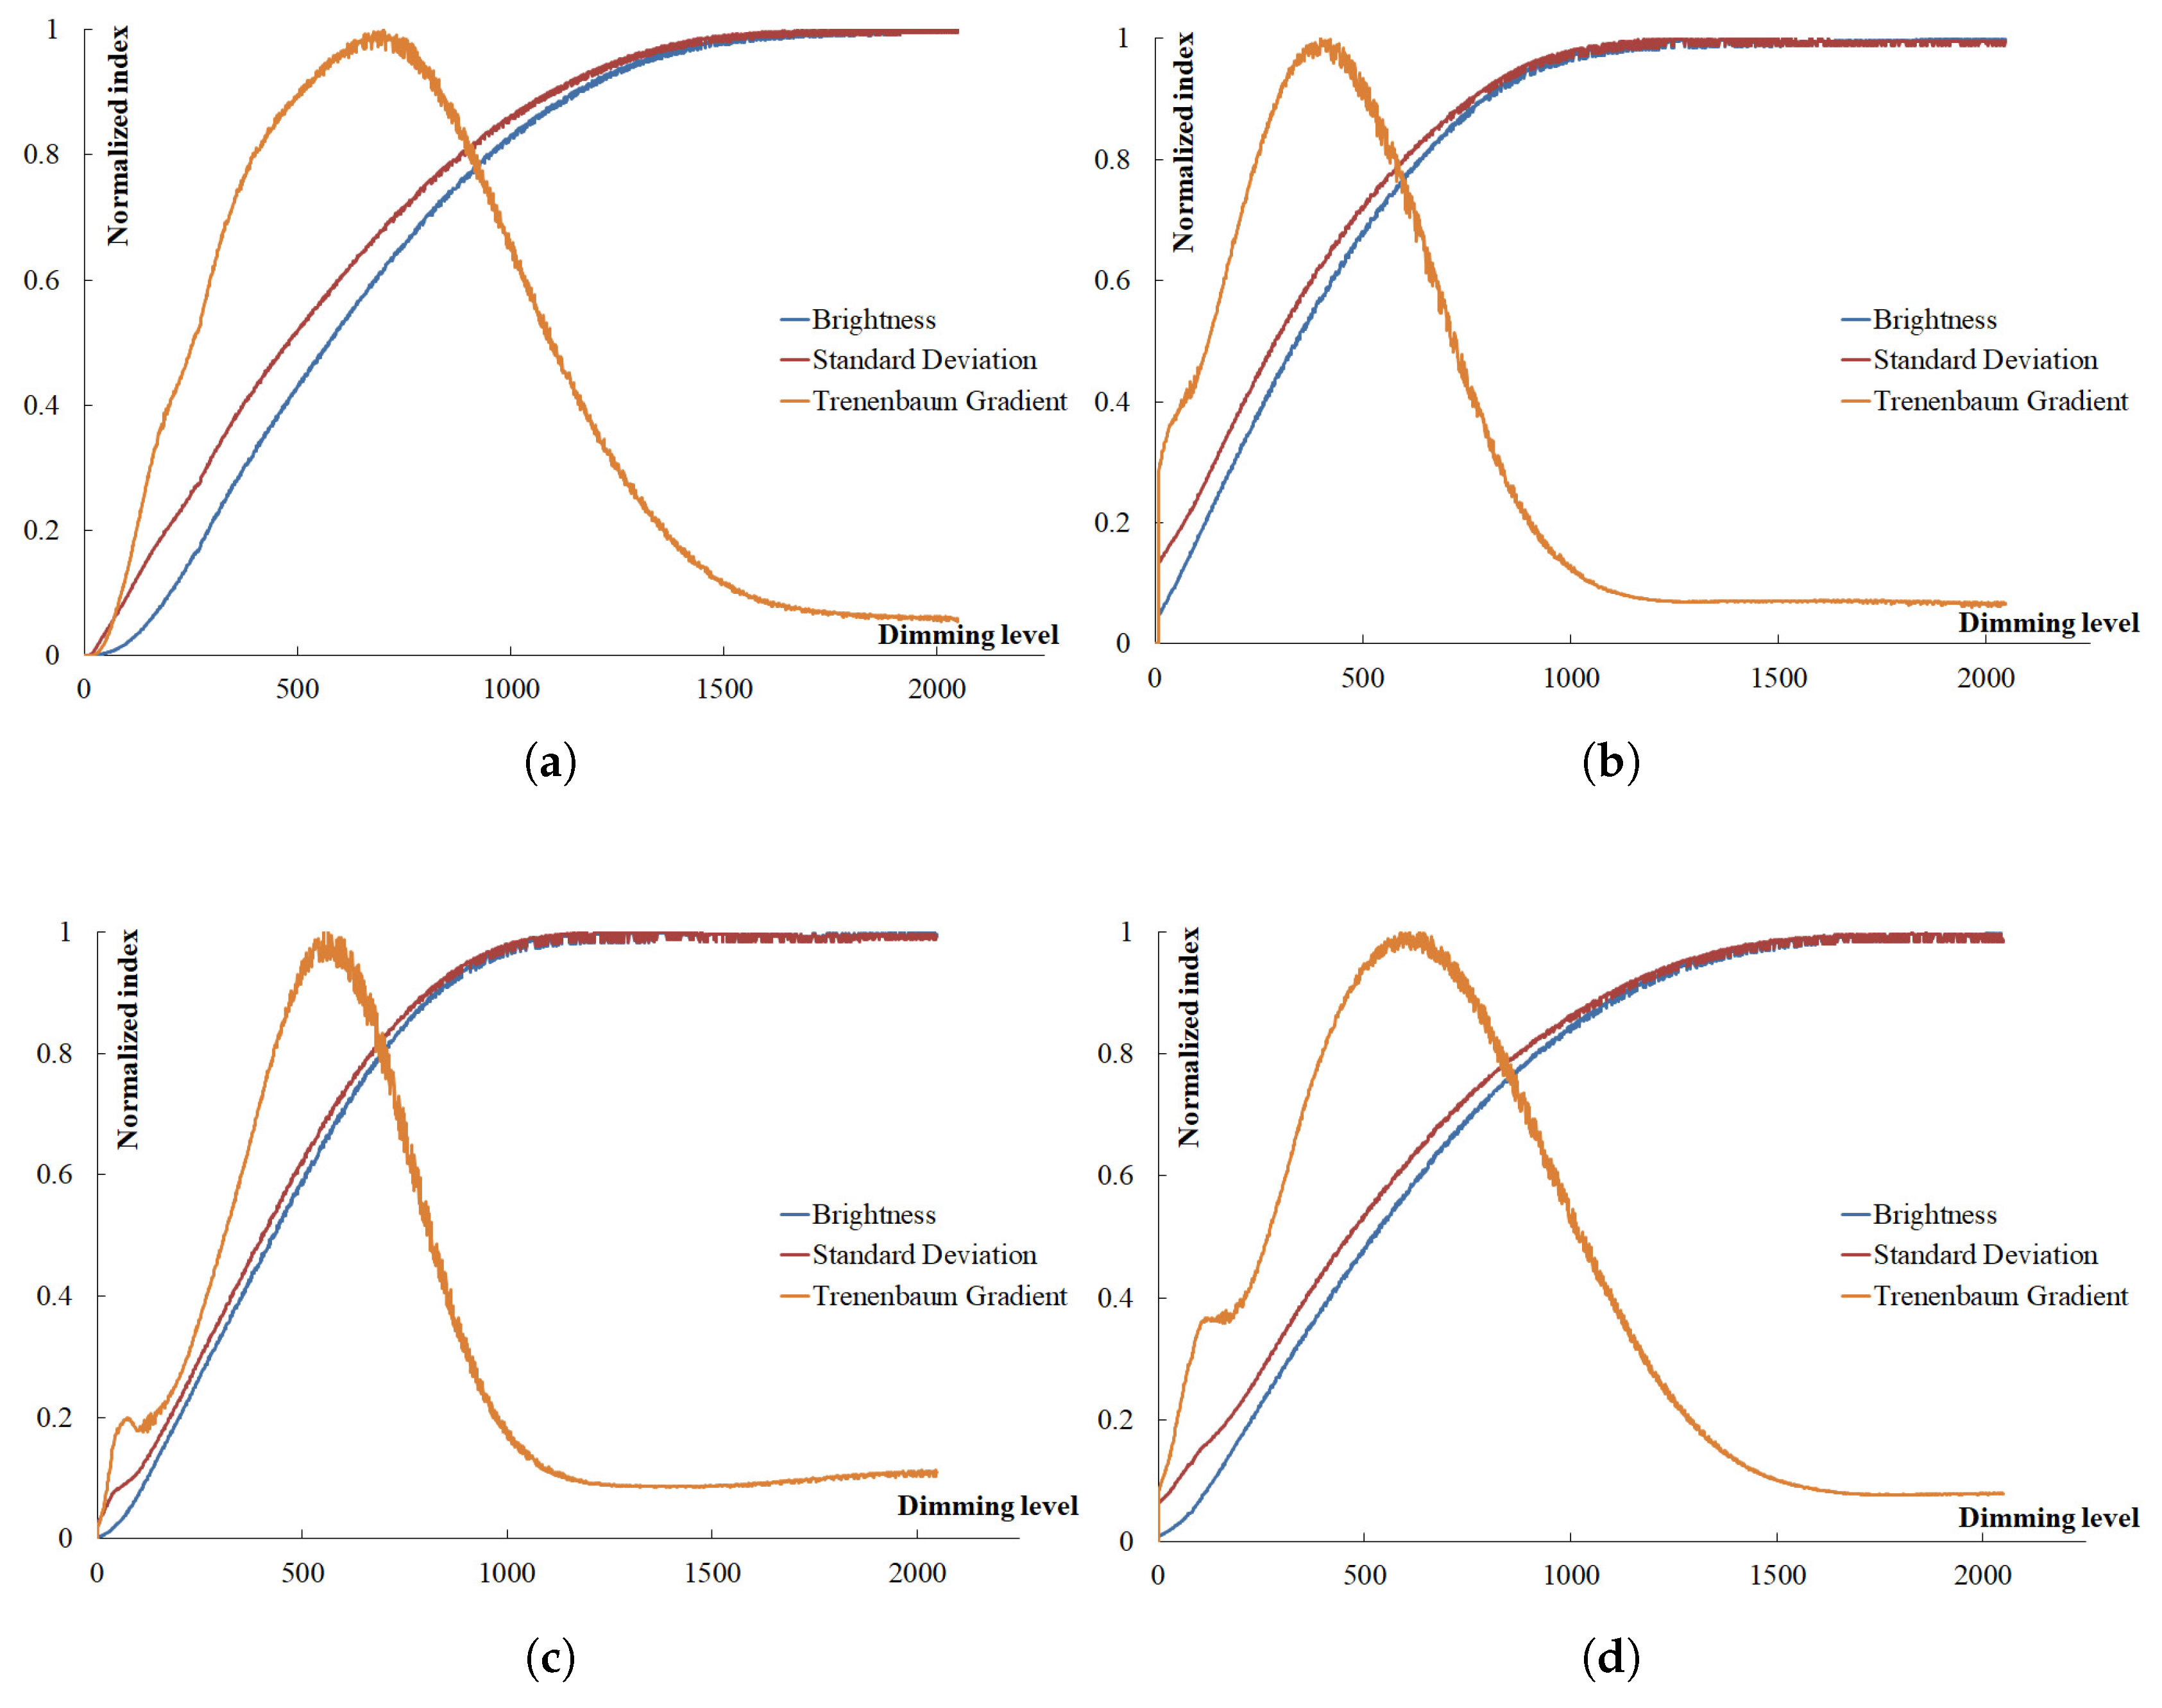
The brightness, standard deviation, and Tenenbaum gradient were evaluated when the dimming level of single color light was increased, as shown in
Figure 3. The dimming levels at maxima were different but the curve shapes were similar. The brightness is average grey level of an image. Thus, the brightness was increased according to dimming level. The brightness was saturated in high light intensity. The sharpness of the standard deviation was available in other studies for semiconductor patterns, but was saturated in case of the SPR patterns on FPDs. However, the Tenenbaum gradient has a peak so, therefore, it is used as an image index. The dimming level of a multiple color source will have an L-sized vector P given by
Then, the relation between the dimming level and the Tenenbaum gradient can be described with an arbitrary function as follows:
3. Maximizing Image Quality
SSM is a multi-dimensional and non-derivative optimization method. It shows good convergence for non-linear, non-smooth, and complex problems [
32]. SSM can also be applied to automatic color lighting for semiconductors [
16] and for color control of a mixed color source [
33]. The approach constructs a simplex using L+1 test points in the case of L dimming levels. A mixed color source in this study has four LEDs for RGBW colors. As such, the simplex has five probe points. The Tenenbaum gradients,
∼
, are obtained using the
p values.
The probe points are sorted according to a descending order of the
values, then assigned into
∼
. The best point will be
, and the worst point
. If the probe points are connected, a multi-dimensional shape with triangular faces can be constructed. The initial dimming level,
, was applied to the probe points as
,
,
,
and
. The centroid of the simplex can be defined by averaging as follows.
A reflection point,
, is defined outside the simplex on an extension line between the worst point and the centroid, and is given as
If the reflection point is better than the best point, then an expansion point,
, is defined outside the expansion point as:
If the reflection point is worse than the best point, then a contraction point is defined inside the simplex on the midline as:
If the contraction point is still worse than the simplex, then the contraction point is condensed towards the best point and is given as:
These deformations of the simplex are iterated until it becomes less than a sufficiently small value. This is the terminal condition, which can be expressed as:
The size of a simplex,
, is obtained by adding the distance between the centroid and the probe points as:
Computational complexity of the proposed method is affected by image size and the probing points of the SSM, such as .
4. Experiment and Results
A scanning stage was constructed to translate an AMOLED panel. A line scan camera and a mixed color source were installed to obtain scanning images. Optimal light color and intensity was determined using the SSM. The cost function of the SSM was the Tenenbaum gradient, one of the image indices. Iterations of the SSM and images in optimal light conditions were discussed in the result.
4.1. Experiment
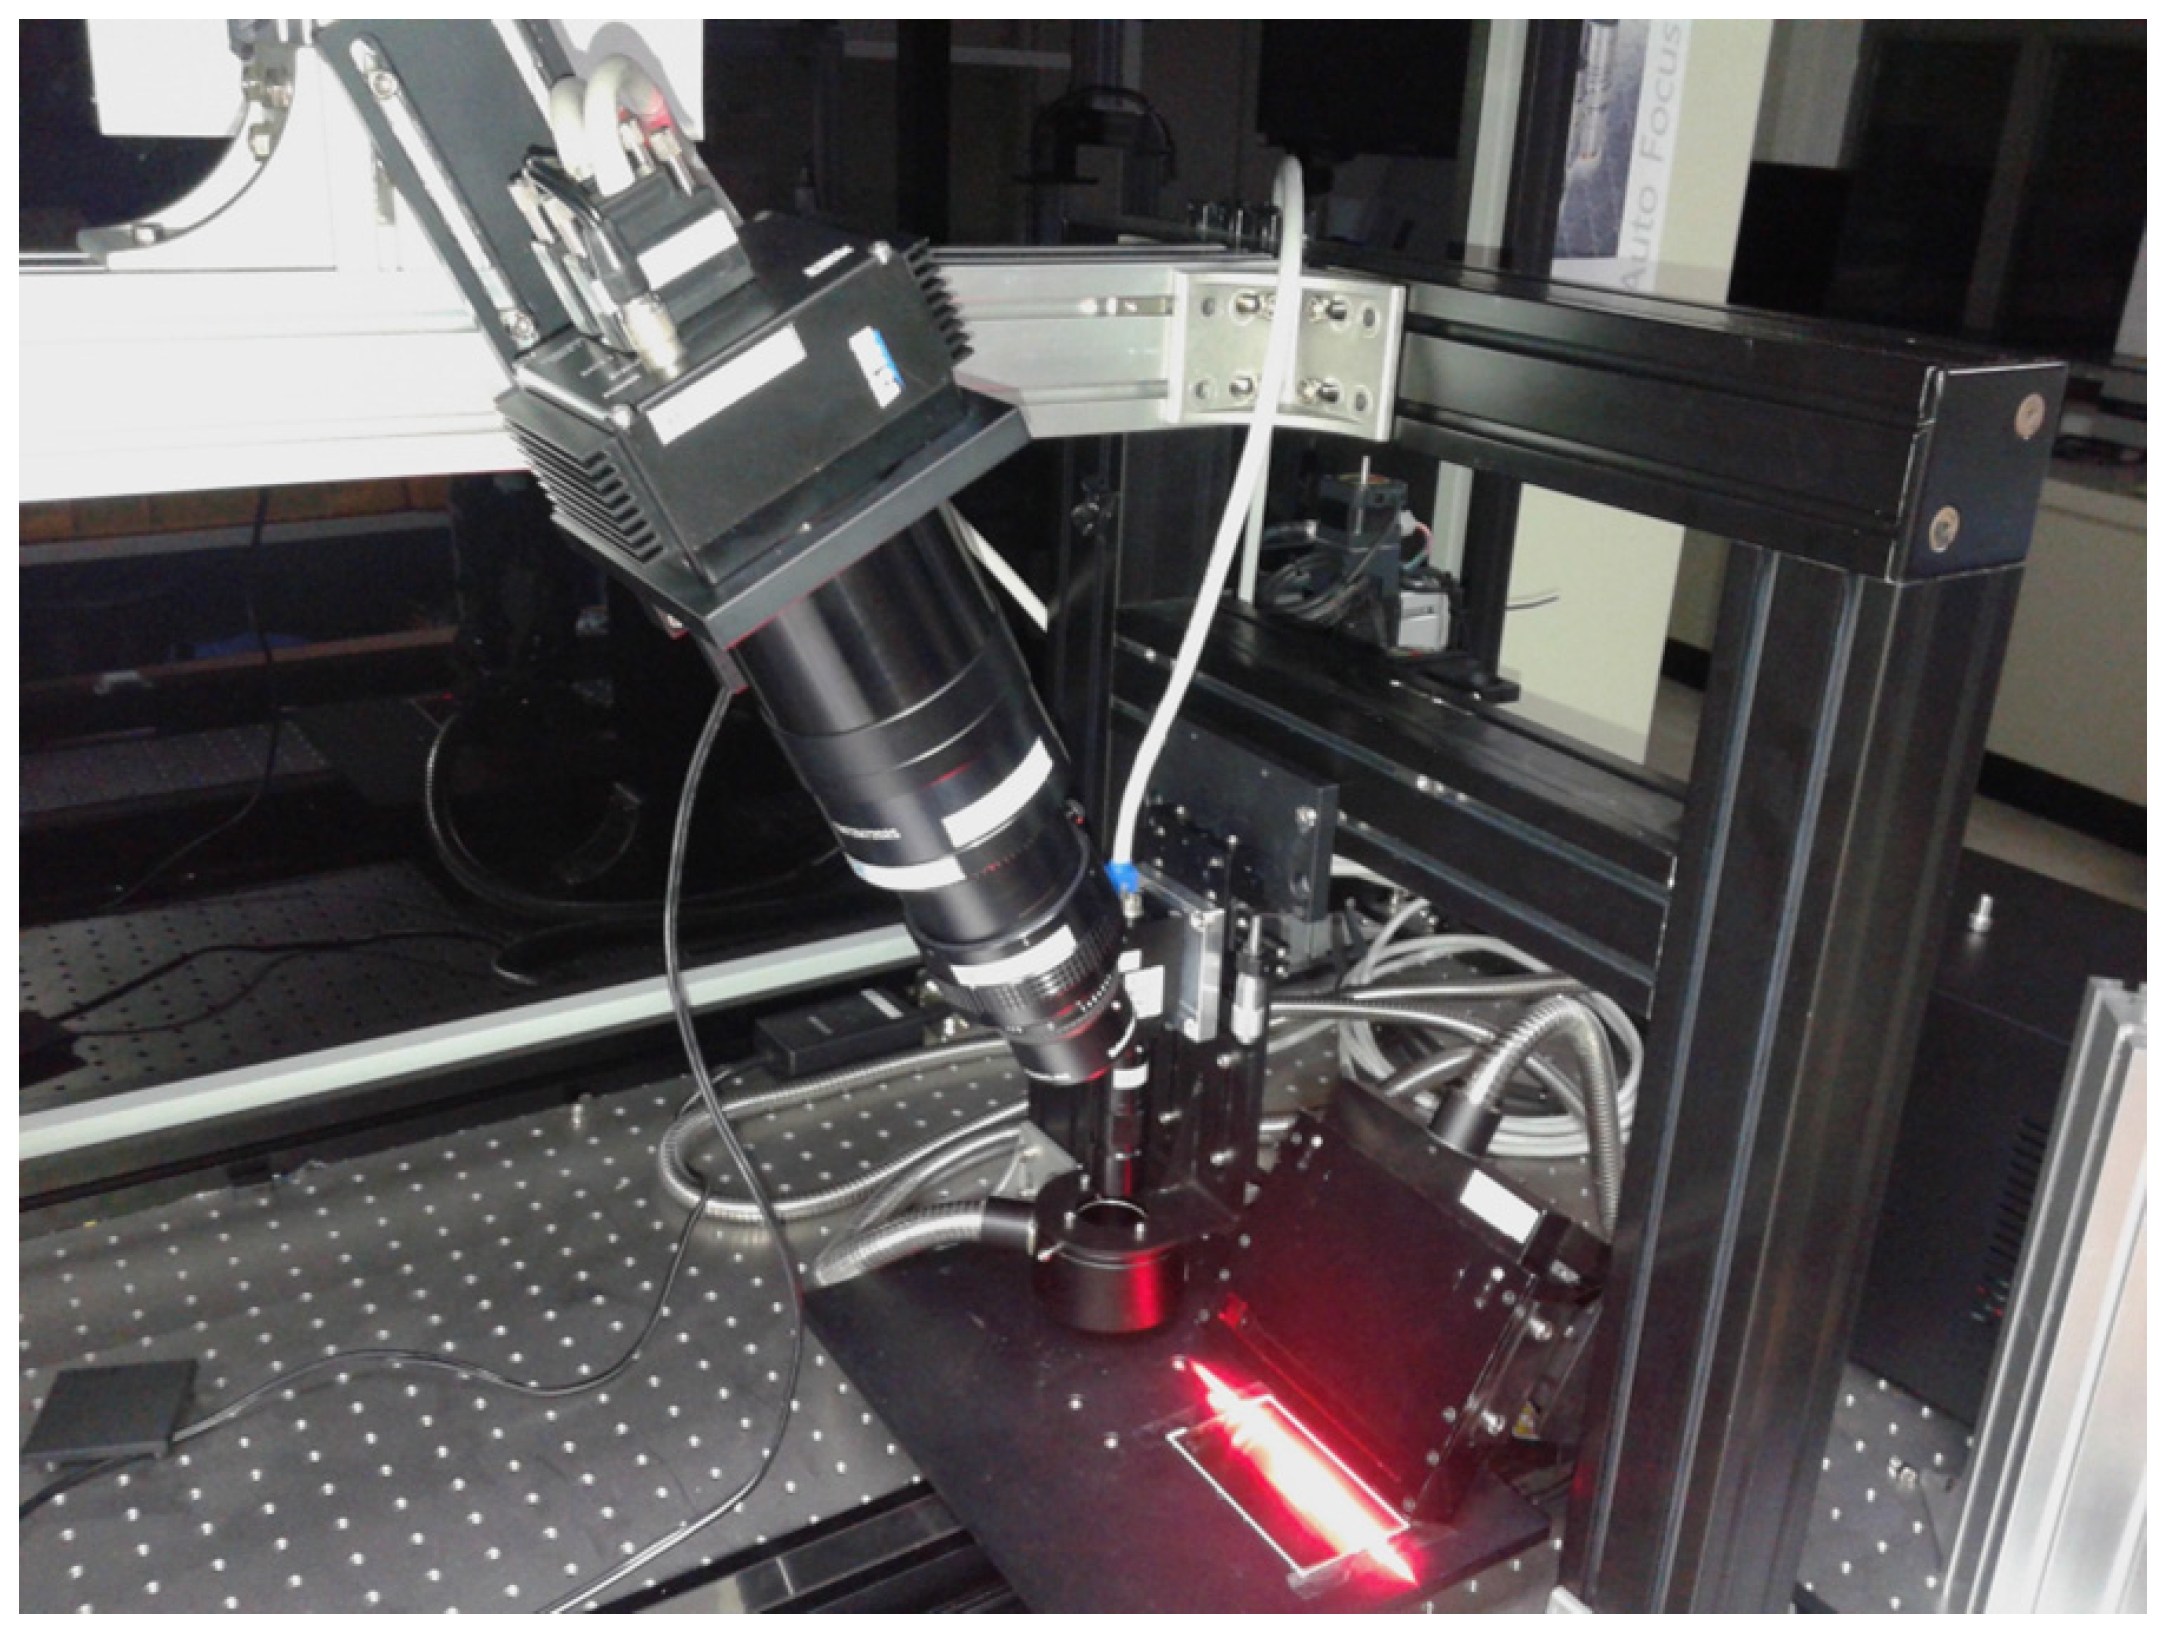
A scanning stage was installed on an optical table that was isolated from floor vibrations. The scanning stage was composed of a motor, a linear encoder, a ball screw, linear guides, and an upper plate. The motor rotated the ball screw according to the control signal. The linear guides facilitated translation in the scanning direction using the pitch of the ball screw. The upper plate was fixed onto the linear guides; an FPD sample that is attached to this upper plate was translated in the scanning direction. The motor was connected to a driver that was interfaced to a motion controller on the peripheral component interconnect express (PCIe) slot of a PC. A zoom lens and a main scope tube were joined and attached to the front of a line scan camera. A beam expander was connected to the light source using an optical fiber from a mixed color source. The camera and the beam expander were placed above the FPD sample, and the angles of these two components was tilted to minimize the non-uniformity in the images.
The line camera was connected to the CAMERALINK port of the frame-grabber that interfaces with the PCIe 4x slot of the PC. The mixed color source was linked to the PC through an RS-232 port.
Figure 4 shows the construction of the experimental apparatus on an optical table, and
Table 1 lists the system’s specifications. The parameters of the SSM are listed in
Table 2. The initial size of the simplex and the convergence constant were varied to take the effect of the SSM parameters into consideration and to determine the best combination of these parameters. The performance of the SSM was investigated with respect to its influence on the number of iterations and the value of the Tenenbaum gradients after each iteration.
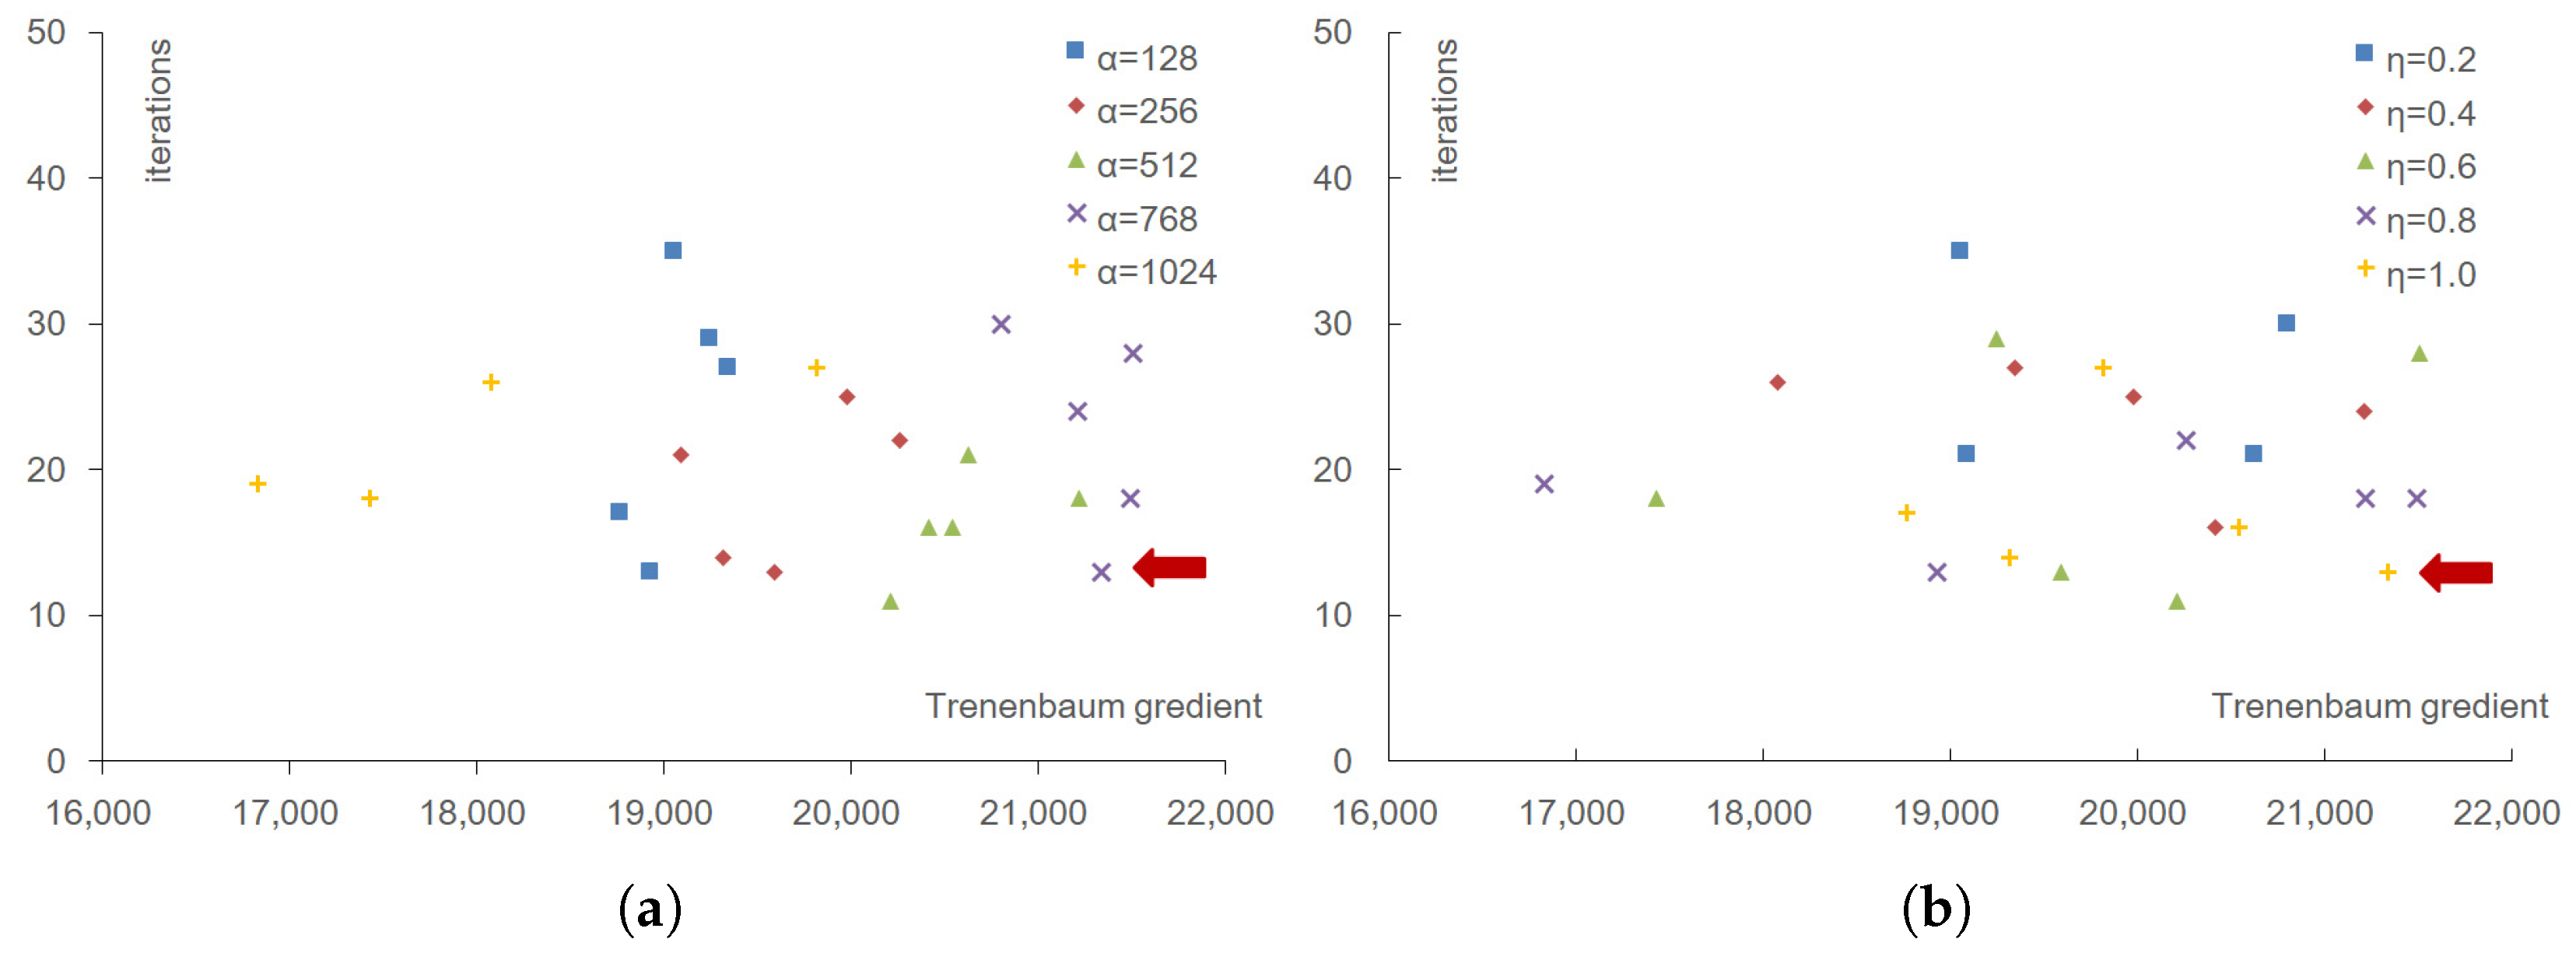
4.2. Results and Discussion
The SSM showed convergence for all parameter variations. The Tenenbaum gradient determined by equal search was 21,550, but some results for the SSM revealed values that were much lower than that of the case of equal search. A Tenenbaum gradient above 20,000 can be obtained by applying the initial simplex size,
. The convergence constant,
, is less affected by the Tenenbaum gradient than
; however, it is highly affected by the number of iterations. To determine the simplex parameters, the amplitude of the Tenenbaum gradient is the most important factor, but the number of iterations might also be taken into account in regard to the processing time.
Figure 5 shows the relationship between the Tenenbaum gradient and the number of iterations considering initial simplex size and convergence constant. As initial simplex size increased in small ranges, the Tenenbaum gradient became higher at termination. However, the Tenenbaum gradient was degraded above middle ranges. The high convergence constant approximately showed small iterations. These trends shown in
Figure 5 indicate that
and
have significant effects on the Tenenbaum gradient for image quality. A high Tenenbaum gradient is desirable and small iterations are preferred. Thus, parameters from the bottom right corner were selected for the best combinations.
The best parameter combinations are indicated by a red arrow in
Figure 5, and were selected as
and
. In this case, the Tenenbaum gradient was 21,342, and the number of iterations was 13. These values show that 99% of the Tenenbaum gradient can be obtained when the processing time is reduced by 56% compared with the case where the Tenenbaum gradient has its highest value (
> 20,000).
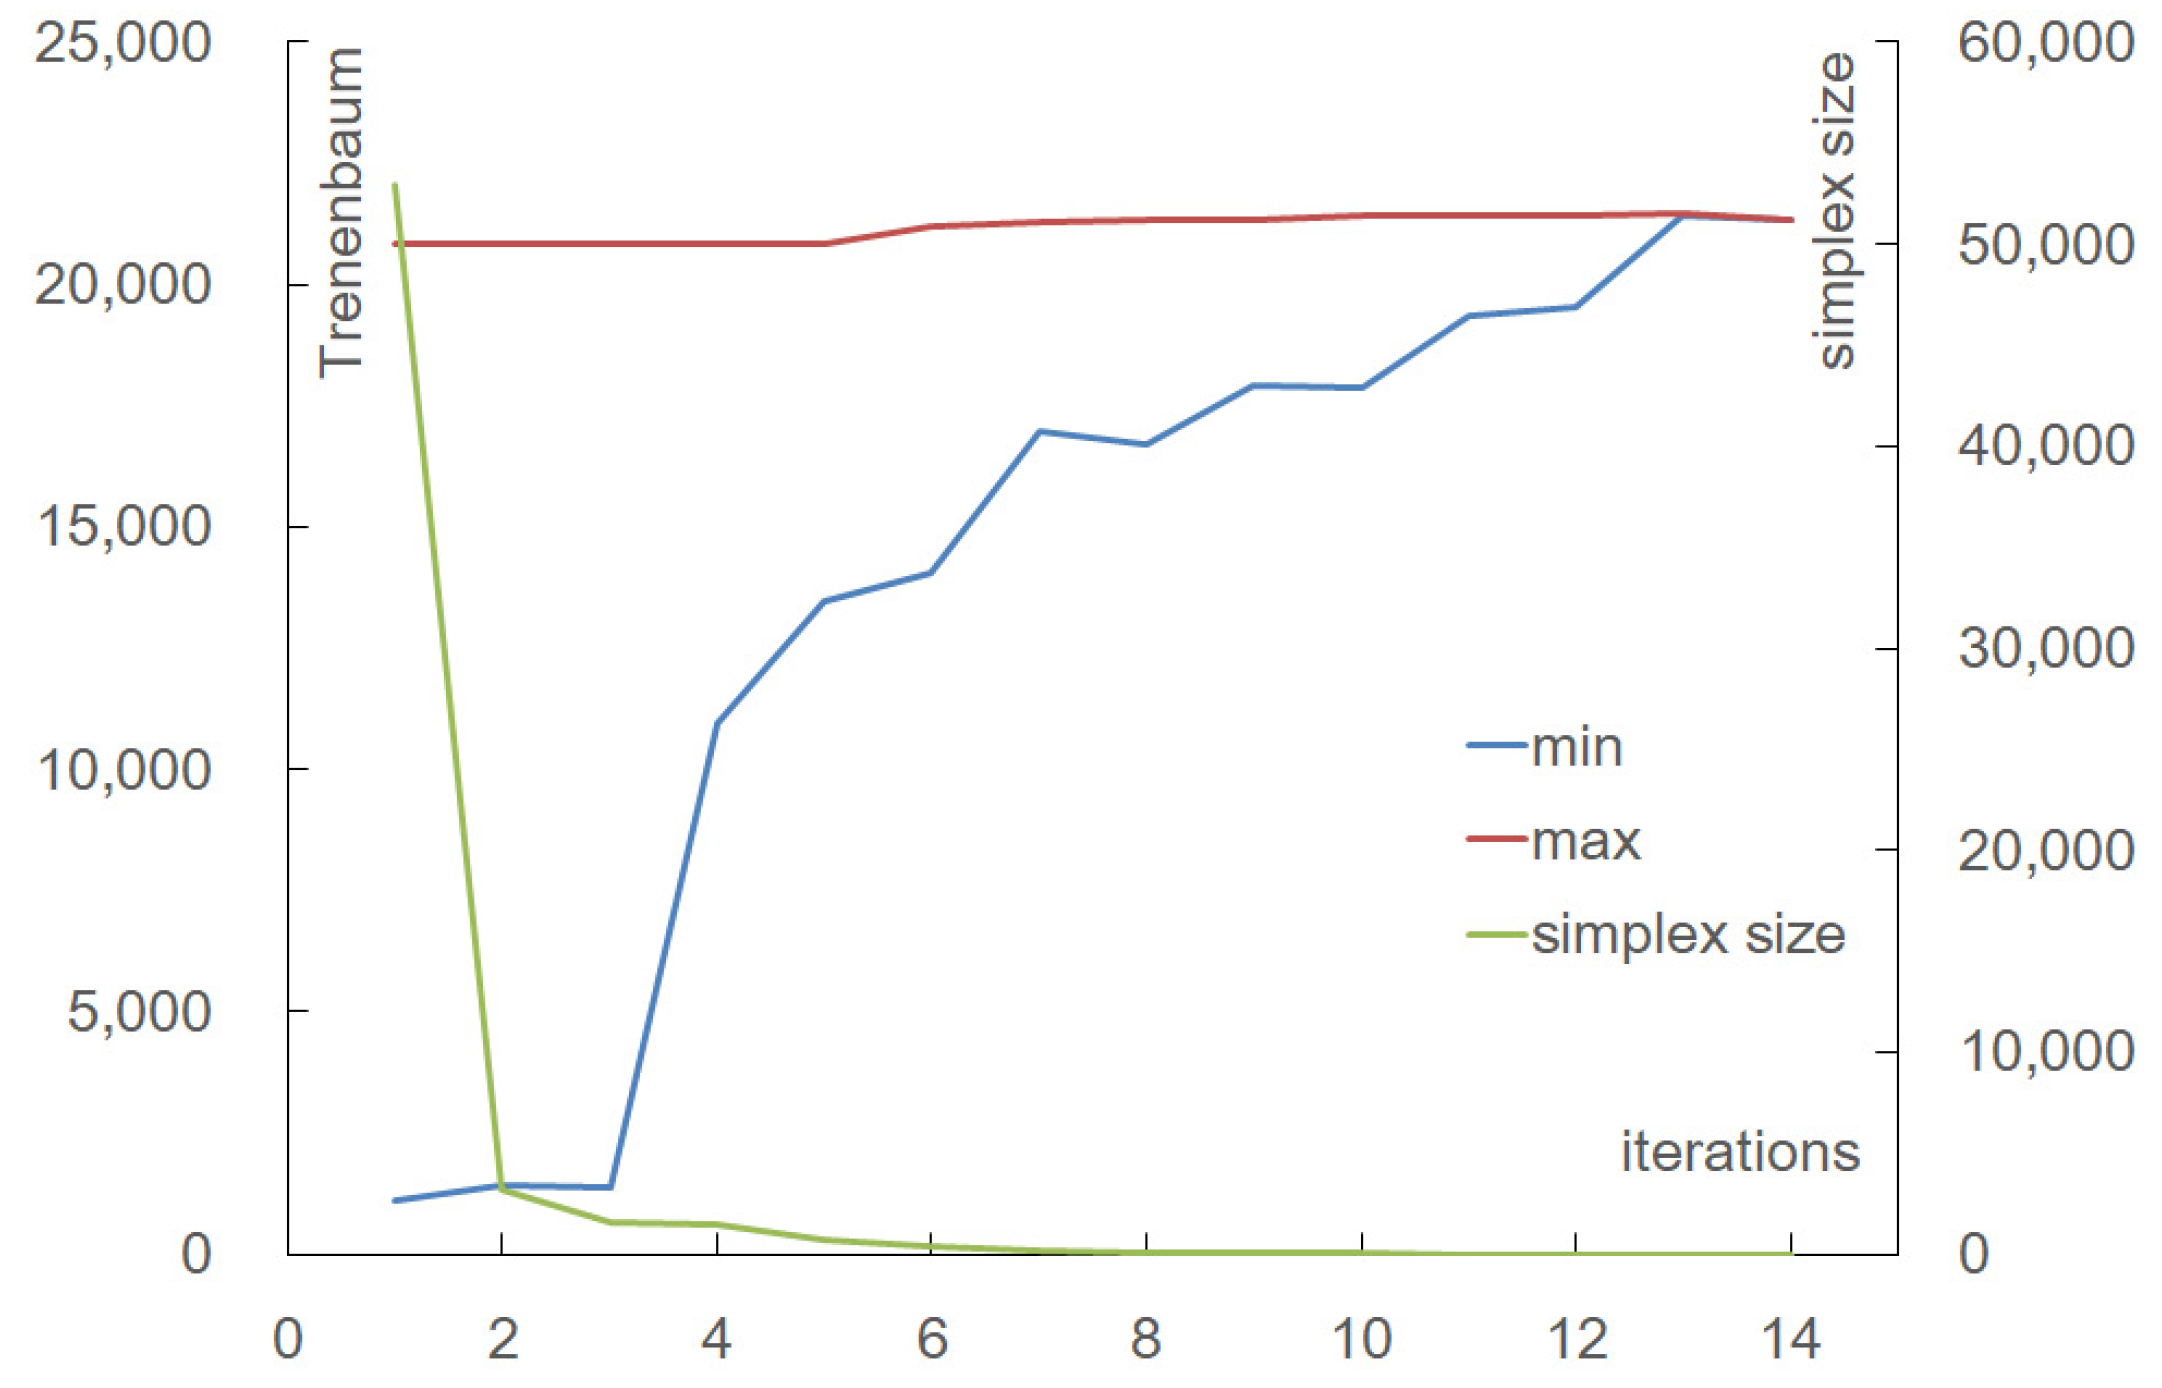
Figure 6 shows the convergence of the SSM by investigating the variation of the Tenenbaum gradient and simplex size for the best case. The minimum and maximum Tenenbaum gradients converged to one value, and their difference was reduced to zero. The simplex size,
, was largest for the initial iteration, but subsequently decreased to zero at the end of the iteration. This indicates convergence of the SSM.
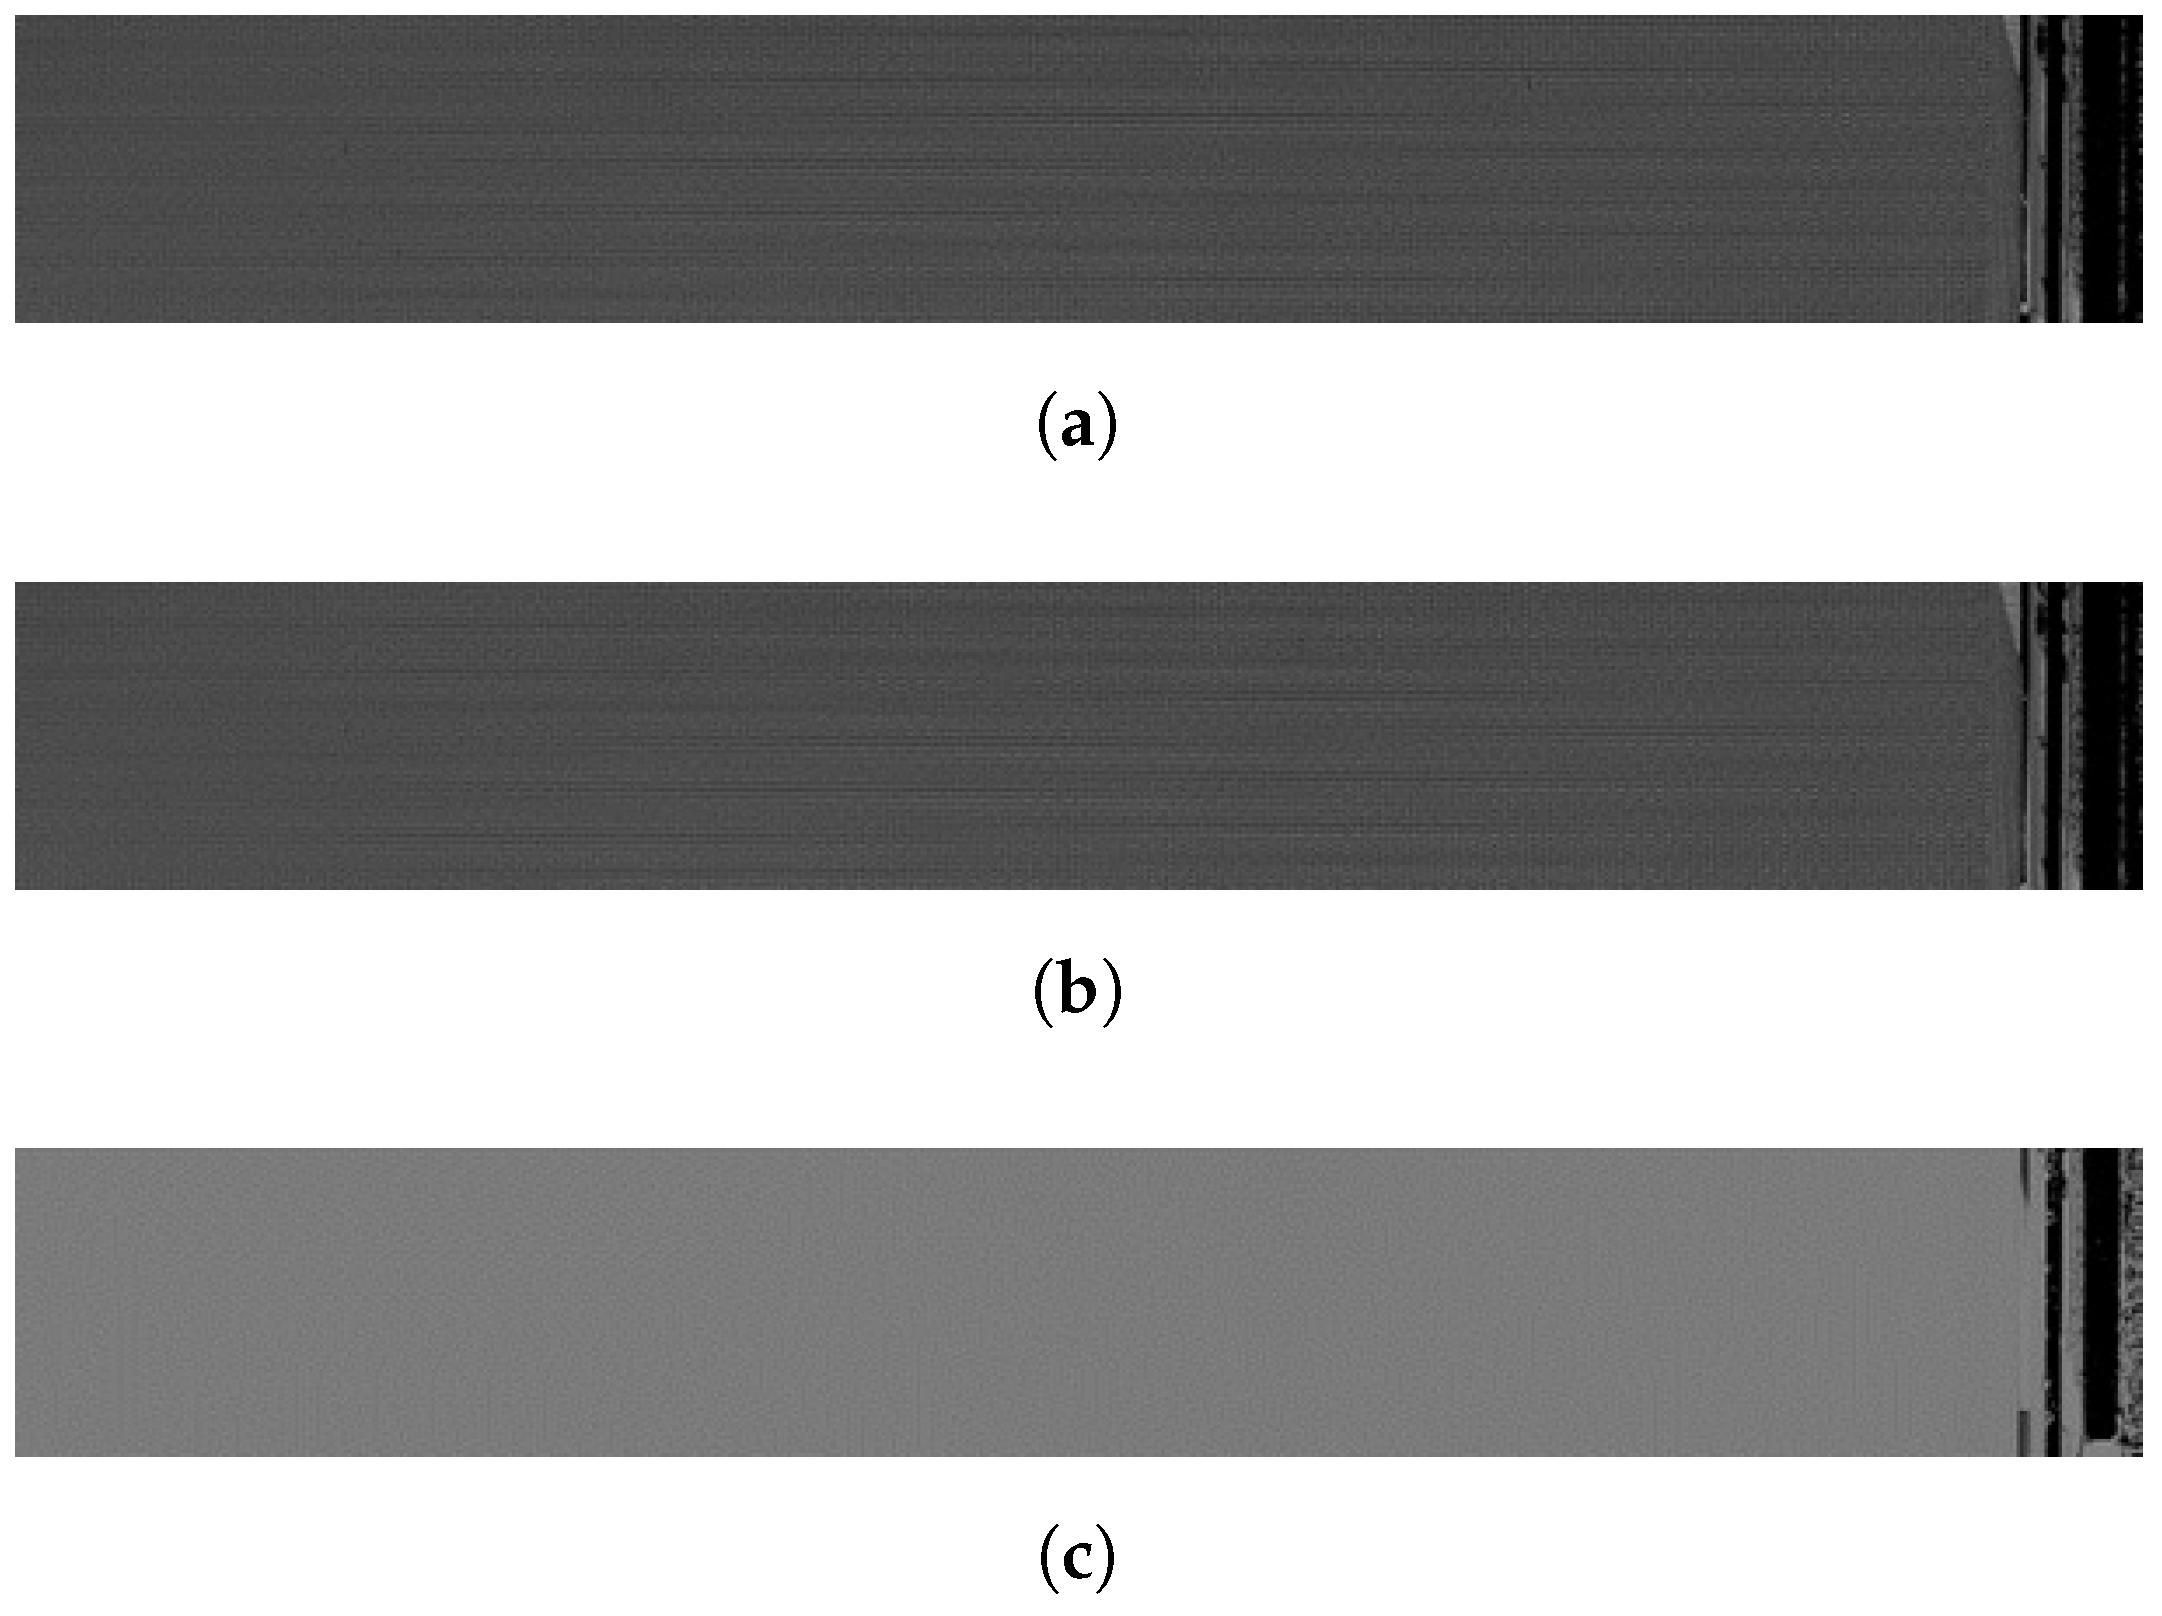
Figure 7 shows the scanning images of an AMOLED panel for the optimal parameters of the SSM with the Tenenbaum gradient, via equal search with the Tenenbaum gradient and the variance after correction. The optimized images based on the Tenenbaum gradient in
Figure 7a,b show similar brightness and clarity of internal patterns. However, the image optimized using the variance in
Figure 7c appears too bright and coarse compared with that in
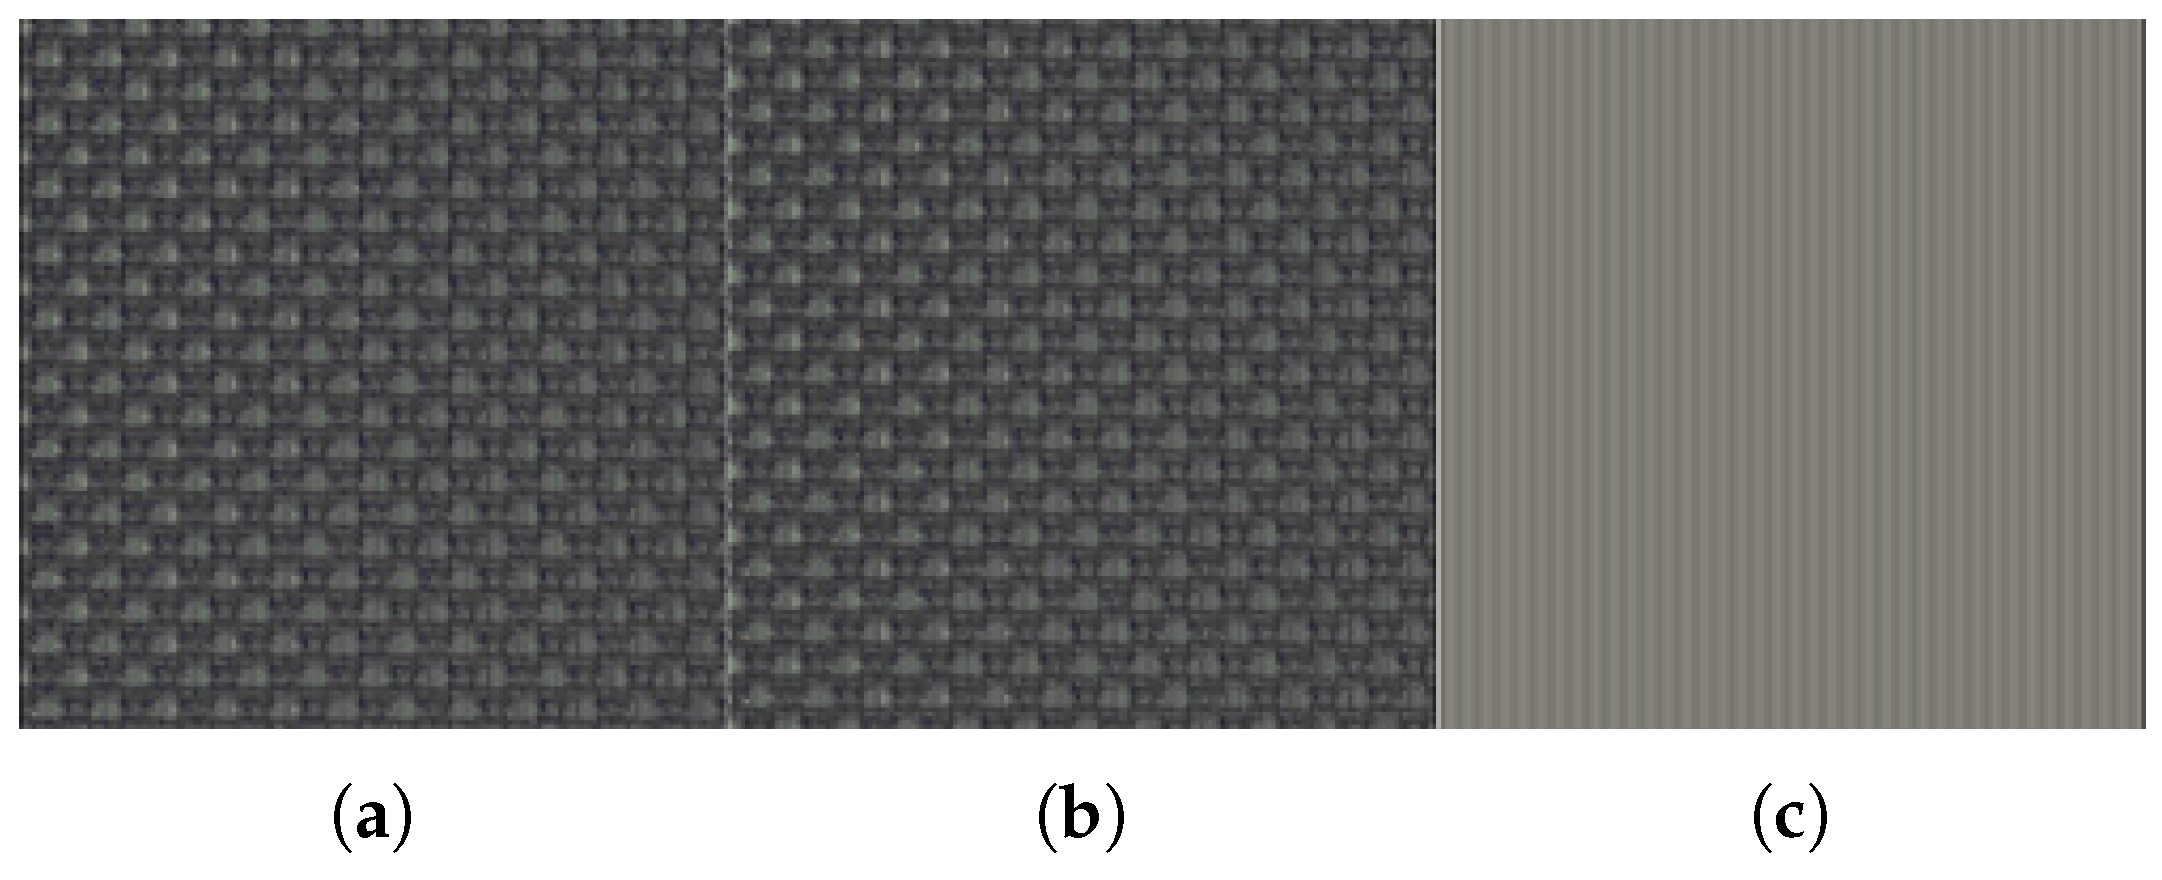
Figure 7a,b. The results in
Figure 8 show the SPR patterns for the images in
Figure 7, which were obtained by magnifying the top-left regions of
Figure 7. The SPR pattern images optimized by the Tenenbaum gradient are clear and distinct, but those optimized using the variance were saturated.
The SPR patterns, as well as the large patterns at the edge of the panel, were clearly visible. The brightness among the SPR patterns also appears to be uniform. The number of scans for equal search is 20484, which indicates an enormous amount of processing time and is therefore inapplicable to automatic color lighting. The number of scans used in this investigation was between 13 × 5 = 65 and 45 × 5 = 225. Compass search, a stable and non-differential method, was tested to compare performance. The compass search also provided useful values and the test was performed under tuning conditions. The number of iterations was 31 and the cost function was calculated nine times for one iteration, in the best case. Therefore, the proposed SSM can greatly reduce the number of iterations needed to obtain useful values of the Tenenbaum gradient, which were determined by the equal step search. The speed is also faster than for the compass search. This indicates that automatic color lighting can be achieved in practical inspection systems using the proposed algorithm.


