Abstract
Modern agriculture is facing unique challenges in building a sustainable future for food production, in which the reliable detection of plantation threats is of critical importance. The breadth of existing information sources, and their equivalent sensors, can provide a wealth of data which, to be useful, must be transformed into actionable knowledge. Approaches based on Information Communication Technologies (ICT) have been shown to be able to help farmers and related stakeholders make decisions on problems by examining large volumes of data while assessing multiple criteria. In this paper, we address the automated identification (and count the instances) of the major threat of olive trees and their fruit, the Bactrocera Oleae (a.k.a. Dacus) based on images of the commonly used McPhail trap’s contents. Accordingly, we introduce the “Dacus Image Recognition Toolkit” (DIRT), a collection of publicly available data, programming code samples and web-services focused at supporting research aiming at the management the Dacus as well as extensive experimentation on the capability of the proposed dataset in identifying Dacuses using Deep Learning methods. Experimental results indicated performance accuracy (mAP) of 91.52% in identifying Dacuses in trap images featuring various pests. Moreover, the results also indicated a trade-off between image attributes affecting detail, file size and complexity of approaches and mAP performance that can be selectively used to better tackle the needs of each usage scenario.
1. Introduction
Modern agriculture is facing unique challenges in building a sustainable future [1,2] in a way that empowers the agricultural sector to meet the world’s food needs. Reliable detection of plantation’s threats by pests/diseases as well as proper quantification of induced damages are of critical importance [3,4]. Moreover, early detection of these phenomena is crucial for managing and reducing their spread, maintaining production’s quality and quantity as well as reducing costs, trade disruptions and sometimes even mitigate human health risks.
Pest and disease detection is done on information aggregated from various sources such as plant examination, arrays of plantation sensors, diagnostic images of plants, weather stations, etc. [5,6]. Such wealth of information, to be useful in transforming raw data to actionable knowledge, requires advanced Information Communication Technologies (ICT) approaches that will help farmers, and related stakeholders, make decisions on problems requiring large volumes of data and dependent on multiple criteria [7]. It is thus evident that modern agriculture requires adoption of production processes, technologies and tools derived from scientific advances, results from research and innovation activities in different fields (ICT, agronomic, entomologic, weather analysis, etc.) [8].
As olive trees are the most dominant permanent crop within EU in terms of occupied areas (40% of permanent crop total area [9]) with more than 1500 cultivars [10] just in the Mediterranean, our work focuses on one of its major threats [11], the olive fruit fly (Bactrocera Oleae, Dacus). Measurements of the fly’s infestation in olive groves are predominantly done with manual methods involving traps, while one of the key requirements in verifying an outbreak lies in measuring the pests collected in a trap over a time-span [12]. This process necessitates frequent and time-consuming manual checks similar to no other parameter/requirement of the trap.
Advanced traps, or smart-traps, feature a camera taking pictures of the pests collected by the trap that are then examined by interested parties [13,14,15,16,17]. Based on the images of the pests collected in the traps, stakeholders such as farmers, entomologists, agronomists, etc. can identify and measure the collected pests, customize the frequency of trap’s examination while also minimize the examination time and its associated difficulty.
Motivation and Contribution
Despite the aforementioned existing advances of smart-traps, to be able to extract knowledge from the aforementioned smart-trap collected data, existing methodologies must be able to compare results. Thus, use of a common set of trap observation data is necessary for the testing of the efficiency and effectiveness of the methods, while also providing reference for comparison of new and existing methods to show progress, as is the case with most scientific datasets [18,19]. To the best of our knowledge existing research works in automated Dacus identification are not operating on the same data and thus the results presented therein are not easily comparable.
Data collection from Dacus traps is a lengthy process that requires multiple locations of olive groves, frequent physical attention to traps, minor entomological knowledge, appropriate hardware, while it is only possible for the chronological period that Dacuses are active [20]. All these factors make the collection of Dacus traps data rather difficult. Thus, the evaluation of new methods is hampered by the lack of easily accessible data to test the methods on.
To address the aforementioned requirements, we introduce the Dacus Image Recognition Toolkit (DIRT), a collection of publicly available data, programming code samples and web-services focused at supporting research aiming at the management the olive fruit-fly. DIRT offers:
- a dataset of images depicting McPhail trap contents,
- manually annotated spatial identification of Dacuses in the dataset,
- programming code samples in MATLAB that allow fast initial experimentation on the dataset or any other Dacus image set,
- a public rest https API and web interface that reply to queries for Dacus identification in user provided images,
- extensive experimentation on the use of deep learning for Dacus identification on the dataset contents.
The rest of the paper is organized as follows: Section 2 presents the related work on automated Dacus identification, and smart-trap works, while Section 3 discusses a general architecture for a smart-trap. Section 4 details the toolkit’s components: the creation processes of the dataset and a complete analysis of its contents, the programming code samples provided and the Dacus identification API. Next, Section 5 explores the use of deep learning for the identification of Dacuses and presents extensive experimental results obtained using the dataset. Finally, the paper is concluded in Section 6 including details on future directions concerning the toolkit that could ameliorate its usability and further support pest management research.
2. Related Research
This Section details related work on automated Dacus identification, and smart-trap works as presented in the literature. Most of the existing research on pest identification from images uses some form of image processing to discard extraneous information from the images and highlight the features related to the pests to be identified. Moreover, in most cases, an assumption on the size of the pests to be identified has also been made, either based on training or with hard-coded thresholding, rendering thus pixel-sizes outside a range either noise or alternative to the intended pests. This, spatial feature-set, allows only for predefined aimed pest size variability, while also it makes no distinction of entirely different pests of the same size.
In [17], Tirelli et al. presented an automatic monitoring of pest insect low consumption wireless networking image sensors. Therein, open-air examination areas were placed near plats aiming at recording the plant pests. Subsequently, images of the examination area during sampling for pests were compared to reference images of the same examination area without pests to calculate their difference. Hard-coded thresholding was used to trim out very small or very large pixel-sized differences, and the remaining were assumed to be pests. The image processing also included noise reduction and conversion to binary image, all done at a central server. Experimentation showed correlation of the pests detected with the ground-truth of pests.
Another smart-trap is also presented in [16]. Therein, Philimis et al. describe a wirelessly connected monitoring system that consists of automated traps with optical and motion detection modules for capturing the pests as well as a central station that collects, stores, and makes available processed results, such as insect population. This system allows for real-time analysis of pest images leading to determination of its species (Medfly or Dacus) and as well as its sex. Sadly, the work does not elaborate further as to the either the methodology for the real-time identification or its accuracy. Nevertheless, the work is part of the EU Project “e-FlyWatch” [21] wherein little provided explanations indicate that the methodology is based on a spatial features that compare the identified pest with templates in addition to pattern-based identification for “unique insect features, as for example the abdomen, wings and thorax” [22].
In [15], Wang et al. presented the design of an image identification system using computer vision methods for a wide variety of fruit flies that negatively impact international fruit trade. The system proposed therein tackles 74 species that constitute most pests in the Tephritidae. Their dataset includes three body parts, the wing, abdomen, and thorax of fruit flies based on which identification is performed either individually or in any combination. The identification process includes steps such as gamma correction for varying illumination issues, multi-orientation, and multi-scale features based on Gabor filters and k-NN classification. Experimentation indicated an overall classification success rate of 87% at the species level.
Identification of insects that are submerged in liquids are not only interesting for identifying pests in collections of unsorted material but to the theme if this work as well, as traps that use liquid pheromones to attract pests usually lead to “soup images” where the pests to be identified are more often than not submerged in the liquid. Sun et al. [23] proposed an image analysis approach for analyzing insect soup images by identifying dark bodies in bright background leading to shapes of pests. Subsequently, measurements such as size/area, length, width, color as well as feature extraction are done, based on which insect sub-region sorting based on size is finally made.
Doitsidis et al. [13] presented an automated McPhail trap for the monitoring of Dacus’ population. Their smart-trap design allows for image capturing of the contents of the trap that are subsequently transmitted to a server and processed in order identify Dacuses. The methodology for the Dacuses identification in the images is based on image processing procedures such auto brightness correction, edge detection (CLF), conversion to binary (Otsu), bounds detection (Circle Hough Transform) and noise reduction. Training was done using 100 manually annotated images that lead to a computed average size (in terms of percentage of black area—black pixels) of a single fruit fly as a percentage of the area of interest, i.e., the trap, making thus requiring use of a specific trap or knowledge of trap’s dimensions. Extensive testing done therein indicated accuracy to reach 75%.
In [24], Potamitis et al. proposed the modification of typical, low-cost plastic fruit fly trap (McPhail type) with the addition of optoelectronic sensors monitoring the entrance of the trap to detect and identify the species of incoming insects, from the optoacoustic spectrum analysis of their wing-beat, leading thus automated streaming of insect count. The identification is done based on comparison of the amplitude of the time domain recording of an insect entering the trap with the ground-truth range derived from many of the same insect recordings, thus not discriminating pests with high overlapping spectra. Experimentation indicated a 0.93 and 0.95 average F1-score for all fruit flies tested and Dacus in the lab, respectively.
Shaked et al. [12] presented the design of two smart-traps for four fruit fly species featuring a variety of configurations, all of which use wireless communications to propagate captured of images of trapped insects on sticky surfaces. One rather interesting configuration of this work pertains to the network topology that, in addition to the usually used star network, also proposes a mesh network which provides robustness since multiple routes for data to travel to exist if one node fails. The work did not feature an automated fruit fly identification methodology, while it seems to be an extension of the earlier work of Alorda et al. [14] (under the auspices of the same project, “FruitFlyNet”) presenting an energy-efficient and low-cost trap for Olive fly monitoring using a ZigBee-based Wireless Sensor Network.
Finally, several works address other notorious pests of commercially important fruits and vegetables such as the Tephritid Fruit Flies by use of trapping and detection, control, and regulation mostly at the entomological and agronomical levels [25], codling moth using a convolutional neural network-based detection pipeline on an unnamed commercial dataset [26], and wood-boring beetles arriving at high-risk sites [27].
3. Smart Trap
As indicated in Section 1, a large amount of various reliable data is to be collected in a frequent basis with minimum cost to be able to address Integrated Pest Management (IPM) requirements. To do so, a generic way of collecting, digitizing and transmitting the necessary data at a processing center is developed in this study. This general architecture for a smart-trap, the Electronic Olive Fruit fly trap, uses an electronic version of the classical McPhail trap and comprises of the following parts:
- McPhail-type trap. A McPhail-type trap with enlarged upper part completely equivalent in terms of size (inner trap volume), environmental conditions (temperature, humidity, etc.), and parameters effecting the attraction of Dacuses, the entrance type for the pests, and the difficulty of exit. The extra height of the upper part is important to accommodate all the necessary electronic parts described in the sequel as well as to allow space for proper focus of the camera. The electronics compartment is to be completely isolated from the rest part of the trap (e.g., by means of a transparent PVC plate or equivalent methods).
- Wi-fi equipped microcomputer. A microcomputer for the task of orchestrating all the necessary actions to record the data and dispatch these to a networking module (e.g., a GSM modem), thus reaching finally to a server/processing center. The microcomputer is to be selected based on the following criteria:
- low cost,
- computational resources,
- number of open-source programs available for it,
- operational stability,
- availability of integrated Wi-Fi (and/or other protocols’) transceiver, and
- capability for integration of camera with fast interface and adequate resolution.
The key disadvantage of including a microcomputer is its relative high-power consumption, despite the numerous techniques existing for the minimization of stand-by consumption. The main alternative, micro-controllers, can also be considered for the task given that preliminary tests indicate that the computational load is not too big for their limited resources (such as RAM and CPU speed). The microcomputer proposed features a Unix-type operating system for openness while with the use of scripts (e.g., python) will collect data from the sensors (mentioned in the sequel) at explicitly defined time instances of the day. Then, the data will be transmitted through the networking to a server/processing center. Both collection and transmission may be synchronized with scripts (e.g., Unix bash). - Real-time clock. An accurate battery equipped Real-time clock module.
- Camera. An adequate resolution camera with adaptable lenses system to achieve focusing and zooming.
- Sensors. A high accuracy humidity and temperature sensor set within (and additionally possibly outside) the enclosure of the trap. Similar remote sensors may also be used to collect ambient readings.
- Power supply. A grid power supply system-based a battery with adequate capacity to supply the necessary electrical power to the smart-trap for a few days. For the smart-trap to be an autonomous and a maintenance-free device, a solar panel and a charger system are to be included and accommodated to a waterproof box nearby the trap.
- Networking. Despite the abundance of alternative networking configurations (e.g., star, mesh, ad-hoc, hybrid, etc.) herein we propose the use of a GSM modem that can serve up to 50 smart-traps, leading thus to the star topology. The modem should feature external antennas that can be replaced with higher-gain antennas should it be deemed necessary. The GSM modem is to be supplied with power by the solar panel—battery system that supplies the smart-trap.
- Local data storage. Use of local data storage (e.g., Secure Digital), in addition to the aforementioned operating system, for the temporary storage (and recycling) of collected data will allow to ensure the collected data are note lost in case of communication errors or errors of the server/processing center, at least up to the point of the next recycling. Accordingly, attention should be paid on the expected data volume per sampling of the sensors in addition to the frequency of sampling to select the required retention level.
- Server/processing center. The server/processing center is to be accessed through secure protocols (e.g., SSH) and synchronize data directories with the data directories of the smart-traps at explicitly defined time instances every day to deal with communication costs. To ensure the collected data are note lost, should a GSM modem failure occur and do not reach the server/processing center, data are also to be stored in the smart-trap’s local storage.
Following the aforementioned specifications, a prototype (Figure 1a,b) of the Electronic Olive Fruit fly trap has been created at the Dept. of Informatics, Ionian University, Greece. A demonstration network of such Electronic Olive Fruit fly traps has been setup and placed in olive groves in NW Corfu, Greece, as shown in Figure 2, and is currently under rigorous testing to verify both its effectiveness and efficiency in collecting data. Pending its evaluation, the network will be significantly expanded, and its data will be directly used to further expand DIRT’s dataset as well as its trained models.
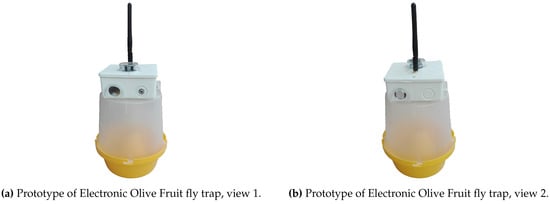
Figure 1.
Electronic Olive Fruit fly trap.
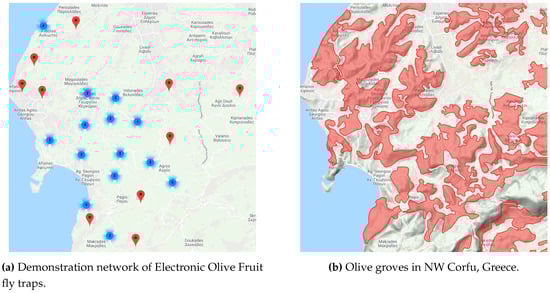
Figure 2.
Electronic Olive Fruit fly trap network.
4. The Toolkit
This Section presents the toolkit’s components: the creation processes of the dataset and a detailed analysis of its contents, the programming code samples provided and the Dacus identification API. Figure 3 presents the flowchart of DIRT’s creation and experimentation process: Data collection, splicing, filtering, and annotation are described in Section 4.1, while data splitting, CNN training and evaluation are presented in Section 5. The complete Dacus Image Recognition Toolkit is available at http://lefkimi.ionio.gr/~avlon/dirt-dacus-image-recognition-toolkit/.
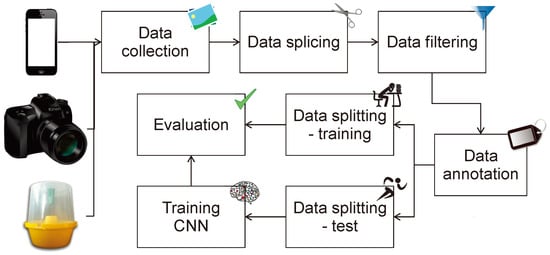
Figure 3.
Flowchart of DIRT’s creation and experimentation.
4.1. Dataset
DIRT’s data consists of images, the majority of which depict olive fruit fly captures in McPhail traps, collected from year 2015 to 2017 in various locations of Corfu, Greece. The images were acquired mainly via the e-Olive [28] smart-phone application, which allows users to submit reports about olive fruit fly captures, and upload images captured from the trap in the field. As the collection of images has been done using a variety of hardware (smart-phones and tablets running the e-Olive app, photo-cameras available at the field during trap inspection, etc.) the images of the dataset not standardized. Figure 4 shows the distribution of images as far as their dimensions are concerned.
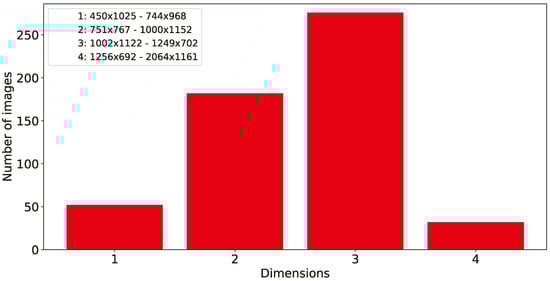
Figure 4.
Distribution of DIRT’s images dimensions.
The original dataset consisted of 336 images, but after discarding images that either were too blurry to distinguish olive fruit flies from other insects or no olive fruit flies were present, the size of the dataset was reduced to 202 images. Moreover, since training on this dataset for 50,000 steps did require superior than commonly available hardware, due to memory requirements associated with the large size of the available photographs, we decided to slice each image into four parts. Thus, after discarding image parts that did not depict any olive fruit fly, the final dataset includes 542 images, a sample of which is shown in Figure 5. From those images 486 were randomly selected for training, while the remaining, also randomly selected, 56 images were used for evaluation in our experiments. Figure 6 presents the histogram of manually annotated olive fruit flies in images, before and after the slicing process of images, as aforementioned.
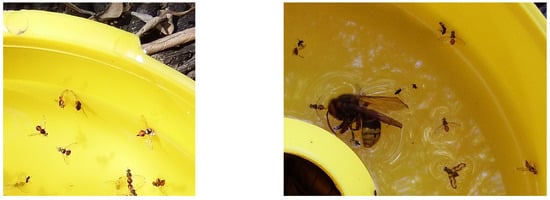
Figure 5.
Sample images from the dataset.
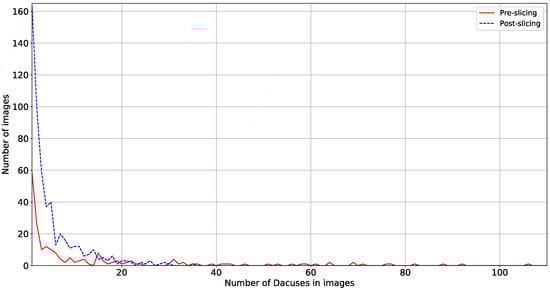
Figure 6.
Distribution of images per counted Dacuses.
Label annotation upon our dataset was done with the LabelImg [29] annotation tool which allows the user to manually draw bounding boxes around objects in images and associate each box to a label, as shown in Figure 7. It is important to note, that for images depicting McPhail traps, we annotated mostly olive fruit flies that were floating in the liquid solution in addition to the distinguishable submerged olive fruit flies, since when submerged, Dacuses tend to create clusters making the task to identification very difficult. Bound to this restriction we annotated 2672 olive fruit flies.
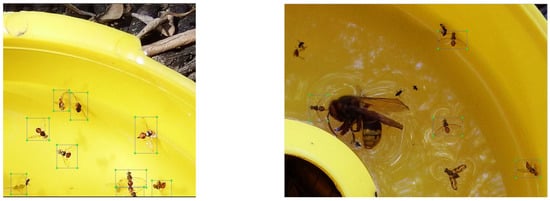
Figure 7.
Sample images from the dataset with label annotation.
4.2. Programming Code Samples
To stimulate further the research on pest management as well as Dacuses image recognition, DIRT also includes a set of programming code samples that will allow interested researchers to fast-track their use of DIRT’s contents as well as guide them into some rudimentary experimentation.
The programming code samples are in Matlab and include the following generic/handling functions:
- Load dataset. Function load_DIRT_dataset parses the files of the dataset as provided in the archive of DIRT and produces a struct array with the associated filenames and folders of both images and (xml) annotations using local relative paths. No input arguments are required, and the function returns the resulting struct array as well as saves it as a file titled DIRT_dataset.mat for future use. The definition of the image and annotation local paths, for content discovery, is clearly noted in lines 5 and 6 of the function.
- Preview image with annotation. Function preview_img_DIRT_dataset shows a random image of the dataset with overlaid annotation(s) of its Dacuses. The first argument is required and refers to the dataset as produced by load_DIRT_dataset function. The second argument is the array id of the image to preview (optional). If no second argument is provided or its value is false, then a random image of the dataset is shown. The third argument is a switch whether to show the image or not: if set to true (default) then it displays the image while if set to false then it does not display the image. The function returns the image including the overlay of the annotation(s).
- Parse annotation. Function parse_DIRT_annotation parses an annotation’s xml file of DIRT dataset and returns its contents. The input argument is the char array or string containing the full path to the annotation file, including the annotation file’s name and extension. The returned value is a struct containing (a) an aggregated array, with size where k is the number of Dacuses annotated in the image, while the four numbers per annotation describe the lower left x and y coordinates of the annotation’s bounding box and the box’s width and height, as well as (b) an array of the , , , and coordinates of each annotation’s bounding box.
Moreover, the programming code samples in Matlab also include a simple but complete R-CNN [30] training and testing scenario with the following functions:
- Driver. Function startFromHere is a driver function for training and testing an R-CNN with the DIRT dataset. No input arguments are required, and the function does not return any information as the last called function therein, test_r_CNN function, presents a graphical comparison of the identified by the R-CNN Dacus and the manually annotated ground-truth equivalent. The function slices the DIRT_dataset to train it with all but one, randomly selected from the available, image that will be subsequently used in the test_r_CNN function performing the test of the R-CNN.
- Training the R-CNN. Function train_r_CNN trains an R-CNN object detector for the identification of Dacuses in images. The input argument is the dataset in the format produced by load_DIRT_dataset function, while the output of the function is the trained R-CNN object detector. The network used herein is not based on a pre-trained network but it is simplistically trained from scratch as a demo of the complete process. The resulting network is saved as a file titled rcnn_DIRT_network.mat for future use. The function also includes a switch that allows the training to be completely avoided and a pre-trained network loaded from the file titled rcnn_DIRT_network.mat to be used/returned instead.
- Testing the R-CNN. Function test_r_CNN presents a graphical comparison of the identified by the R-CNN Dacus, based on the trained network, and the manually annotated ground-truth equivalent, as prepared by the preview_img_DIRT_dataset function, side-by-side. The function’s first input is the trained R-CNN network, as provided by the train_r_CNN function, the second argument is the dataset in the format produced by load_DIRT_dataset function, and the third argument is the test image’s id from the array of load_DIRT_dataset, as selected by the startFromHere function for the testing procedure.
4.3. Dacus Identification API
The capability to identify Dacuses is of paramount importance to olive fruit cultivation and oil production, as described in Section 1. To further support this necessity, DIRT also includes a publicly available rest https API that replies to queries for Dacus’ identification in user provided images. In that manner, the complexity of Dacus’ identification in images is alleviated from users that only need to manage the interaction with the DIRT’s API, also addressed by simplistic web-based interface provided by DIRT.
It should be clearly noted that the proposed API is experimental and under permanent upgrade/development as new methods are implemented and more and more data are collected from our traps, annotated by experts, submitted to the system and the R-CNN is trained on. Accordingly, under no circumstances should the proposed API be used as a sole point of information for any related to Dacus infestation or olive-tree pest management decision making.
The API does not currently require any form of authentication and it features a single endpoint that, using the post method, allows the user to upload a single jpeg file-type image of maximum 2 Mebibytes. On success, the HTTP status code in the response header is 200 OK and the response body contains the JSON formatted file that describes the spatial coordinates of the bounding box of each of the Dacus(es) identified in the submitted image. On error, the header status code is an error code and the response body contains an error object detailing the error that occurred and possible method(s) to mitigate it.
As the process of identification of Dacuses in an image is quite heavy, both in terms of CPU and RAM of the server that provides this service, users are informed that our experimentation with moderate concurrent load showed that a possible lack of real-timeness in reply reaching at most 30 s, is a strong possibility. Accordingly, both the API and the web interface feature access limit: Only 1 access of these services is allowed per IP per 60 s, while on transgression the header status code is an error code and the response body contains an error object detailing the error that occurred and possible method(s) to mitigate it.
5. Experimental Evaluation
5.1. Experimental Setup
For our experiments we choose the Tensorflow Object Detection API [31] which is an open-source framework built upon Tensorflow [32], an open-source machine learning framework. The Tensorflow Object Detection API provides several pre-trained models for the user to use in experiments. The detection models provided were pre-trained on the COCO [33], KITTI [34] and Open Images [35] datasets. All training sessions run for 100,000 steps, with a batch size of one. Thus, training run for 184 epochs. The hardware configuration where all experiments were conducted can be seen in Table 1.

Table 1.
Hardware configuration.
Finally, the performance measurement used throughout the experimentation is the Mean Average Precision (mAP) [36], a common metric to compare model performance in object detection and it is the average maximum accuracy for different recall values. Essentially, mAP combines all individual (per test query) average precision into one number. mAP is formally defined in Equation (1), where the set of relevant documents for an information need is and is the set of ranked retrieval results from the top result until document . Among evaluation measures, mAP has been shown to “have especially good discrimination and stability” [37].
5.2. Experimental Results
To verify the usefulness of the proposed dataset, a variety of experiments were conducted, pertaining mostly at the ability of automatically identifying Dacuses in the images using as ground-truth manually annotated spatial identification of Dacuses.
Firstly, training was performed on the following pre-trained models and the one with the best performance was selected to conduct further experiments.
- faster_rcnn_inception_v2_coco
- faster_rcnn_resnet50_coco
- faster_rcnn_resnet50_lowproposals_coco
- rfcn_resnet101_coco
- faster_rcnn_resnet101_coco
- faster_rcnn_inception_resnet_v2_atrous_coco
Table 2 presents the total loss and total time to complete training in the specified steps for each of the aforementioned detection models, after training on the DIRT dataset (and thus the removal of the “_coco” postfix).
Table 2.
Model training details.
Figure 8 presents the performance of all models trained on our dataset. The detection model that performed the worst, aside from the aforementioned model, was model 4 with a mAP of 57.42%. Detection models 3, 5 and 6 performed relatively well, ranging between 68% and 80%. However, models 1 and 2 outperformed all the rest with a mAP value of 91.52% and 90.03%, respectively. Although the difference in performance is small (1.49%) between the two, we selected model 1 for the rest of our experiments since its training time is nearly four times faster than model 2 (see Table 2).
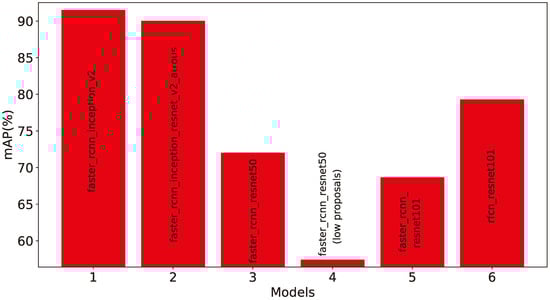
Figure 8.
Detection models performance comparison after training on the olive fruit fly image dataset.
After selecting the best performing model, we investigated how the performance is affected by image detail conducting thus training on resized images from the initial dataset. In detail, we trained our model on 10%, of the original size, to 100% with a 10% increase step. Furthermore, the same experiment was repeated, only this time all images were converted to gray-scale to verify the effect of color in the results obtained.
Figure 9 shows how the performance of detection model 1 changes when trained upon different size scales of the images from the original olive fruit fly dataset. For 10% of the original size the model performs rather poorly, with a mAP of 63.15%, regarding the subsequent resized datasets. For 20% and greater, detection precision ranges between 85% and 91%. Interestingly, enough, values of mAP for scaling between 50% and 100% are nearly stable with small fluctuations, while the difference between the full-sized images and the images resized in half is 1.13%.
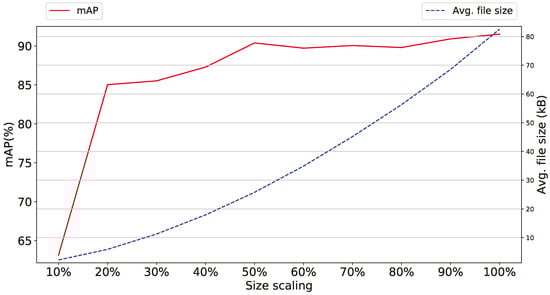
Figure 9.
Detection model 1 performance for different size scales of the images in the dataset.
Similarly, Figure 10 presents the change in performance of detection for model 1 for different size scales of the images but converted to gray-scale. Once more, for 10% resized images the detection precision is low (60.6%) compared to the rest of the sizes. While, between 20% and 100% scaling, mAP ranges approximately between 81% and 91%. Finally, after 60% scaling the detection precision is quite stable with small fluctuations.
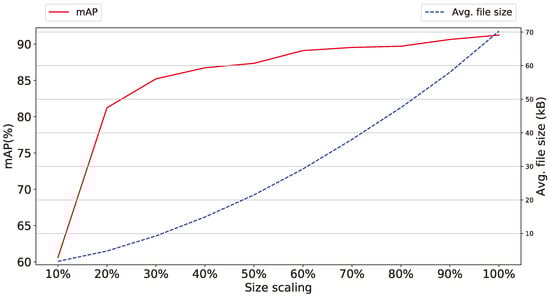
Figure 10.
Detection model 1 performance for different size scales of the images in the dataset, after conversion to gray-scale.
In Figure 11, the detection precision between the gray-scale and color (RGB) datasets from the previous two experiments are compared. Both have a similar trend in increasing precision as the original size of the images is approached. However, the average difference in detection precision between 10% and 50% scaling is 2.05% in favor of the RGB dataset. On the other hand, from 60% and onward the precision between the RGB and gray-scale datasets reaches about the same with an average difference of 0.354% in favor of the RGB dataset.
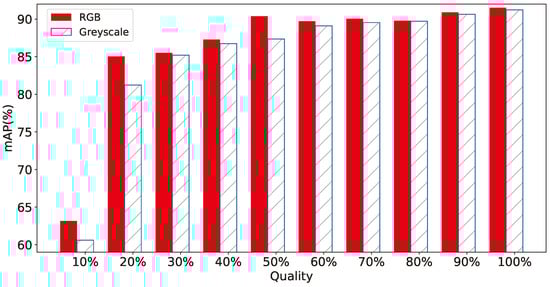
Figure 11.
Performance comparison between RGB and gray-scale images for different size scales of the images.
In the next experiment, we investigated how the performance of the selected model is affected in relation to the total number of olive fruit flies in an image. Therefore, we created four new sub-datasets (see Table 3) based on the initial dataset, for both the training and testing sets. Specifically, we tested the performance on images that contained 3, 7, 10 and 14 olive fruit flies to verify the ability of the proposed model to retain high performance irrespectively of the density of Dacuses to be identified in an image. The values of fruit flies were selected based on the availability of
Table 3.
Trap count-based datasets.
Finally, the performance of the proposed methodology was experimented with in relation to the number of ground-truth (i.e., manually counted) Dacuses as well as the cumulative number of pests in each image. Figure 12 presents the detection precision for four groups of images, where each group contains solely images with the same number of ground-truth Dacuses. In all tested numbers of ground-truth Dacuses (3, 7, 10, 14) the detection precision does not fall below 89%. The limited variation that exists (detecting three olive fruit flies produces the highest mAP value of 96.1% with the lowest detection performance of 89.5% for ten Dacuses) is attributed to the size of each group’s available image content in terms of pests to be examined.
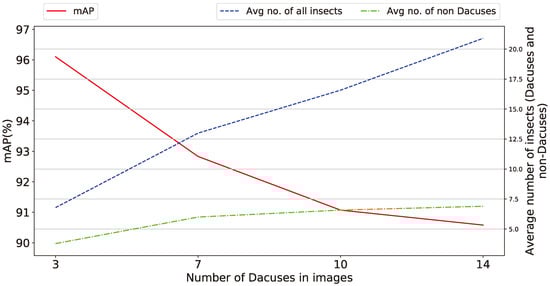
Figure 12.
Detection precision comparison for trap count-based datasets.
5.3. Results and Discussion
Based on the experimental results of Section 5.2, there are three important takeaways:
- Size of images The experimental results on the size of the images taken from the smart-trap, as shown in Figure 9, indicate that a high detail provided in photos with increased pixel availability is indeed affecting the performance of the proposed methodology, but the ratio of performance’s increase falls sharply after discarding 80% of the original information while the difference between discarding 50–10% is approx 1% and thus almost negligible, for some applications. Accordingly, the widespread availability of high-pixel cameras, although has been show to increase the effectiveness of the identification of Dacuses, develops to be a trade-off between marginally higher performance and increased volume of data that potentially have to be stored locally to limited persistent storage or transported over either meter connections (e.g., GSM modem) or in ad-hoc networks affecting thus the network’s load.
- Color information of images Similarly to the previous argument, the color information of the images obtained from the smart-trap, as shown in Figure 10 and Figure 11, is shown to be of secondary importance as, in both scaled gray-scale images as well as in full scale images after conversion to gray-scale, the effect of RGB color on performance is almost negligible. This supports further the previous argument of the diminished role of high-pixel images even when these are gray-scale and thus require approx. one third of the RGB equivalent images. Thus, the selection of RGB or gray-scale cameras reverts to the aforementioned trade-off between minor increase in identification performance versus volume of data.
- Number of Dacuses in images The ability of the proposed method to retain high performance irrespectively of the number of collected Dacuses in the trap is very important to address a variety of scenarios of trap designs, geo- and weather-characteristics of the olive grove, varieties of olives etc. The variation shown in Figure 12 is approx. 6.5% and thus requires further examination, even though for the specific traps used, all values of number of Dacuses equal or greater than seven are similarly considered to be a significant infestation indication requiring action. Overall, a general trend is evident for the parameters tested: the number of insects (and by extension Dacuses) inversely affects the detection precision, an effect attributed to the proportionally higher number of insects in the trap when increased number of Dacuses are measured.
6. Conclusions
This work presents the “Dacus Image Recognition Toolkit” (DIRT), a collection of publicly available data, programming code samples and web-services focused at supporting research aiming at the management the olive fruit-fly as well as extensive experimentation on the capability of the proposed dataset in identifying Dacuses using Deep Learning methods. The dataset includes 542 images depicting McPhail trap contents with expert manually annotated spatial identification of Dacuses in each image. To further support research on Dacuses identification, the toolkit includes programming code samples in MATLAB that allow fast initial experimentation on the dataset or any other Dacus image set while in addition, a public rest https API and web interface has been developed that reply to queries for Dacus identification in user provided images.
It should be noted, that we intend to maintain and enhance the Toolkit and, accordingly, DIRT’s dataset enlargement and further training of the web-service is assumed by our team as a perpetual process. Up-to-date information on DIRT’s dataset volume and assorted programming code samples as well as further training of the models used in the Dacus Identification API, are available at the Toolkit’s website http://lefkimi.ionio.gr/~avlon/dirt-dacus-image-recognition-toolkit/.
Extensive experimentation on the use of deep learning for Dacus identification on the dataset’s contents, presented herein, include a variety of experiments pertaining mostly at the ability of automatically identify Dacuses in the images using as ground-truth manually annotated spatial identification of Dacuses. Results indicated that the performance accuracy (mAP) of 91.52% is possible based on publicly available pre-trained and further trained on Dacuses models. Moreover, the experimental results indicated a trade-off in both image pixel size and color information (both adding to image detail, file size and complexity of approaches) and mAP performance that can be selectively used to better tackle the needs of each usage scenario.
There exist several research directions that DIRT could be further ameliorated in future versions. The most obvious one pertains to the enlargement of the toolkit’s dataset in both volume of images as well as in variability of trap type, allowing thus better training and accordingly recognition performance. Moreover, the use McPhail-type traps with liquid pheromones to attract pests have indeed lead to some degree to “pest soup images” where several the Dacuses to be identified are submerged in the liquid and thus indistinguishable even by in situ experts much less by remote observers through images. As the aim of this work is to provide a methodology to identify Dacuses through images, future work on the toolkit could include a more detailed ground-truth identification of clustered and submerged Dacuses for the scenarios supporting scarce image sampling of the trap, wherein such situations may arise. Moreover, the identification of the genre of the Dacuses collected at the traps is of high importance and requires further exploration. As far as the API is concerned, a more time-responsive and with fewer access restrictions is certainly warranted for wider use and experimentation, both of which will be possible with special hardware and more advanced indexing methods. Moreover, with an extension of the API to feature evaluations of both of its submitters and experts, users will certainly provide for, at least, an ever-expanding dataset and potentially increased performance leading to better user experience. Finally, this research can be further ameliorated by additional use of methods employed in generic image recognition such as combination of deep and handcrafted image features, local learning frameworks to predict image class as well as use of insect-specific image recognition methods focusing on insect wing, body, and eye features.
Author Contributions
Conceptualization, M.A. and I.K.; Methodology, R.K. and I.K.; Software, R.K. and I.K.; Validation, R.K., M.A. and I.K.; Formal Analysis, M.A. and I.K.; Investigation, D.D.; Resources, R.K. and D.D.; Data Curation, R.K. and I.K.; Writing—Original Draft Preparation, R.K., I.K. and D.D.; Writing—Review & Editing, M.A., R.K., I.K. and D.D.; Visualization, R.K. and I.K.; Supervision, M.A. and I.K.; Project Administration, M.A.; Funding Acquisition, M.A.
Funding
The financial support of the European Union and Greece (Partnership Agreement for the Development Framework 2014–2020) under the Regional Operational Programme Ionian Islands 2014–2020, for the project “Olive Observer” is gratefully acknowledged.
Acknowledgments
The authors would like to acknowledge the support of Humanistic and Social Informatics Laboratory of the Department of Informatics, Ionian University headed by Associate Phivos Mylonas for the provision of the NVidia Titan Xp graphics card acquired under the NVidia GPU Grant Program towards the execution of the herein described experimentation.
Conflicts of Interest
The authors declare no conflict of interest.
References
- Altieri, M.A.; Farrell, J.G.; Hecht, S.B.; Liebman, M.; Magdoff, F.; Murphy, B.; Norgaard, R.B.; Sikor, T.O. Toward sustainable agriculture. In Agroecology; CRC Press: Boca Raton, FL, USA, 2018; pp. 367–379. [Google Scholar] [CrossRef]
- Van Grinsven, H.J.; Erisman, J.W.; de Vries, W.; Westhoek, H. Potential of extensification of European agriculture for a more sustainable food system, focusing on nitrogen. Environ. Res. Lett. 2015, 10, 025002. [Google Scholar] [CrossRef]
- King, A. The future of agriculture. Nature 2017, 544, S21–S23. [Google Scholar] [CrossRef] [PubMed]
- Donatelli, M.; Magarey, R.D.; Bregaglio, S.; Willocquet, L.; Whish, J.P.; Savary, S. Modelling the impacts of pests and diseases on agricultural systems. Agric. Syst. 2017, 155, 213–224. [Google Scholar] [CrossRef] [PubMed]
- Bogue, R. Sensors key to advances in precision agriculture. Sens. Rev. 2017, 37, 1–6. [Google Scholar] [CrossRef]
- Ojha, T.; Misra, S.; Raghuwanshi, N.S. Wireless sensor networks for agriculture: The state-of-the-art in practice and future challenges. Comput. Electron. Agric. 2015, 118, 66–84. [Google Scholar] [CrossRef]
- Wolfert, S.; Ge, L.; Verdouw, C.; Bogaardt, M.J. Big data in smart farming—A review. Agric. Syst. 2017, 153, 69–80. [Google Scholar] [CrossRef]
- Lindblom, J.; Lundström, C.; Ljung, M.; Jonsson, A. Promoting sustainable intensification in precision agriculture: Review of decision support systems development and strategies. Precis. Agric. 2017, 18, 309–331. [Google Scholar] [CrossRef]
- Eurostat. Agri-Environmental Indicator—Cropping Patterns. 2017. Available online: https://ec.europa.eu/eurostat/statistics-explained/index.php/Agri-environmental_indicator_-_cropping_patterns (accessed on 25 October 2018).
- Fogher, C.; Busconi, M.; Sebastiani, L.; Bracci, T. Chapter 2—Olive Genomics. In Olives and Olive Oil in Health and Disease Prevention; Preedy, V.R., Watson, R.R., Eds.; Academic Press: Cambridge, MA, USA, 2010; pp. 17–24. [Google Scholar] [CrossRef]
- Haniotakis, G.E. Olive pest control: Present status and prospects. IOBC Wprs Bull. 2005, 28, 1–12. [Google Scholar]
- Shaked, B.; Amore, A.; Ioannou, C.; Valdés, F.; Alorda, B.; Papanastasiou, S.; Goldshtein, E.; Shenderey, C.; Leza, M.; Pontikakos, C.; et al. Electronic traps for detection and population monitoring of adult fruit flies (Diptera: Tephritidae). J. Appl. Entomol. 2017, 142, 43–51. [Google Scholar] [CrossRef]
- Doitsidis, L.; Fouskitakis, G.N.; Varikou, K.N.; Rigakis, I.I.; Chatzichristofis, S.A.; Papafilippaki, A.K.; Birouraki, A.E. Remote monitoring of the Bactrocera oleae (Gmelin) (Diptera: Tephritidae) population using an automated McPhail trap. Comput. Electron. Agric. 2017, 137, 69–78. [Google Scholar] [CrossRef]
- Alorda, B.; Valdes, F.; Mas, B.; Leza, M.; Almenar, L.; Feliu, J.; Ruiz, M.; Miranda, M. Design of an energy efficient and low cost trap for Olive fly monitoring using a ZigBee based Wireless Sensor Network. In Proceedings of the 10th European Conference on Precision Agriculture, Volcani Center, Israel, 12–16 July 2015. [Google Scholar]
- Wang, J.N.; Chen, X.L.; Hou, X.W.; Zhou, L.B.; Zhu, C.D.; Ji, L.Q. Construction, implementation and testing of an image identification system using computer vision methods for fruit flies with economic importance (Diptera: Tephritidae). Pest Manag. Sci. 2016, 73, 1511–1528. [Google Scholar] [CrossRef] [PubMed]
- Philimis, P.; Psimolophitis, E.; Hadjiyiannis, S.; Giusti, A.; Perello, J.; Serrat, A.; Avila, P. A centralised remote data collection system using automated traps for managing and controlling the population of the Mediterranean (Ceratitis capitata) and olive (Dacus oleae) fruit flies. In Proceedings of the International Conference on Remote Sensing and Geoinformation of the Environment, Paphos, Coral Bay Cyprus, 8–10 April 2013; Volume 8795, p. 8795. [Google Scholar] [CrossRef]
- Tirelli, P.; Borghese, N.A.; Pedersini, F.; Galassi, G.; Oberti, R. Automatic monitoring of pest insects traps by Zigbee-based wireless networking of image sensors. In Proceedings of the IEEE International Instrumentation and Measurement Technology Conference, Hangzhou, China, 9–12 May 2011; pp. 1–5. [Google Scholar] [CrossRef]
- Uhlir, P. The Value of Open Data Sharing. 2015. Available online: https://www.earthobservations.org/documents/dsp/20151130_the_value_of_open_data_sharing.pdf (accessed on 25 October 2018).
- Mayernik, M.S.; Phillips, J.; Nienhouse, E. Linking publications and data: Challenges, trends, and opportunities. D-Lib Mag. 2016, 22, 11. [Google Scholar] [CrossRef]
- Potamitis, I.; Eliopoulos, P.; Rigakis, I. Automated remote insect surveillance at a global scale and the internet of things. Robotics 2017, 6, 19. [Google Scholar] [CrossRef]
- European Commission—Community Research and Development Information Service. Development of an Innovative Automated and Wireless Trap with Warning and Monitoring Modules for Integrated Management of the Mediterranean (Ceratitis Capitata) & Olive (Dacus oleae) Fruit Flies. 2017. Available online: https://cordis.europa.eu/project/rcn/96182_en.html (accessed on 25 October 2018).
- European Commission—Community Research and Development Information Service. E-FLYWATCH Report Summary. 2014. Available online: https://cordis.europa.eu/result/rcn/141151_en.html (accessed on 25 October 2018).
- Sun, C.; Flemons, P.; Gao, Y.; Wang, D.; Fisher, N.; La Salle, J. Automated Image Analysis on Insect Soups. In Proceedings of the 2016 International Conference on Digital Image Computing: Techniques and Applications (DICTA), Gold Coast, Australia, 30 November–2 December 2016; pp. 1–6. [Google Scholar] [CrossRef]
- Potamitis, I.; Rigakis, I.; Tatlas, N.A. Automated surveillance of fruit flies. Sensors 2017, 17, 110. [Google Scholar] [CrossRef] [PubMed]
- Shelly, T.; Epsky, N.; Jang, E.B.; Reyes-Flores, J.; Vargas, R. Trapping and the Detection, Control, and Regulation of Tephritid Fruit Flies: Lures, Area-Wide Programs, and Trade Implications; Springer: Berlin, Germany, 2014. [Google Scholar]
- Ding, W.; Taylor, G. Automatic moth detection from trap images for pest management. Comput. Electron. Agric. 2016, 123, 17–28. [Google Scholar] [CrossRef]
- Rassati, D.; Faccoli, M.; Chinellato, F.; Hardwick, S.; Suckling, D.; Battisti, A. Web-based automatic traps for early detection of alien wood-boring beetles. Entomol. Exp. Appl. 2016, 160, 91–95. [Google Scholar] [CrossRef]
- Creative Web Applications P.C. e-OLIVE. 2017. Available online: https://play.google.com/store/apps/details?id=gr.cwa.eolive (accessed on 25 October 2018).
- Tzutalin. LabelImg. 2015. Available online: https://github.com/tzutalin/labelImg (accessed on 25 October 2018).
- Ren, S.; He, K.; Girshick, R.; Sun, J. Faster R-CNN: Towards Real-Time Object Detection with Region Proposal Networks. IEEE Trans. Pattern Anal. Mach. Intell. 2017, 39, 1137–1149. [Google Scholar] [CrossRef] [PubMed]
- Tensorflow. Tensorflow Object Detection API. 2018. Available online: https://github.com/tensorflow/models/tree/master/research/object_detection (accessed on 25 October 2018).
- Tensorflow. An Open Source Machine Learning Framework for Everyone. 2018. Available online: https://www.tensorflow.org/ (accessed on 25 October 2018).
- COCO. Common Objects in Context. 2018. Available online: http://cocodataset.org/ (accessed on 25 October 2018).
- Geiger, A.; Lenz, P.; Stiller, C.; Urtasun, R. Vision Meets Robotics: The KITTI Dataset. Int. J. Robot. Res. (IJRR) 2013. Available online: http://www.cvlibs.net/datasets/kitti/ (accessed on 25 October 2018).
- Krasin, I.; Duerig, T.; Alldrin, N.; Ferrari, V.; Abu-El-Haija, S.; Kuznetsova, A.; Rom, H.; Uijlings, J.; Popov, S.; Kamali, S.; et al. OpenImages: A Public Dataset for Large-Scale Multi-Label And Multi-Class Image Classification. 2017. Available online: https://storage.googleapis.com/openimages/web/index.html (accessed on 25 October 2018).
- Gros, D.; Habermann, T.; Kirstein, G.; Meschede, C.; Ruhrberg, S.D.; Schmidt, A.; Siebenlist, T. Anaphora Resolution: Analysing the Impact on Mean Average Precision and Detecting Limitations of Automated Approaches. Int. J. Inf. Retr. Res. (IJIRR) 2018, 8, 33–45. [Google Scholar] [CrossRef]
- Manning, C.D.; Raghavan, P.; Schütze, H. Introduction to Information Retrieval; Cambridge University Press: Cambridg, UK, 2008. [Google Scholar]


© 2018 by the authors. Licensee MDPI, Basel, Switzerland. This article is an open access article distributed under the terms and conditions of the Creative Commons Attribution (CC BY) license (http://creativecommons.org/licenses/by/4.0/).