Abstract
In the image processing pipeline of almost every digital camera, there is a part for removing the influence of illumination on the colors of the image scene. Tuning the parameter values of an illumination estimation method for maximal accuracy requires calibrated images with known ground-truth illumination, but creating them for a given sensor is time-consuming. In this paper, the green stability assumption is proposed that can be used to fine-tune the values of some common illumination estimation methods by using only non-calibrated images. The obtained accuracy is practically the same as when training on calibrated images, but the whole process is much faster since calibration is not required and thus time is saved. The results are presented and discussed. The source code website is provided in Section Experimental Results.
1. Introduction
Regardless of the influence of the scene illumination, the human visual system can recognize object colors through its ability known as color constancy [1]. In the image processing pipeline of almost every digital camera, there is also a part dedicated to computational color constancy [2]. It first estimates the scene illumination and then uses it to chromatically adapt the image i.e., to correct the colors. For a more formal problem statement, an often used image formation model written under Lambertian assumption is given as [3]
where is a color channel, is a given image pixel, is the wavelength of the light, is the visible spectrum, is the spectral distribution of the light source, is the surface reflectance, and is the camera sensitivity of color channel c. Assuming uniform illumination for the sake of simplicity makes it possible to remove from and then the observed light source color is given as
The direction of provides enough information for successful chromatic adaptation [4]. Still, calculating is an ill-posed problem because only image pixel values are given, while both and are unknown. The solution to this problem is to make additional assumptions. Different assumptions have given rise to numerous illumination estimation methods that can be divided into two main groups. First of these groups contains low-level statistics-based methods such as White-patch [5,6] and its improvements [7,8,9], Gray-world [10], Shades-of-Gray [11], Grey-Edge (1st and 2nd order) [12], Weighted Gray-Edge [13], using bright pixels [14], and using bright and dark colors [15]. The second group includes learning-based methods such as gamut mapping (pixel, edge, and intersection based) [16], using neural networks [17], using high-level visual information [18], natural image statistics [19], Bayesian learning [20], spatio-spectral learning (maximum likelihood estimate, and with gen. prior) [21], simplifying the illumination solution space [22,23,24,25], using color/edge moments [26,27], using regression trees with color distribution statistics features [28], performing various kinds of spatial localizations [29,30], and using convolutional neural networks [31,32,33].
Statistics-based illumination estimation methods are less accurate than the learning-based ones, but they are faster and simpler to implement in embedded systems, which is one of the reasons for their widespread usage [34] that justifies additional research related to them. In this paper, the so-called green stability assumption is proposed that can be used to fine-tune the values of the parameters of statistics-based methods by using only non-calibrated images without known ground-truth illumination. It is based on observations about the behaviour of the green chromaticity of ground-truth illuminations. The obtained accuracy is practically the same as when using calibrated training images, but the whole process is much faster and it can be directly applied in practice.
2. Best-Known Statistics-Based Methods
2.1. Definition
Some of the best-known statistics-based illumination estimation methods are centered around the Gray-world assumption and its extensions. Under this assumption, the average scene reflectance is achromatic [10] and is obtained as
where is the reflectance amount with 0 meaning no reflectance and 1 meaning total reflectance. By adding the Minkowski norm p to Equation (3), the Gray-world method is generalized into the Shades-of-Gray method [11]:
Having results in Gray-world, while results in White-patch [5,6]. In [12], Equation (4) was extended to the general Gray-world through local smoothing:
where and is a Gaussian filter with standard deviation . Another extension is the Grey-edge assumption, under which the scene reflectance differences calculated with derivative order n are achromatic [12] so that
The described Shades-of-Gray, general Gray-world, and Gray-edge methods have parameters and the methods’ accuracy depends on how these parameters are tuned. Nevertheless, in the literature, it often appears as if they require no training [3,15], which is then said to be an advantage. It may be argued that the parameter values are in most cases the same, but this is easily disproved. In [15] for methods mentioned in this section, the best fixed parameter values were given for ten different datasets. These values are similar for some datasets, but overall they span two orders of magnitude. With such high differences across datasets in mind, it is obvious that the parameter values have to be learned. Therefore, later in Section 4 in experimental results, the originally reported results are also compared to the newly calculated revisited results where the accuracy was obtained by performing learning and cross-validation. Although the mentioned methods’ accuracy is lower than the one of state-of-the-art methods, they are still widely used because of their simplicity. Empirical evidence for this was given in, e.g., Ref. [34], where the claim that “most commercial cameras are doing white balance based on the best-known Gray-World assumption” has been successfully used for forensic tasks.
2.2. Error Statistics
The accuracy of illumination estimation methods is generally expressed in form of illumination estimation error. From various proposed illumination estimation accuracy measures [35,36,37], the angular error is most commonly used. It represents the angle between the illumination estimation vector and the ground-truth illumination. All angular errors obtained for a given method on a chosen dataset are usually summarized by different statistics. Because of the non-symmetry of the angular error distribution, the most important of these statistics is the median angular error [38]. It was shown that angular errors below can be considered acceptable [39,40]. The ground-truth illuminations of benchmark dataset images are obtained by reading off the color of neutral areas on calibration objects that are previously placed in the image scene, e.g., a gray ball or a color checker, which is effectively the illumination color. During testing, these objects are masked out to prevent possible bias.
3. The Proposed Assumption
3.1. Practical Application
The methods mentioned in Section 2 are some of the most widely used illumination estimation methods [34] and this means that their parameters should preferably be appropriately fine-tuned before putting them in production. The best way to do this is to use a benchmark dataset, but, because of dependence of Equation (2) on , a benchmark dataset would be required for each used camera sensor. Since putting the calibration objects into image scenes and later extracting the ground-truth illumination is time-consuming, it would be better to perform some kind of unsupervised learning on non-calibrated images i.e., to learn from images for which the ground-truth illumination is unknown.
3.2. Motivation
When for a dataset the ground-truth illuminations are unknown, an alternative is to make assumptions about the nature of illumination estimations produced by statistics-based methods when their parameters are fine-tuned and then to meet the conditions of the assumptions. When considering the nature of illumination estimations, a good starting point is the observation that some statistics-based illumination estimations appear “to correlate roughly with the actual illuminant” [26]. Figure 1 shows this for the images of the GreyBall dataset [41].
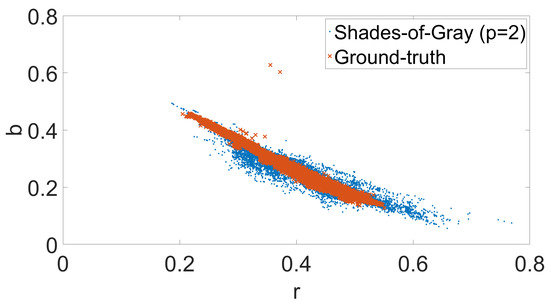
Figure 1.
The -chromaticities of the ground-truth illuminations and Shades-of-Gray illumination estimations for GreyBall dataset images [41] (best viewed in color).
The points in Figure 1 can be considered to occupy a space around a line in the -chromaticity [22], which is connected to the fact that the green chromaticity of the ground-truth illuminations is relatively stable and similar for all illuminations. For the GreyBall dataset, the standard deviations of the red, green, and blue chromaticity components of the ground-truth illuminations are , and , respectively, and similar results are obtained for all other datasets. For Shades-of-Gray illumination estimations shown in Figure 1, the red, green, and blue chromaticity components of the ground-truth illuminations are , and , respectively, which means that there is also a trend of green chromaticity stability, although the standard deviation is greater than in the case of ground-truth illumination. This means that, if a set of illumination estimations is to resemble the set of ground-truth illuminations, the estimations’ green chromaticity standard deviation should also be smaller and closer to the one of the ground-truth. As a matter of fact, if, for example, the Shades-of-Gray illumination estimations for and shown in Figure 2 are compared, the standard deviations of their green chromaticities are and , respectively, while their median angular errors are and , respectively. Similar behaviour where lower green chromaticity standard deviation is to some degree followed by lower median angular error can be seen on all datasets and for all methods that were mentioned and described in Section 2.
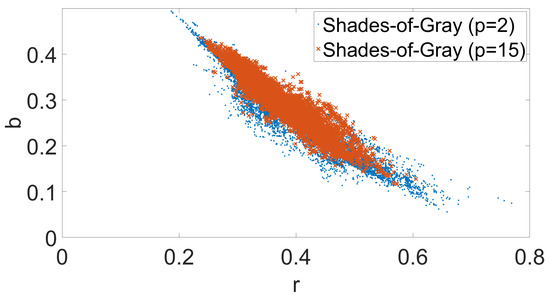
Figure 2.
The -chromaticities of different Shades-of-Gray illumination estimations for GreyBall dataset images [41] (best viewed in color).
Such behaviour can also be explained theoretically. Namely, due to the constraint that the sum of the chromaticity components has to be 1, the chromaticity dimensionality is 2. As for the illumination chromaticities, they mostly come either from outdoor sources such as the sun or the sky reflection, or from an artificial source such as incandescent light bulbs, and in such cases their chromaticities should ideally follow the Planckian locus i.e., the curve of the black body color, which reduces the dimensionality of illumination chromaticity to 1. Since even for non-ideal real-world image illumination chromaticities there is a strong linear connection between the red and blue chromaticities [22,23,42], the green chromaticity is consequently supposed to be more or less similar among various illuminations. Furthermore, the more accurate some illumination estimations are, the more similar they should be to the ground-truth illuminations and therefore they should also be expected to have a smaller deviation of the green chromaticity. One possible application of this would be to blindly choose between two sets of parameter values for a given illumination estimation method on a given set of images without known ground-truth illumination. Namely, the parameter values for which the method will produce illumination estimations with smaller deviation of green chromaticity should be preferred in light of the laid out theoretical background. This is effectively unsupervised learning since it is not required to know the ground-truth illumination for the training images. Since camera sensors are supposed to be linear at their initial stages, the described behaviour should hold for any of them.
To check if this holds in practice, another larger experiment was conducted on the GreyBall dataset [41]. The goal of the experiment was to find additional empirical clues about the connection between the change in standard deviation of the green chromaticity and the change in median angular error for a given set of illumination estimations. The gist of the experiment can be summarized in the following steps: (1) select several illumination estimation methods to be tested; (2) for each of the methods, select several sets of possible parameter values; (3) for each combination of a method and a set of its parameter values, calculate the set of illumination estimations for images in the GreyBall dataset; (4) for each of these sets of illumination estimations, calculate the median angular error and the standard deviation of the green chromaticities; (5) for every possible pair of the same sets of illumination estimations, calculate the differences between their median angular errors and standard deviations of the green chromaticities and use them as coordinates to plot a point. If there is a connection between the changes in median angular error and the standard deviation of the green chromaticities, there is a good chance that it may be visible after plotting the points for all mentioned pairs. For additional clarification, the experiment can be stated more formally. First, for each method , where contains all methods from Section 2, the Cartesian product of discrete sets of evenly spread values for individual parameters of M was calculated to get n tuples . Gray-world and White-patch have no parameters, but they were implicitly included as special cases of Shades-of-Gray. Second, each was used to set the parameter values of M and then M was applied to all images of the GreyBall dataset to obtain an illumination estimation for each of them. Third, for these illumination estimations, the standard deviation of their green chromaticities and their median angular error were calculated. Fourth, for every of possible pairs of indices such that a new difference pair was calculated such that and . Finally, all such difference pairs created for all were put together into set of pairs . If members of pairs in are interpreted as coordinates, then their plot is shown in Figure 3.
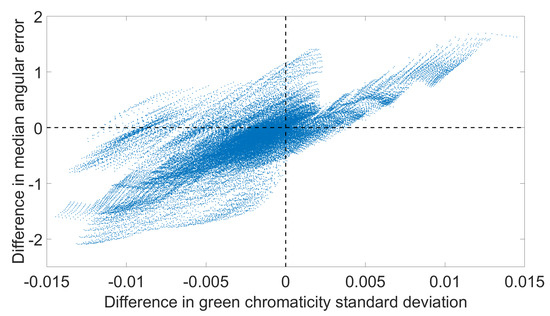
Figure 3.
Relation between difference in standard deviations of illumination estimations’ green chromaticity and the difference in illumination estimations’ median angular error.
3.3. Green Stability Assumption
The value of Pearson’s linear correlation coefficient for the points in Figure 3 is , which indicates a strong positive linear relationship [43]. In other words, the difference between the standard deviations of green chromaticities of illumination estimations produced by the same method when using different parameter values is strongly correlated to the difference between median angular errors of these illumination estimations. The same experiment was repeated for each of the NUS datasets [15] and the resulting correlations are given in Table 1. For all datasets except for Canon2 (C2), the correlation is significantly high. After analysing the case of C2, the main culprit for its lower correlation was found to be the performance of the general Gray-world algorithm, whose accuracy for higher values of did not change with same dynamic as was the case for other datasets. This is, however, not critical because it represents only a single case of slightly lower correlation.

Table 1.
Correlation between difference in green chromaticity standard deviation and difference in median angular errors for NUS datasets [15].
Based on this empirical results and observations, it is possible to introduce the green stability assumption: the parameter values for which a method’s illumination estimations’ green chromaticity standard deviation is lower simultaneously lead to lower illumination estimation errors. Like many other assumptions, this assumption does also not always hold, but it can still be useful in cases when the ground-truth illuminations for a set of images taken with a given sensor are not available. These images should also be taken under similar illuminations as the mentioned datasets that were used for empirical results. An example of a failure case would be if, for example, the illumination was mostly composed of artificial lights whose colors are spread across the whole chromaticity plane, which would also lead to significant differences in green chromaticity values, but such cases happen only very rarely.
For a specific case when the parameter values of a chosen method are fine-tuned and only non-calibrated images are available, the green stability assumption can be expressed more formally. If n is the number of images in the training set, is the i-th vector of parameter values, is the method’s illumination estimation obtained for the j-th image when is used for parameter values, is the green component of , and is the mean green component of illumination estimations for all images obtained with parameters , then, under the green stability assumption, the index of such that should result in minimal angular errors is obtained as
Since Equation (7) performs minimization of standard deviation, it can also be written without the square and the denominator.
4. Experimental Results
4.1. Experimental Setup
The following benchmark datasets have been used to demonstrate the difference between previously reported and newly calculated accuracy results for methods mentioned in Section 2 and to test the effectiveness of the proposed green stability assumption: the GreyBall dataset [41], its approximated linear version, and eight linear NUS dataset [15]. The ColorChecker dataset [20,44] was not used because of its confusing history of wrong usage [45] despite warnings from leading experts [46]. Except the original GreyBall dataset, all other contain linear images, which is preferred because illumination estimation is in cameras usually performed on linear images [2] similar to the model described by Equation (1).
The tested methods include all the ones from . During cross-validation on all datasets the same folds were used as in other publications. The source code for recreating the numerical results given in the following subsection is publicly available at [47].
4.2. Accuracy
Table 2, Table 3 and Table 4 show the previously reported accuracies, the newly recalculated accuracies, and the accuracies obtained by using the green stability assumption. The results clearly confirm the potential and the practical applicability of the green stability assumption. Namely, the results obtained by using the the ground-truth and the results obtained without having the ground-truth i.e., by applying the proposed assumption are very similar. As a matter of fact, in some cases, using the proposed green stability assumption produces results that are even more accurate than when using ground-truth illumination. This also demonstrates the success of the proposed approach to unsupervised learning for most common low-level statistics-based illumination estimation methods.
Table 2.
Combined accuracy on eight NUS datasets (lower Avg. is better). The used format is the same as in [30].
Table 3.
Accuracy on the original GreyBall dataset (lower median is better).
Table 4.
Accuracy on the linear GreyBall dataset (lower median is better).
5. Conclusions
In most relevant papers, the accuracy results for some of the most widely used statistics-based methods were calculated without cross-validation. Here, it was shown that cross-validation is needed and the accuracy results were revisited. When statistics-based methods are fine-tuned, the best way to do this is by using images with known ground-truth illumination. Based on several observations and empirical evidence, the green stability assumption has been proposed that can successfully be used to fine-tune the parameters of most common statistics-based methods when only non-calibrated images without ground-truth illumination are available. This makes the whole fine-tuning process much simpler, faster, and more practical. It is also an unsupervised learning approach to color constancy. In the future, other similar bases for further assumptions that enable unsupervised learning for color constancy will be researched.
Author Contributions
Conceptualization, N.B. and S.L.; Methodology, N.B.; Software, N.B.; Validation, N.B. and S.L.; Writing—Original Draft Preparation, N.B.; Writing—Review & Editing, N.B. and S.L.; Visualization, N.B.; Funding Acquisition, S.L.
Funding
This work has been supported by the Croatian Science Foundation under Project IP-06-2016-2092.
Acknowledgments
We thank the anonymous reviewers for their kind suggestions.
Conflicts of Interest
The authors declare no conflict of interest.
References
- Ebner, M. Color Constancy; The Wiley-IS&T Series in Imaging Science and Technology; Wiley: Hoboken, NJ, USA, 2007. [Google Scholar]
- Kim, S.J.; Lin, H.T.; Lu, Z.; Süsstrunk, S.; Lin, S.; Brown, M.S. A new in-camera imaging model for color computer vision and its application. IEEE Trans. Pattern Anal. Mach. Intell. 2012, 34, 2289–2302. [Google Scholar] [PubMed]
- Gijsenij, A.; Gevers, T.; Van De Weijer, J. Computational color constancy: Survey and experiments. IEEE Trans. Image Process. 2011, 20, 2475–2489. [Google Scholar] [CrossRef] [PubMed]
- Barnard, K.; Cardei, V.; Funt, B. A comparison of computational color constancy algorithms. I: Methodology and experiments with synthesized data. IEEE Trans. Image Process. 2002, 11, 972–984. [Google Scholar] [CrossRef] [PubMed]
- Land, E.H. The Retinex Theory of Color Vision; Scientific America: New York, NY, USA, 1977. [Google Scholar]
- Funt, B.; Shi, L. The rehabilitation of MaxRGB. In Proceedings of the Color and Imaging Conference, San Antonio, TX, USA, 8–12 November 2010; Volume 2010, pp. 256–259. [Google Scholar]
- Banić, N.; Lončarić, S. Using the Random Sprays Retinex Algorithm for Global Illumination Estimation. In Proceedings of the Second Croatian Computer Vision Workshopn (CCVW 2013), Zagreb, Croatia, 19 September 2013; pp. 3–7. [Google Scholar]
- Banić, N.; Lončarić, S. Color Rabbit: Guiding the Distance of Local Maximums in Illumination Estimation. In Proceedings of the 2014 19th International Conference on Digital Signal Processing (DSP), Hong Kong, China, 20–23 August 2014; pp. 345–350. [Google Scholar]
- Banić, N.; Lončarić, S. Improving the White patch method by subsampling. In Proceedings of the 2014 21st IEEE International Conference on Image Processing (ICIP), Paris, France, 27–30 October 2014; pp. 605–609. [Google Scholar]
- Buchsbaum, G. A spatial processor model for object colour perception. J. Frankl. Inst. 1980, 310, 1–26. [Google Scholar] [CrossRef]
- Finlayson, G.D.; Trezzi, E. Shades of gray and colour constancy. In Proceedings of the Color and Imaging Conference, Scottsdale, AZ, USA, 9–12 November 2004; Volume 2004, pp. 37–41. [Google Scholar]
- Van De Weijer, J.; Gevers, T.; Gijsenij, A. Edge-based color constancy. IEEE Trans. Image Process. 2007, 16, 2207–2214. [Google Scholar] [CrossRef] [PubMed]
- Gijsenij, A.; Gevers, T.; Van De Weijer, J. Improving color constancy by photometric edge weighting. IEEE Trans. Pattern Anal. Mach. Intell. 2012, 34, 918–929. [Google Scholar] [CrossRef] [PubMed]
- Joze, H.R.V.; Drew, M.S.; Finlayson, G.D.; Rey, P.A.T. The Role of Bright Pixels in Illumination Estimation. In Proceedings of the Color and Imaging Conference, Los Angeles, CA, USA, 12–16 November 2012; Volume 2012, pp. 41–46. [Google Scholar]
- Cheng, D.; Prasad, D.K.; Brown, M.S. Illuminant estimation for color constancy: Why spatial-domain methods work and the role of the color distribution. JOSA A 2014, 31, 1049–1058. [Google Scholar] [CrossRef] [PubMed]
- Finlayson, G.D.; Hordley, S.D.; Tastl, I. Gamut constrained illuminant estimation. Int. J. Comput. Vis. 2006, 67, 93–109. [Google Scholar] [CrossRef]
- Cardei, V.C.; Funt, B.; Barnard, K. Estimating the scene illumination chromaticity by using a neural network. JOSA A 2002, 19, 2374–2386. [Google Scholar] [CrossRef] [PubMed]
- Van De Weijer, J.; Schmid, C.; Verbeek, J. Using high-level visual information for color constancy. In Proceedings of the IEEE 11th International Conference on Computer Vision, Rio de Janeiro, Brazil, 14–20 October 2007; pp. 1–8. [Google Scholar]
- Gijsenij, A.; Gevers, T. Color Constancy using Natural Image Statistics. In Proceedings of the IEEE Conference on Computer Vision and Pattern Recognition, Minneapolis, MN, USA, 17–22 June 2007; pp. 1–8. [Google Scholar]
- Gehler, P.V.; Rother, C.; Blake, A.; Minka, T.; Sharp, T. Bayesian color constancy revisited. In Proceedings of the IEEE Conference on Computer Vision and Pattern Recognition, Anchorage, AK, USA, 23–28 June 2008; pp. 1–8. [Google Scholar]
- Chakrabarti, A.; Hirakawa, K.; Zickler, T. Color constancy with spatio-spectral statistics. IEEE Trans. Pattern Anal. Mach. Intell. 2012, 34, 1509–1519. [Google Scholar] [CrossRef] [PubMed]
- Banić, N.; Lončarić, S. Color Cat: Remembering Colors for Illumination Estimation. IEEE Signal Process. Lett. 2015, 22, 651–655. [Google Scholar] [CrossRef]
- Banić, N.; Lončarić, S. Using the red chromaticity for illumination estimation. In Proceedings of the 2015 9th International Symposium on Image and Signal Processing and Analysis (ISPA), Zagreb, Croatia, 7–9 September 2015; pp. 131–136. [Google Scholar]
- Banić, N.; Lončarić, S. Color Dog: Guiding the Global Illumination Estimation to Better Accuracy. In Proceedings of the VISAPP, Berlin, Germany, 11–14 March 2015; pp. 129–135. [Google Scholar]
- Banić, N.; Lončarić, S. Unsupervised Learning for Color Constancy. arXiv, 2017; arXiv:1712.00436. [Google Scholar]
- Finlayson, G.D. Corrected-moment illuminant estimation. In Proceedings of the IEEE International Conference on Computer Vision, Sydney, Australia, 1–3 December 2013; pp. 1904–1911. [Google Scholar]
- Chen, X.; Drew, M.S.; Li, Z.N.; Finlayson, G.D. Extended Corrected-Moments Illumination Estimation. Electron. Imaging 2016, 2016, 1–8. [Google Scholar] [CrossRef]
- Cheng, D.; Price, B.; Cohen, S.; Brown, M.S. Effective learning-based illuminant estimation using simple features. In Proceedings of the IEEE Conference on Computer Vision and Pattern Recognition, Boston, MA, USA, 7–12 June 2015; pp. 1000–1008. [Google Scholar]
- Barron, J.T. Convolutional Color Constancy. In Proceedings of the IEEE International Conference on Computer Vision, Santiago, Chile, 7–13 December 2015; pp. 379–387. [Google Scholar]
- Barron, J.T.; Tsai, Y.T. Fast Fourier Color Constancy. In Proceedings of the IEEE Computer Society Conference on Computer Vision and Pattern Recognition, Honolulu, HI, USA, 21–26 July 2017. [Google Scholar]
- Bianco, S.; Cusano, C.; Schettini, R. Color Constancy Using CNNs. In Proceedings of the IEEE Conference on Computer Vision and Pattern Recognition Workshops, Las Vegas, NV, USA, 26 June–1 July 2015; pp. 81–89. [Google Scholar]
- Shi, W.; Loy, C.C.; Tang, X. Deep Specialized Network for Illuminant Estimation. In Proceedings of the European Conference on Computer Vision, Amsterdam, The Netherlands, 8–16 October 2016; pp. 371–387. [Google Scholar]
- Hu, Y.; Wang, B.; Lin, S. Fully Convolutional Color Constancy with Confidence-weighted Pooling. In Proceedings of the IEEE Conference on Computer Vision and Pattern Recognition, Honolulu, HI, USA, 21–26 July 2017; pp. 4085–4094. [Google Scholar]
- Deng, Z.; Gijsenij, A.; Zhang, J. Source camera identification using Auto-White Balance approximation. In Proceedings of the 2011 IEEE International Conference on Computer Vision (ICCV), Barcelona, Spain, 6–13 November 2011; pp. 57–64. [Google Scholar]
- Gijsenij, A.; Gevers, T.; Lucassen, M.P. Perceptual analysis of distance measures for color constancy algorithms. JOSA A 2009, 26, 2243–2256. [Google Scholar] [CrossRef] [PubMed]
- Finlayson, G.D.; Zakizadeh, R. Reproduction Angular Error: An Improved Performance Metric for Illuminant Estimation. Perception 2014, 310, 1–26. [Google Scholar]
- Banić, N.; Lončarić, S. A Perceptual Measure of Illumination Estimation Error. In Proceedings of the VISAPP, Berlin, Germany, 11–14 March 2015; pp. 136–143. [Google Scholar]
- Hordley, S.D.; Finlayson, G.D. Re-evaluating colour constancy algorithms. In Proceedings of the 17th International Conference on Pattern Recognition, Cambridge, UK, 23–26 August 2004; pp. 76–79. [Google Scholar]
- Finlayson, G.D.; Hordley, S.D.; Morovic, P. Colour constancy using the chromagenic constraint. In Proceedings of the IEEE Computer Society Conference on Computer Vision and Pattern Recognition, San Diego, CA, USA, 20–26 June 2005; pp. 1079–1086. [Google Scholar]
- Fredembach, C.; Finlayson, G. Bright chromagenic algorithm for illuminant estimation. J. Imaging Sci. Technol. 2008, 52, 40906-1. [Google Scholar] [CrossRef]
- Ciurea, F.; Funt, B. A large image database for color constancy research. In Proceedings of the Color and Imaging Conference, Scottsdale, AZ, USA, 3–7 November 2003; pp. 160–164. [Google Scholar]
- Joze, V.; Reza, H. Estimating the Colour of the Illuminant Using Specular Reflection and Exemplar-Based Method. Ph.D. Thesis, School of Computing Science, Simon Fraser University, Vancouver, BC, Canada, 2013. [Google Scholar]
- Rumsey, D.J. U Can: Statistics for Dummies; John Wiley & Sons: Hoboken, NJ, USA, 2015. [Google Scholar]
- Shi, L.; Funt, B. Re-Processed Version of the Gehler Color Constancy Dataset of 568 Images. Available online: http://www.cs.sfu.ca/~colour/data/ (accessed on 1 October 2018).
- Finlayson, G.D.; Hemrit, G.; Gijsenij, A.; Gehler, P. A Curious Problem with Using the Colour Checker Dataset for Illuminant Estimation. In Proceedings of the Color and Imaging Conference, Lillehammer, Norway, 11–15 September 2017; pp. 64–69. [Google Scholar]
- Lynch, S.E.; Drew, M.S.; Finlayson, K.G.D. Colour Constancy from Both Sides of the Shadow Edge. In Proceedings of the Color and Photometry in Computer Vision Workshop at the International Conference on Computer Vision, Melbourne, Australia, 15–18 September 2013. [Google Scholar]
- Banić, N.; Lončarić, S. Color Constancy—Image Processing Group. Available online: http://www.fer.unizg.hr/ipg/resources/color_constancy/ (accessed on 29 October 2018).
© 2018 by the authors. Licensee MDPI, Basel, Switzerland. This article is an open access article distributed under the terms and conditions of the Creative Commons Attribution (CC BY) license (http://creativecommons.org/licenses/by/4.0/).