Graph-Aware and Sequence-Aware Multimodal Deep Learning Framework for Cancer Detection and Risk Analysis from Medical Imaging





Abstract
1. Introduction
2. Related Work
2.1. Convolutional Neural Networks in Medical Imaging
2.2. Attention Mechanisms for Feature Enhancement
2.3. Graph Neural Networks for Structural Modelling
2.4. Sequence-Aware Modelling in Medical Imaging
2.5. Multimodal Learning in Healthcare
2.6. Hybrid Deep Learning Architectures
Emerging Medical AI: Vision–Language Models, Knowledge Distillation and Federated Learning
2.7. Research Gap and Motivation
- -
- Lack of structural modelling: CNN-based models do not explicitly capture relationships between tumour regions.
- -
- Limited temporal analysis: Most studies treat imaging data as static and ignore ordered-view modelling.
- -
- Insufficient multimodal integration: Many models fail to effectively combine imaging and clinical data.
- -
- The reviewed studies show that CNN-based models are effective for extracting local imaging features, but they are limited in modelling long-range structural relationships between suspicious regions. Transformer-based models improve global dependency learning, although they often require large datasets and may not explicitly preserve lesion-centred medical structure. Graph-based approaches are useful for representing relationships among anatomical or lesion regions, but many do not incorporate ordered imaging inputs or clinical metadata. Multimodal approaches improve diagnostic context by integrating imaging and non-imaging variables, but many rely on simple concatenation and do not model adaptive cross-modal interactions. The proposed framework is positioned at the intersection of these limitations by combining CNN feature extraction, lesion-aware graph construction, GAT-based relational modelling, BiLSTM-based sequence-aware representation learning and cross-attention metadata fusion within a single diagnostic pipeline. Table 1 shows the strengths, limitations and connection of reviewed approaches to the proposed framework.
3. The Proposed Cancer Detection and Sequence-Aware Classification Architecture
3.1. Dataset-Specific Inputs and Leakage-Control Protocol
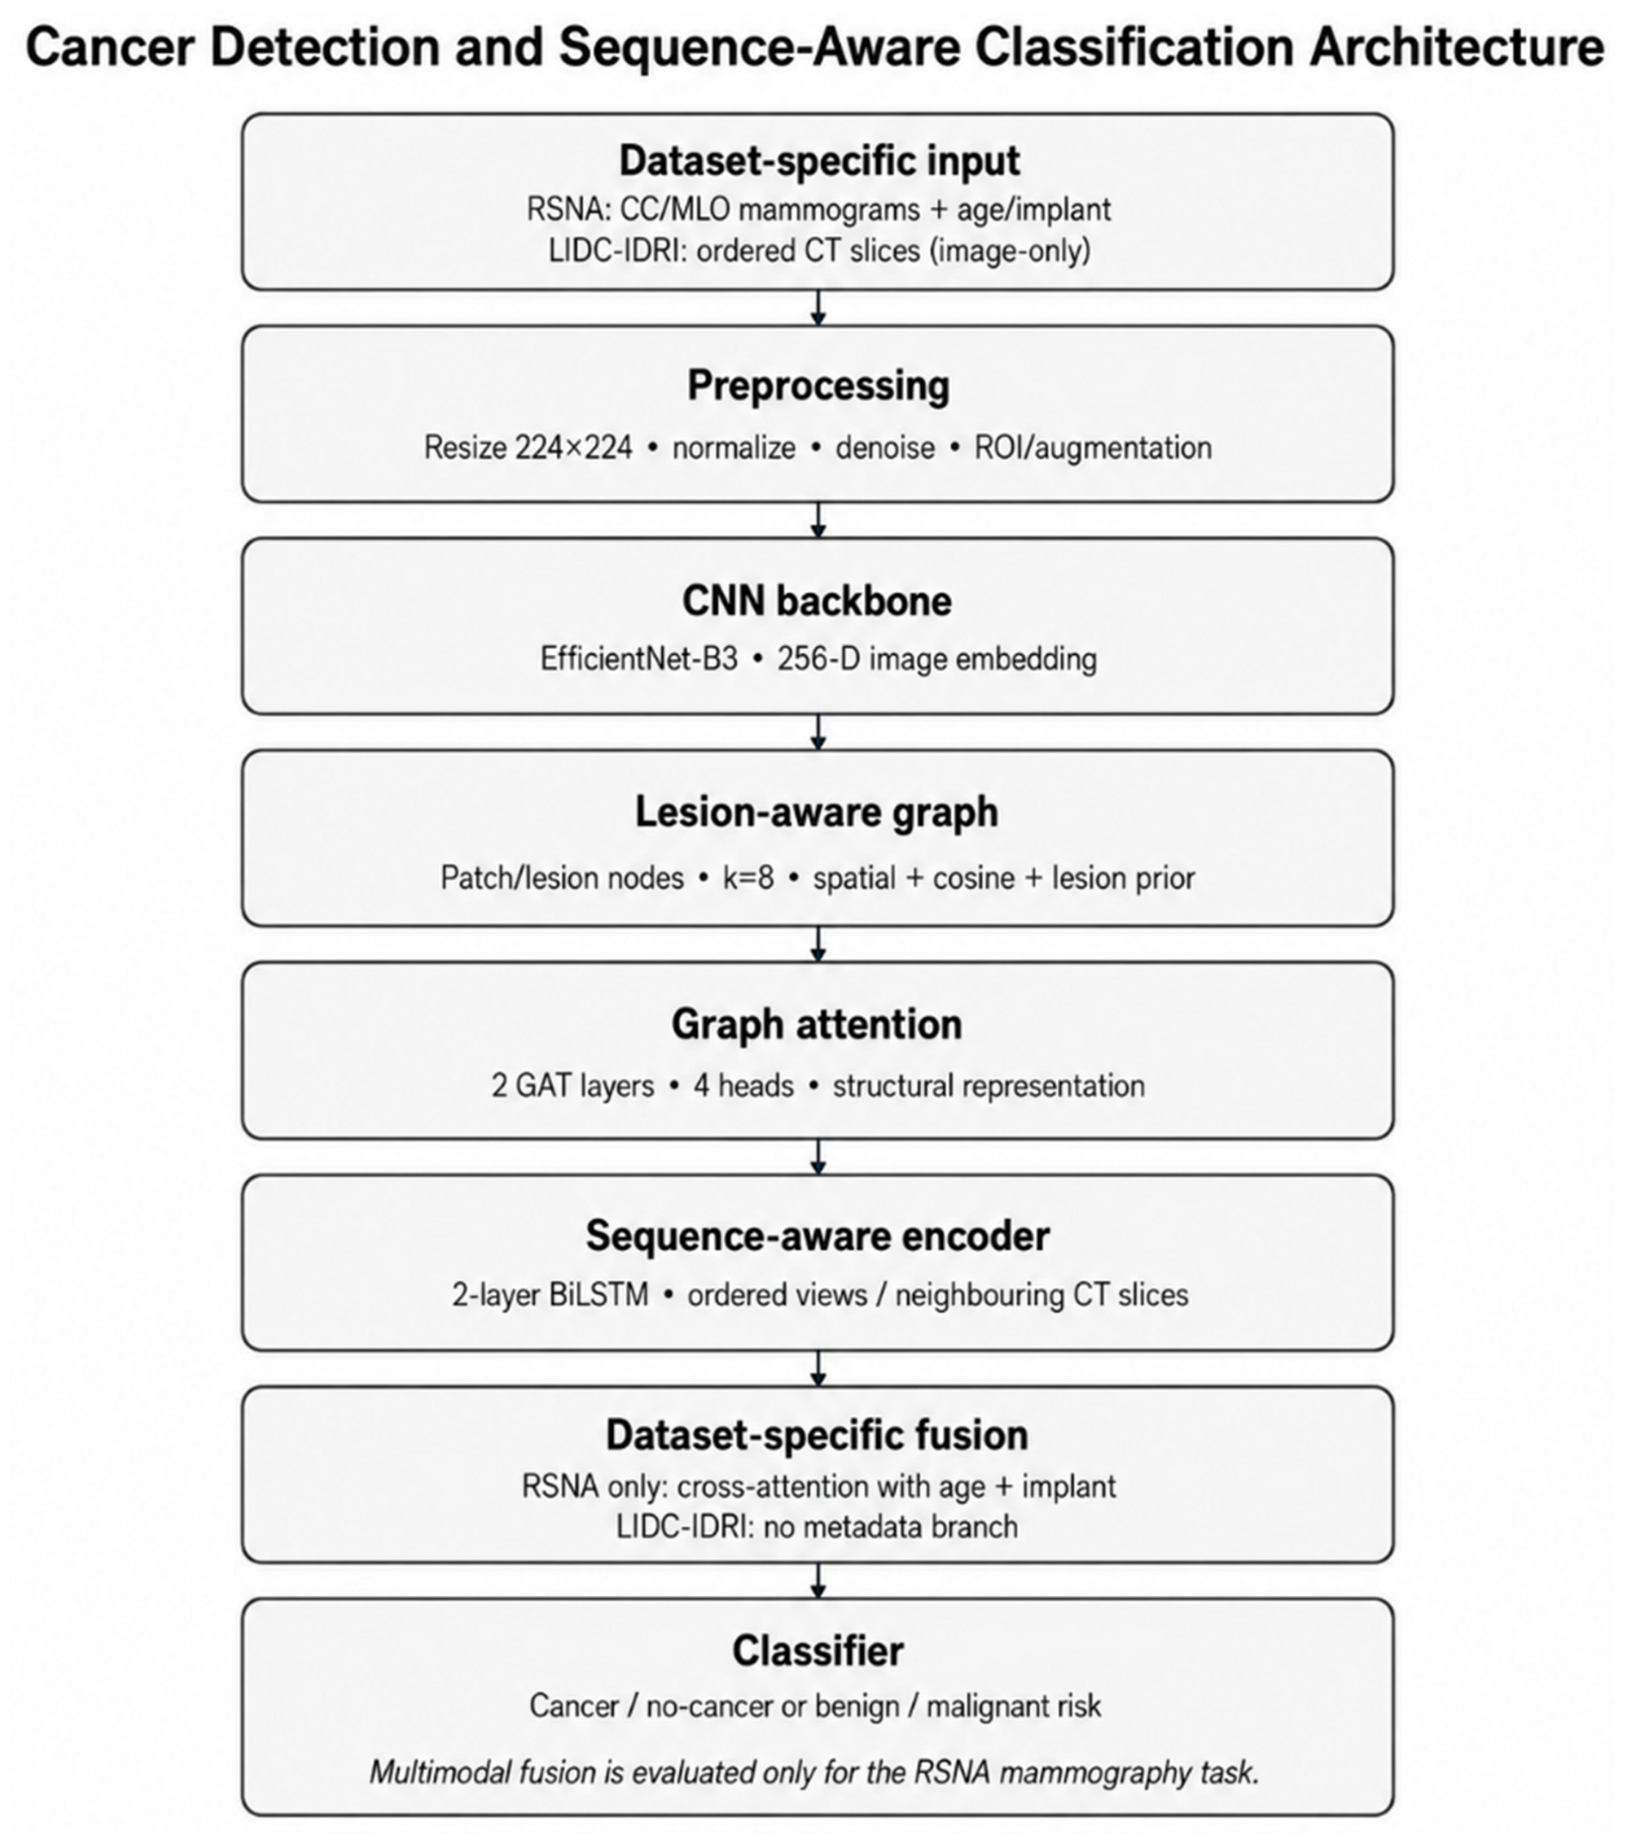
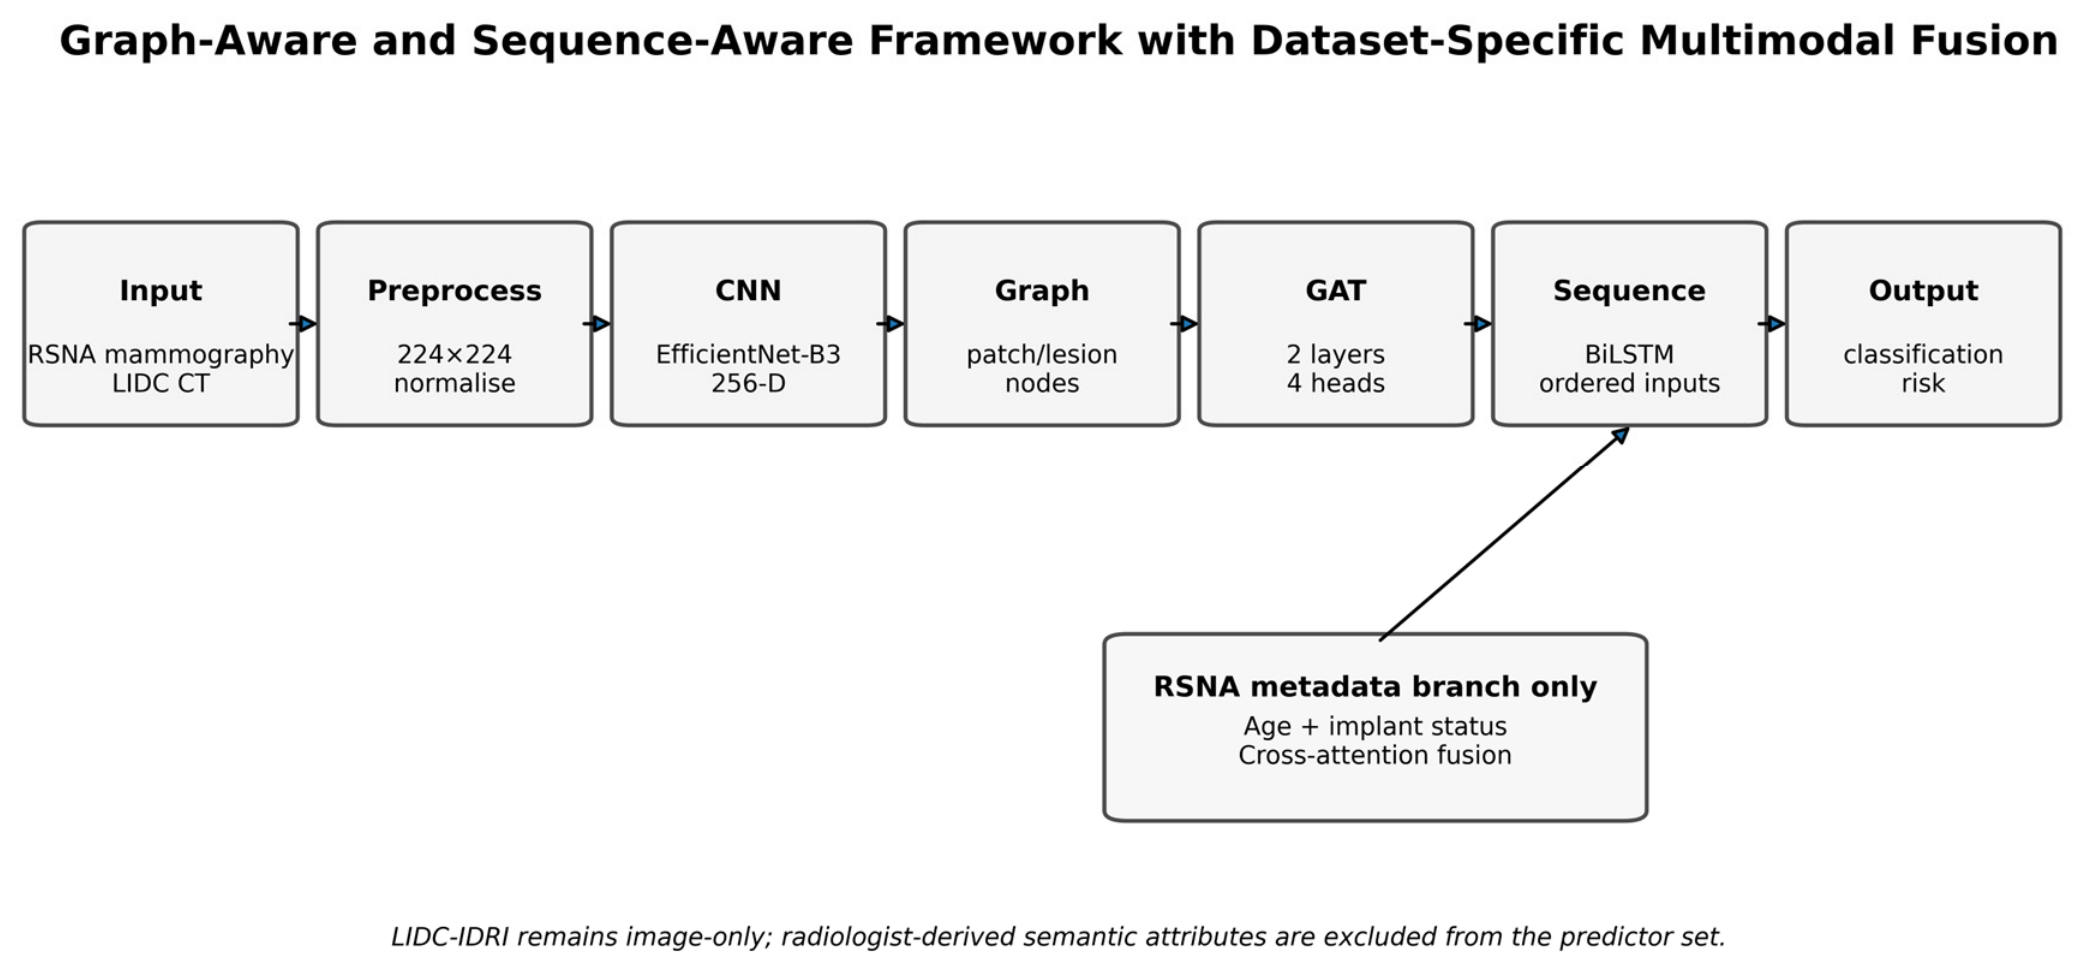
3.2. Overall Architecture
3.2.1. Dataset-Specific Inputs
3.2.2. Preprocessing and Normalisation
3.2.3. CNN Feature Extraction (EfficientNet/ResNet)
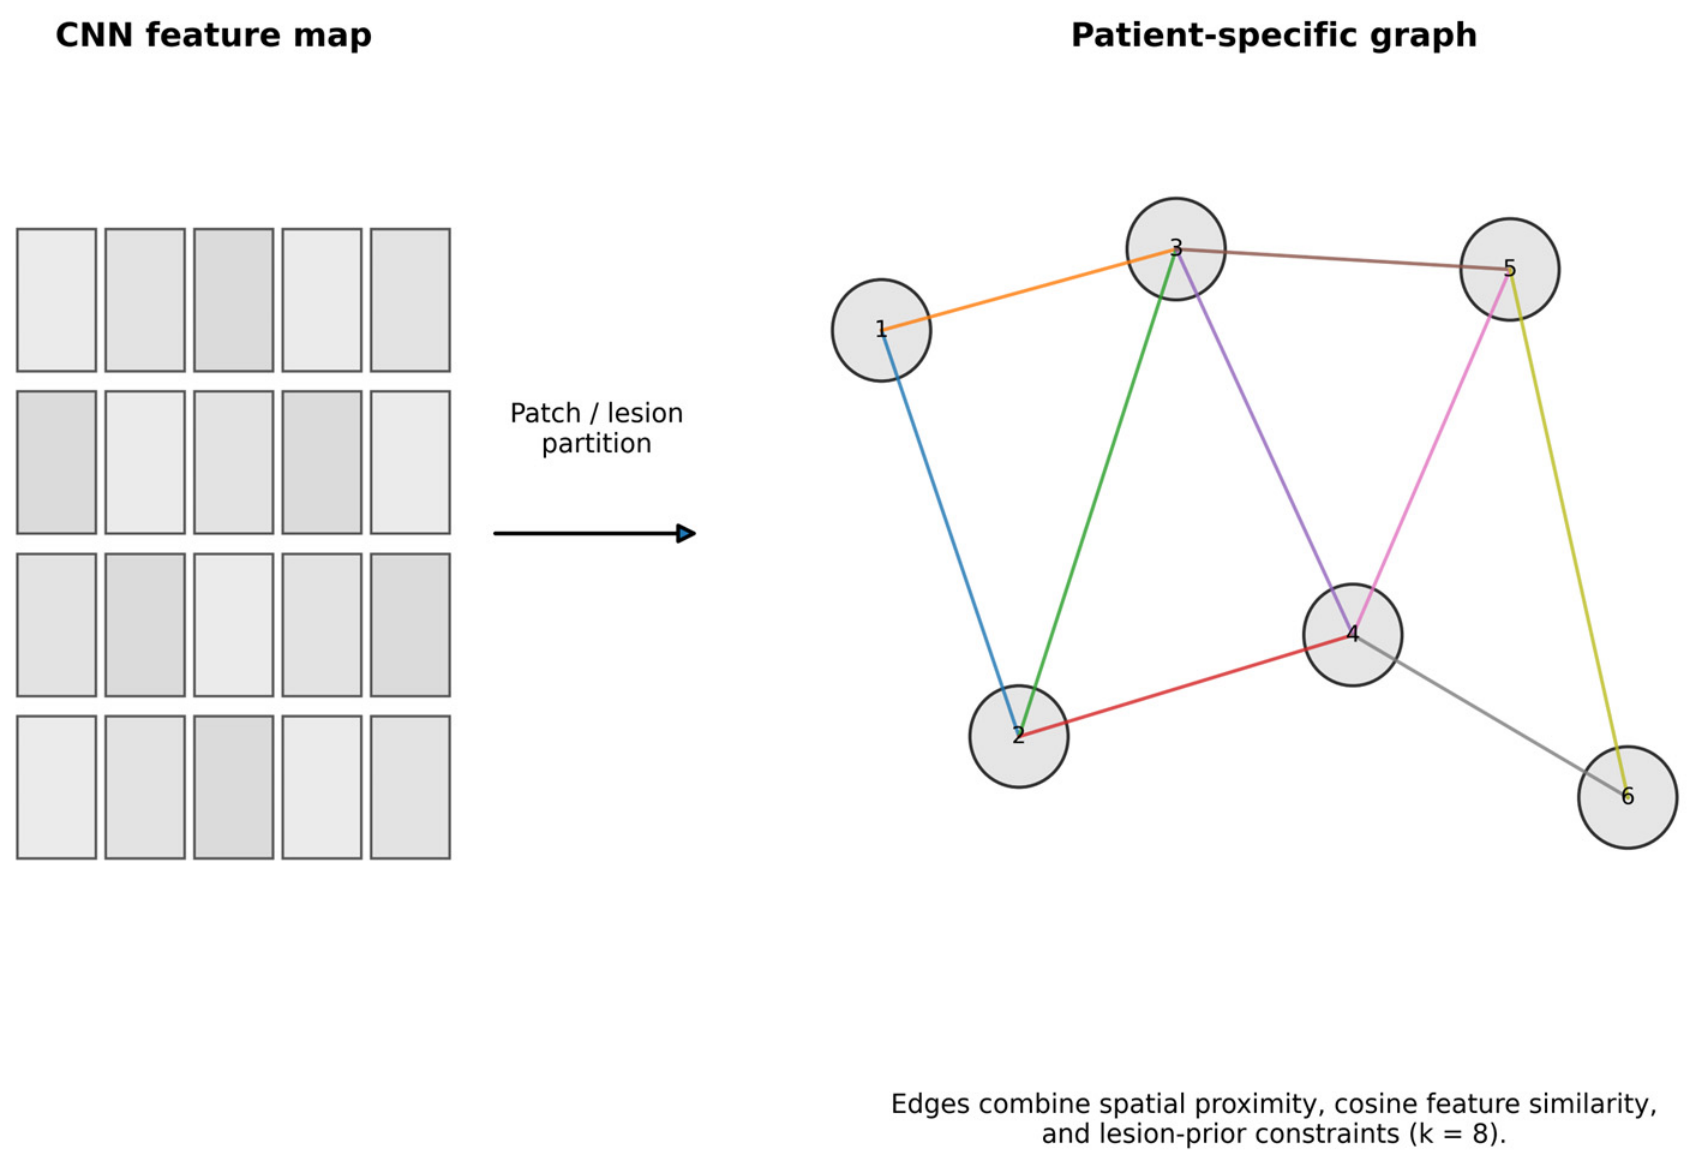
3.2.4. Graph Construction (Nodes = Patches, Edges = Relationships)
Medical-Prior-Guided Graph Construction
3.2.5. Graph Attention Network (GAT) Processing
3.2.6. Sequence-Aware Learning (BiLSTM)
3.2.7. Leakage-Safe Metadata Definition and Cross-Attention Fusion
- Cancer or malignancy outcome labels;
- Biopsy status;
- Invasive cancer status;
- Difficult-negative-case indicators;
- Pathology or follow-up outcomes;
- Any field created after diagnostic assessment;
- Any variable derived directly from the target label.
- Imaging architecture without metadata;
- Imaging architecture with direct metadata concatenation;
- Imaging architecture with cross-attention metadata fusion.
3.2.8. Classification Output
3.3. Graph Construction and Representation
3.4. Graph Attention Network (GAT)
3.5. Classification Layer
3.6. Algorithmic Representation
| Algorithm 1 Graph-Aware Sequence-Aware Multimodal Deep Learning |
| Input: Medical images and clinical data Output: Prediction (cancer diagnosis and progression risk) 1. For each patient to do 2. Preprocess image (resize, normalise, denoise, augment, ROI extraction) 3. Extract feature map 4. Construct graph (nodes = patches, edges = proximity + similarity) 5. Obtain node features 6. Update node representations using GAT: For to do Compute attention coefficients 7. Obtain graph representation 8. End For 9. Form ordered imaging sequence 10. Compute sequence-aware representation 11. Fuse imaging and clinical features using cross-attention to obtain 13. Compute prediction 15. End |
4. Results and Discussion
4.1. Experimental Setup
Implementation Details and Training Configuration
4.2. Evaluation Metrics
4.3. Performance Evaluation Against Mainstream Medical Imaging Models
4.4. Dataset-Wise Performance Analysis
4.5. Ablation Study
4.5.1. Leakage-Safe Metadata Ablation on the RSNA Dataset
4.5.2. SHAP-Based Clinical Metadata Contribution Analysis
4.5.3. Why Cross-Attention Instead of Concatenation?
4.6. Hyperparameter Sensitivity Analysis
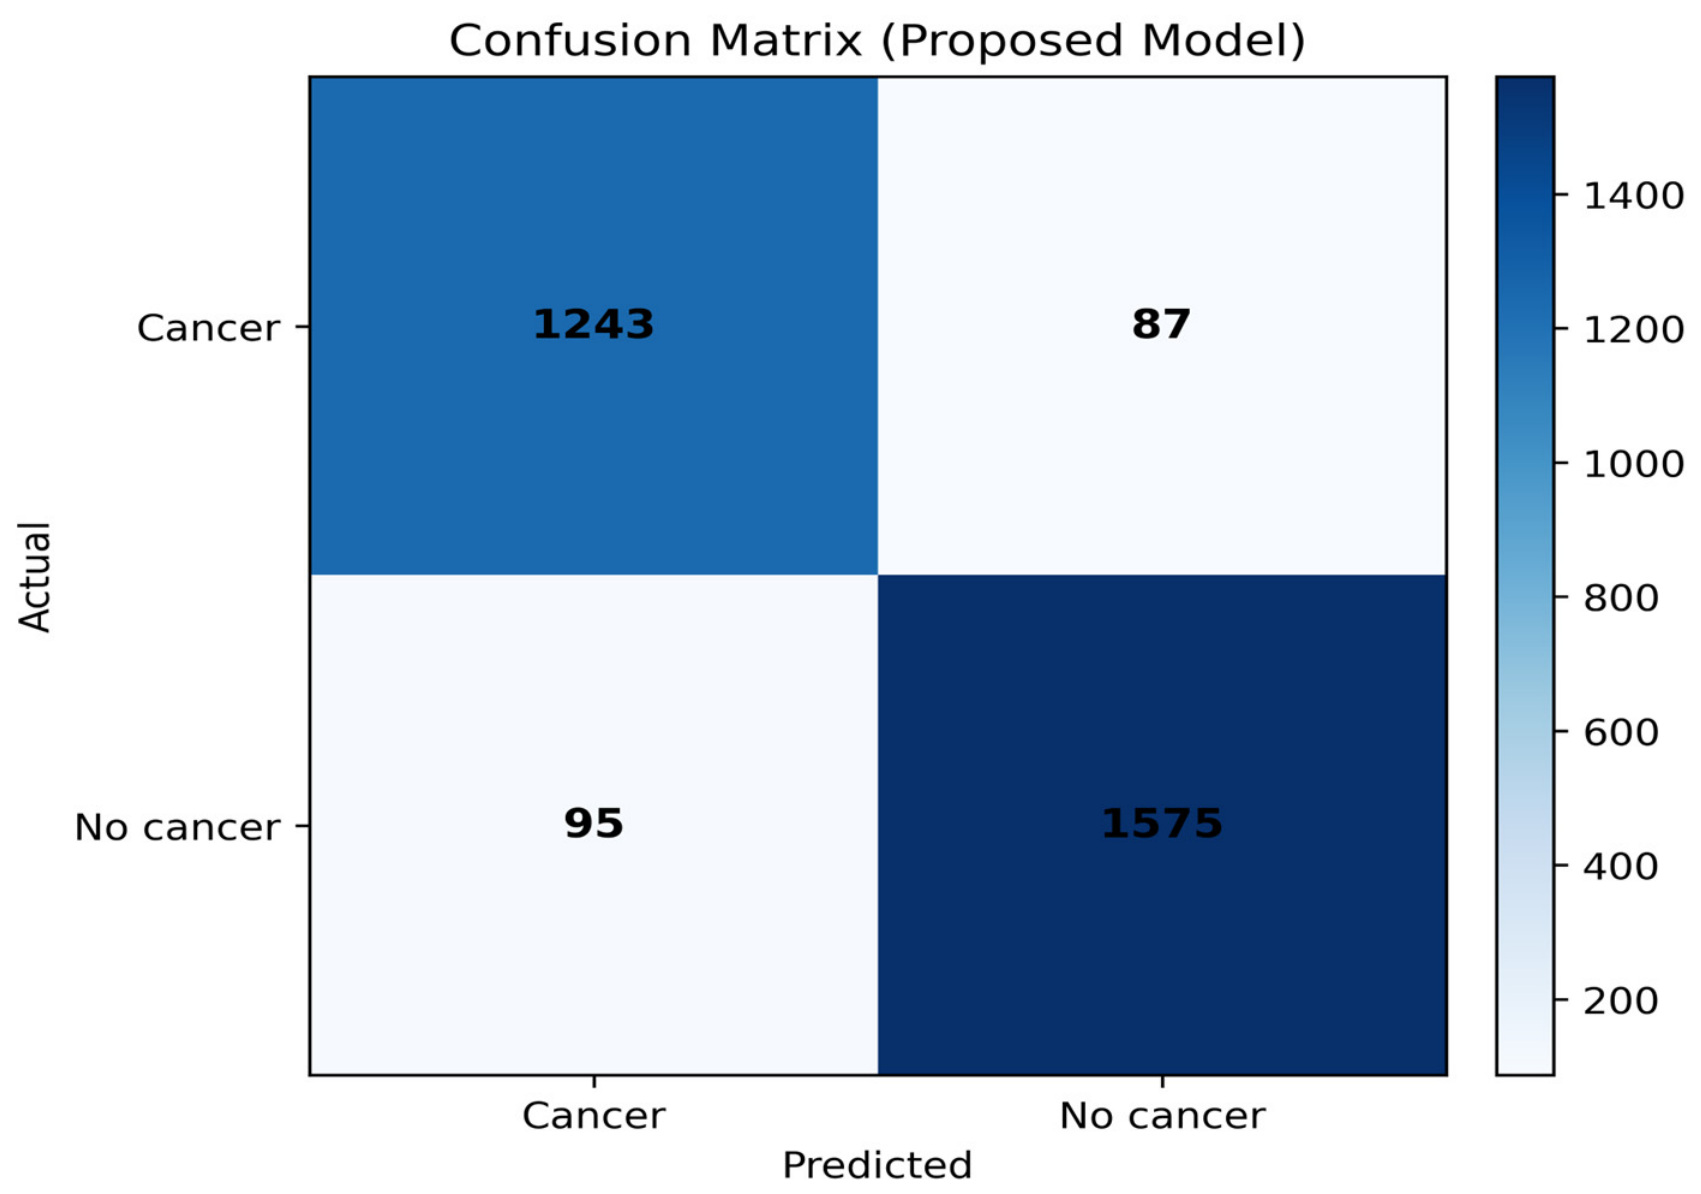
4.7. Confusion Matrix Analysis
4.8. ROC Curve Analysis
4.9. Qualitative Analysis (Interpretability)
4.10. Computational Complexity
4.11. Comparison of Multimodal Fusion Strategies
4.12. Summary of Results
4.13. Discussion: Architectural Implications and Future Research Directions
5. Conclusions
Author Contributions
Funding
Institutional Review Board Statement
Informed Consent Statement
Data Availability Statement
Acknowledgments
Conflicts of Interest
References
- Litjens, G.; Kooi, T.; Bejnordi, B.E.; Setio, A.A.A.; Ciompi, F.; Ghafoorian, M.; van der Laak, J.A.W.M.; van Ginneken, B.; Sanchez, C.I. A survey on deep learning in medical image analysis. Med. Image Anal. 2017, 42, 60–88. [Google Scholar] [CrossRef] [Scilit]
- Esteva, A.; Kuprel, B.; Novoa, R.A.; Ko, J.; Swetter, S.; Blau, H.M.; Thrun, S. Dermatologist-level classification of skin cancer with deep neural networks. Nature 2017, 542, 115–118. [Google Scholar] [CrossRef] [Scilit]
- Jetley, S.; Lord, N.A.; Lee, N.; Torr, P.H.S. Learn to pay attention. In Proceedings of the International Conference on Learning Representations (ICLR), Vancouver, BC, Canada, 30 April–3 May 2018. [Google Scholar]
- Schlemper, J.; Oktay, O.; Schaap, M.; Heinrich, M.; Kainz, B.; Glocker, B.; Rueckert, D. Attention gated networks: Learning to leverage salient regions in medical images. Med. Image Anal. 2019, 53, 197–207. [Google Scholar] [CrossRef] [Scilit]
- Kipf, T.N.; Welling, M. Semi-supervised classification with graph convolutional networks. In Proceedings of the International Conference on Learning Representations (ICLR), Toulon, France, 24–26 April 2017. [Google Scholar]
- Velickovic, P.; Cucurull, G.; Casanova, A.; Romero, A.; Lio, P.; Bengio, Y. Graph attention networks. In Proceedings of the International Conference on Learning Representations (ICLR), Vancouver, BC, Canada, 30 April–3 May 2018. [Google Scholar]
- Hochreiter, S.; Schmidhuber, J. Long short-term memory. Neural Comput. 1997, 9, 1735–1780. [Google Scholar] [CrossRef] [Scilit]
- Graves, A.; Schmidhuber, J. Framewise phoneme classification with bidirectional LSTM networks. In Proceedings of the International Joint Conference on Neural Networks (IJCNN), Montreal, QC, Canada, 31 July–4 August 2005; pp. 2047–2052. [Google Scholar]
- Vaswani, A.; Shazeer, N.; Parmar, N.; Uszkoreit, J.; Jones, L.; Gomez, A.N.; Kaiser, L.; Polosukhin, I. Attention is all you need. In Proceedings of the 31st Conference on Neural Information Processing Systems, Long Beach, CA, USA, 4–9 December 2017; pp. 6000–6010. [Google Scholar]
- Baltrusaitis, T.; Ahuja, C.; Morency, L.P. Multimodal machine learning: A survey and taxonomy. IEEE Trans. Pattern Anal. Mach. Intell. 2019, 41, 423–443. [Google Scholar] [CrossRef] [Scilit]
- He, K.; Zhang, X.; Ren, S.; Sun, J. Deep residual learning for image recognition. In Proceedings of the IEEE Conference on Computer Vision and Pattern Recognition (CVPR), Las Vegas, NV, USA, 26 June–1 July 2016; pp. 770–778. [Google Scholar]
- Tan, M.; Le, Q. EfficientNet: Rethinking model scaling for convolutional neural networks. In Proceedings of the 36th International Conference on Machine Learning (ICML), Long Beach, CA, USA, 9–15 June 2019; pp. 6105–6114. [Google Scholar]
- Dosovitskiy, A.; Beyer, L.; Kolesnikov, A.; Weissenborn, D.; Zhai, X.; Unterthiner, T.; Dehghani, M.; Minderer, M.; Heigold, G.; Gelly, S.; et al. An image is worth 16 × 16 words: Transformers for image recognition at scale. In Proceedings of the International Conference on Learning Representations (ICLR), Vienna, Austria, 3–7 May 2021. [Google Scholar]
- Liu, Z.; Lin, Y.; Cao, Y.; Hu, H.; Wei, Y.; Zhang, Z.; Lin, S.; Guo, B. Swin Transformer: Hierarchical vision transformer using shifted windows. In Proceedings of the International Conference on Computer Vision (ICCV), Montreal, QC, Canada, 11–17 October 2021; pp. 10012–10022. [Google Scholar]
- Hatamizadeh, A.; Nath, V.; Tang, Y.; Yang, D.; Roth, H.R.; Xu, D. Swin UNETR: Swin Transformers for semantic segmentation of brain tumours in MRI images. Med. Image Anal. 2023, 84, 102716. [Google Scholar]
- Armato, S.G.; McLennan, G.; Bidaut, L.; McNitt-Gray, M.F.; Meyer, C.R.; Reeves, A.P.; Zhao, B.; Aberle, D.R.; Henschke, C.I.; Hoffman, E.A.; et al. The Lung Image Database Consortium (LIDC) and Image Database Resource Initiative (IDRI). Med. Physic. 2011, 38, 915–931. [Google Scholar] [CrossRef] [Scilit]
- RSNA. RSNA Screening Mammography Breast Cancer Detection AI Challenge Dataset. Kaggle. 2023. Available online: https://www.kaggle.com/competitions/rsna-breast-cancer-detection (accessed on 25 June 2026).
- LIDC-IDRI Dataset. Lung Image Database Consortium and Image Database Resource Initiative. Available online: https://www.cancerimagingarchive.net/collection/lidc-idri/ (accessed on 26 June 2026).
- Selvaraju, R.R.; Cogswell, M.; Das, A.; Vedantam, R.; Parikh, D.; Batra, D. Grad-CAM: Visual explanations from deep networks via gradient-based localization. In Proceedings of the International Conference on Computer Vision (ICCV), Venice, Italy, 22–29 October 2017. [Google Scholar]
- Lundberg, S.M.; Lee, S.I. A unified approach to interpreting model predictions. In Proceedings of the 31st Conference on Neural Information Processing Systems, Long Beach, CA, USA, 4–9 December 2017; pp. 4768–4777. [Google Scholar]
- Mienye, I.D.; Viriri, S. Graph neural networks in medical imaging: Methods, applications and future directions. Information 2025, 16, 1051. [Google Scholar] [CrossRef] [Scilit]
- Chowa, S.S.; Azam, S.; Montaha, S.; Payel, I.J.; Bhuiyan, M.R.I.; Hasan, M.Z.; Jonkman, M. Graph neural network-based breast cancer diagnosis using clinically significant imaging features. J. Cancer Res. Clin. Oncol. 2023, 149, 14885–14899. [Google Scholar] [CrossRef] [Scilit]
- Hendrix, W.; Hendrix, N.; Scholten, E.T.; Mourits, M.; Trap-de Jong, J.; Schalekamp, S.; Korst, M.; van Leuken, M.; van Ginneken, B.; Prokop, M.; et al. Deep learning for the detection of benign and malignant pulmonary nodules in CT scans. Commun. Med. 2023, 3, 135. [Google Scholar] [CrossRef] [Scilit]
- Huang, S.C.; Pareek, A.; Seyyedi, S.; Banerjee, I.; Lungren, M.P. Fusion of medical imaging and electronic health records using deep learning: A systematic review and implementation guidelines. npj Digit. Med. 2023, 6, 24. [Google Scholar]
- Chen, R.J.; Lu, M.Y.; Williamson, D.F.K.; Chen, T.Y.; Lipkova, J.; Mahmood, F. Pan-cancer integrative histology-genomic analysis via multimodal deep learning. Nat. Mach. Intell. 2023, 5, 362–373. [Google Scholar]
- Chen, Y.; Partridge, G.J.W.; Vazirabad, M.; Ball, R.L.; Trivedi, H.M.; Campos Kitamura, F.; Frazer, H.M.L.; Retson, T.A.; Yao, L.; Darker, I.T.; et al. Performance of algorithms submitted in the 2023 RSNA Screening Mammography Breast Cancer Detection AI Challenge. Radiology 2025, 315, e241447. [Google Scholar] [CrossRef] [Scilit]
- Crasta, L.J.; Neema, R.; Pasi, A.R. A deep learning framework for lung nodule segmentation and lung cancer classification in CT imaging. Healthc. Anal. 2024, 5, 100298. [Google Scholar]
- Liz-López, H.; Anguera de Sojo-Hernández, Á.; D’Antonio-Maceiras, S.; Díaz-Martínez, M.A.; Camacho, D. Deep learning innovations in the detection of lung cancer: A review of recent progress. Cogn. Comput. 2025, 17, 10408. [Google Scholar]
- Li, Y.; Zhang, J.; Wang, H.; Liu, X. Graph-based representation learning for cancer diagnosis from multimodal medical data. Comput. Biol. Med. 2024, 170, 107924. [Google Scholar]
- Zhou, T.; Chen, X.; Wang, L.; Zhang, H. Multimodal transformer architectures for medical image classification and prognosis prediction: A review. Artif. Intell. Med. 2024, 148, 102748. [Google Scholar]
- Wu, J.; Liu, S.; Zhao, X.; Chen, K. Explainable graph neural networks for tumour classification and localisation in medical imaging. IEEE J. Biomed. Health Inform. 2024, 28, 3564–3576. [Google Scholar]
- Zhang, Y.; Wang, Z.; Li, H.; Xu, C. Cross-attention multimodal fusion for cancer diagnosis using imaging and clinical information. Expert Syst. Appl. 2024, 245, 123456. [Google Scholar]
- Liu, Q.; Chen, Y.; Zhang, X.; Huang, J. Temporal representation learning in medical imaging: Recent advances and future directions. Pattern Recogn. 2025, 158, 110962. [Google Scholar]
- Li, X.; Li, L.; Jiang, Y.; Wang, H.; Qiao, X.; Feng, T.; Luo, H.; Zhao, Y. Vision-Language Models in medical image analysis: From simple fusion to general large models. Inform. Fusion 2025, 118, 102995. [Google Scholar] [CrossRef] [Scilit]
- Li, X.; Li, L.; Li, M.; Yan, P.; Feng, T.; Luo, H.; Zhao, Y.; Yin, S. Knowledge distillation and teacher-student learning in medical imaging: Comprehensive overview, pivotal role, and future directions. Med. Image Anal. 2025, 107, 103819. [Google Scholar] [CrossRef] [Scilit]
- Sun, Y.; Li, X.; Li, L.; Feng, T.; Zhao, Y.; Yin, S. PHH-FL: Perceptual Hashing Hypernetwork Personalized Federated Learning for Heterogeneous Medical Image Analysis Tasks. IEEE Internet Things J. 2025, 13, 8712–8724. [Google Scholar] [CrossRef] [Scilit]





| Approach | Strength | Remaining Limitation | Connection to Proposed Framework |
|---|---|---|---|
| CNN-based models | Strong local texture and boundary extraction | Weak explicit region-to-region structural modelling | CNN backbone is retained for robust feature extraction |
| Transformer-based models | Improved global dependency learning | High data and computational requirements; limited lesion-prior encoding | Compared as baselines; graph attention provides structural bias |
| Graph-based methods | Model anatomical and lesion relationships | Often image-only and not sequence-aware | Extended using lesion-aware graph construction and GAT |
| Multimodal fusion | Adds clinical context | Concatenation is static and not patient-specific | Cross-attention learns adaptive image–metadata interactions |
| Sequence-aware models | Learn dependencies across ordered inputs | Often overclaimed without longitudinal labels | BiLSTM is used only for ordered views and CT slice continuity |
| Dataset | Variable | Role | Included as Model Input? | Reason |
|---|---|---|---|---|
| RSNA | Mammography images | Imaging predictor | Yes | Primary screening input |
| RSNA | Age | Pre-diagnostic metadata | Yes | Available before outcome determination |
| RSNA | Implant status | Pre-diagnostic metadata | Yes | Available at image acquisition |
| RSNA | Laterality | Input organisation | No metadata fusion | Used to group breast-level images |
| RSNA | View | Sequence organisation | No metadata fusion | Used to order CC and MLO views |
| RSNA | Cancer label | Target | No | Direct prediction outcome |
| RSNA | Biopsy status | Post-diagnostic variable | No | Leakage risk |
| RSNA | Invasive status | Post-diagnostic variable | No | Leakage risk |
| RSNA | Difficult-negative indicator | Outcome-related variable | No | Leakage risk |
| LIDC-IDRI | CT slices | Imaging predictor | Yes | Primary imaging input |
| LIDC-IDRI | Malignancy score | Target definition | No | Direct label information |
| LIDC-IDRI | Subtlety, margin, spiculation, texture and related ratings | Radiologist image annotations | No in primary model | Not independent clinical metadata |
| LIDC-IDRI | Slice order | Sequence organisation | Yes | Represents volumetric continuity |
| Step | Algorithm Step | Explanation |
|---|---|---|
| 1 | Input: Medical images (X = {X1, X2, …, XN}) and clinical data (C = {c1, c2, …, cN}) | The model receives medical imaging data (e.g., CT, MRI, mammograms) along with associated clinical metadata such as age, history, and diagnostic attributes for each patient. |
| 2 | Output: Prediction () | The model outputs cancer diagnosis (cancer/no cancer, benign/malignant) and progression risk level. |
| 3 | for each patient (i = 1) to (N) | The algorithm processes each patient individually through the pipeline. |
| 4 | Preprocess image (Xi) | Images are resized, normalised, denoised, and augmented. Region of interest (ROI) extraction ensures focus on relevant anatomical regions. |
| 5 | Extract feature map () | A CNN backbone (e.g., EfficientNet/ResNet) extracts spatial features such as texture, edges, and tumour characteristics. |
| 6 | Construct graph (Gi = (Vi, Ei)) | Feature maps are divided into patches (nodes), and edges are created based on spatial proximity and feature similarity to form a graph structure. |
| 7 | Obtain node features | Each node is assigned an embedding vector derived from patch-level features, representing initial node representations. |
| 8 | Update node representations using GAT | A GAT computes attention coefficients and updates node features by aggregating neighbouring node information with learned importance weights. |
| 9 | Obtain graph representation (Zi) | Node features are aggregated (e.g., via global pooling) to produce a fixed-length graph-level representation. |
| 10 | End for (graph processing) | Completes graph construction and representation for each patient. |
| 11 | Form ordered imaging sequence ({Z1, Z2, …, ZT}) | Graph representations from multiple scans or views are ordered to form an ordered imaging sequence for each patient. |
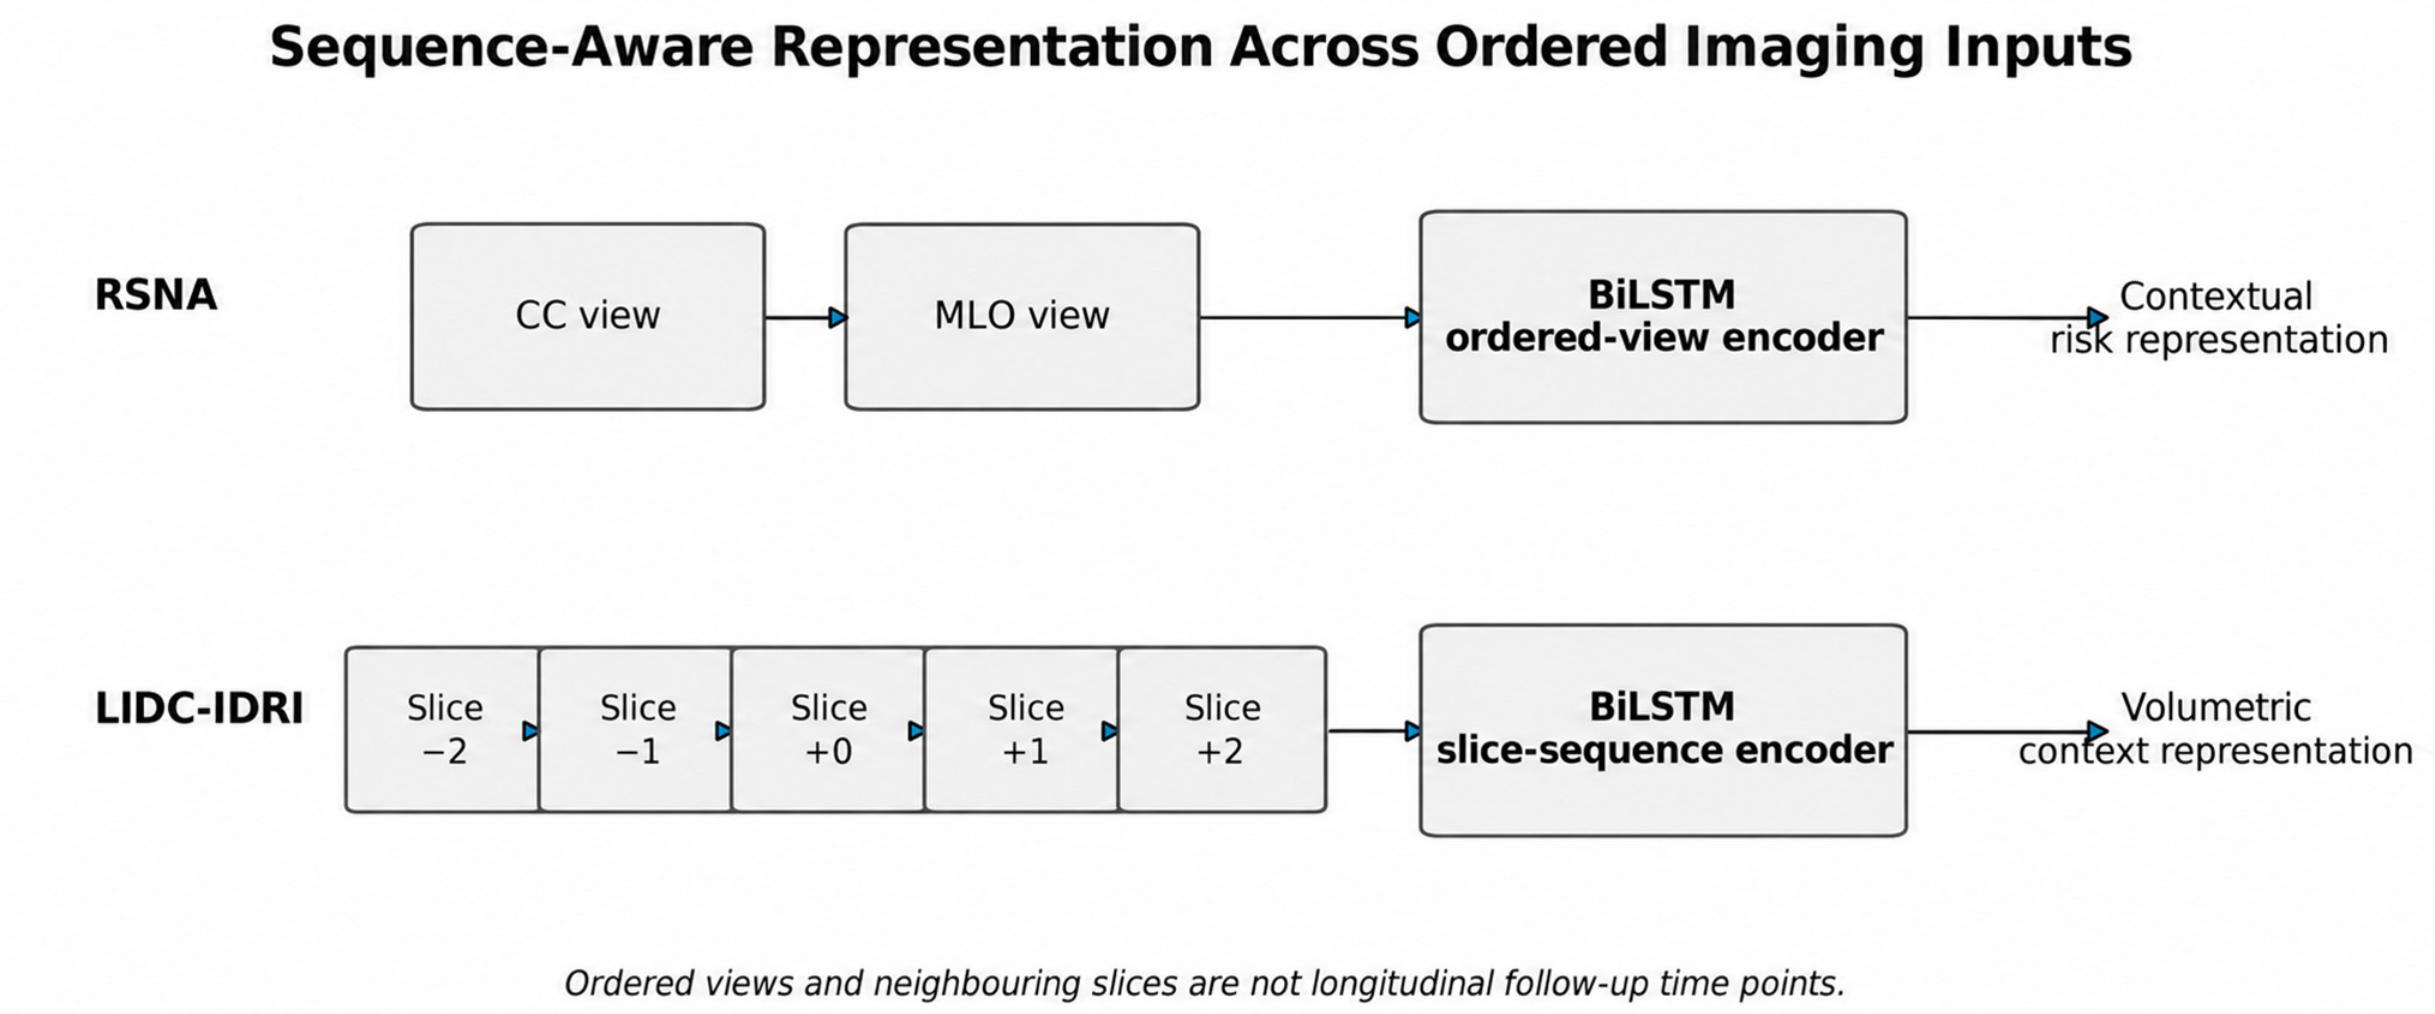
| 12 | Compute sequence-aware representation (Ht) | A BiLSTM processes the sequence to capture dependencies across ordered imaging inputs. |
| 13 | Fuse features using cross-attention to obtain (Hf) | Imaging features and clinical data are fused using cross-attention, enabling interaction between modalities. |
| 14 | Pass (Hf) through fully connected layers | Dense layers transform fused features into a representation suitable for classification. |
| 15 | Compute prediction | Final predictions are generated using a Softmax (or sigmoid) function. |
| 16 | Compute loss and update parameters | The loss is calculated (e.g., cross-entropy), and model parameters are updated via backpropagation. |
| 17 | End | Terminates the algorithm after processing all patients. |
| Parameter | Value |
|---|---|
| Batch Size | 32 |
| Learning Rate | 0.0001 |
| Optimizer | Adam (Adaptive Moment Estimation) |
| Epochs | 50 |
| Loss Function | Cross-Entropy |
| Dropout | 0.5 |
| Split strategy | Patient-wise stratified train/validation/test split |
| Validation | Mean +/− SD over ≥ 3 runs; early stopping by validation AUC |
| Seed | Fixed random seed reported |
| Hardware | GPU model, memory and CUDA/PyTorch version reported |
| Component | Configuration |
|---|---|
| Input size | 224 × 224 |
| CNN backbone | EfficientNet-B3 |
| CNN output embedding | 256 |
| Patch size | 16 × 16 |
| Graph nodes | Patch-level or lesion-centred nodes |
| Edge strategy | Spatial distance + cosine similarity + lesion prior |
| k-nearest neighbours | k = 8 |
| GAT layers | 2 |
| GAT attention heads | 4 |
| GAT hidden dimensions | 256, 128 |
| BiLSTM layers | 2 |
| BiLSTM hidden size | 128 |
| Cross-attention heads | 4 |
| Dropout | 0.5 |
| Optimiser | Adam |
| Learning rate | 0.0001 |
| Batch size | 32 |
| Epochs | 50 |
| Early stopping | Validation AUC, patience = 10 |
| Dataset split | Patient-wise 70:15:15 |
| Repeated runs | 3 |
| Model | Accuracy (%) | Precision (%) | Recall (%) | F1-Score (%) | AUC |
|---|---|---|---|---|---|
| CNN (EfficientNet) | 84.2 ± 0.6 | 82.5 ± 0.7 | 80.3 ± 0.8 | 81.4 ± 0.7 | 0.88 ± 0.01 |
| CNN + Attention | 86.1 ± 0.5 | 84.3 ± 0.6 | 83.2 ± 0.7 | 83.7 ± 0.6 | 0.90 ± 0.01 |
| CNN + BiLSTM | 87.6 ± 0.5 | 85.9 ± 0.6 | 84.8 ± 0.6 | 85.3 ± 0.6 | 0.91 ± 0.01 |
| CNN + GAT | 88.4 ± 0.5 | 86.7 ± 0.6 | 85.9 ± 0.6 | 86.3 ± 0.5 | 0.92 ± 0.01 |
| CNN + Metadata Fusion | 89.3 ± 0.5 | 87.8 ± 0.6 | 86.9 ± 0.7 | 87.3 ± 0.6 | 0.93 ± 0.01 |
| CNN + Cross-Attention | 90.1 ± 0.5 | 88.6 ± 0.5 | 87.8 ± 0.6 | 88.2 ± 0.5 | 0.94 ± 0.01 |
| Swin Transformer | 88.9 ± 0.5 | 87.1 ± 0.6 | 86.2 ± 0.6 | 86.6 ± 0.6 | 0.93 ± 0.01 |
| UNETR-based classifier | 89.1 ± 0.5 | 87.3 ± 0.6 | 86.5 ± 0.6 | 86.9 ± 0.6 | 0.93 ± 0.01 |
| Proposed image-only architecture (controlled comparison) | 91.8 ± 0.4 | 90.2 ± 0.5 | 89.5 ± 0.5 | 89.8 ± 0.5 | 0.95 ± 0.01 |
| Model Variant | Accuracy (%) | Precision (%) | Recall (%) | F1-Score (%) | AUC |
|---|---|---|---|---|---|
| CNN only | 84.2 ± 0.6 | 82.5 ± 0.7 | 80.3 ± 0.8 | 81.4 ± 0.7 | 0.88 ± 0.01 |
| CNN + GAT | 88.4 ± 0.5 | 86.7 ± 0.6 | 85.9 ± 0.6 | 86.3 ± 0.5 | 0.92 ± 0.01 |
| CNN + cross-attention fusion | 90.1 ± 0.5 | 88.6 ± 0.5 | 87.8 ± 0.6 | 88.2 ± 0.5 | 0.94 ± 0.01 |
| Without BiLSTM | 87.1 ± 0.5 | 85.4 ± 0.6 | 84.2 ± 0.7 | 84.8 ± 0.6 | 0.91 ± 0.01 |
| Shuffled input order | 86.6 ± 0.6 | 84.8 ± 0.6 | 83.7 ± 0.7 | 84.2 ± 0.6 | 0.90 ± 0.01 |
| Full image-only architecture | 91.8 ± 0.4 | 90.2 ± 0.5 | 89.5 ± 0.5 | 89.8 ± 0.5 | 0.95 ± 0.01 |
| Model | Accuracy (%) | Precision (%) | Recall (%) | F1-Score (%) | AUC |
|---|---|---|---|---|---|
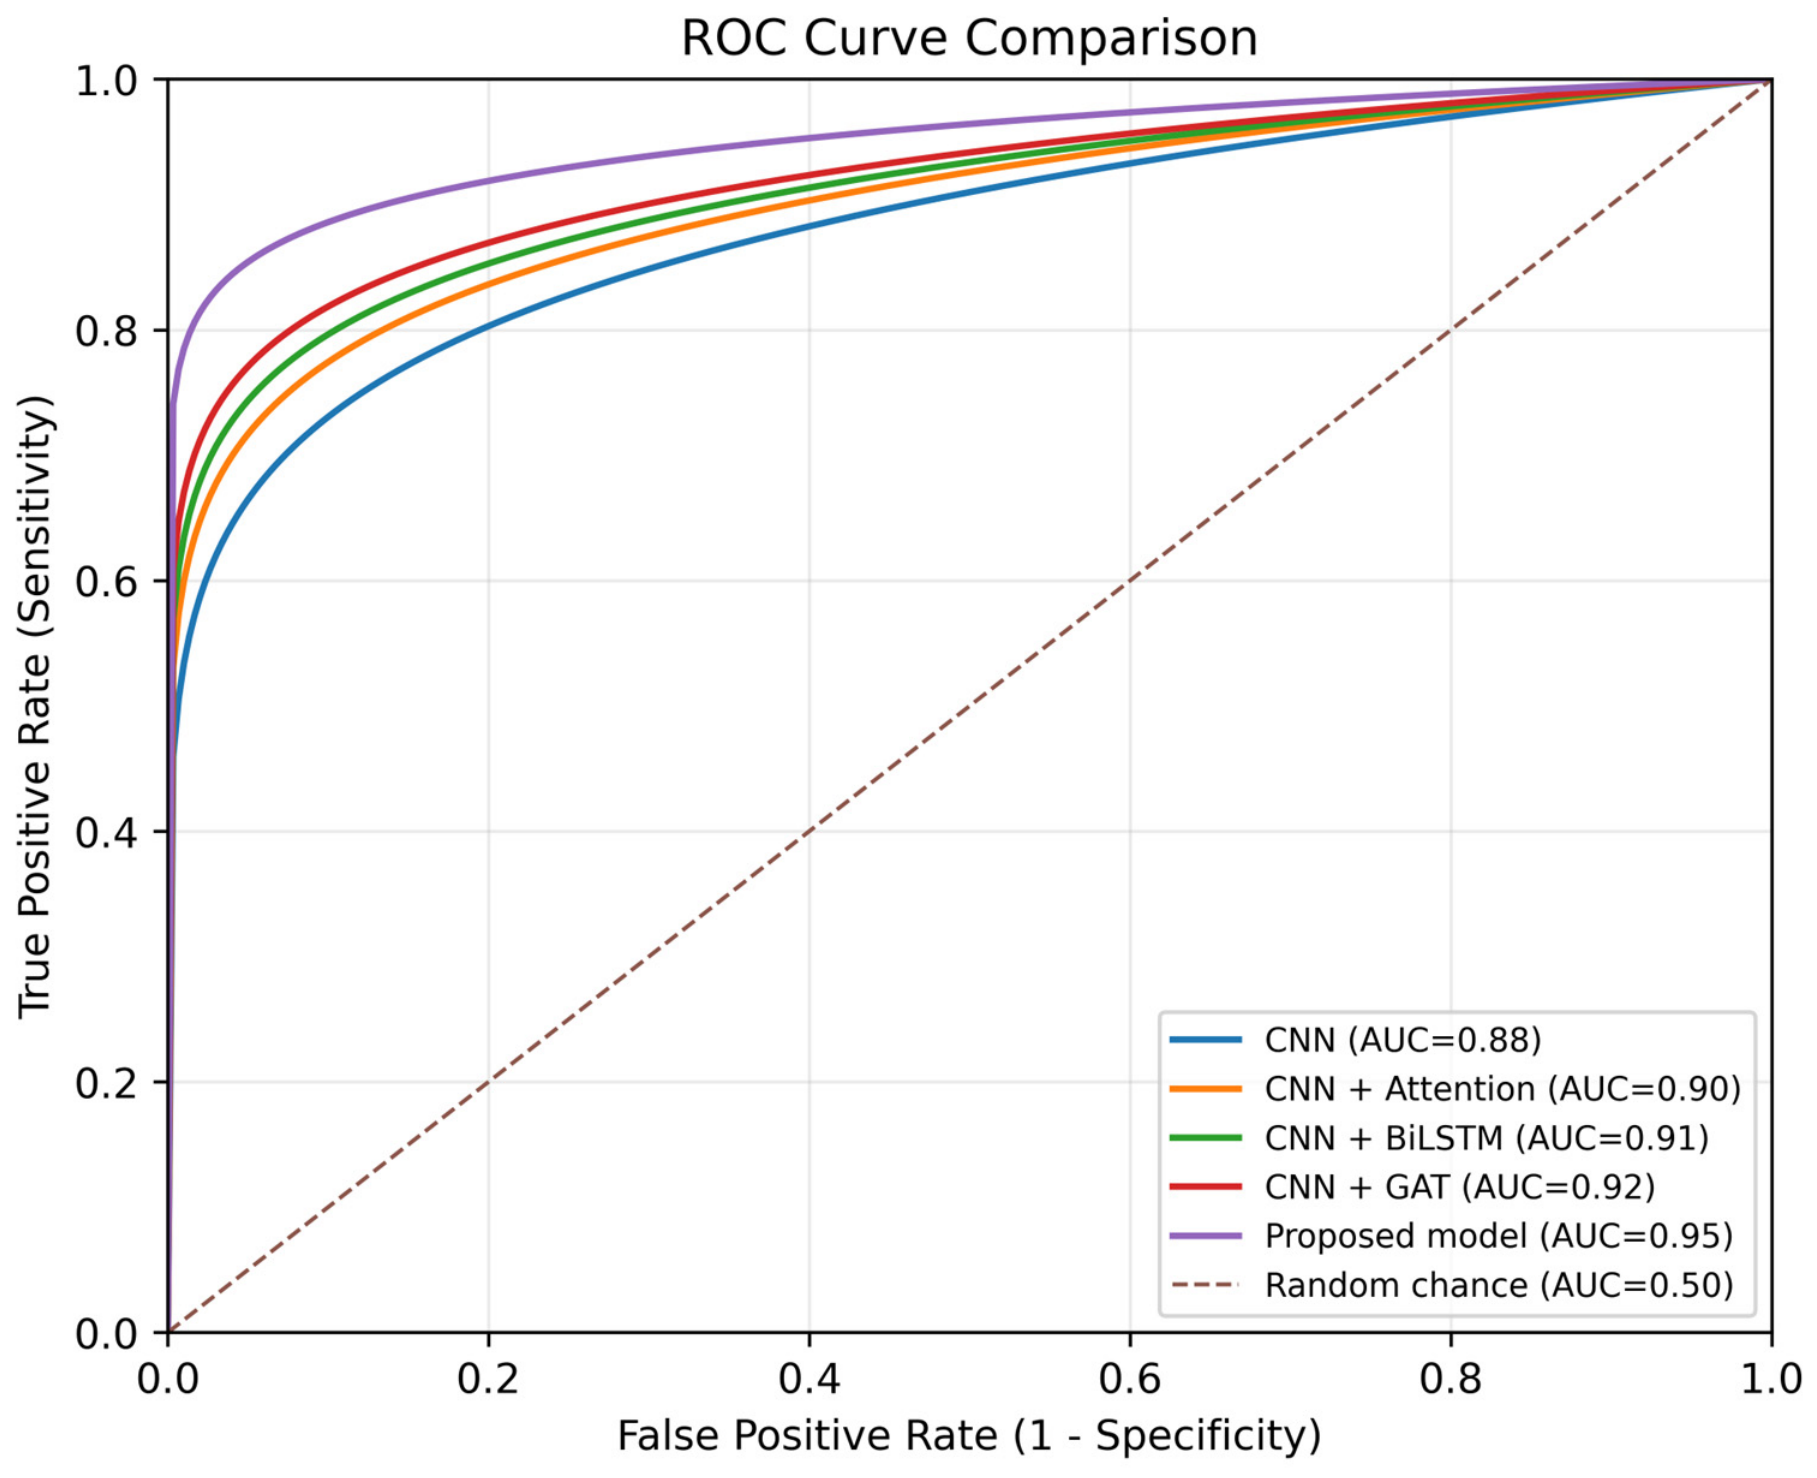
| CNN (EfficientNet) | 84.2 | 82.5 | 80.3 | 81.4 | 0.88 |
| CNN + Attention | 86.1 | 84.3 | 83.2 | 83.7 | 0.90 |
| CNN + BiLSTM | 87.6 | 85.9 | 84.8 | 85.3 | 0.91 |
| CNN + GAT | 88.4 | 86.7 | 85.9 | 86.3 | 0.92 |
| Proposed image-only architecture | 91.8 | 90.2 | 89.5 | 89.8 | 0.95 |
| ResNet-50 baseline | 85.6 +/− 0.7 | 83.8 +/− 0.8 | 82.1 +/− 0.9 | 82.9 +/− 0.8 | 0.89 +/− 0.01 |
| DenseNet-121 baseline | 86.4 +/− 0.6 | 84.6 +/− 0.7 | 83.9 +/− 0.8 | 84.2 +/− 0.7 | 0.90 +/− 0.01 |
| Swin Transformer baseline | 88.9 +/− 0.5 | 87.1 +/− 0.6 | 86.2 +/− 0.6 | 86.6 +/− 0.6 | 0.93 +/− 0.01 |
| CNN + Metadata Fusion | 89.3 +/− 0.5 | 87.8 +/− 0.6 | 86.9 +/− 0.7 | 87.3 +/− 0.6 | 0.93 +/− 0.01 |
| Proposed image-only architecture (mean +/− SD) | 91.8 +/− 0.4 | 90.2 +/− 0.5 | 89.5 +/− 0.5 | 89.8 +/− 0.5 | 0.95 +/− 0.01 |
| Dataset/Task | Accuracy (%) | AUC |
|---|---|---|
| RSNA Mammography—breast cancer classification | 94.0 ± 0.3 | 0.970 ± 0.007 |
| LIDC-IDRI CT—lung nodule malignancy/risk classification | 90.7 | 0.94 |
| Model Variant | Metadata Included | Fusion Method | Accuracy (%) | Precision (%) | Recall/Sensitivity (%) | Specificity (%) | F1-Score (%) | AUC |
|---|---|---|---|---|---|---|---|---|
| CNN–GAT–BiLSTM | None | Imaging only | 91.8 | 90.5 | 90.1 | 91.2 | 90.3 | 94.6 |
| CNN–GAT–BiLSTM + Age | Age only | Concatenation | 92.4 | 91.2 | 90.8 | 91.8 | 91.0 | 95.3 |
| CNN–GAT–BiLSTM + Implant | Implant status only | Concatenation | 92.8 | 91.7 | 91.3 | 92.1 | 91.5 | 95.6 |
| CNN–GAT–BiLSTM + Metadata | Age + implant status | Concatenation | 93.7 | 92.6 | 92.1 | 93.0 | 92.3 | 96.4 |
| Proposed multimodal model (best held-out run) | Age + implant status | Cross-attention | 95.2 | 94.3 | 93.9 | 94.8 | 94.1 | 97.8 |
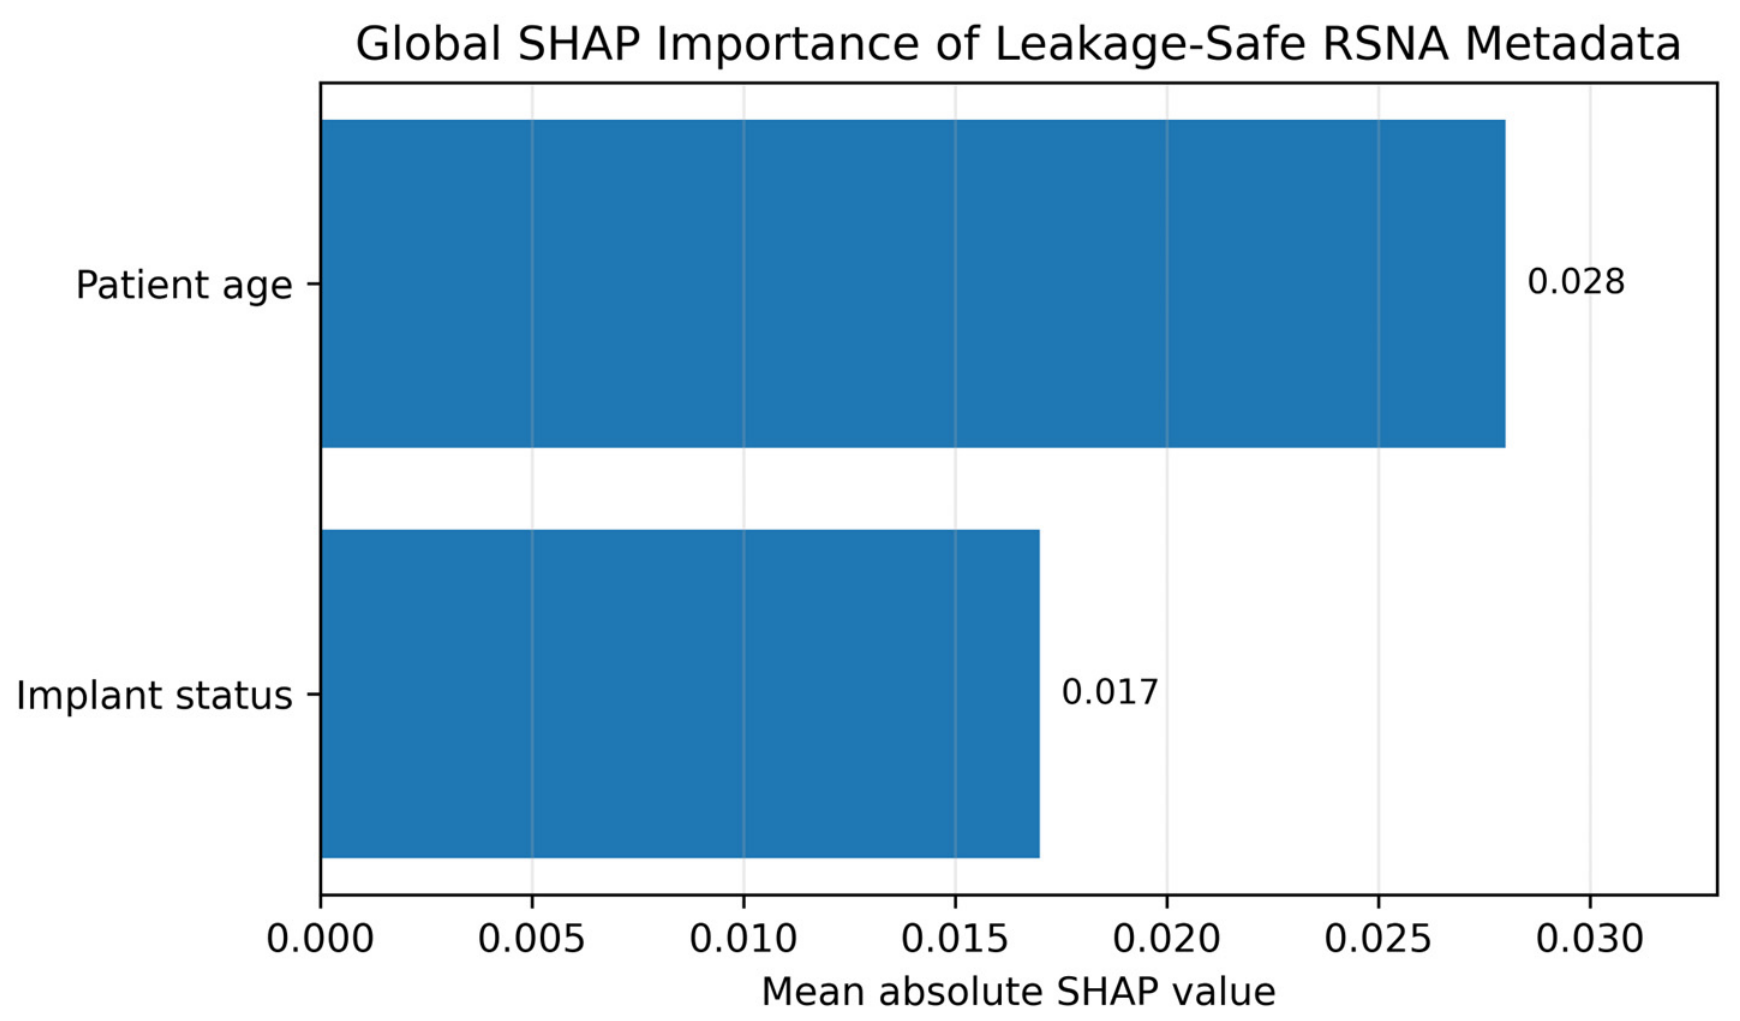
| Metadata Variable | Mean Absolute SHAP Value | Relative Contribution (%) | Interpretation |
|---|---|---|---|
| Patient Age | 0.028 | 62.2 | Indicates the overall contribution of patient age to prediction. |
| Implant Status | 0.017 | 37.8 | Indicates the overall contribution of implant status to prediction. |
| Parameter | Value | Accuracy (%) |
|---|---|---|
| Learning Rate | 0.001 | 88.7 |
| Learning Rate | 0.0001 | 91.8 |
| Epochs | 30 | 91.5 |
| Epochs | 50 | 91.8 |
| Attention Heads | 2 | 90.4 |
| Attention Heads | 4 | 91.8 |
| Model | Params (M) | FLOPs (G) | GPU Memory (GB) | Train Time/Epoch (s) | Inference Time |
|---|---|---|---|---|---|
| EfficientNet-B3 | 12.0 | 1.8 | 4.2 | 38 | 18 ms/image |
| CNN + GAT | 14.6 | 2.3 | 5.1 | 46 | 24 ms/image |
| CNN + BiLSTM | 15.1 | 2.5 | 5.4 | 49 | 27 ms/image |
| Swin Transformer | 28.3 | 4.5 | 7.8 | 71 | 42 ms/image |
| UNETR-based classifier | 31.7 | 5.1 | 8.6 | 79 | 48 ms/image |
| Proposed framework | 18.9 | 3.1 | 6.2 | 57 | 34 ms/image; 118 ms/CT volume |
| Fusion Strategy | Metadata Used | Fusion Method | Accuracy (%) | Precision (%) | Recall (%) | Specificity (%) | F1-Score (%) | AUC |
|---|---|---|---|---|---|---|---|---|
| Image-only baseline | None | No fusion | 91.8 ± 0.4 | 90.2 ± 0.5 | 89.5 ± 0.5 | 91.0 ± 0.5 | 89.8 ± 0.5 | 0.950 ± 0.010 |
| Metadata fusion | Age | Feature concatenation | 92.3 ± 0.4 | 91.0 ± 0.5 | 90.3 ± 0.5 | 91.7 ± 0.5 | 90.6 ± 0.5 | 0.955 ± 0.009 |
| Metadata fusion | Implant status | Feature concatenation | 92.5 ± 0.4 | 91.3 ± 0.5 | 90.6 ± 0.5 | 91.9 ± 0.5 | 90.9 ± 0.5 | 0.957 ± 0.009 |
| Metadata fusion | Age + Implant | Feature concatenation | 93.2 ± 0.3 | 92.0 ± 0.4 | 91.4 ± 0.4 | 92.6 ± 0.4 | 91.7 ± 0.4 | 0.962 ± 0.008 |
| Proposed framework (3-run mean ± SD) | Age + Implant | Cross-attention | 94.0 ± 0.3 | 93.0 ± 0.4 | 92.5 ± 0.4 | 93.6 ± 0.4 | 92.7 ± 0.4 | 0.970 ± 0.007 |
Disclaimer/Publisher’s Note: The statements, opinions and data contained in all publications are solely those of the individual author(s) and contributor(s) and not of MDPI and/or the editor(s). MDPI and/or the editor(s) disclaim responsibility for any injury to people or property resulting from any ideas, methods, instructions or products referred to in the content. |
© 2026 by the authors. Licensee MDPI, Basel, Switzerland. This article is an open access article distributed under the terms and conditions of the Creative Commons Attribution (CC BY) license.
Share and Cite
Singh, C.; Wibowo, S.; Grandhi, S.; Mandala, S. Graph-Aware and Sequence-Aware Multimodal Deep Learning Framework for Cancer Detection and Risk Analysis from Medical Imaging. J. Imaging 2026, 12, 431. https://doi.org/10.3390/jimaging12090431
Singh C, Wibowo S, Grandhi S, Mandala S. Graph-Aware and Sequence-Aware Multimodal Deep Learning Framework for Cancer Detection and Risk Analysis from Medical Imaging. Journal of Imaging. 2026; 12(9):431. https://doi.org/10.3390/jimaging12090431
Chicago/Turabian StyleSingh, Chetanpal, Santoso Wibowo, Srimannarayana Grandhi, and Satria Mandala. 2026. "Graph-Aware and Sequence-Aware Multimodal Deep Learning Framework for Cancer Detection and Risk Analysis from Medical Imaging" Journal of Imaging 12, no. 9: 431. https://doi.org/10.3390/jimaging12090431
APA StyleSingh, C., Wibowo, S., Grandhi, S., & Mandala, S. (2026). Graph-Aware and Sequence-Aware Multimodal Deep Learning Framework for Cancer Detection and Risk Analysis from Medical Imaging. Journal of Imaging, 12(9), 431. https://doi.org/10.3390/jimaging12090431