In this section, a comprehensive experimental evaluation and analysis of the performance of the improved model is conducted. The dataset is split into training and testing sets at a ratio of 8:2, with the data acquisition and construction process detailed in
Section 3. The experimental section is structured into five parts: First, the specific training settings are described, including hyperparameter configuration, loss function design, and the evaluation metrics employed. Second, the recognition results of the improved model on the FKS-GPR testing set constructed in this study are analyzed in detail. Third, comparative experiments with several existing methods are performed to assess the performance advantages of the proposed approach from multiple perspectives. Fourth, to verify the model’s transferability and robustness, public datasets are introduced to evaluate its generalization capability. Finally, module-level ablation studies are conducted to examine the individual contributions and underlying mechanisms of each improved component in enhancing detection performance.
5.1. Network Training and Evaluation Metrics
The FKS-GPR dataset was divided into training and testing sets in an 8:2 ratio. All images were normalized and resized to a uniform grayscale format of 640 × 256 before being fed into the model. The entire training process was conducted under the PyTorch 1.13.1 framework, utilizing a 12-core Intel
® Xeon
® Silver 4310 CPU (Intel Corporation, CA, USA) with 128 GB of RAM and a base frequency of 2.1 GHz, along with an NVIDIA A100 GPU (NVIDIA Corporation, CA, USA). The network was optimized using the ADAM optimizer, and a cosine annealing learning rate scheduler was employed to dynamically adjust the learning rate, thereby improving convergence stability and training efficiency. The total number of training [
21] epochs was set to 200, with a batch size of 16. To enhance the model’s discriminative capability under class imbalance scenarios, a weighted loss function was designed by linearly combining the standard Cross Entropy Loss with the Focal Loss. The formulation is given by Equation (7) as follows:
Here, represents the standard Cross Entropy Loss, which focuses on ensuring the overall classification accuracy by penalizing incorrect predictions equally across all classes. In contrast, is the Focal Loss, which introduces a modulating factor to reduce the contribution of well-classified samples and instead emphasizes learning from hard-to-classify or minority class samples. This is particularly important in the context of ground-penetrating radar (GPR) images, where severely loosened regions or small-sized defects are often underrepresented and prone to misclassification. The balancing coefficient , empirically set to 0.5 in this study, is used to control the trade-off between the two loss components. By adjusting this parameter, the model can maintain a balance between general classification performance and its sensitivity to hard samples and rare classes.
Therefore, the total loss serves as an adaptive learning objective that not only drives the model to achieve higher overall detection accuracy but also effectively mitigates the negative impact of class imbalance by giving more attention to minority or low-confidence samples. This joint optimization strategy ultimately enhances the model’s robustness and reliability in real-world defect detection tasks.
To comprehensively and accurately evaluate the model’s performance in detecting voids and loosened targets in ground-penetrating radar images, five commonly used object detection metrics are employed: precision, recall, mean Average Precision (mAP), and GFLOPs [
22,
23]. Precision and recall are calculated as shown in Equations (8) and (9), respectively:
Mean Average Precision (mAP) is used to evaluate the overall performance of the multi-object detection model and is computed as described in Equations (10) and (11). The
F1-score, which measures the balance between precision and recall, is defined in Equation (12). Additionally, GFLOPs represent the computational complexity of the neural network and are calculated according to Equation (13). Generally, higher mAP and
F1-score indicate better model performance, while higher GFLOPs indicate greater computational capacity. The equations are as follows:
where
TP denotes the total number of true positive detections,
FP is the total number of false positive detections, and
FN is the total number of false negative detections.
K represents the total number of classes contained in the dataset, and
k refers to an individual category.
5.2. Validation of the Proposed Dataset—FKS-GPR
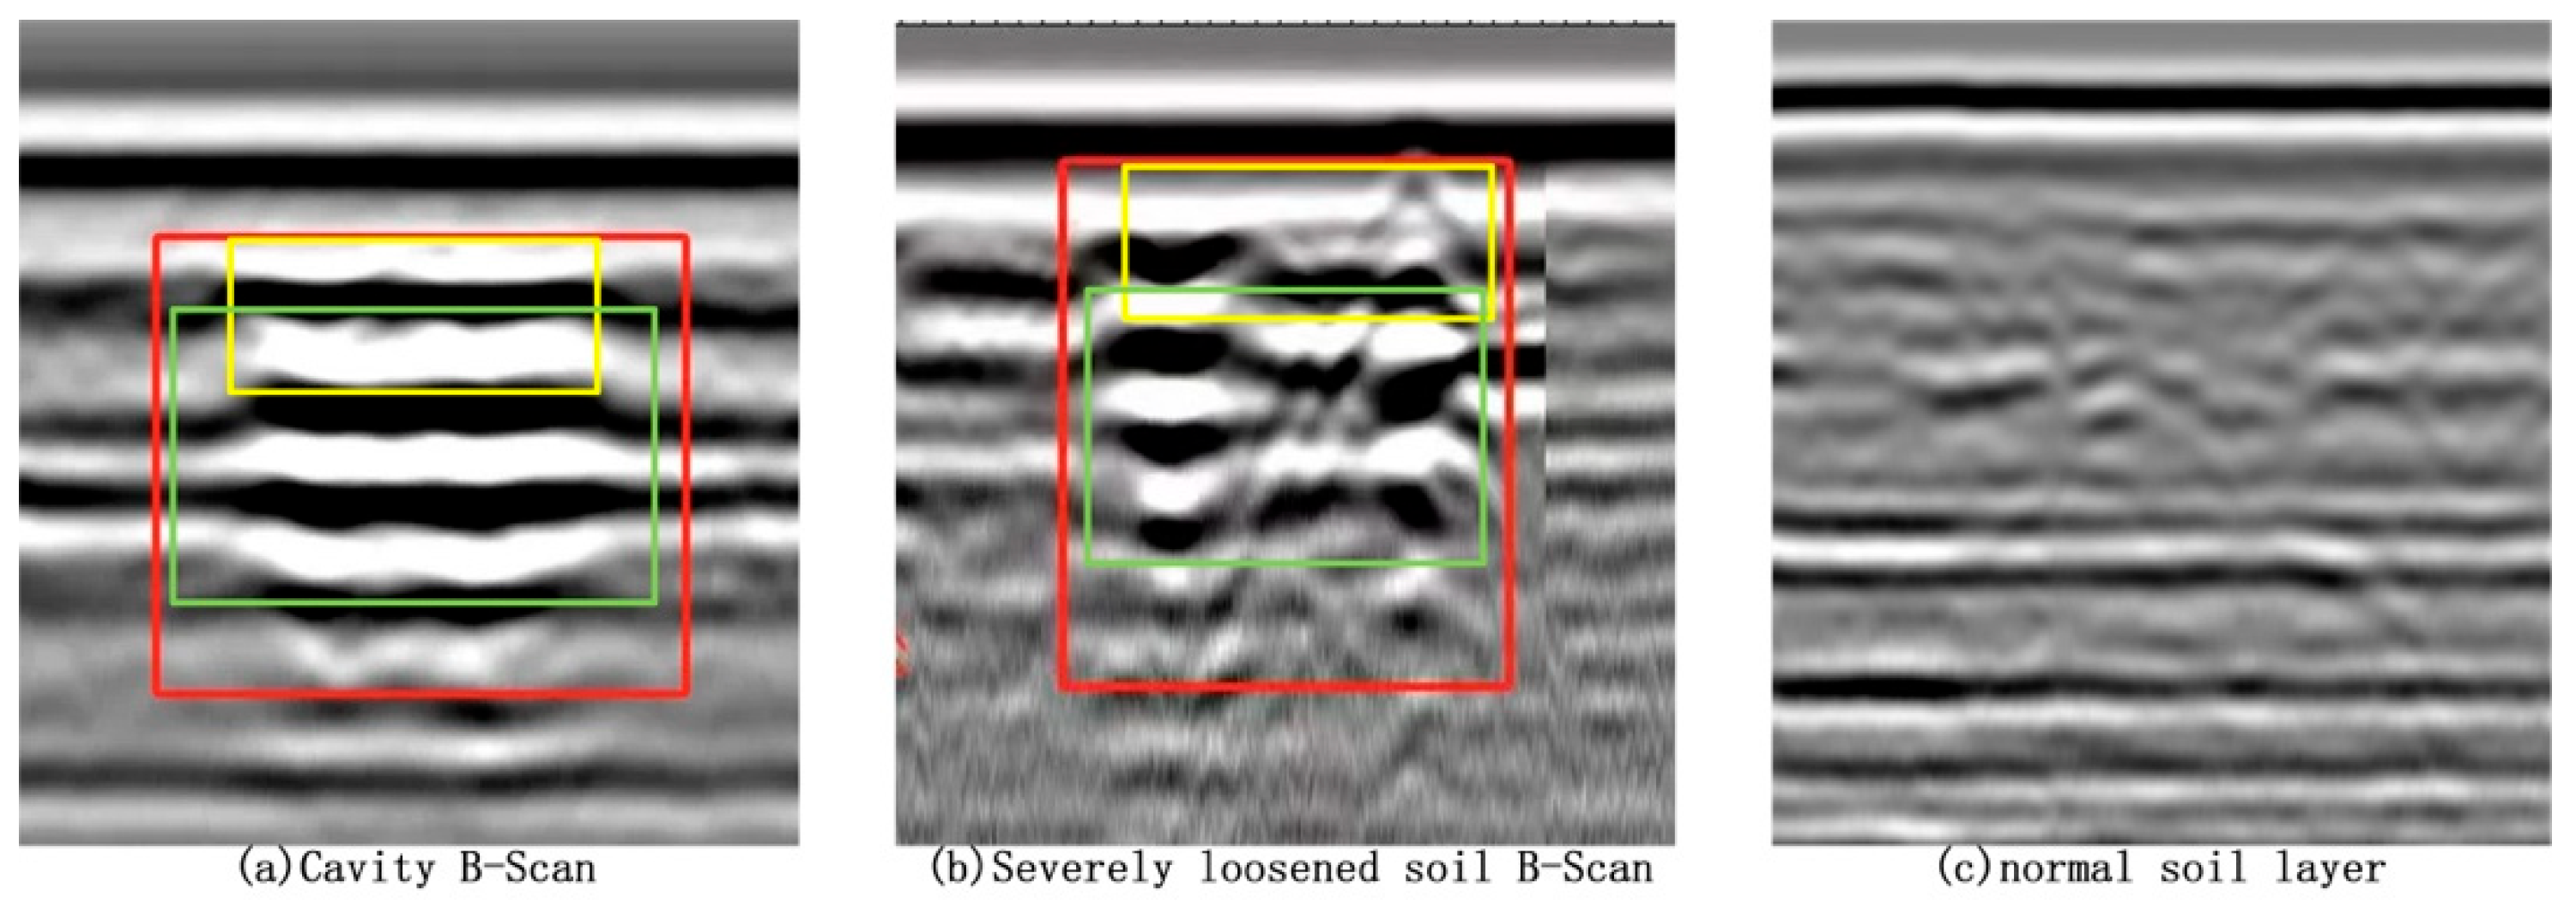
To validate the target detection performance and generalization capability of the proposed improved model in practical complex scenarios, a comprehensive evaluation was conducted based on the independently collected and precisely annotated FKS-GPR dataset. This dataset encompasses various road structure types, complex background interferences, and typical subsurface defects such as voids and severe looseness. It offers advantages including diverse sample distribution, high annotation accuracy, and strong representativeness, thereby realistically simulating the diverse challenges encountered in current ground-penetrating radar (GPR) applications.
During the construction of the test set, multiple B-scan radar images from real road sections were carefully selected. These images not only contain typical void and severe looseness targets but also retain complex background interference samples such as underground pipelines, interlayer cracks, and irregular reflections. This selection facilitates thorough validation of the model’s robustness and adaptability under multi-interference conditions.
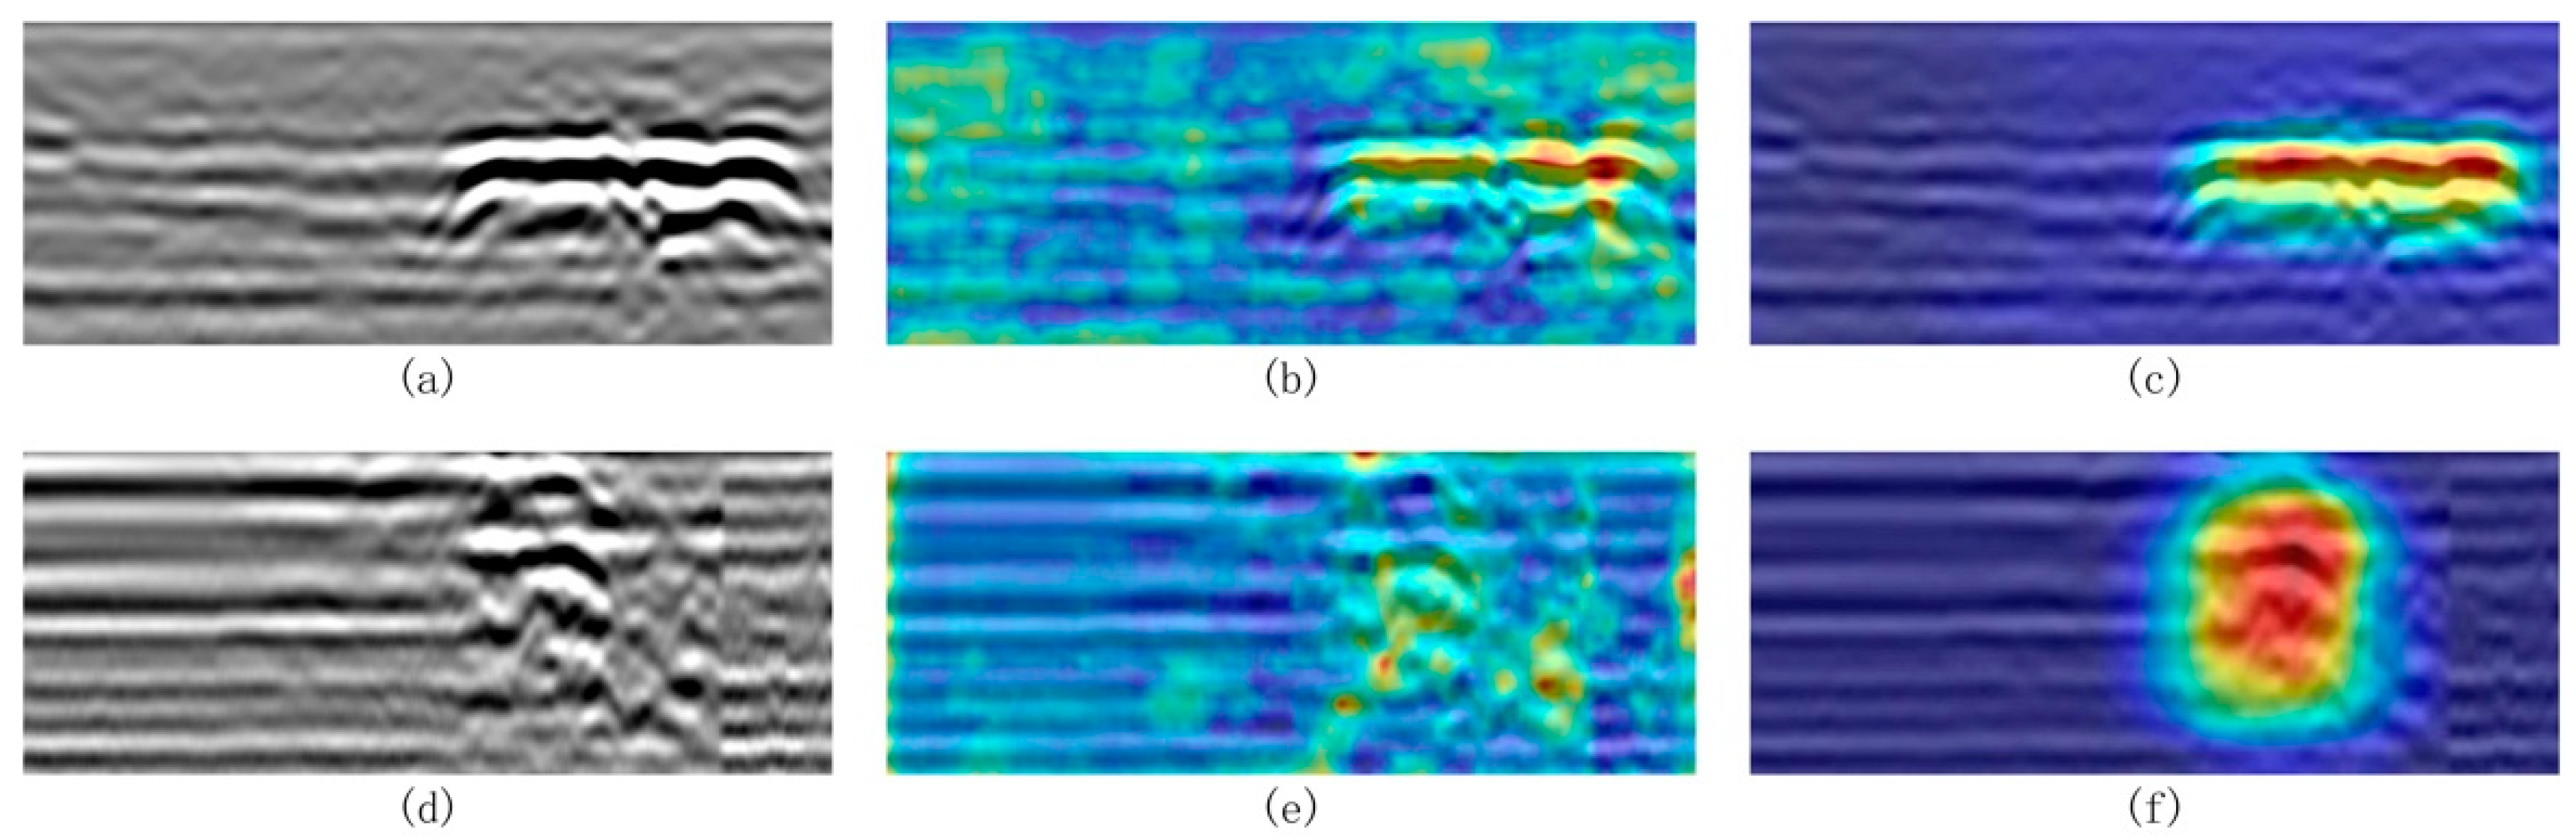
In the detection experiments, the improved model trained as described in
Section 5.1 was directly applied to perform inference and evaluation on the test set images. To assess the model’s performance from multiple perspectives, analyses were carried out focusing on three aspects: target localization accuracy, class discrimination ability, and consistency in responding to texture detail features. Qualitative visual results are shown in
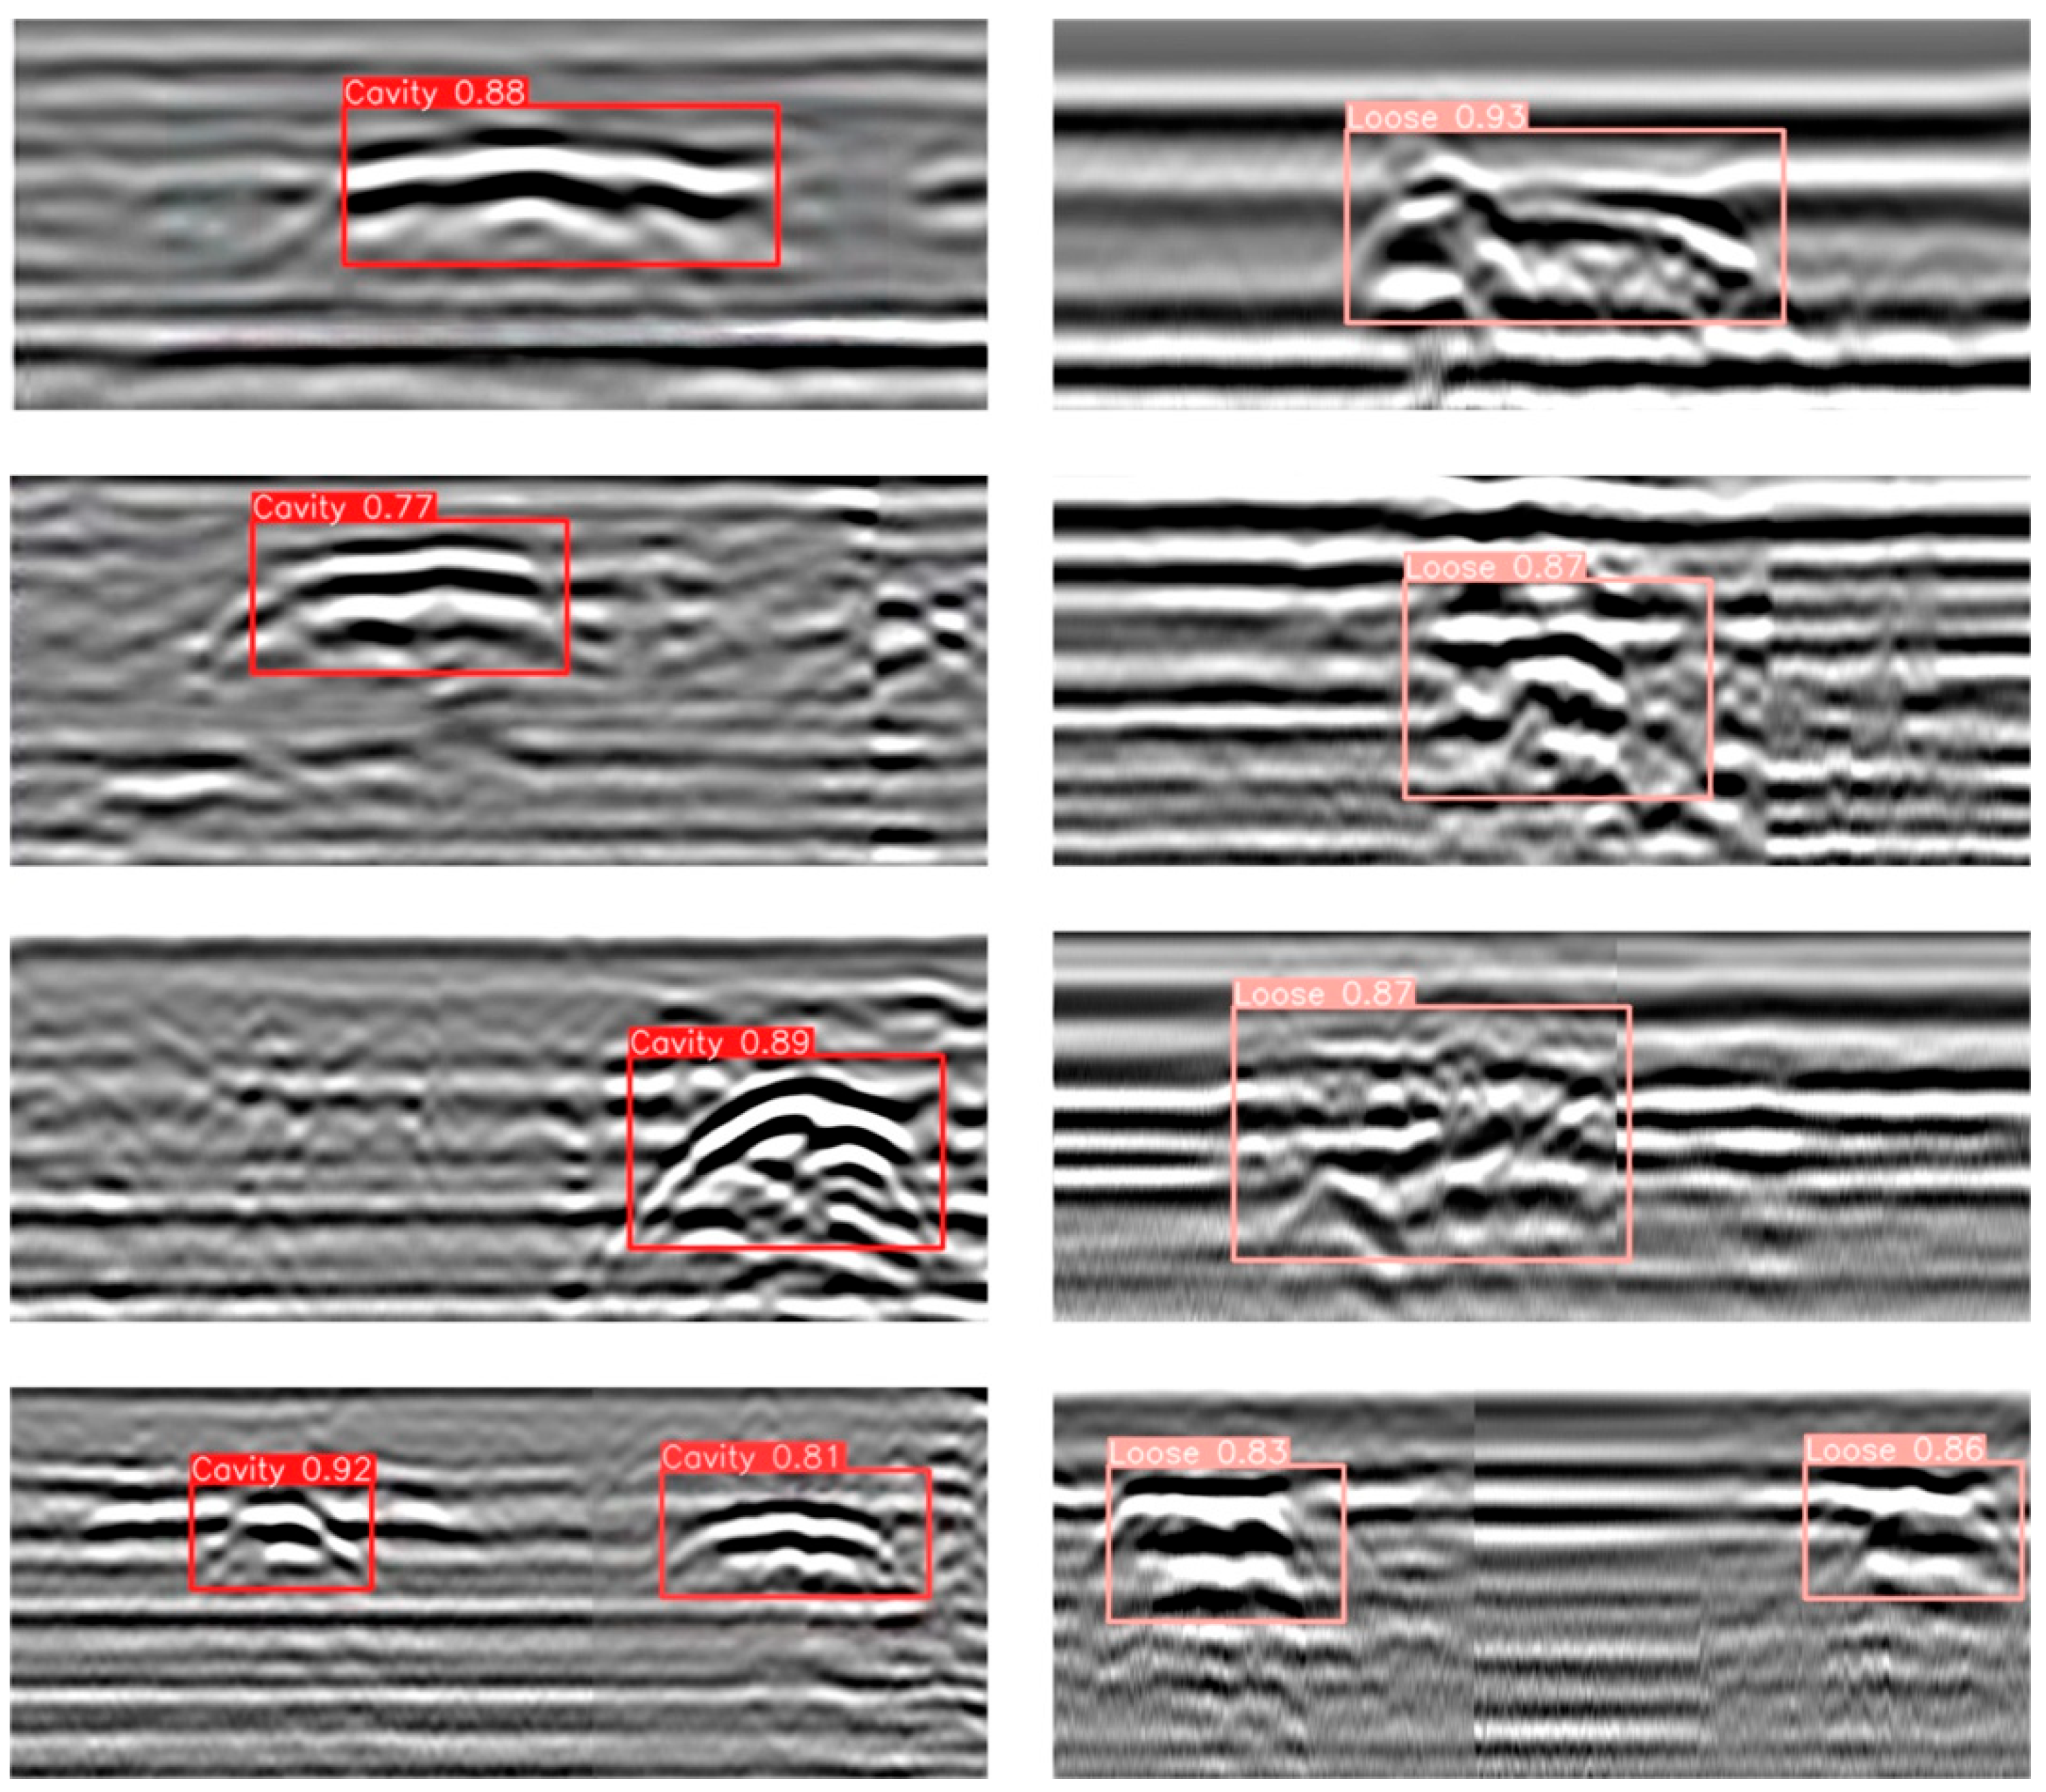
Figure 12, where the improved model demonstrates excellent detection performance across different types of anomalous regions. Specifically, for void targets, the model accurately extracts periodic reflection features between the upper and lower boundaries and achieves well-aligned detection bounding boxes. For severely loosened regions, the model effectively captures “cloud-like” texture disturbances and weak waveform reflection features, exhibiting strong classification confidence and discriminative capability. In particular, as shown in
Figure 12, the model achieves consistently high detection confidence scores for both voids and severe looseness targets. For cavity defects, the highest confidence score reaches 0.92, with the lowest at 0.77, and the average remains above 0.80. For looseness defects, the highest confidence reaches 0.93, with the lowest at 0.83. These results further confirm the model’s effective capability to distinguish between different types of subsurface defects under complex background interference. Notably, even in complex scenarios with irregular target shapes, closely adjacent multiple targets, and significant background clutter, the model maintains high detection stability and robustness, demonstrating strong practical engineering adaptability. Furthermore, a quantitative evaluation of the detection results on the test set was performed using metrics including precision, recall, and mAP. As shown in
Table 2, the proposed improved model outperforms the original YOLOv8 baseline across all key metrics, fully validating the effectiveness of the structural improvements in enhancing the recognition of voids and severe looseness targets in ground-penetrating radar images.
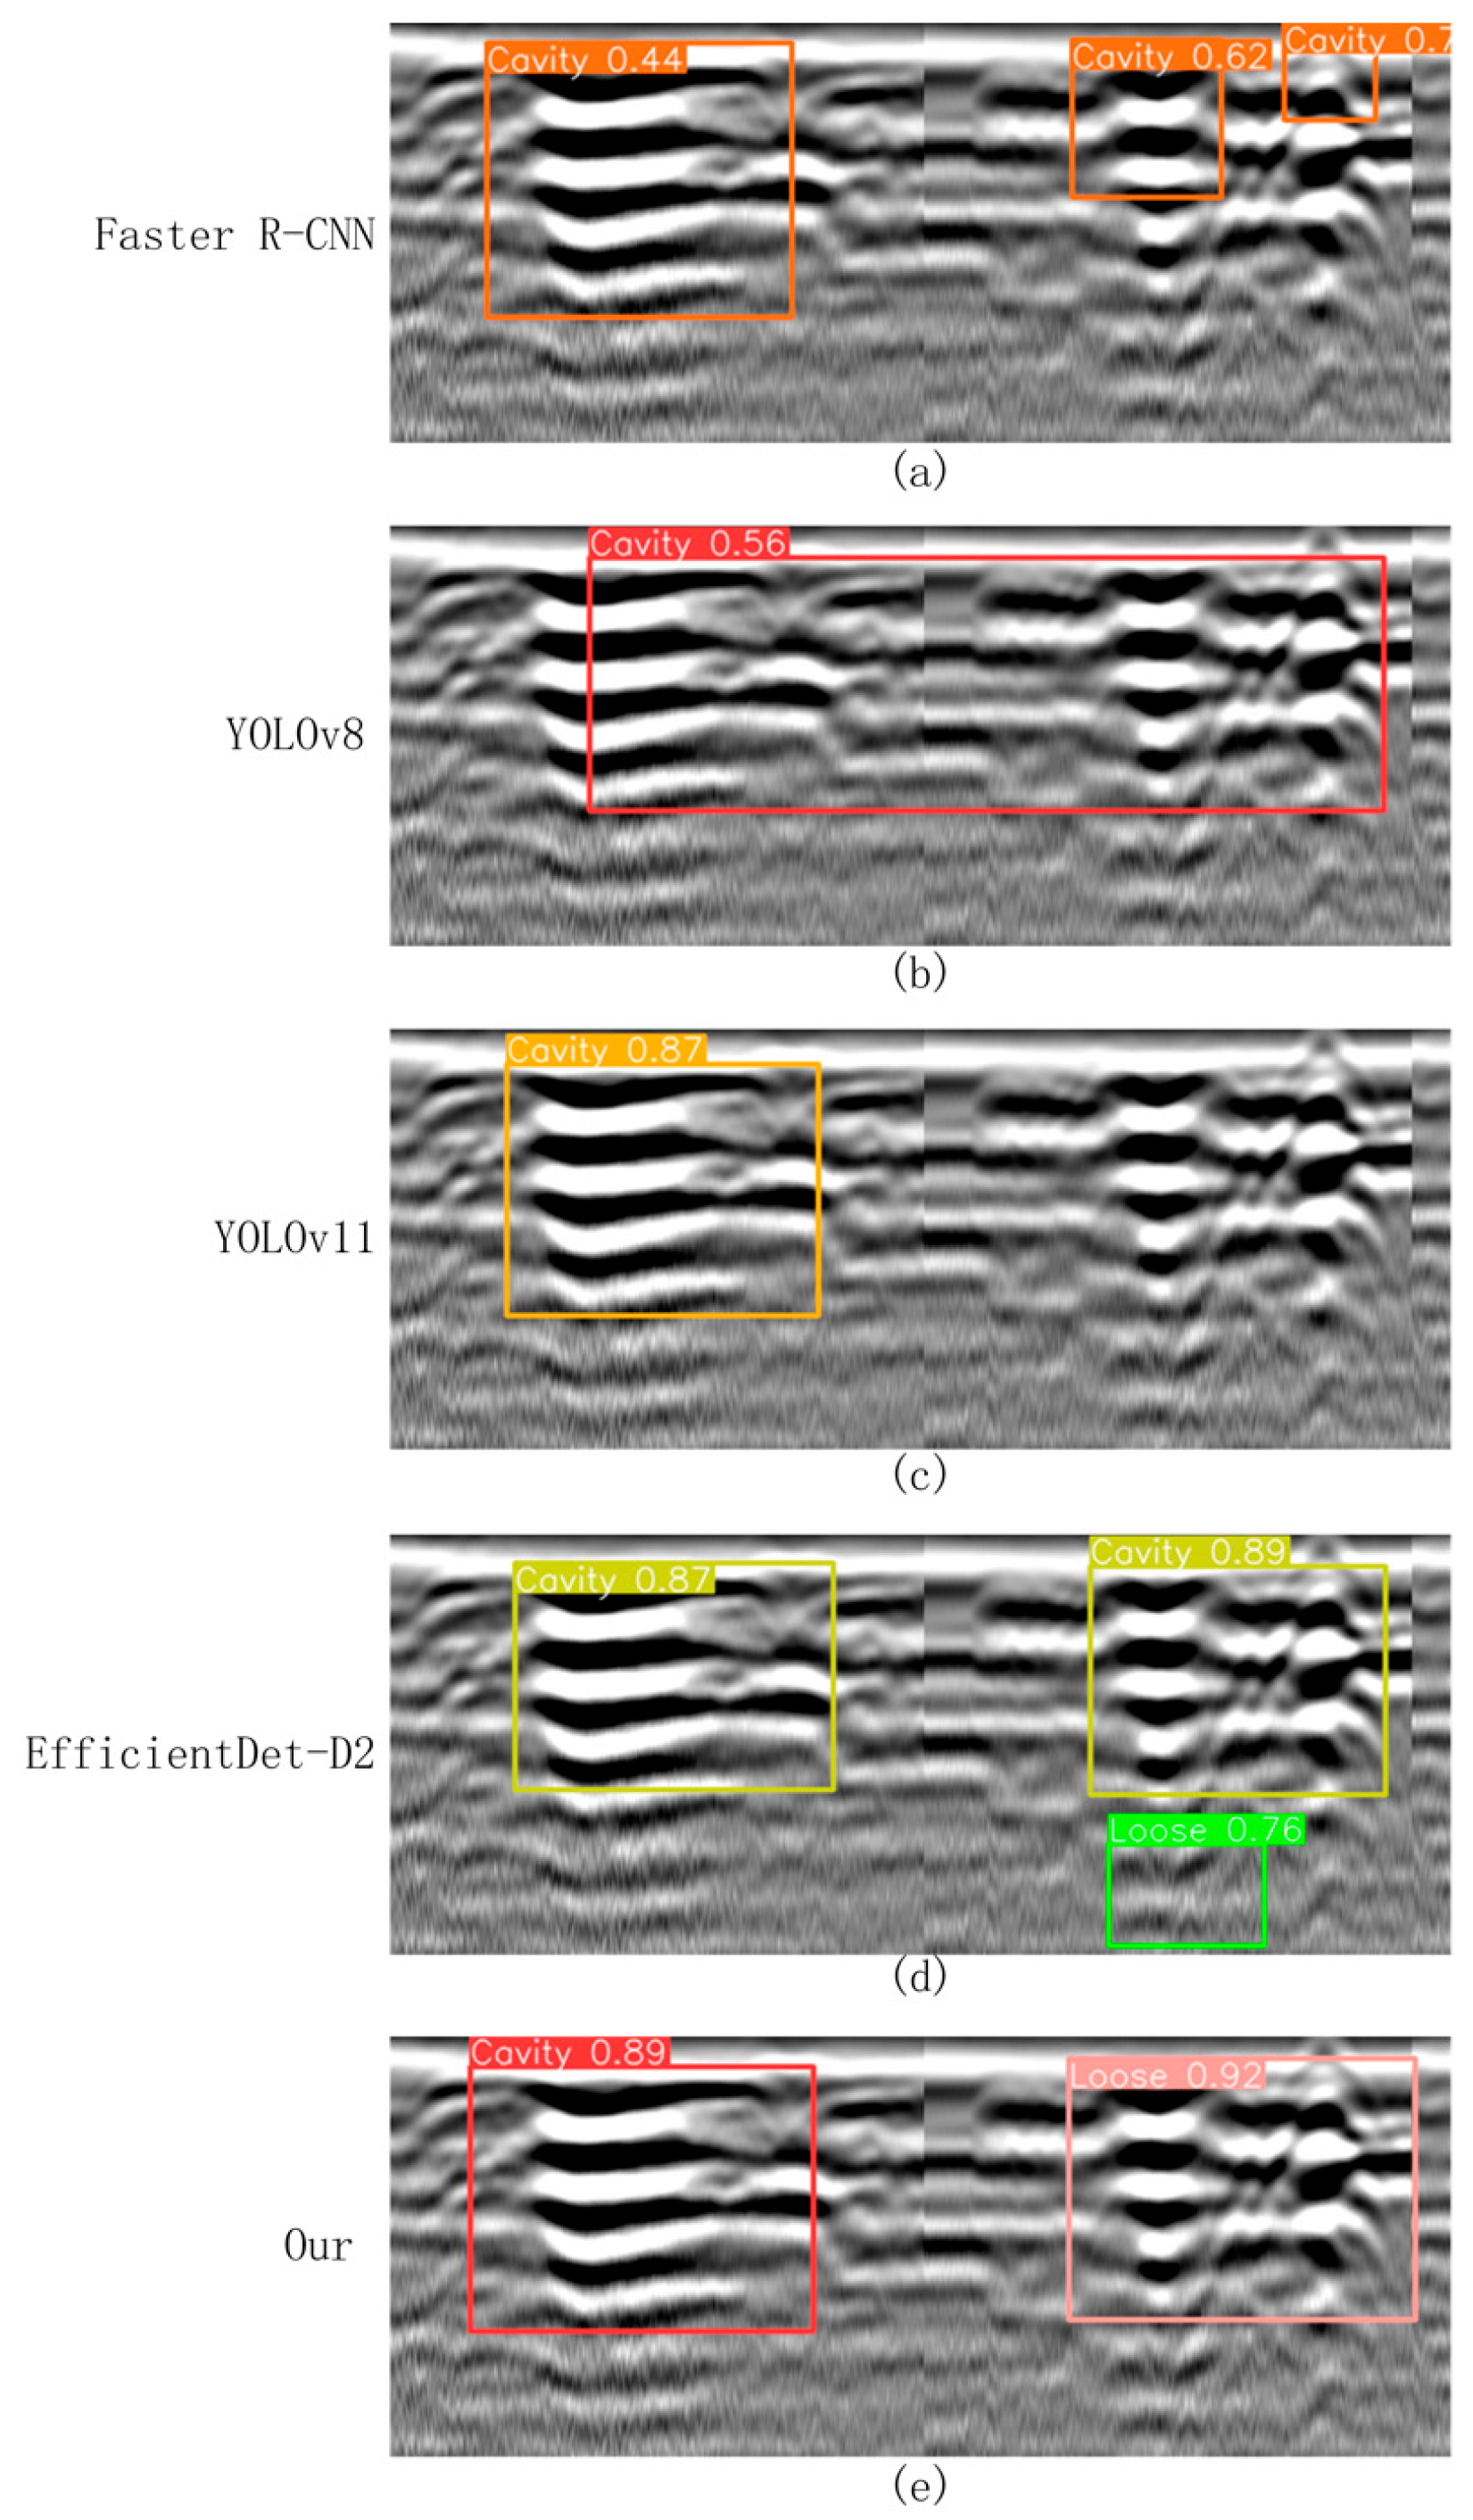
5.3. Model Comparison Experiments
To further validate the performance advantages of the proposed improved model in the task of road defect detection, four representative mainstream object detection algorithms were selected as baseline comparisons: Faster R-CNN (a typical two-stage detection method) [
24], YOLOv8 (a widely adopted lightweight detection framework), YOLOv11 (a newly released single-stage detection model) [
25], and the recently introduced EfficientDet-D2 detection method [
26]. These models, along with the proposed improved ACF-YOLO model, were systematically evaluated on the constructed FKS-GPR test set under a unified training strategy and parameter configuration, ensuring the fairness and comparability of the experimental results.
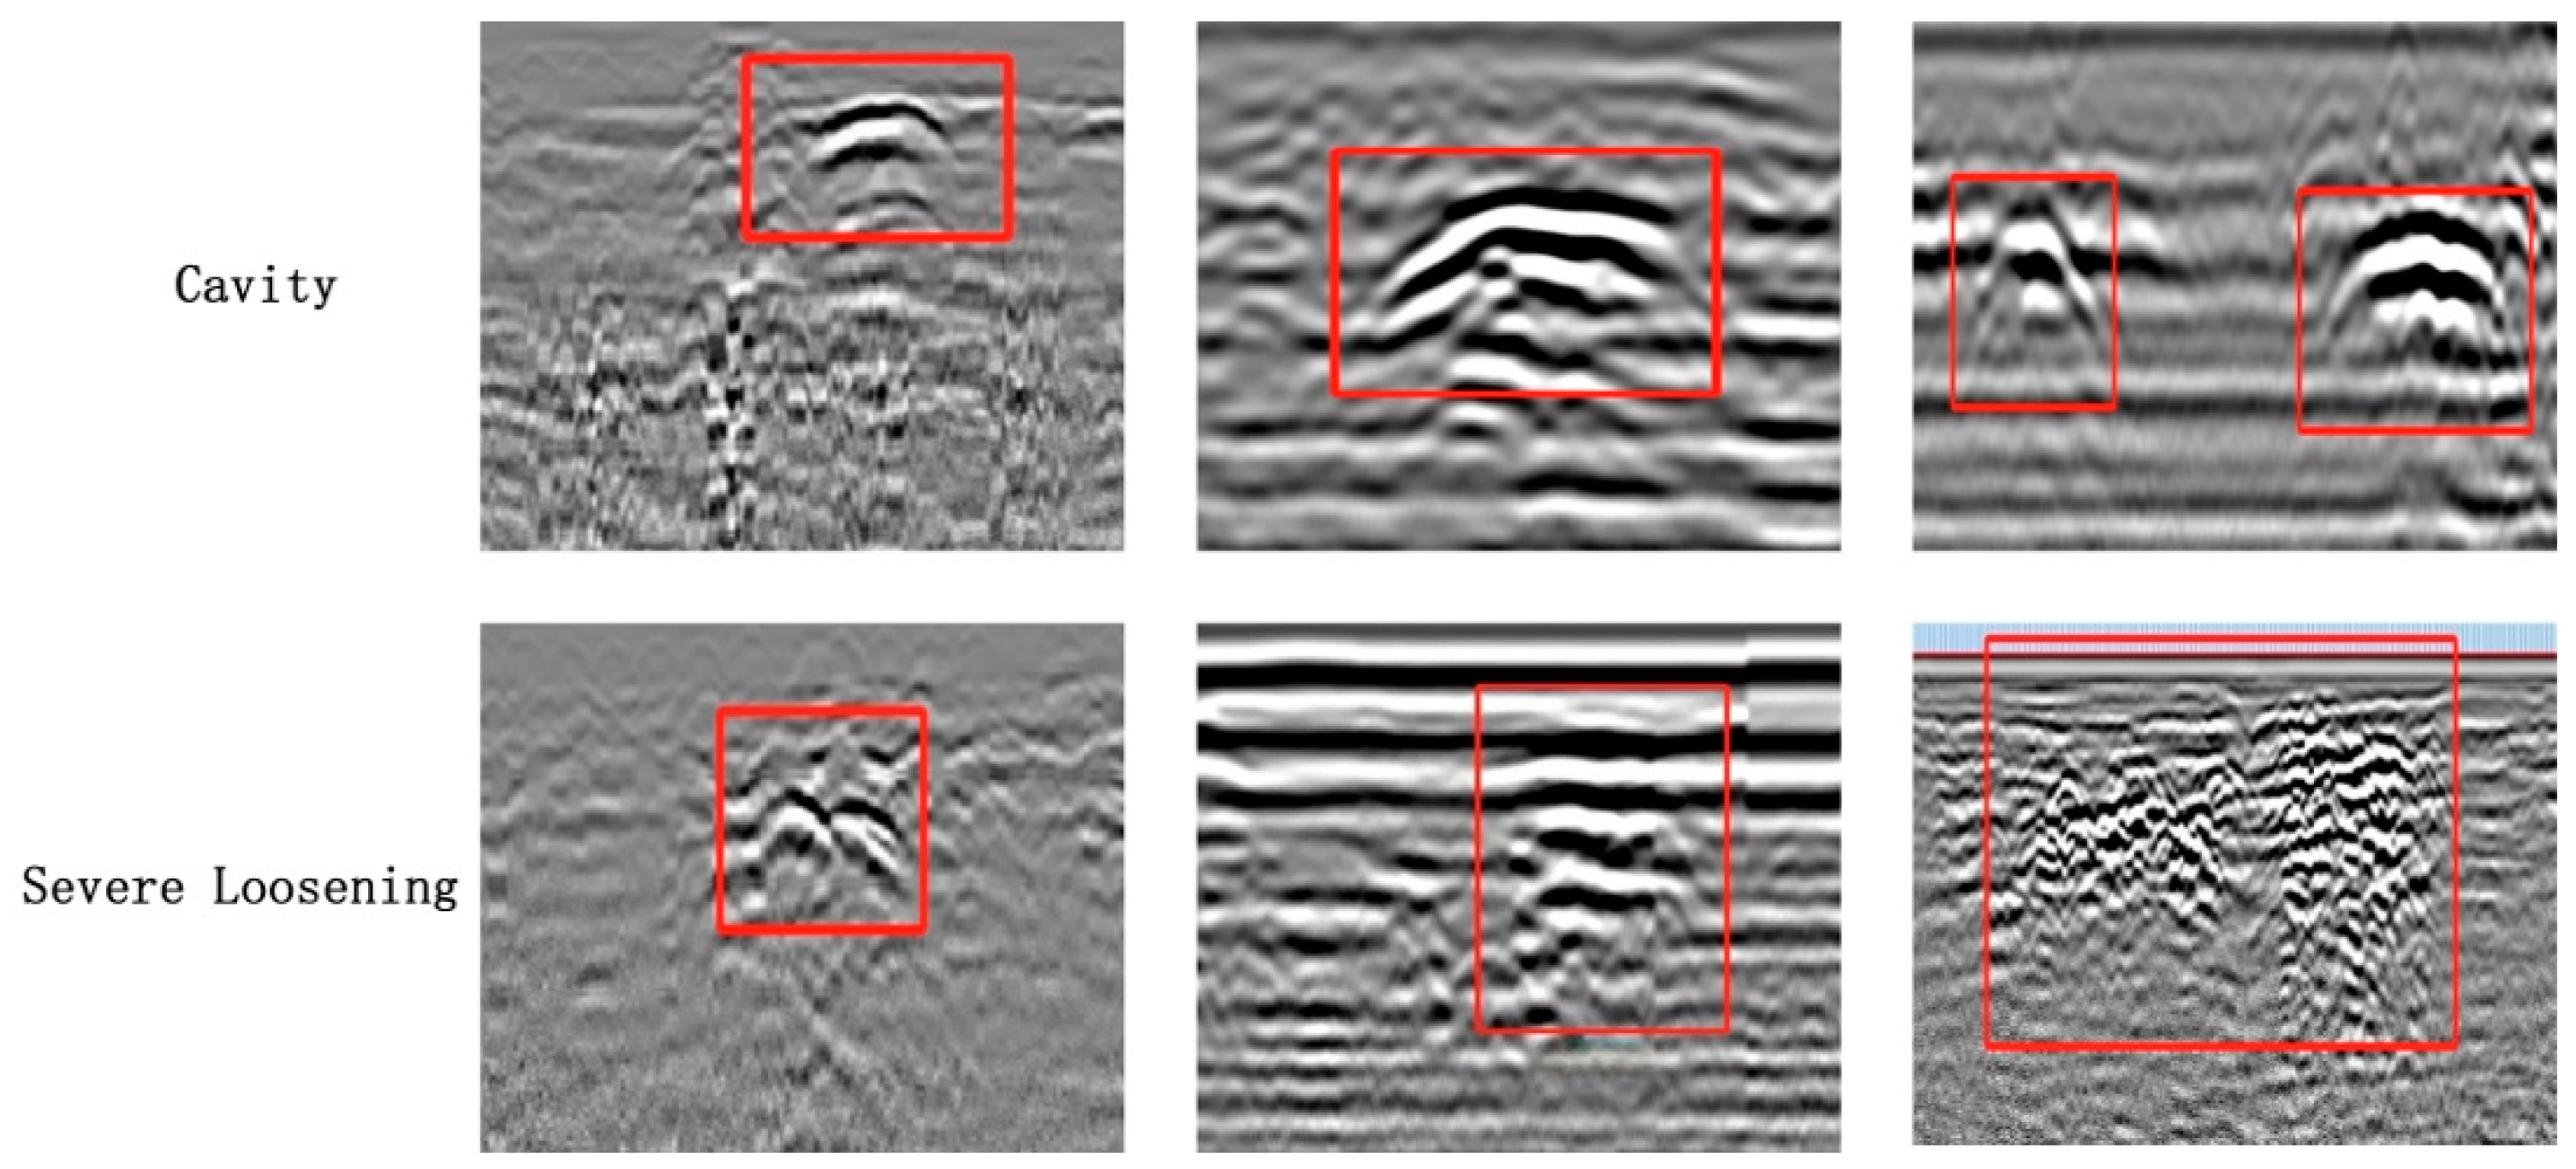
This comparative experiment focuses on two typical types of subsurface defects: “cavities” and “severely loosened” regions. The performance of the five models was comprehensively assessed in terms of detection of precision, recall,
F1-score, and model complexity (measured in GFLOPs). The detailed quantitative results are summarized in
Table 2, while representative visual detection results are presented in
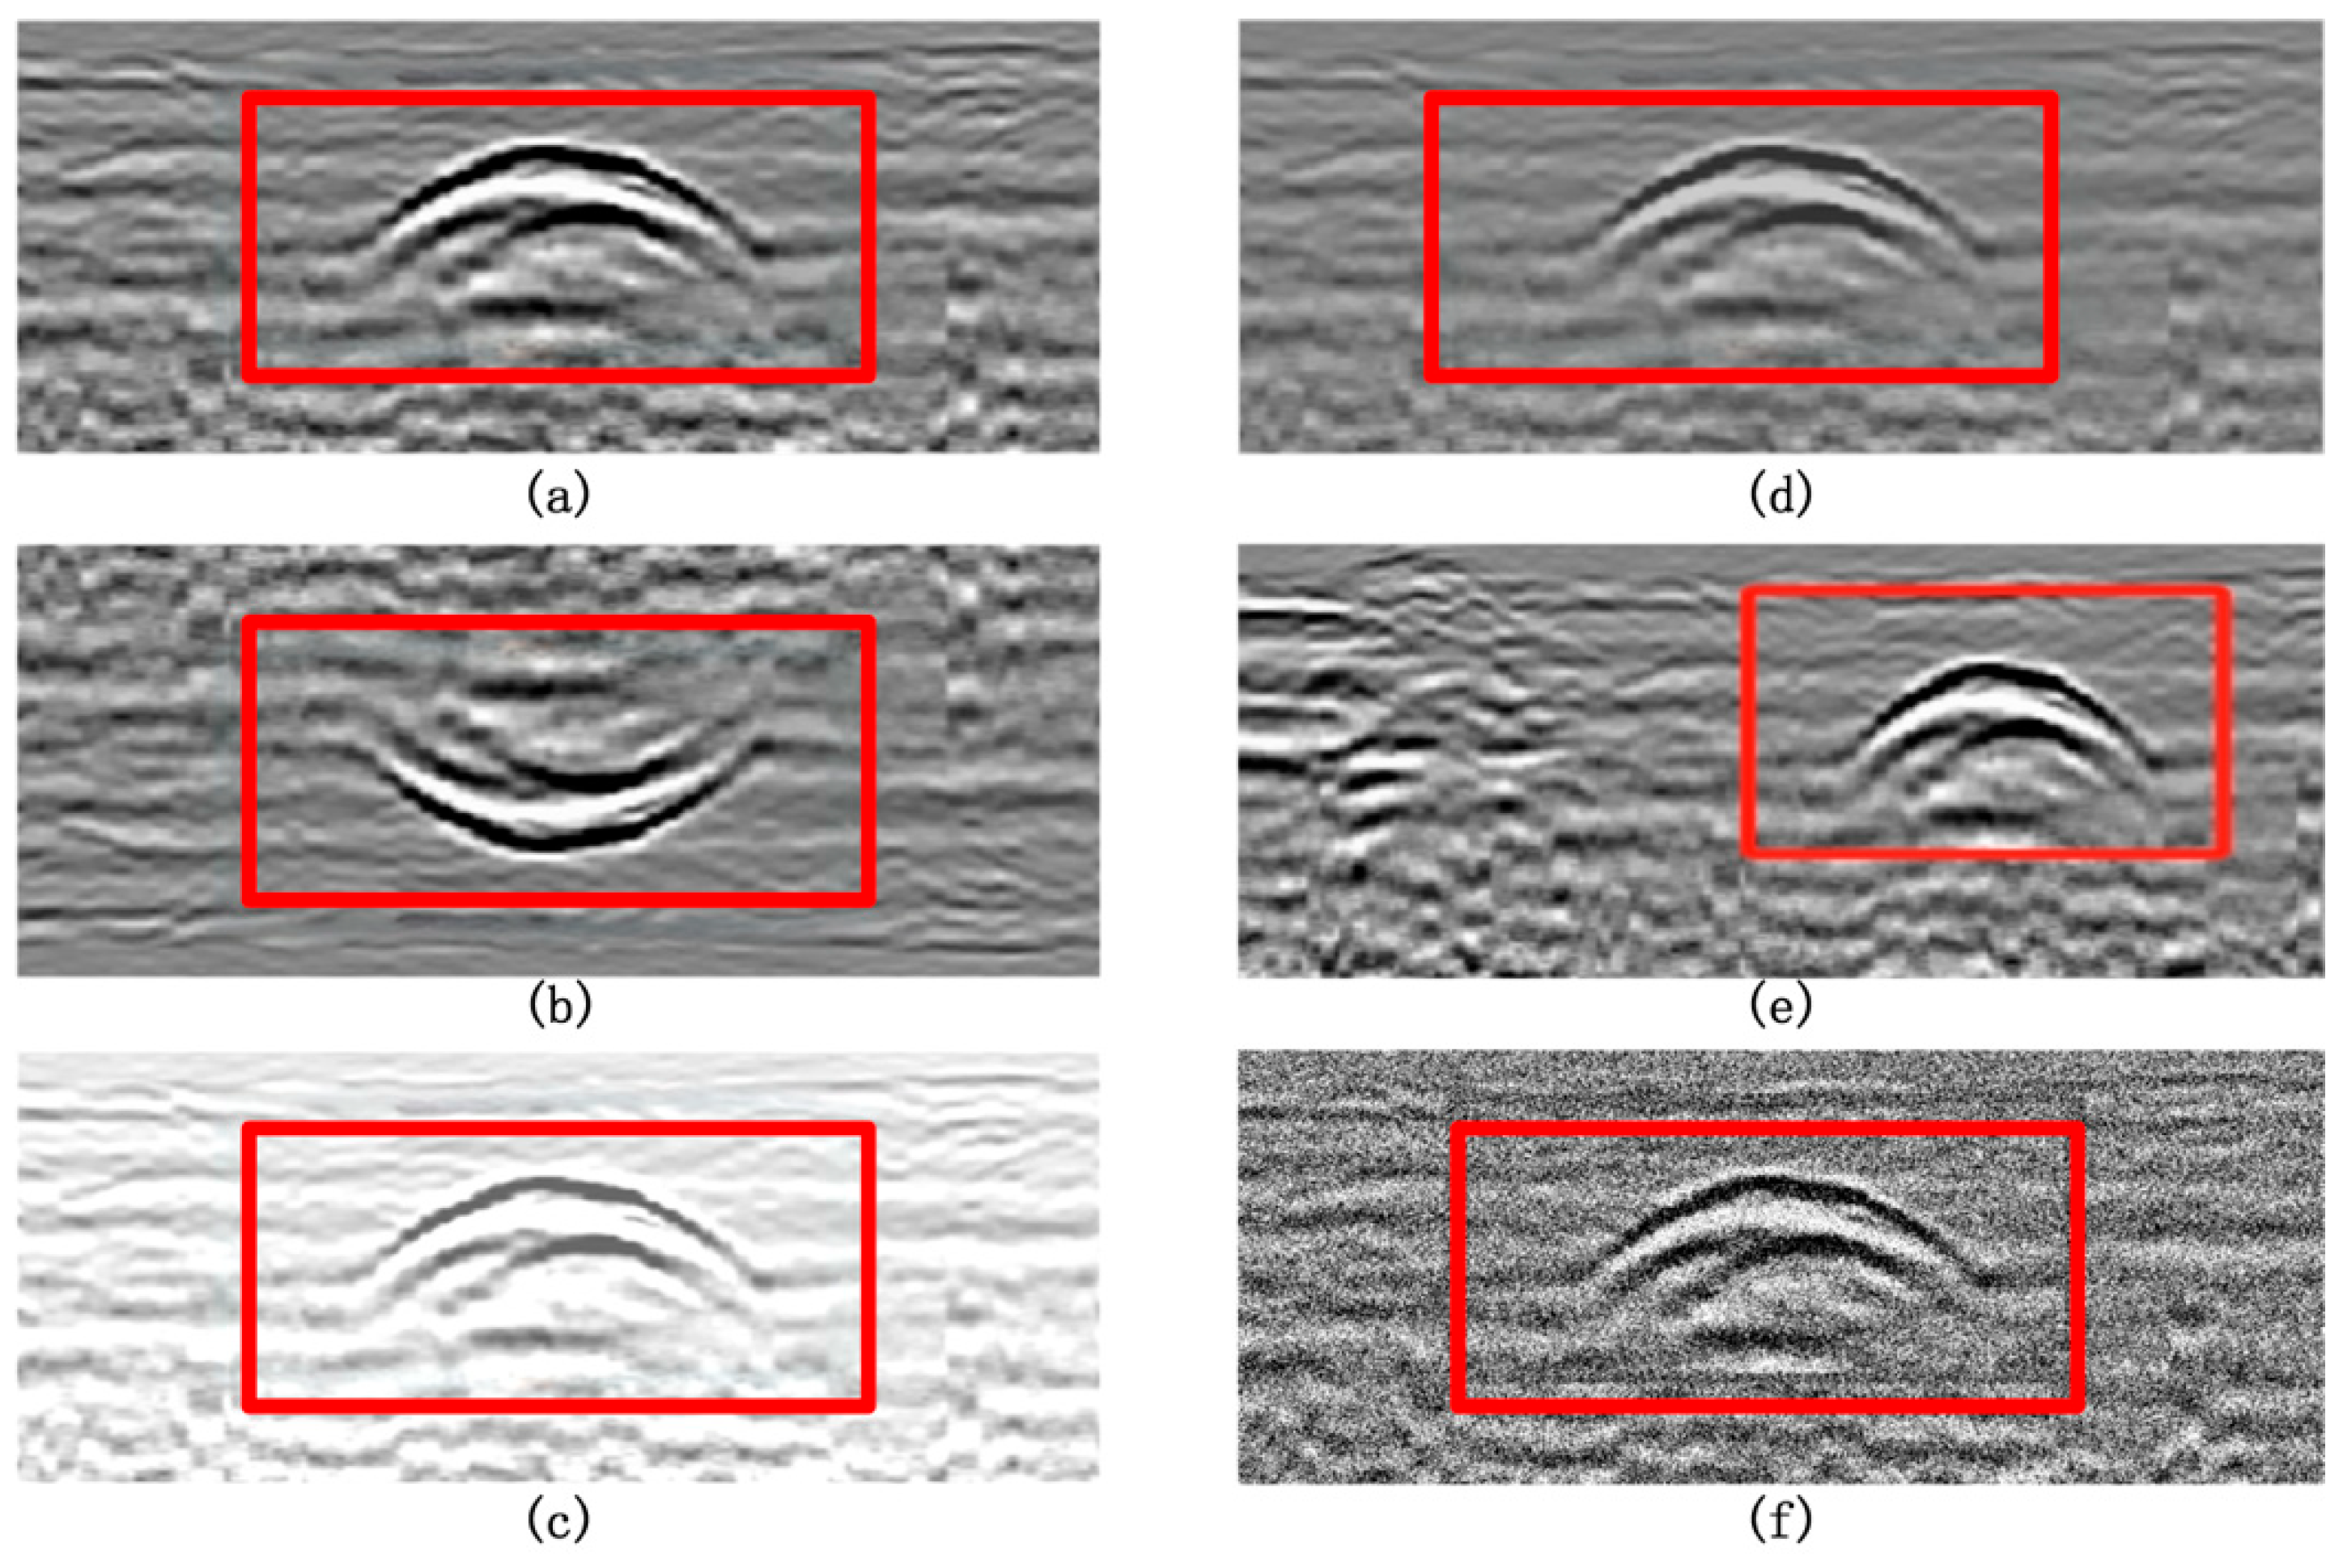
Figure 13. Specifically,
Figure 13a shows the detection results of Faster R-CNN under the same testing conditions, while
Figure 13b–e display the detection results of YOLOv8, YOLOv11, EfficientDet-D2, and the proposed ACF-YOLO model, respectively.
Faster R-CNN (
Figure 13a), a classical two-stage detection model, demonstrated strong feature extraction capabilities. However, due to its complex network architecture and high sensitivity to background interference, it exhibited a relatively high false detection rate. Specifically, in B-scan images, non-target structures such as cracks and underground pipelines were often misclassified as cavities or severely loosened areas. As a result, the detection accuracies for cavities and loosened regions were only 86.2% and 81.6%, respectively, with an overall average
F1-score of approximately 81.9%. In addition, the high computational cost of this model (18.5 GFLOPs) further limits its potential for real-time applications. In particular, Faster R-CNN exhibited inference latencies of 74 ms on GPU and 329 ms on CPU, corresponding to 13.5 FPS and 3.0 FPS, with memory usage reaching 7.8 GB (GPU) and 4.9 GB (CPU), which is significantly higher than other models and further constrains its real-time applicability and resource efficiency.
As a lightweight single-stage detection model, YOLOv8 (
Figure 13b) achieved detection precisions of 88.6% and 83.2% for cavities and loosened areas, with corresponding recall rates of 86.7% and 82.1%, and an average
F1-score of 85.1%, all while maintaining a relatively low computational burden (7.3 GFLOPs). However, its performance in modeling target boundary details remains limited. In particular, when handling adjacent or visually similar targets, YOLOv8 tends to produce overlapping detection boxes and class confusion, which can compromise detection stability and accuracy. In terms of deployment performance, YOLOv8 achieved inference latencies of 15 ms (GPU) and 97 ms (CPU), corresponding to 66.7 FPS and 10.3 FPS, with moderate memory usage of 4.1 GB (GPU) and 2.5 GB (CPU), offering a favorable balance between detection performance and computational efficiency.
In contrast, YOLOv11 (
Figure 13c) integrates a deeper feature extraction network and an optimized anchor box mechanism, significantly enhancing its boundary recognition and class discrimination capabilities. It achieved detection precisions exceeding 90% for both cavity and loosened targets, with an average
F1-score of 89.3%. YOLOv11 demonstrated superior generalization ability in complex backgrounds with strong interference, outperforming the aforementioned models. Nonetheless, it still suffers from occasional missed and false detections, particularly when dealing with highly complex background textures. Deployment evaluation shows that YOLOv11 achieved inference latencies of 18 ms (GPU) and 108 ms (CPU), with corresponding FPS of 55.5 and 9.3, and memory usage of 4.6 GB (GPU) and 2.6 GB (CPU), achieving a good balance between detection accuracy and resource consumption.
This study also reproduced and systematically evaluated the EfficientDet-D2 model (
Figure 13d). The results show that it achieved a detection precision of 90.0% and a recall of 87.5% for cavity detection, while for loosened soil, the precision and recall reached 87.4% and 83.1%, respectively. Benefiting from its compound multi-scale feature fusion mechanism and lightweight architecture (only 1.5 GFLOPs), EfficientDet-D2 demonstrated high accuracy and stability when identifying cavities with clear boundaries and regular shapes. However, when dealing with ambiguous boundaries, low-contrast features, and complex background clutter, the model tended to misclassify severely loosened regions as cavities, resulting in decreased classification accuracy. Its inference latency was 22 ms on GPU and 121 ms on CPU, with corresponding FPS of 45.5 and 8.2, and memory usage of 3.0 GB (GPU) and 2.0 GB (CPU), highlighting its computational efficiency despite slightly reduced detection robustness compared to the top-performing models.
In contrast, the proposed improved ACF-YOLO model (
Figure 13e) maintains a lightweight computational load (9.2 GFLOPs) while integrating an adaptive multi-scale feature focusing mechanism and multi-level attention modules, significantly enhancing its sensitivity to weak boundaries and low-echo targets. The experimental results demonstrate that the model achieves detection precisions of 93.1% and 91.8% for cavities and loosened soil, respectively, with corresponding recall rates of 91.0% and 90.6%, and an average
F1-score as high as 91.6%, substantially outperforming all other benchmark models. The proposed model not only improves detection robustness under complex textured backgrounds but also maintains high computational efficiency, indicating strong applicability and deployment potential in practical engineering scenarios. Deployment evaluation further confirms its practicality: the ACF-YOLO model achieved inference latencies of 19 ms (GPU) and 113 ms (CPU), corresponding to FPS of 52.6 and 8.8, with memory usage of 5.2 GB (GPU) and 2.7 GB (CPU), effectively balancing detection accuracy with resource utilization and real-time performance.
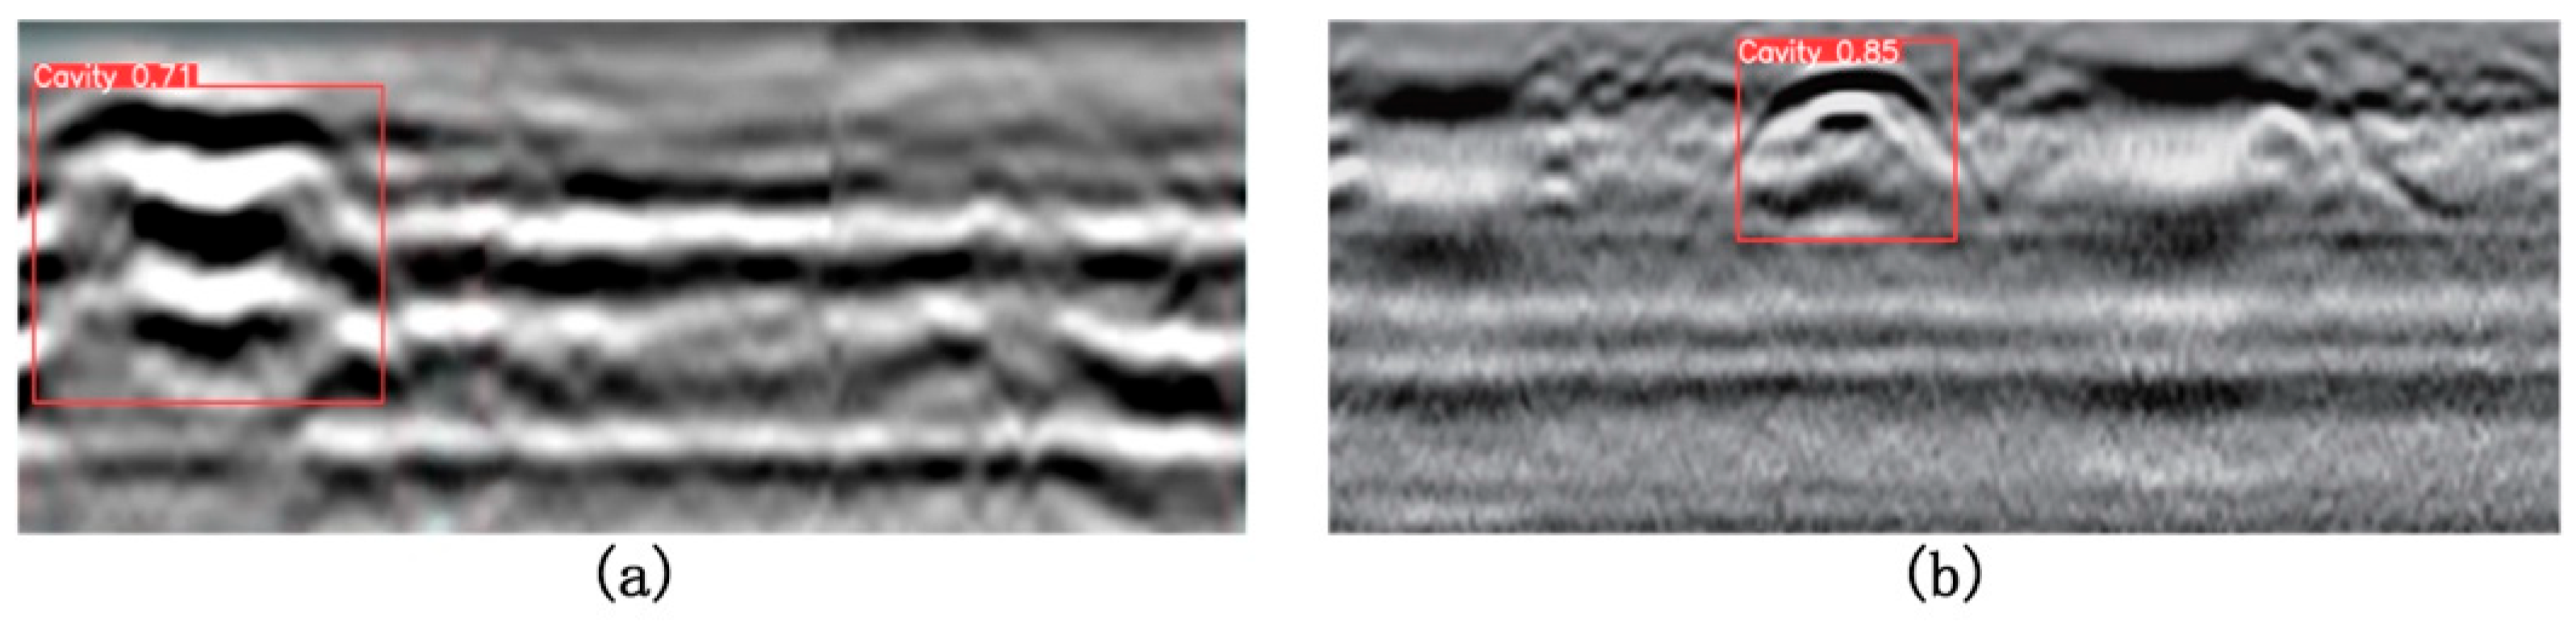
5.4. Validation on Public Datasets
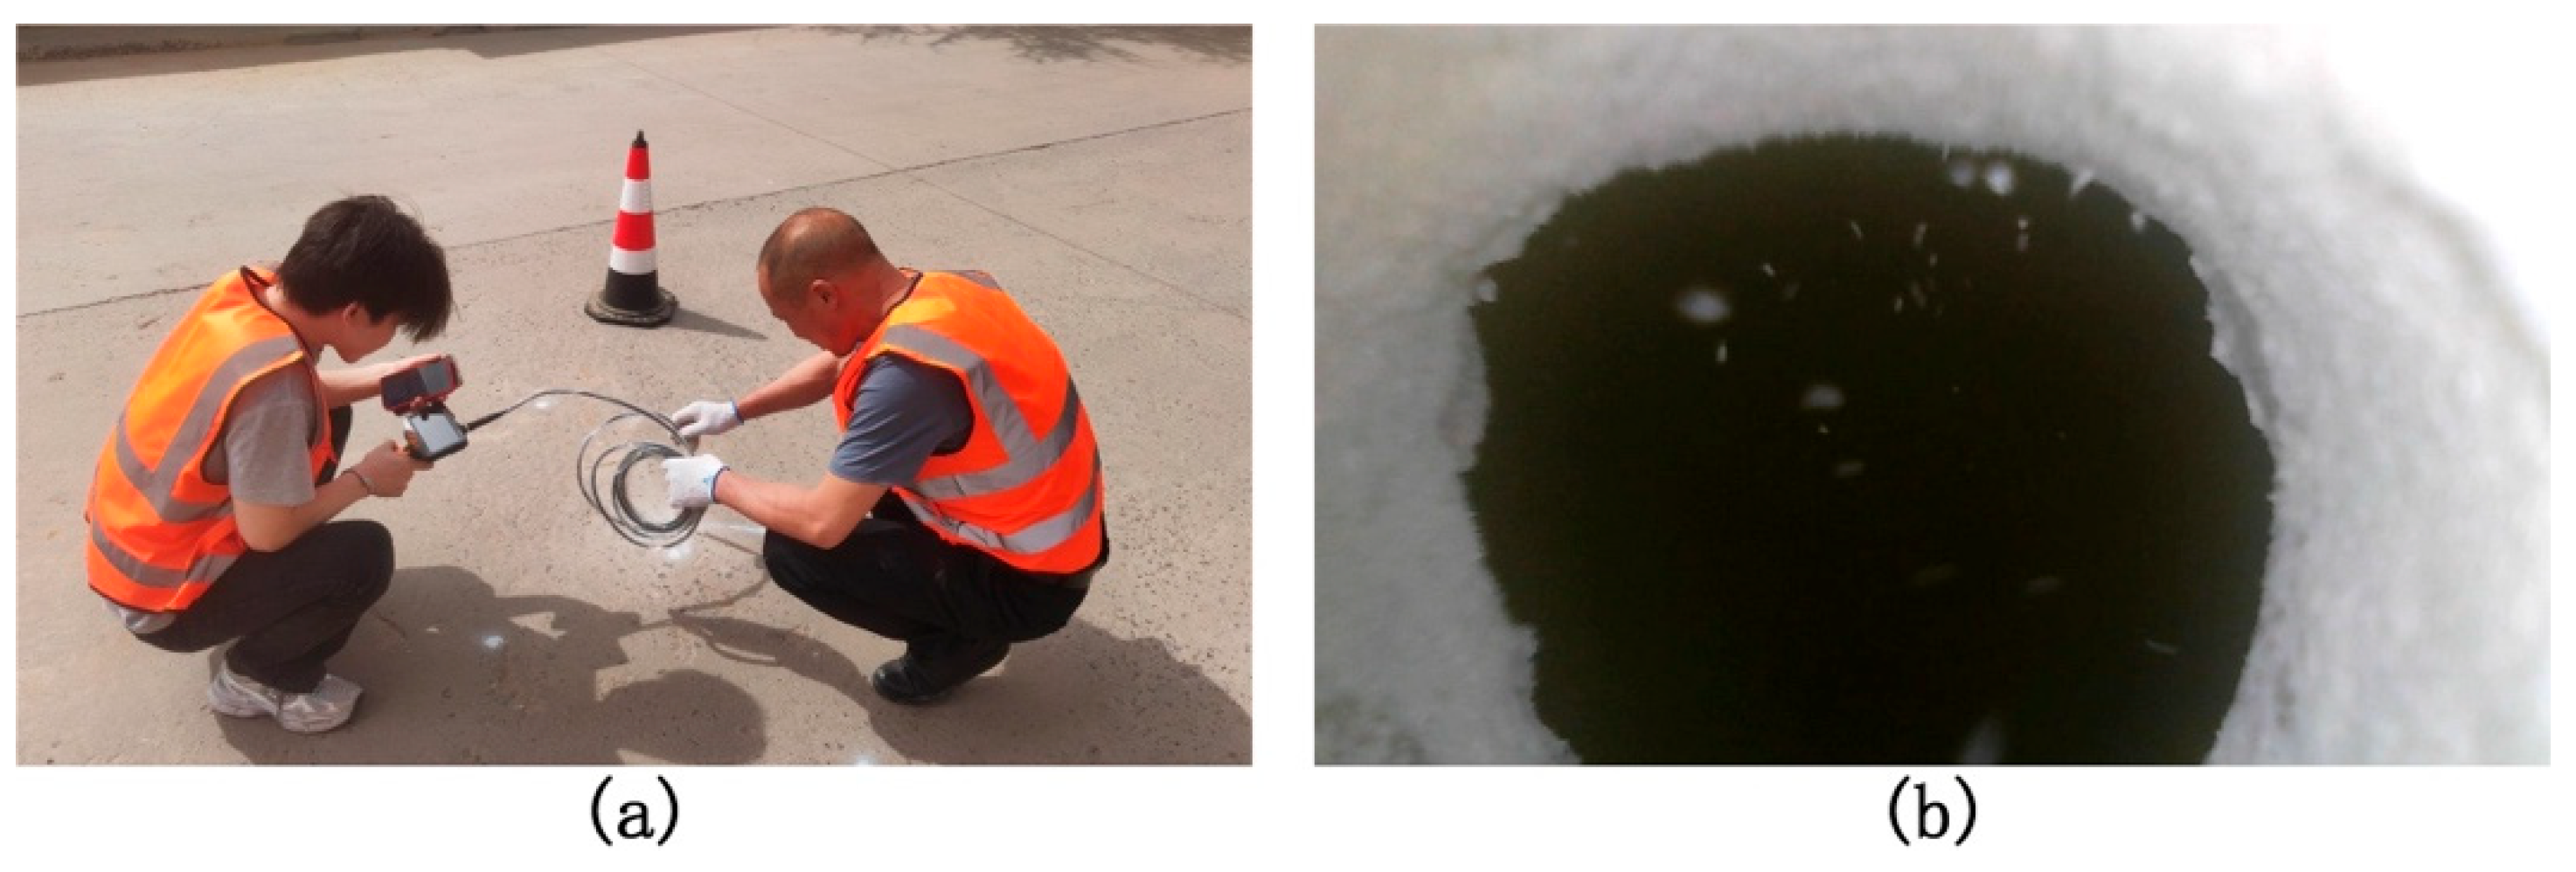
To further verify the generalization capability of the proposed model and its adaptability in practical applications, this section evaluates the model on two representative public ground-penetrating radar (GPR) void detection datasets, shown in
Figure 14a,b, corresponding to References [
27,
28], respectively. The dataset in
Figure 14a was collected from an actual roadbed void detection task at Shenyang Jianzhu University, representing a typical urban road environment. This dataset features complex background interference, diverse underground structures, and realistic target echo characteristics, effectively reflecting the model’s robustness and detection capability under various interference signals and echo intensity variations. The dataset in
Figure 14b originates from a vehicle lane detection task on Beimen Street in Kecheng District, Quzhou City, Zhejiang Province (covering the section from Xi’an Road to Xinheyan Road), collected on-site using the LTD-2600 GPR system (Changchun Technology Co., Changchun, China) equipped with a CG 270 MHz antenna (Geophysical Survey Systems Inc. (GSSI), NH, USA). The radar profiles in this dataset contain prominent multiple reflections and strong signal interference, with blurred target boundaries and complex texture structures. Therefore, it serves as a more challenging benchmark for assessing the model’s detection accuracy and fault tolerance in high-noise environments.
The detection results on the dataset in
Figure 14a demonstrate that the proposed model can accurately locate and identify key reflective features of void regions. Even under conditions of multi-target interference and weak echo signals, the model effectively suppresses background clutter, and the predicted bounding boxes closely align with the true target boundaries. This indicates strong discriminative ability when handling complex textures and signal overlaps, with low overall false positive and false negative rates, showcasing excellent practical applicability. The results in
Figure 14b further validate the model’s robustness against multiple reflections and complex interference backgrounds. Although the voids in this scenario show subtle differences from surrounding structures, posing a typical “weak target” detection challenge, the model still successfully captures key reflection patterns and provides reasonably accurate target localization. While some detection errors occur in areas with blurred boundaries, the overall performance sufficiently demonstrates the model’s adaptability and practical potential in high-noise, high-complexity environments.
It is worth noting that currently available public ground-penetrating radar datasets primarily focus on strong reflection targets such as cavities and pipelines, lacking dedicated data support for areas of severe soil loosening. Such targets exhibit weak reflected signals, blurred boundaries, and irregular textures in radar images, making their detection challenging. Existing datasets are insufficient to capture the diversity and complexity of these targets. To address this limitation in the validation framework, this study conducted field surveys and data collection specifically targeting severely loosened regions, thereby constructing a dedicated independent test set. This dataset provides a more targeted data foundation and experimental support for subsequent model performance evaluation and algorithm optimization in weak target detection tasks.
5.5. Ablation Study
To systematically evaluate the individual contributions of each proposed module to the overall model performance, a series of ablation experiments were conducted on the FKS-GPR test set. The AFPN, AKConv, and CGAttention modules were progressively removed to construct a set of comparative models based on the YOLOv8 framework. For each model, key performance metrics—including mean Average Precision (mAP), mean recall, number of parameters (Params) [
29], computational complexity (GFLOPs), inference latency, runtime FPS on GPU/CPU, and memory usage—were comprehensively analyzed for both “cavity” and “severely loosened soil” target detection tasks.
The results demonstrate that the introduction of the AFPN module alone (Model B) slightly increased the computational complexity from 7.3 GFLOPs to 7.8 GFLOPs (a 6.8% rise). Meanwhile, the detection accuracy (mAP) and recall improved by 1.5 and 1.4 percentage points, respectively. This performance gain is primarily attributed to the module’s multi-scale feature fusion and cross-layer attention mechanisms, which significantly enhance the detection of small and weak targets, especially in the presence of complex background interference. In terms of deployment, Model B maintained real-time feasibility with inference latencies of 16 ms (GPU) and 101 ms (CPU), corresponding to 62.5 FPS and 9.9 FPS, and moderate memory consumption (4.3 GB GPU, 2.6 GB CPU).
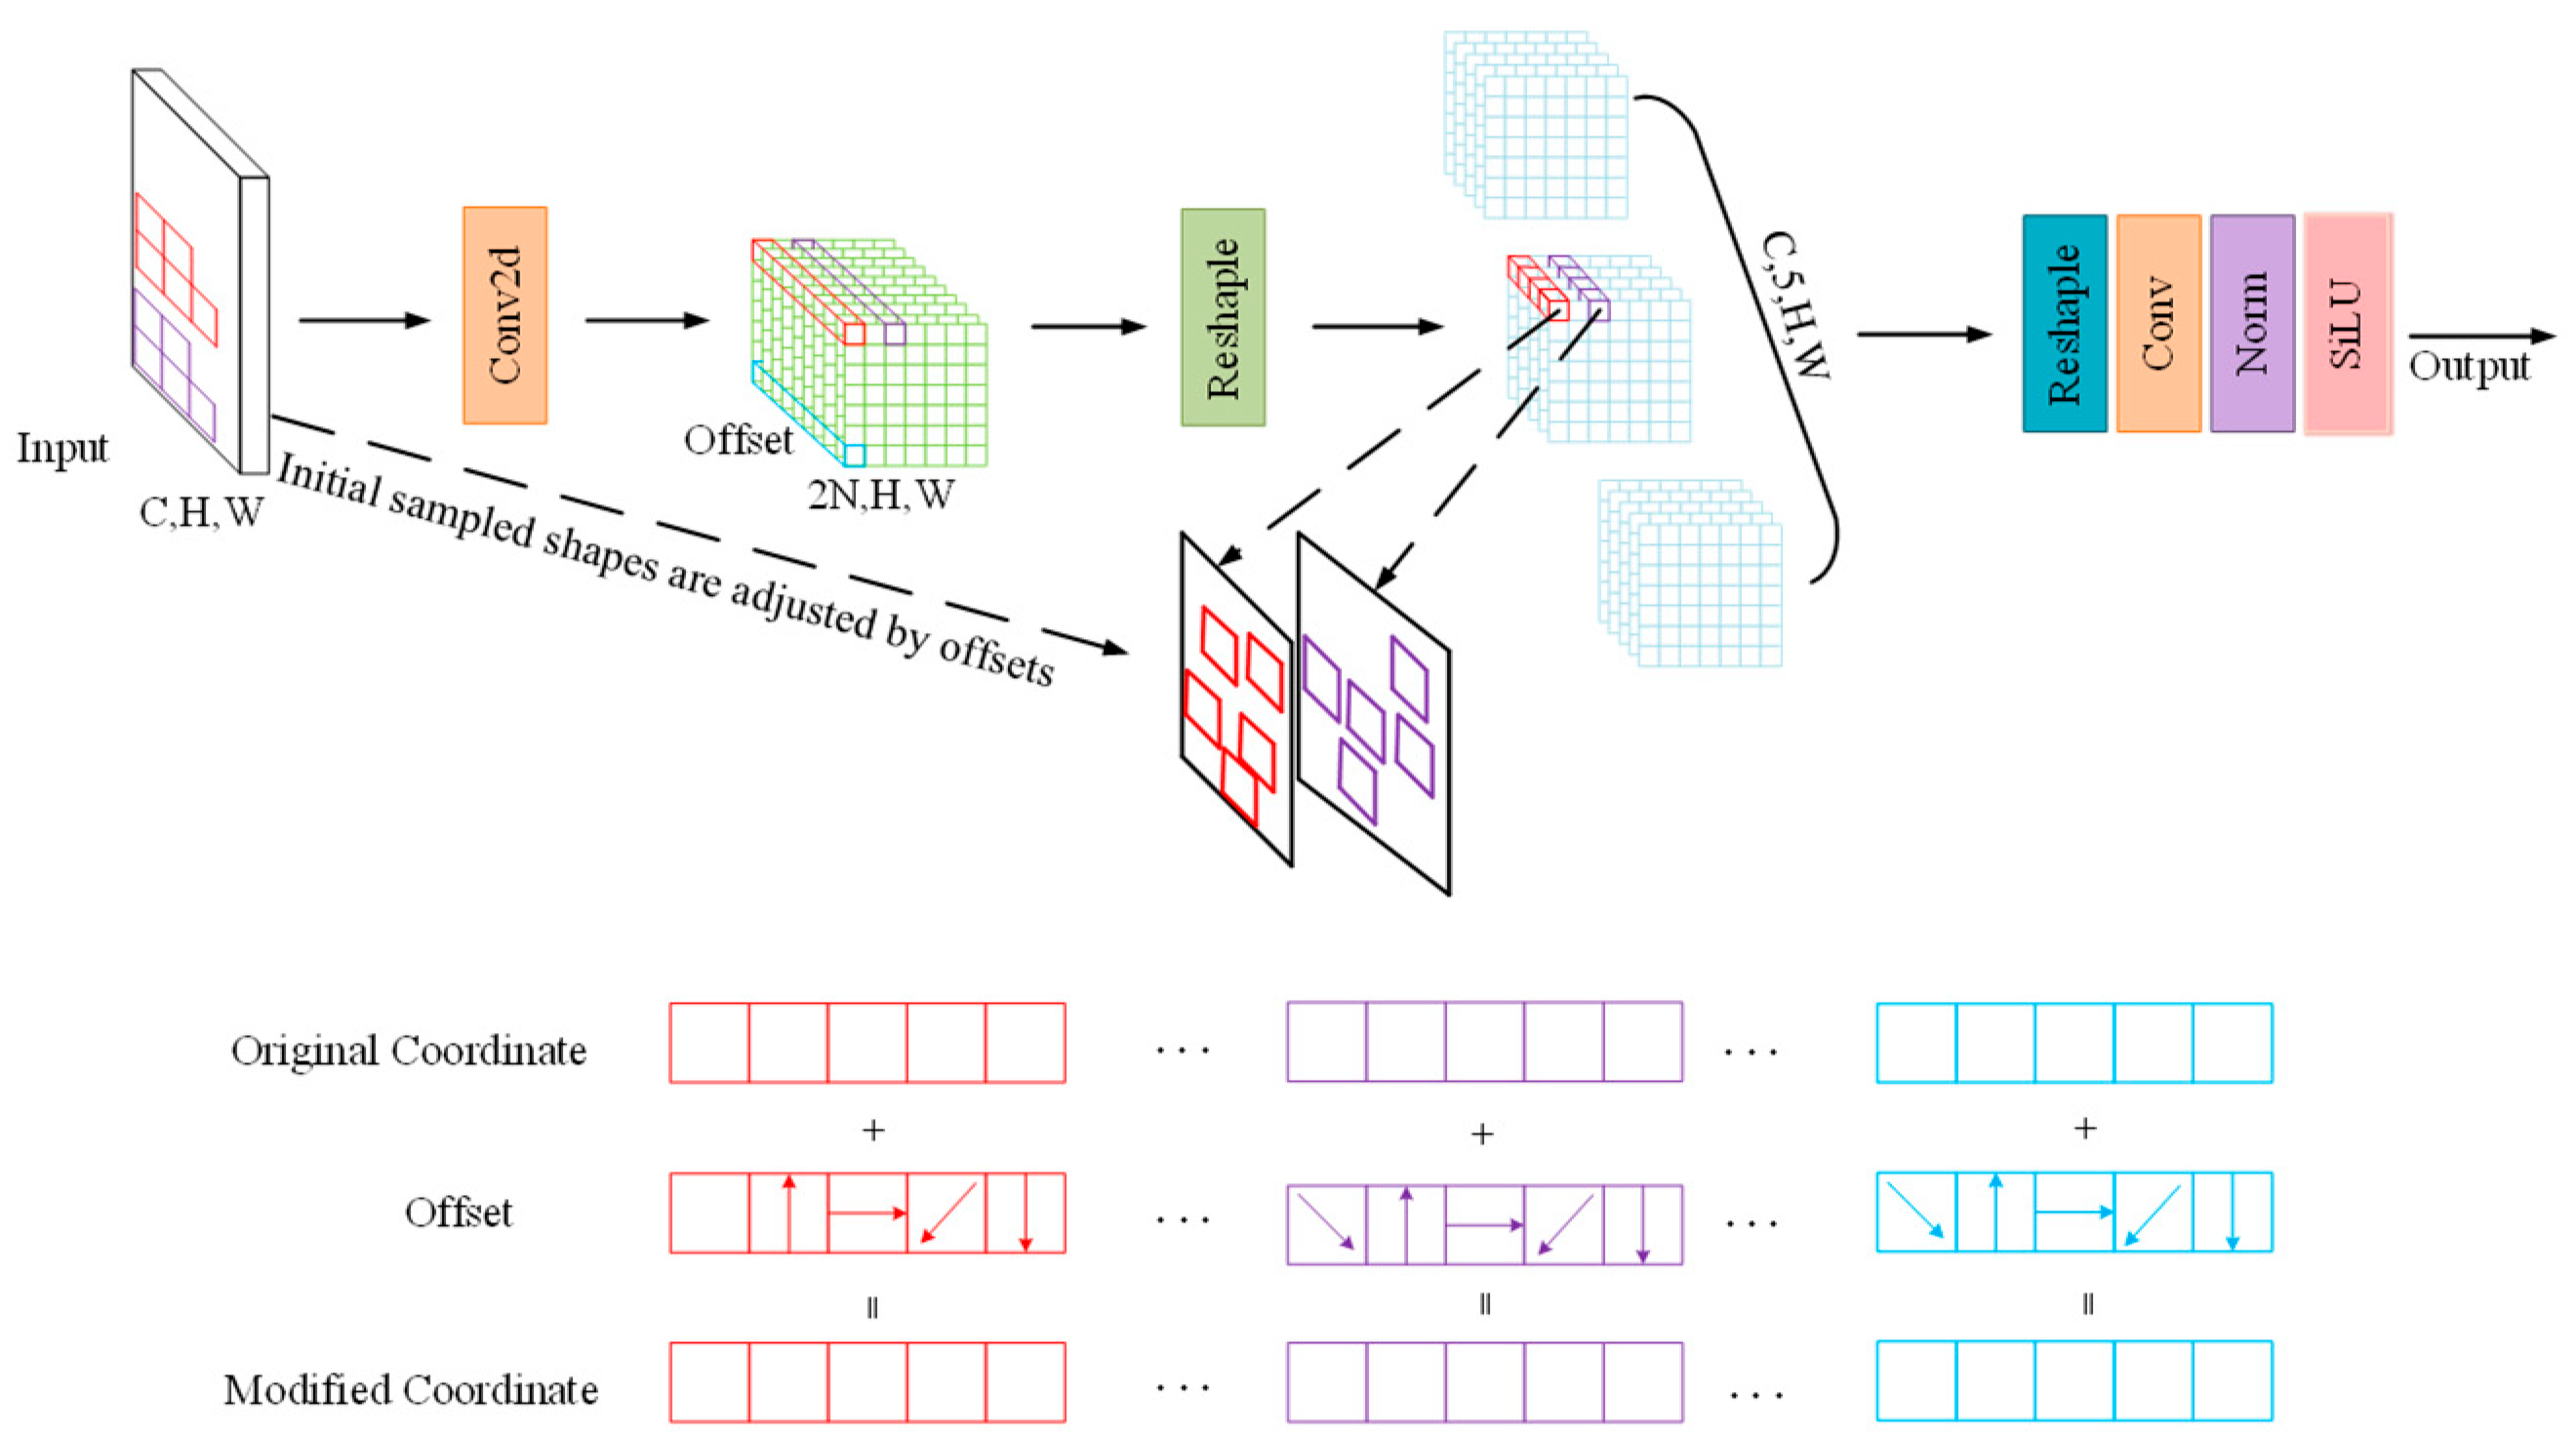
The AKConv module (Model C) further enhanced boundary modeling capabilities, increasing GFLOPs to 8.0 (a 9.6% increase) and achieving additional mAP and recall improvements of 2.0 and 1.6 percentage points, respectively. Its dynamic convolution kernel structure adaptively captured top-edge reflection features, effectively addressing the challenge of significant boundary variations between cavities and loosened regions. Deployment evaluation revealed inference latencies of 17 ms (GPU) and 104 ms (CPU), FPS of 58.8 and 9.6, and memory usage of 4.5 GB (GPU) and 2.6 GB (CPU), demonstrating a favorable trade-off between detection accuracy and computational efficiency.
To further verify the effectiveness and superiority of the AKConv module, a comparative ablation experiment was conducted by replacing AKConv with the widely used Deformable Convolutional Networks v2 (DCNv2) to create Model C2. As shown in
Table 3, although DCNv2 (Model C2) provided some performance improvements over the baseline YOLOv8 (mAP of 86.5%, recall of 85.5%), it still lagged behind the AKConv-based Model C in both detection accuracy and robustness. Critically, Model C2 incurred a substantial increase in computational complexity, with parameters rising to 13.6 M and GFLOPs to 10.5. Moreover, Model C2 exhibited higher inference latency (21 ms GPU, 118 ms CPU) and lower processing speeds (47.6 FPS GPU, 8.4 FPS CPU), along with increased memory consumption (5.5 GB GPU, 2.8 GB CPU). These findings further underscore the computational efficiency advantage of the proposed AKConv module.
The underlying reason for this performance gap lies in the distinct design motivations of the two modules. DCNv2 was originally developed for natural image analysis, aiming to improve adaptability to geometric transformations and object contour variations in tasks characterized by visually prominent boundaries. However, it was not specifically optimized for the unique reflection patterns and boundary characteristics of ground-penetrating radar (GPR) imagery, where targets such as cavities typically generate strong reflections with sharp boundaries, while severely loosened soil regions produce weak echoes with blurred edges and gradual grayscale transitions. Without dedicated modeling of these signal intensity variations, DCNv2 is more susceptible to missed detections and false positives, particularly when dealing with weak boundary targets.
In contrast, the proposed AKConv module is specifically tailored to the physical properties of GPR images. By dynamically adjusting sampling positions and receptive field sizes based on local structural features, AKConv enhances sensitivity to both strong boundary reflections and weakly defined targets. Furthermore, by constraining deformation flexibility within a controlled range, AKConv significantly reduces computational complexity while maintaining robust feature extraction. This design ensures real-time performance and stability, making it highly suitable for practical engineering deployments.
These quantitative findings further validate the theoretical basis outlined in
Section 4.3. The AKConv module not only outperforms DCNv2 in detection accuracy but also exhibits superior computational efficiency and robustness in complex, noisy underground environments. Its hybrid adaptive mechanism simultaneously strengthens the network’s perception of both high-gradient (clear boundary) and low-gradient (blurred boundary) regions, substantially improving detection accuracy and generalization across multiple types of GPR subsurface anomalies.
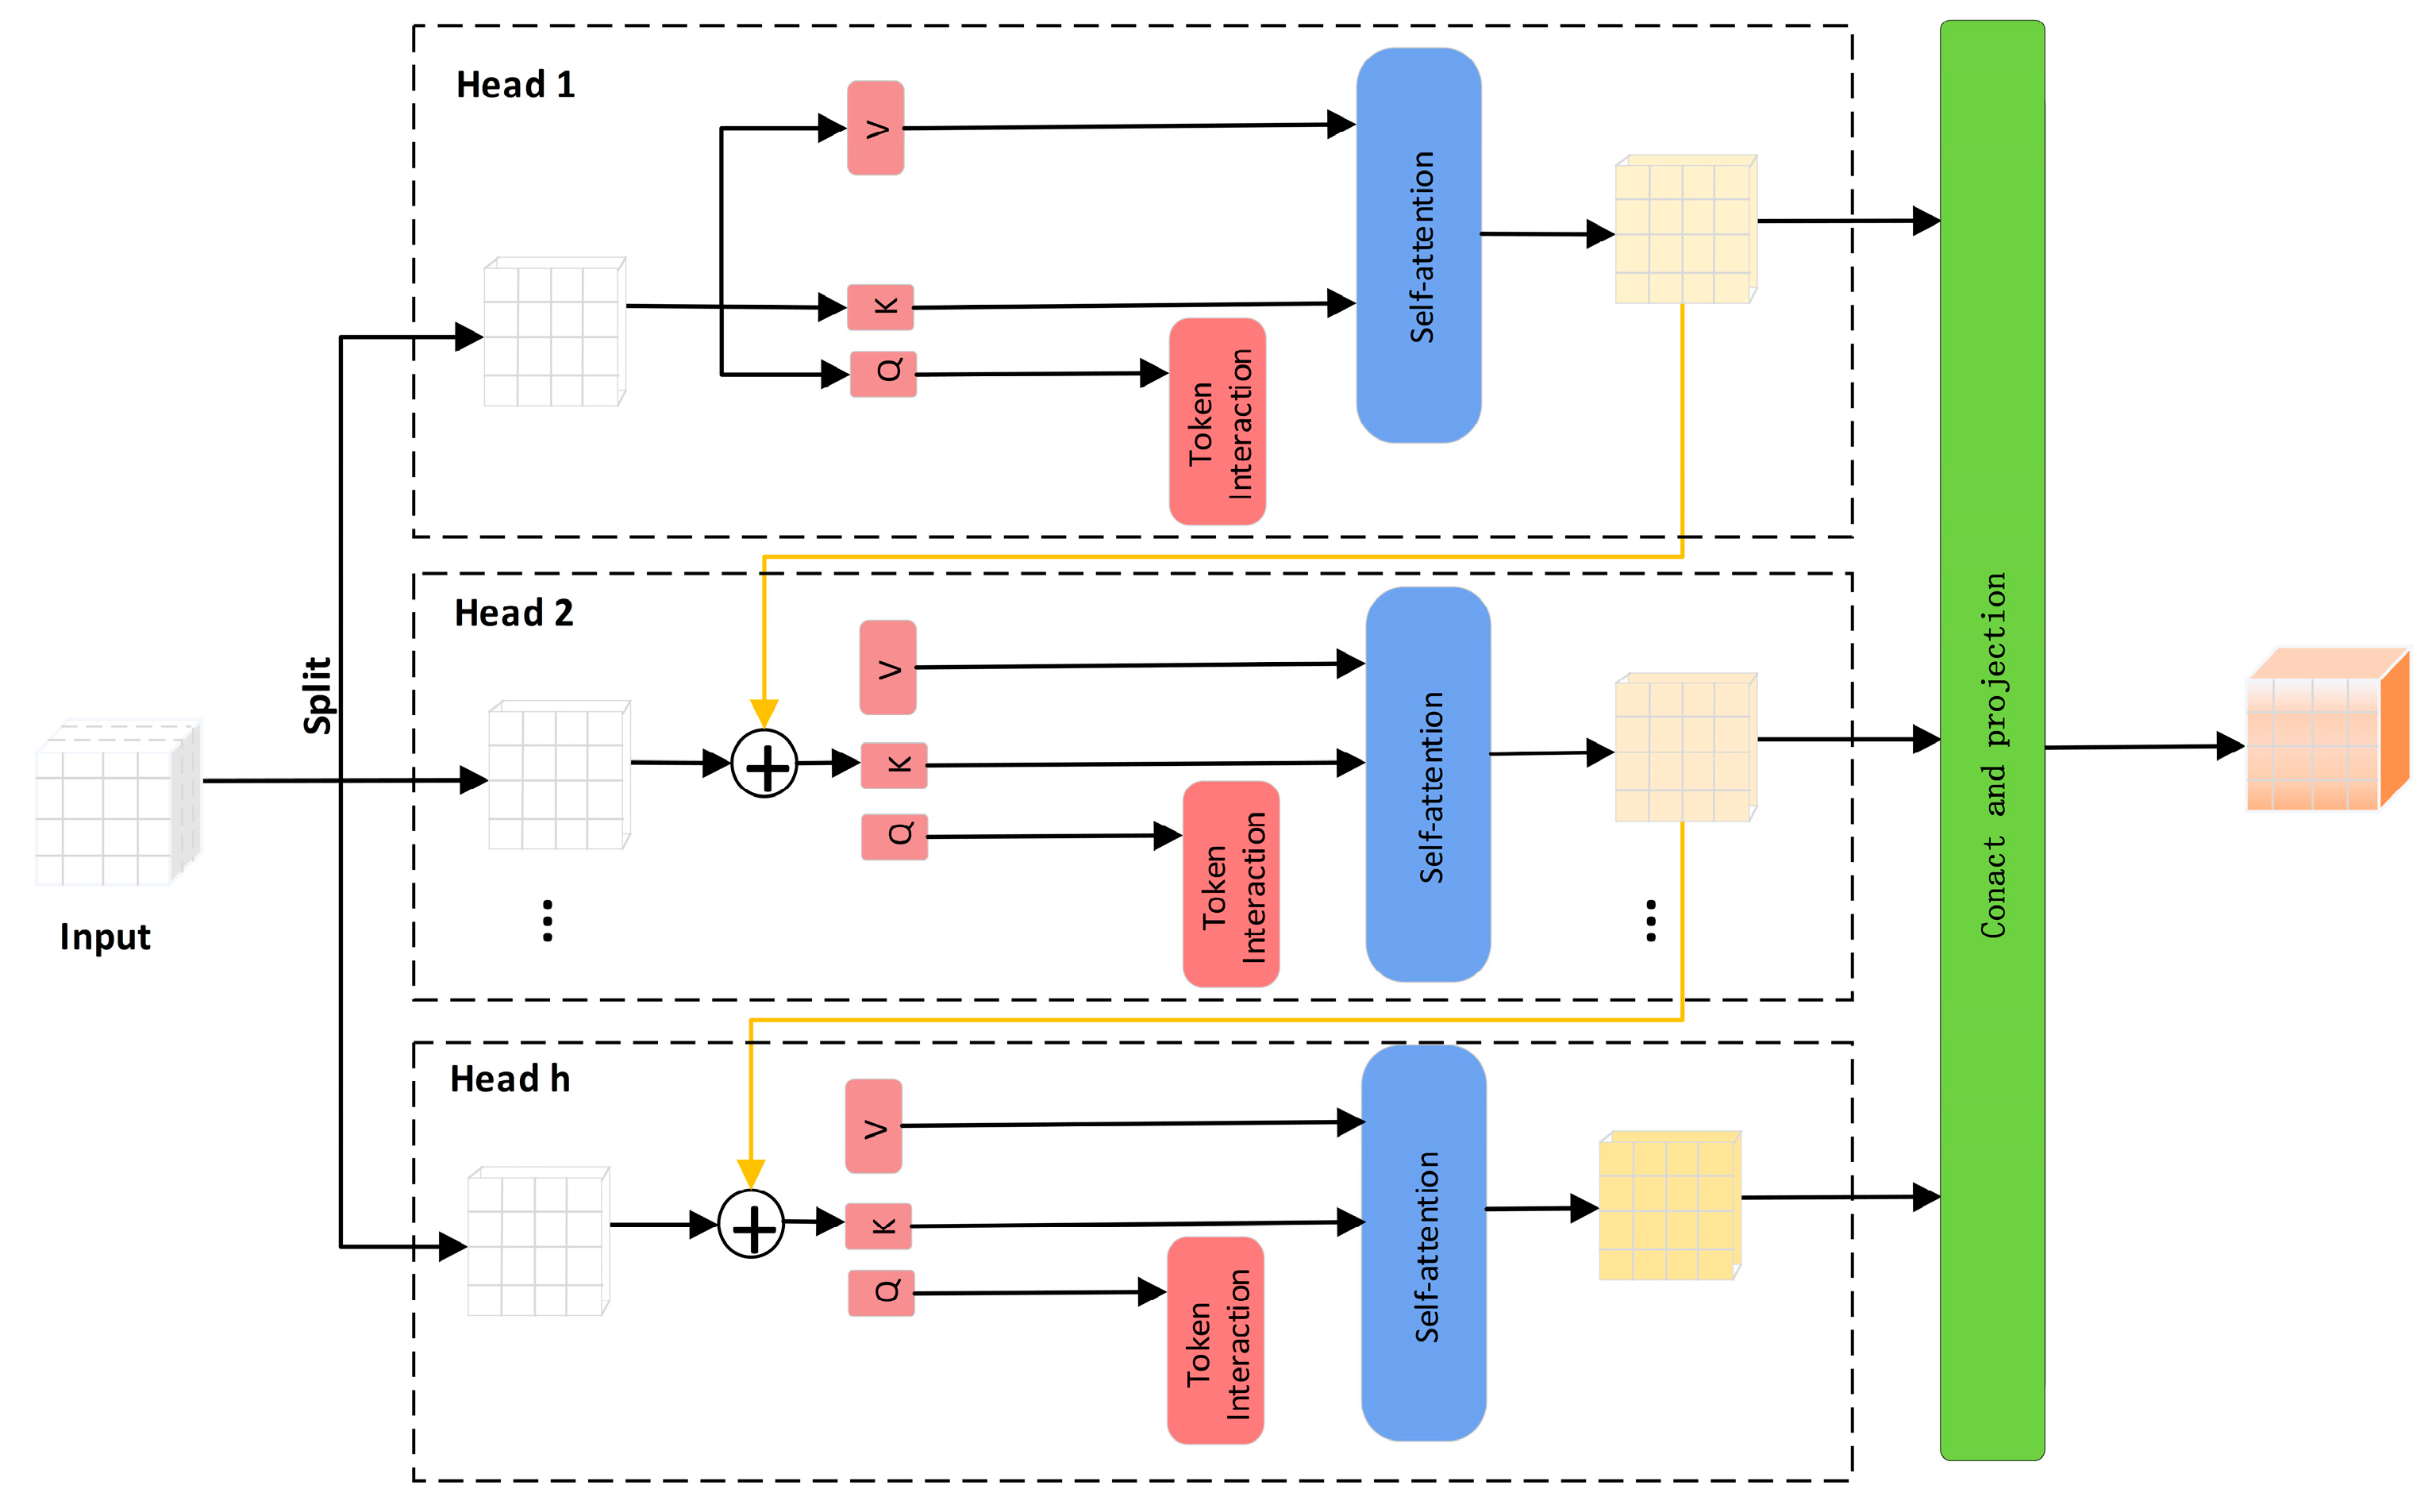
The CGAttention module (Model D) focused on enhancing the perception of echo textures and local morphological patterns. Its inclusion led to an increase in GFLOPs to 7.7, with corresponding improvements in mAP and recall by 1.1 and 0.8 percentage points, respectively. By integrating both channel and spatial attention mechanisms, CGAttention effectively captured anomalous texture regions and improved the discrimination of weak, disordered reflections typically associated with severely loosened soils. Deployment evaluation showed stable computational performance with inference latencies of 16 ms (GPU) and 99 ms (CPU), FPS of 62.5 and 10.1, and memory consumption of 4.2 GB (GPU) and 2.5 GB (CPU).
To explore the complementary benefits of multi-module integration, three intermediate models (Models E, F, and G) combining different subsets of the proposed modules were also evaluated. These models consistently achieved performance improvements over the baseline while maintaining manageable computational overhead. For instance, Model E achieved inference latencies of 18 ms (GPU) and 108 ms (CPU), with processing speeds of 55.5 FPS and 9.3 FPS, and moderate memory consumption (4.8 GB GPU, 2.7 GB CPU). These results demonstrate that multi-module integration can effectively enhance detection performance without causing excessive computational burden.
Ultimately, the fully integrated model (Model H), combining AFPN, AKConv, and CGAttention, delivered the best overall performance. The model achieved a mAP of 92.2% and a recall of 90.8%, representing improvements of 6.6 and 6.4 percentage points over the baseline YOLOv8. Although the computational cost increased to 9.2 GFLOPs (a 26% rise) and parameters grew to 13.8 M, the model maintained a lightweight structure suitable for edge deployment and real-time applications. Deployment evaluation confirmed the practicality of Model H, with inference latencies of 19 ms (GPU) and 113 ms (CPU), FPS of 52.6 and 8.8, and memory consumption of 5.2 GB (GPU) and 2.7 GB (CPU), highlighting its balanced performance across accuracy, speed, and resource efficiency.
In summary, the AFPN, AKConv, and CGAttention modules address the complex reflection characteristics of cavity and severely loosened soil targets from three complementary perspectives: feature fusion, boundary modeling, and texture perception. Their multidimensional collaborative modeling strategy significantly enhances detection accuracy and robustness while maintaining a reasonable and controllable computational load, serving as a key driver of overall model performance improvement.
5.6. Statistical Significance Analysis of Detection Performance
To further verify the reliability and robustness of the reported performance improvements, we conducted a statistical significance analysis based on repeated experiments. Specifically, each detection model was independently trained and evaluated five times on the FKS-GPR test set under identical training conditions. For each model, we computed the mean (μ) and standard deviation (σ) of key evaluation metrics—mean Average Precision (mAP), average recall, and average F1-score—to assess stability across runs.
To determine whether the performance gains achieved by the proposed ACF-YOLO model were statistically significant rather than due to random fluctuations, we performed two-tailed paired t-tests comparing the mAP results of ACF-YOLO against those of the other baseline models. A significance threshold of p < 0.05 was adopted.
Table 4 presents the detailed results. The proposed ACF-YOLO model consistently achieved the highest average scores across all metrics, while maintaining low standard deviations, reflecting its strong robustness and stability. More importantly, all
p-values were below the 0.05 threshold, confirming that the improvements over YOLOv8, Faster R-CNN, YOLOv11, and EfficientDet-D2 are statistically significant. These findings reinforce the validity of the proposed method and address potential concerns about performance variability arising from random initialization, data partitioning, or stochastic optimization. The consistent superiority and statistical significance of ACF-YOLO demonstrate its generalization capability and reliability in real-world GPR detection scenarios.
The results of this section further validate the effectiveness and reliability of the proposed ACF-YOLO model. Its consistently superior detection accuracy, combined with low variability and statistically significant improvements over other models, confirms that the observed gains stem from the carefully designed adaptive feature fusion and attention mechanisms—rather than random chance—thus enhancing the credibility of the method for engineering deployment in complex ground-penetrating radar scenarios.


