
Visual Neuroplasticity: Modulating Cortical Excitability with Flickering Light Stimulation


Abstract
1. Introduction
1.1. Cortical Excitablity
1.2. Magnocellular and Parvocellular Visual Pathways
1.3. Flicker Visual Stimulation
1.4. High Frequency Oscillations and Brain Disorders
1.5. Hypothesis
1.6. Objective
2. Materials and Methods
2.1. Subjects
2.2. EEG Device
2.3. EEG Processing
2.3.1. Preprocessing
2.3.2. Average Band Power (ABP)
2.3.3. Average EEG Signal Amplitude over Time
2.3.4. Cortical Excitability Ratio
2.3.5. Peak Frequency Relative Shift
2.4. Visual Stimulator
2.5. Experimental Procedure
2.6. Data Analysis and Statistics
2.6.1. One-Way Analysis of Variance (ANOVA)
2.6.2. Pearson Cross-Correlation Coefficient
2.6.3. Root Mean Square Error (RMSE)
2.6.4. Kolmogorov–Smirnov (K-S) Test
3. Results
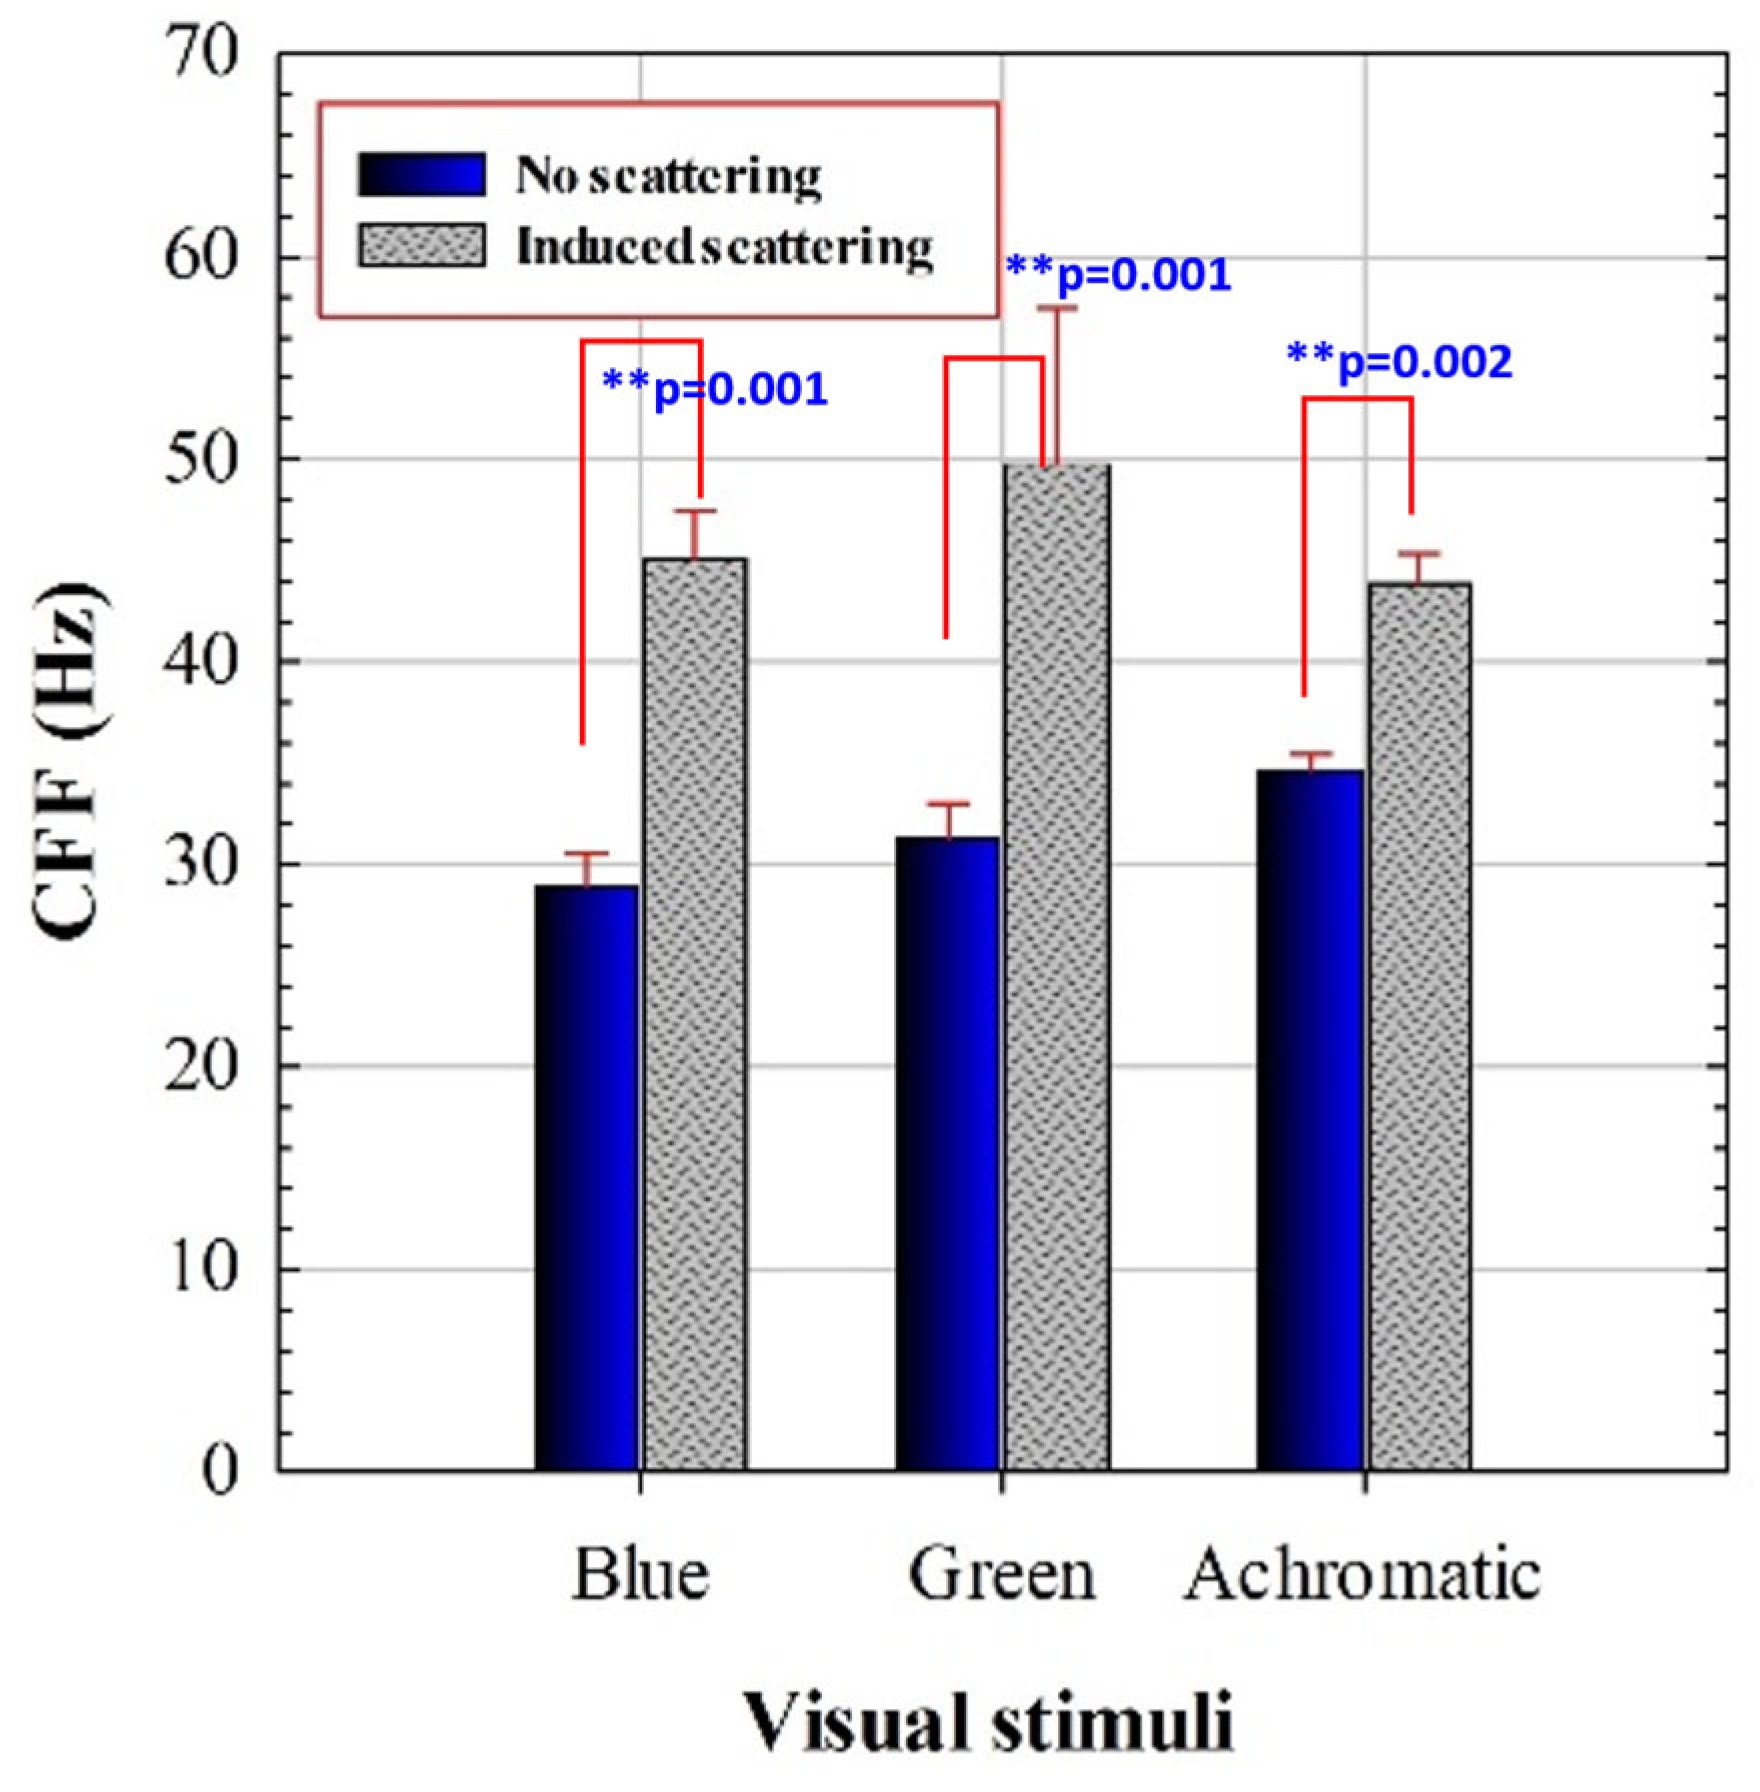
3.1. Critical Flicker Fusion Frequency Assessment
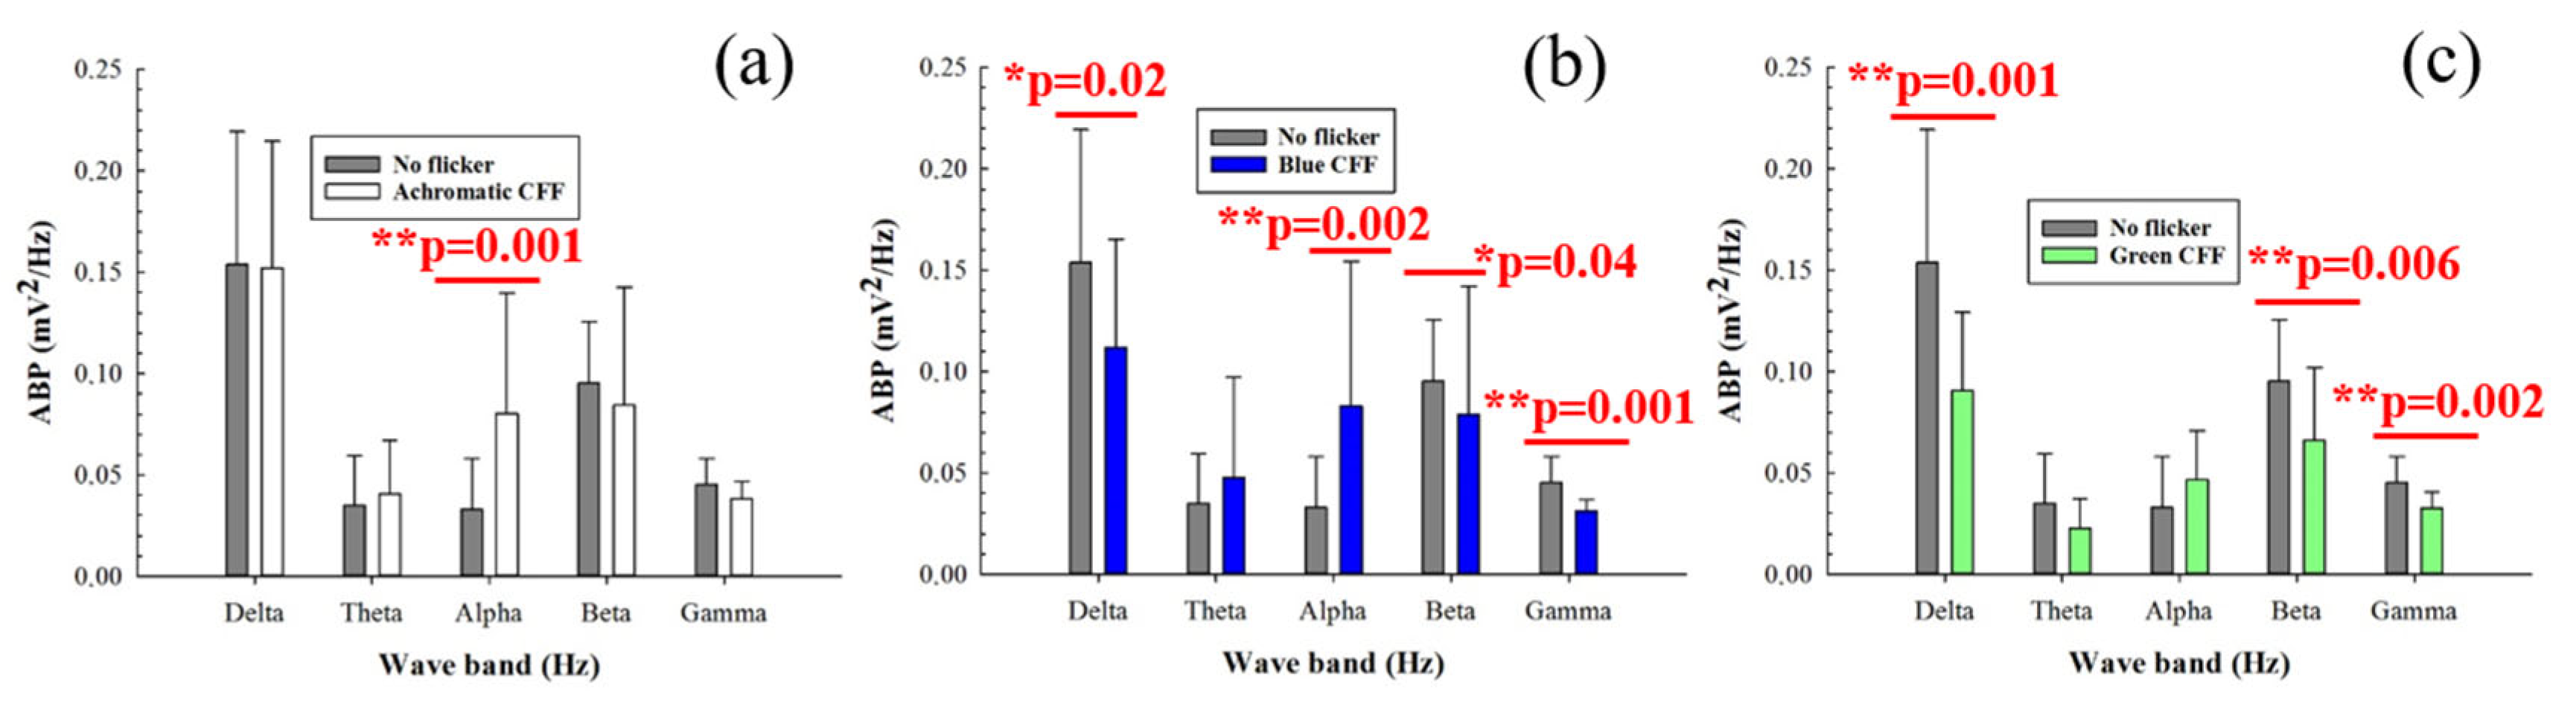
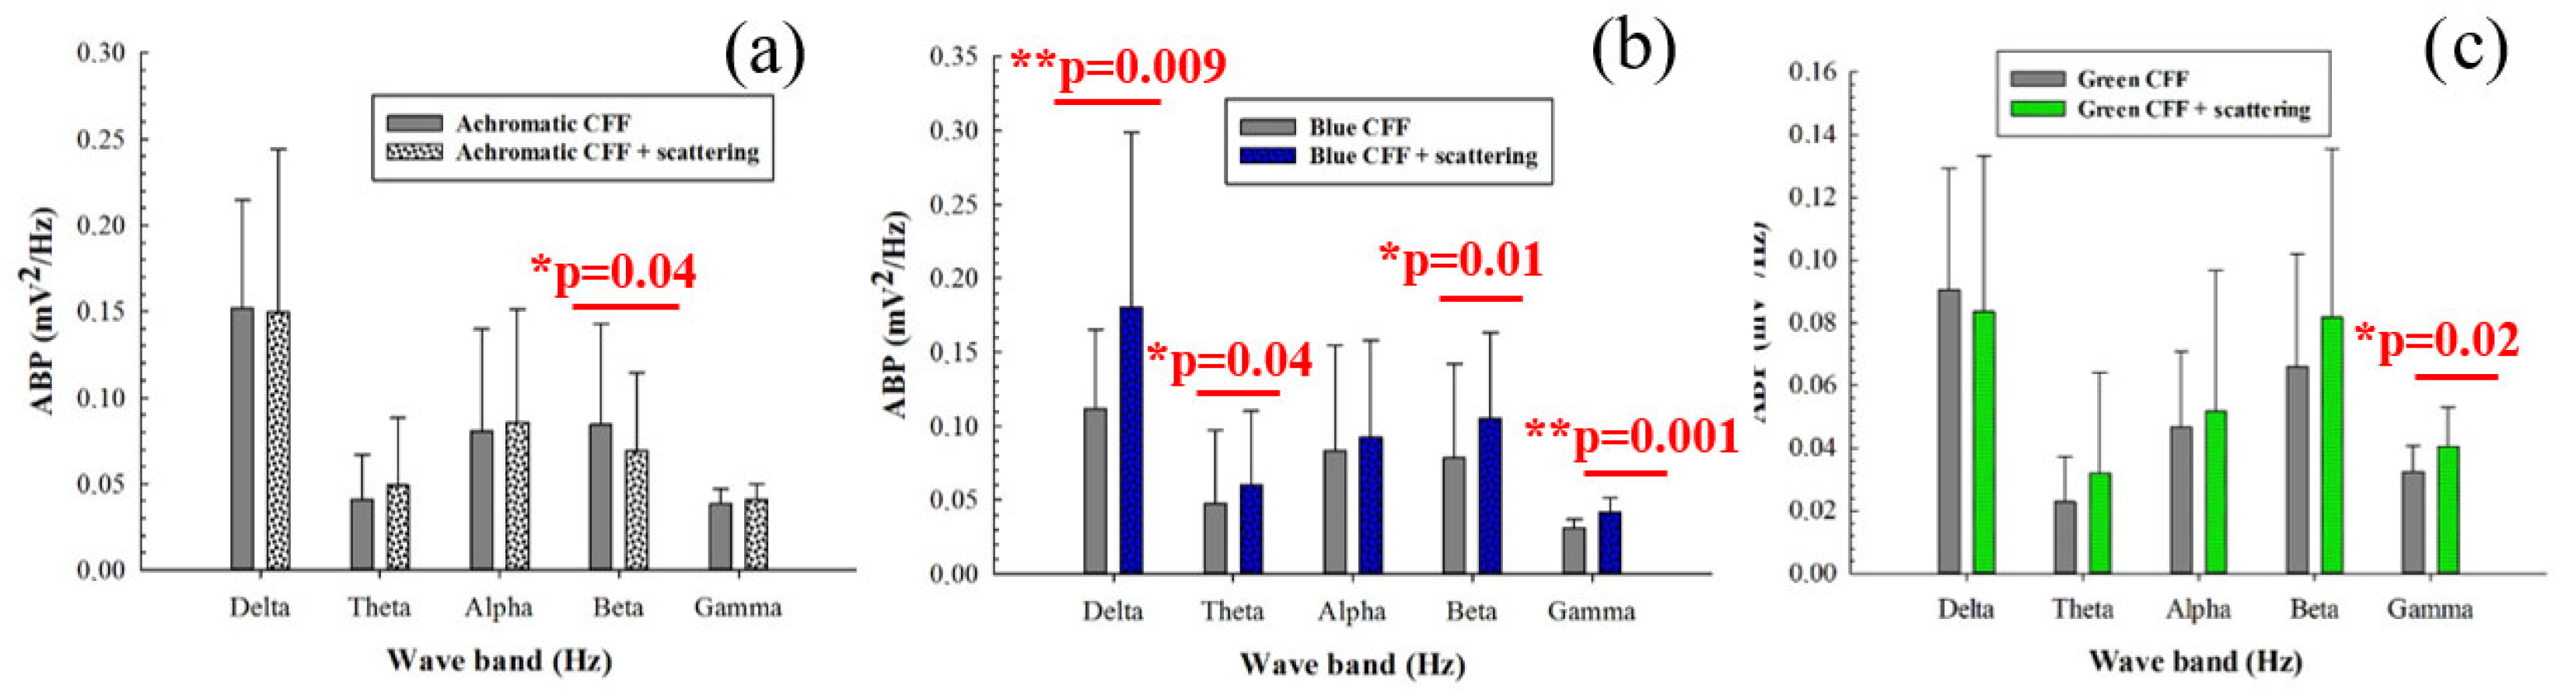
3.2. Averaged Band Power for Different Visual Stimuli
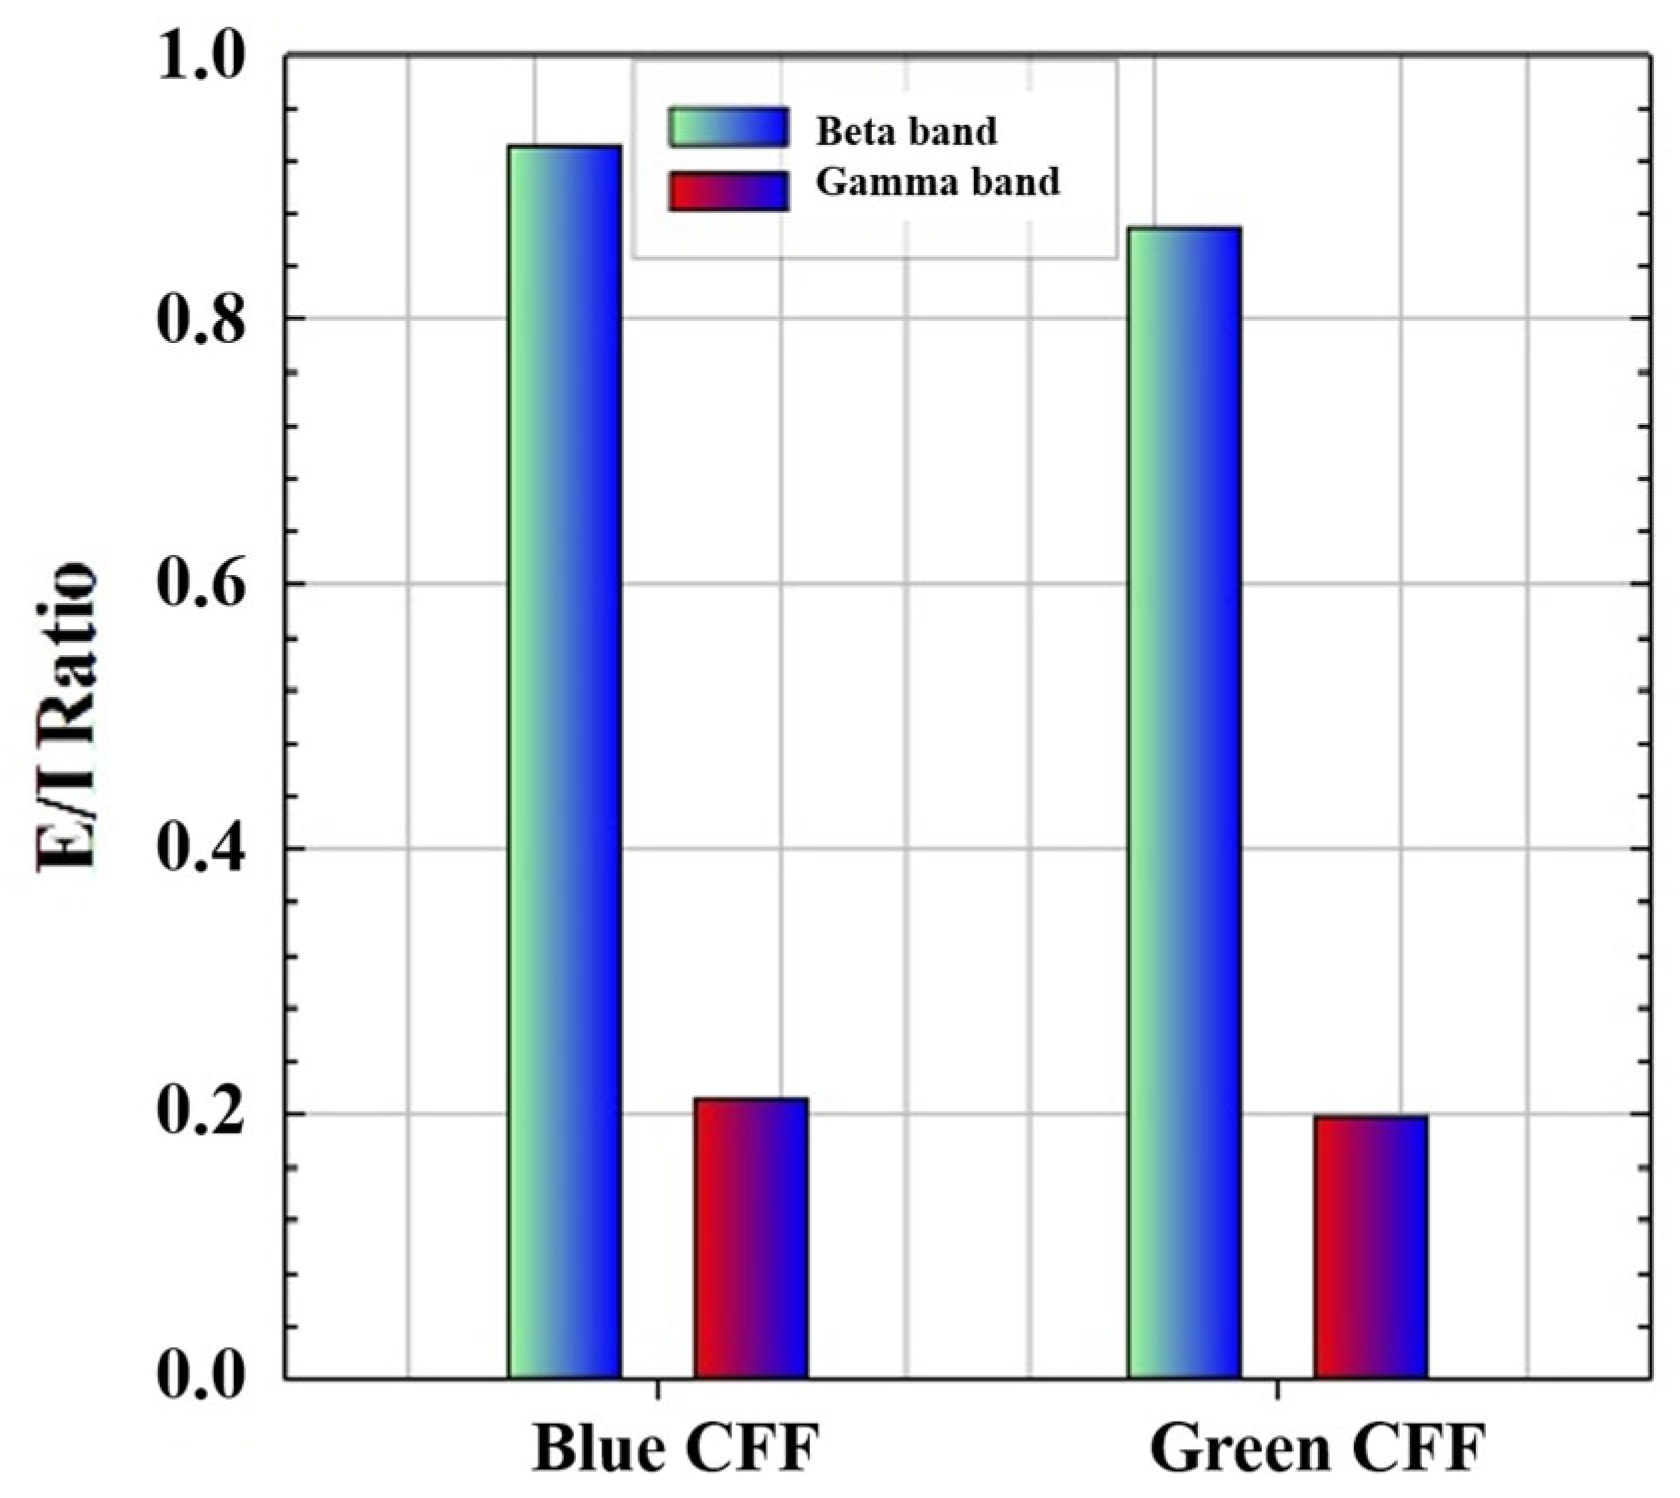
3.3. Cortical Excitability Ratio
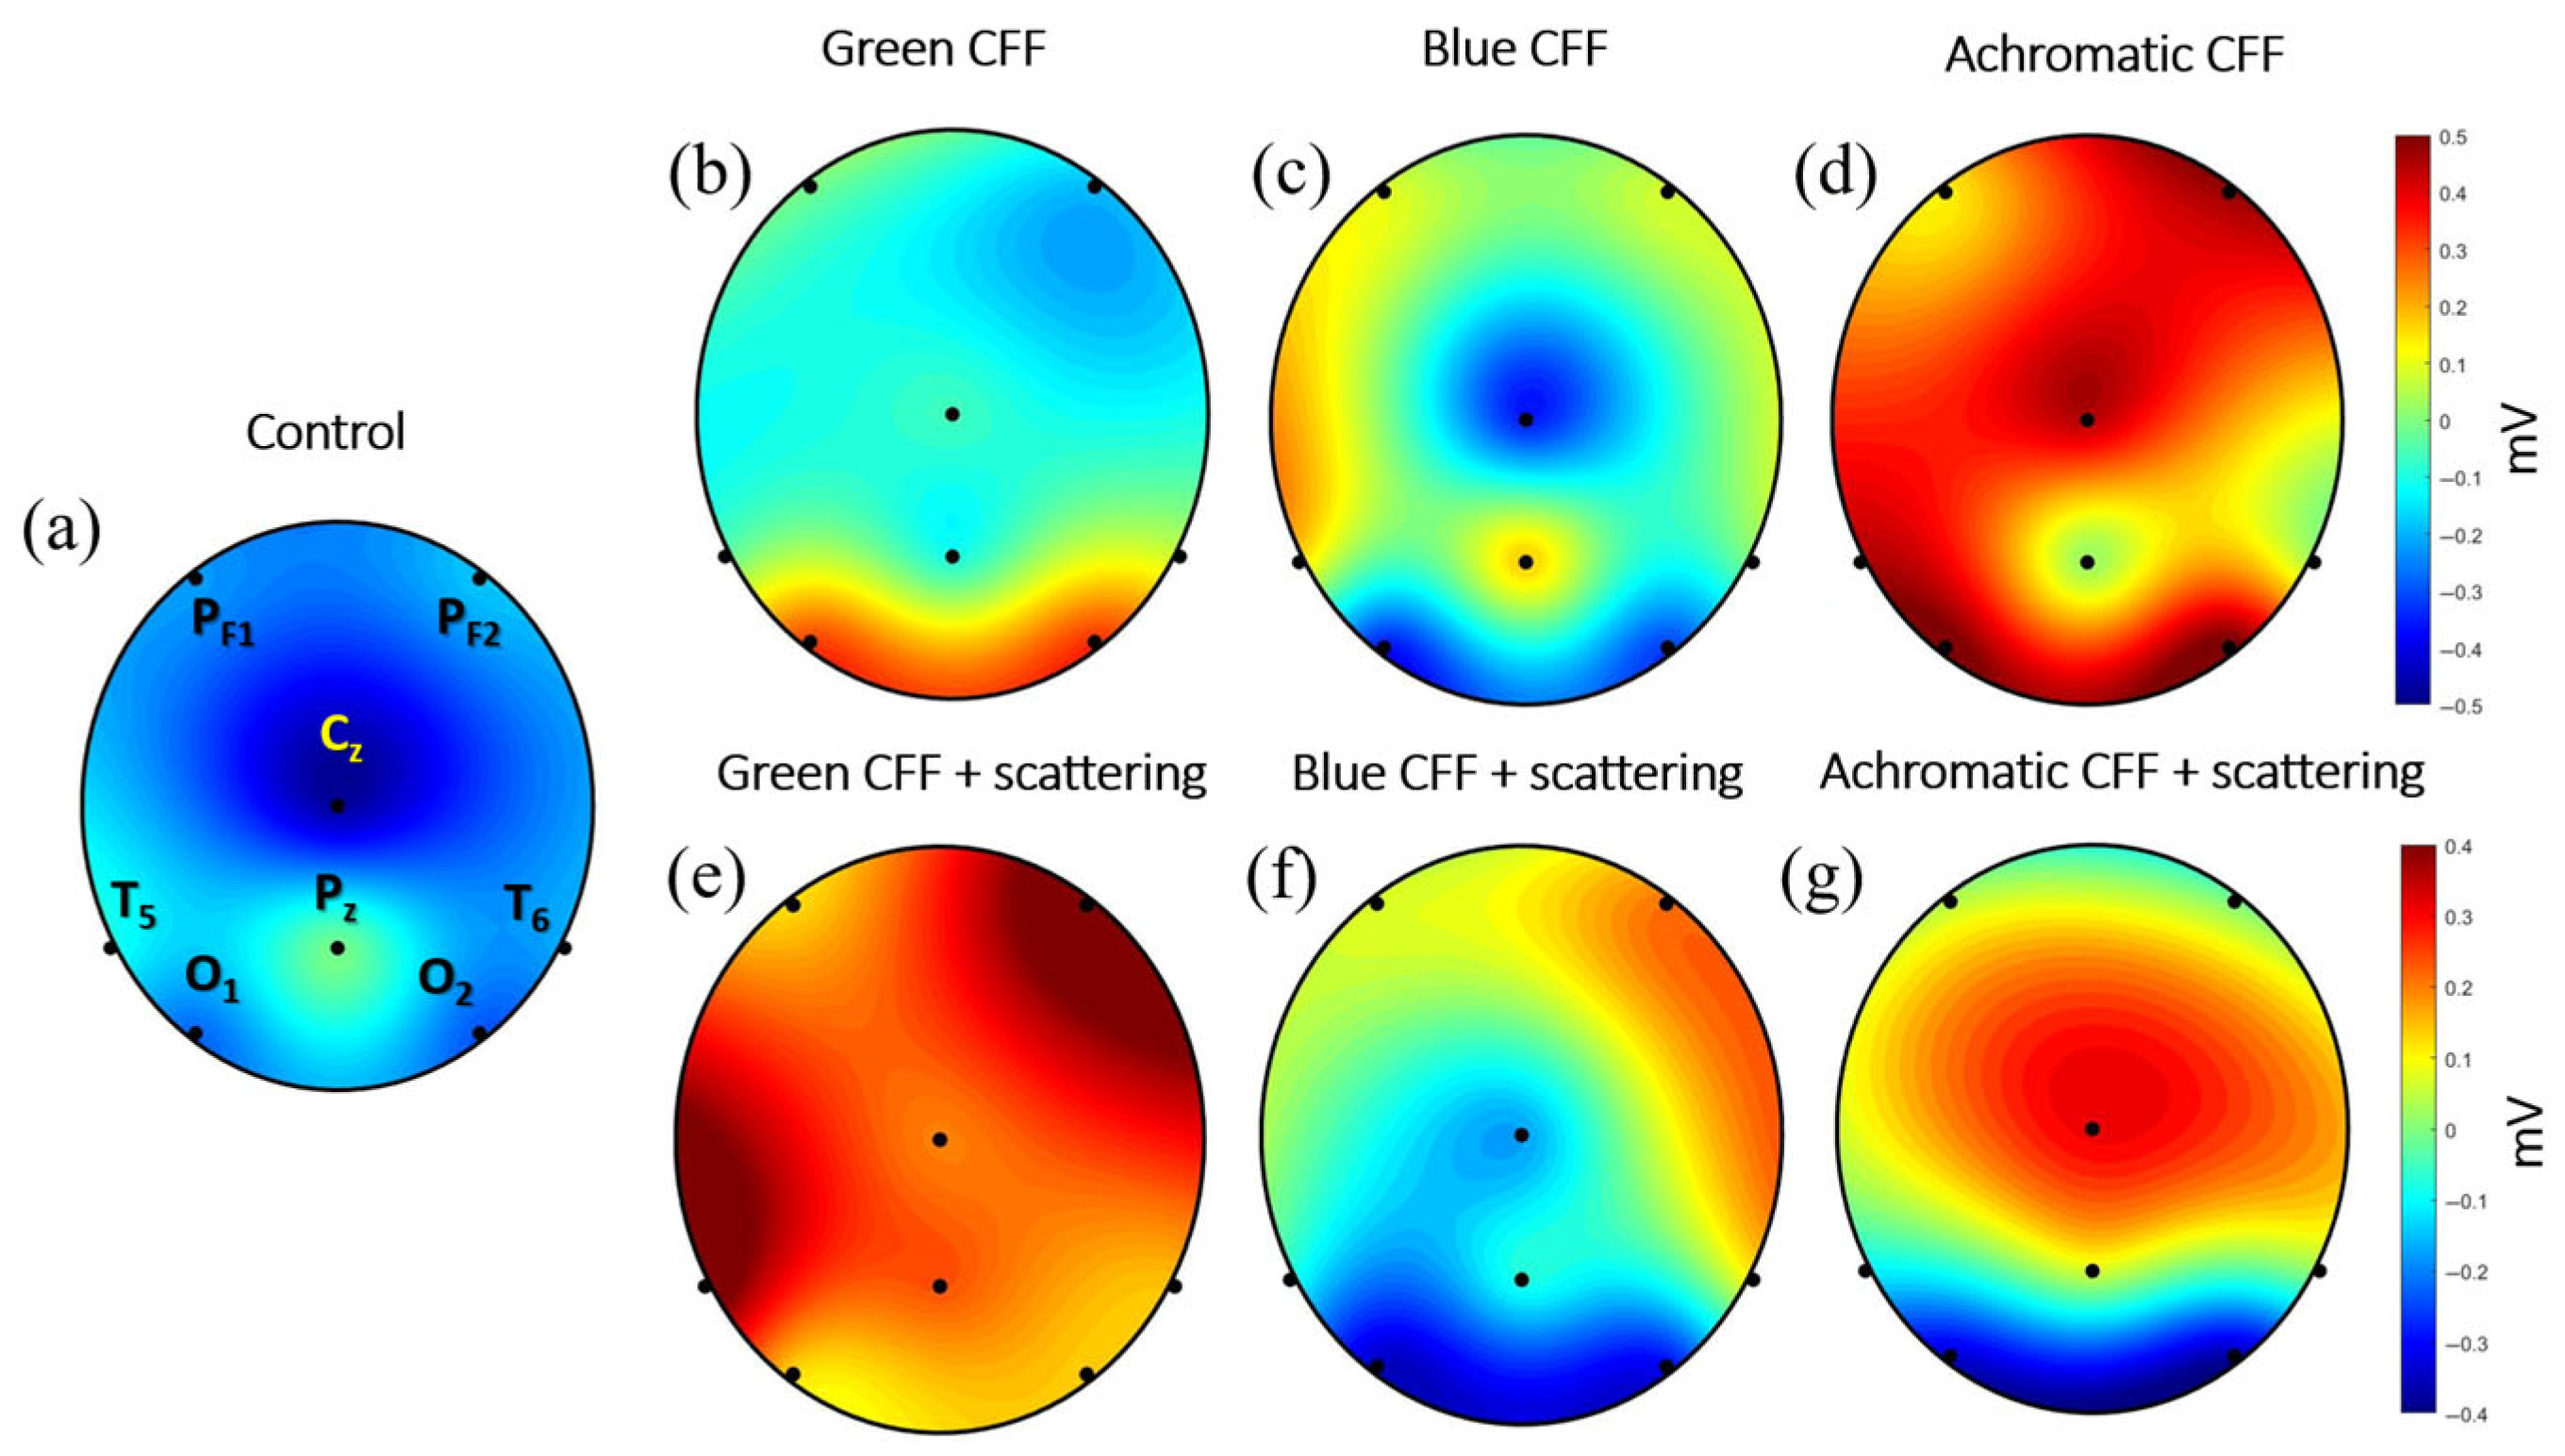
3.4. Topographic EEG Reconstruction
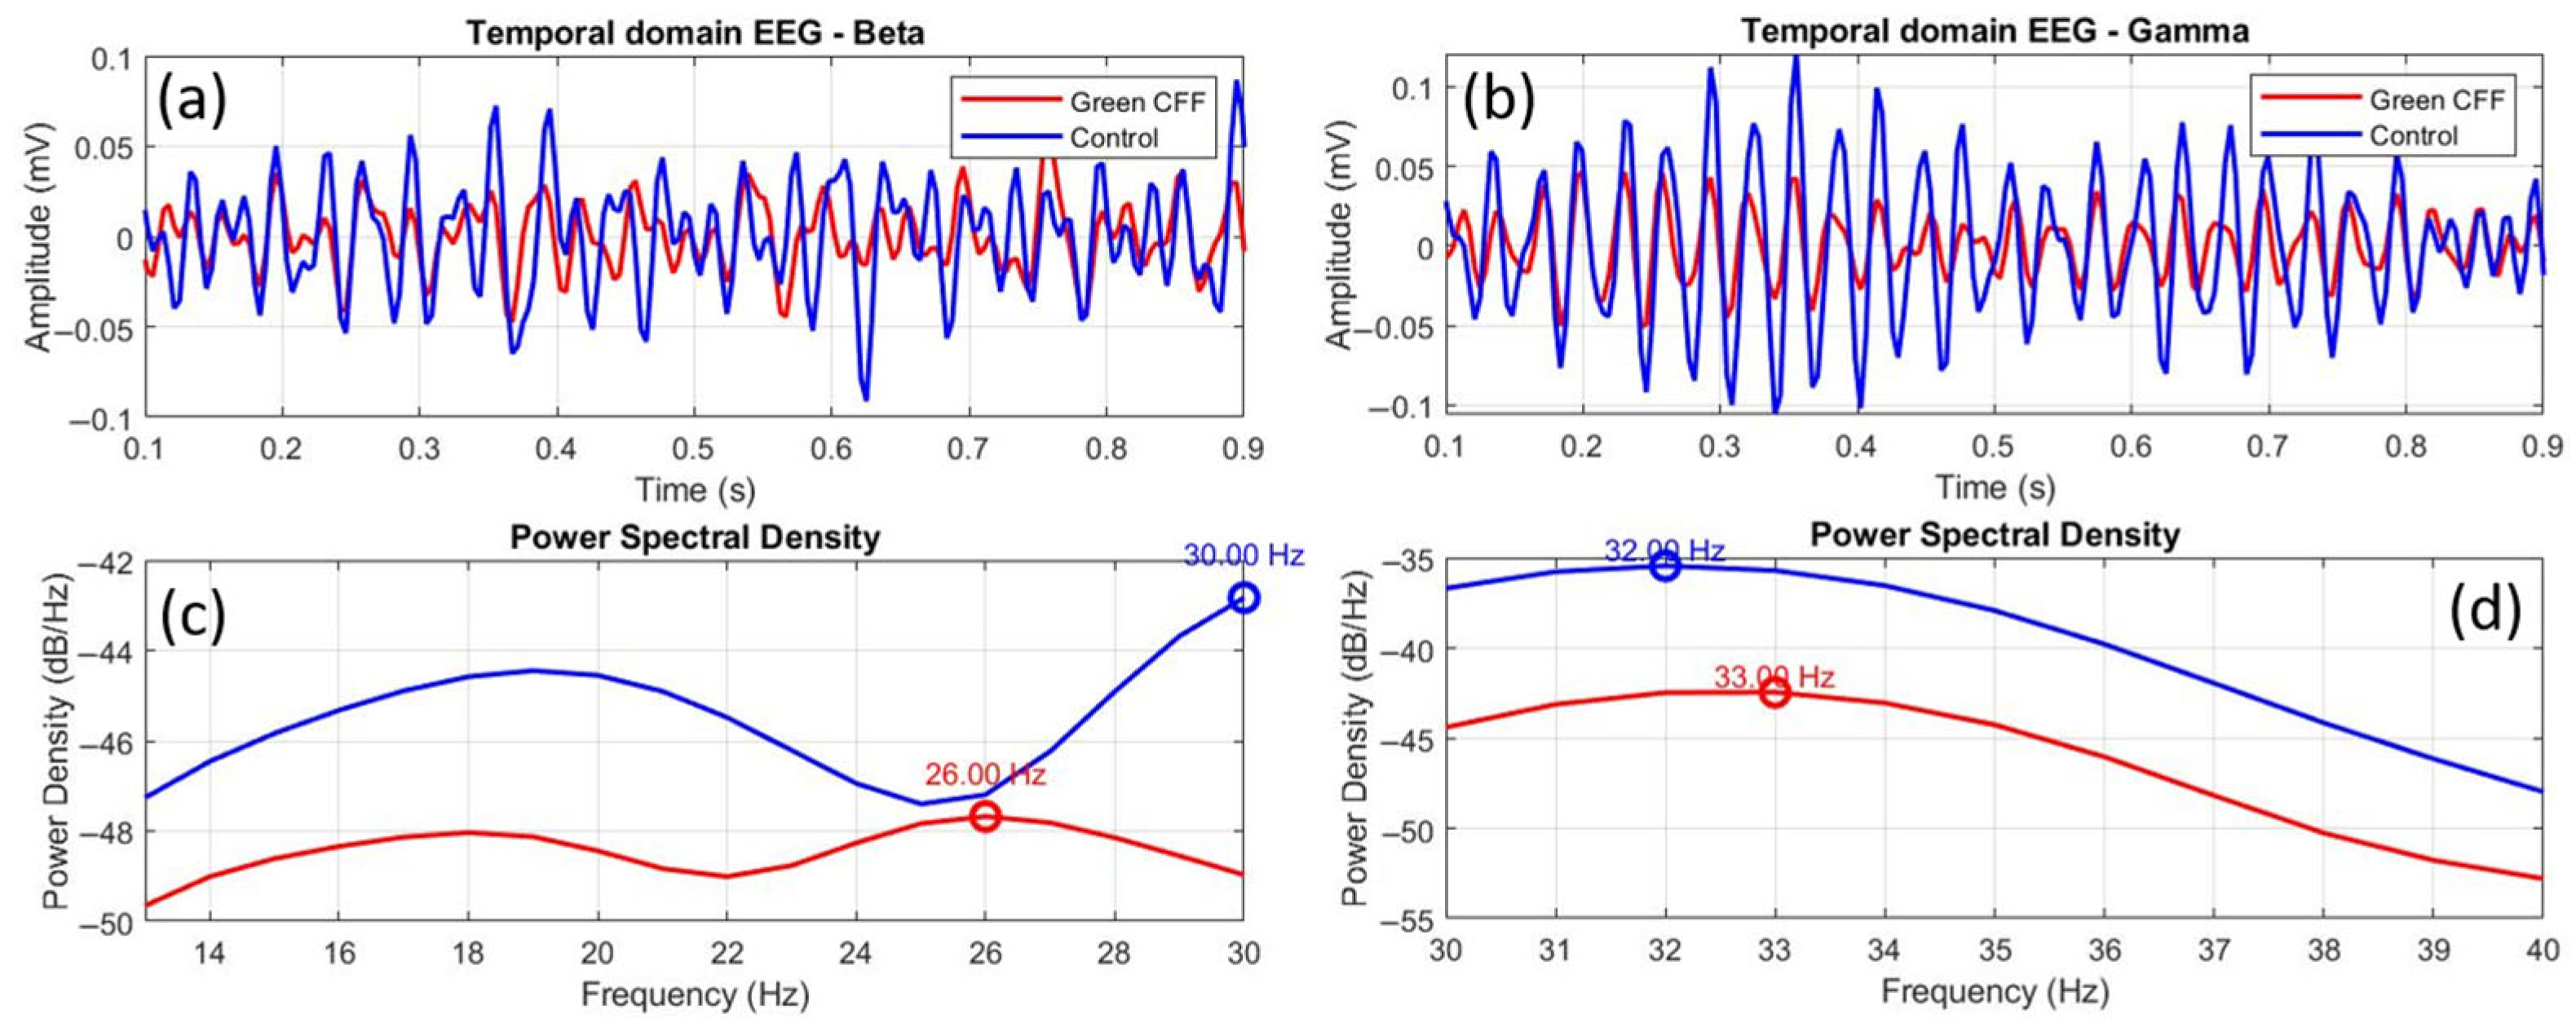
3.5. Peak Frequency Relative Shift
4. Discussion
5. Conclusions
Funding
Institutional Review Board Statement
Informed Consent Statement
Data Availability Statement
Acknowledgments
Conflicts of Interest
References
- Ly, J.; Gaggioni, G.; Chellappa, S.; Papachilleos, S.; Brzozowski, A.; Borsu, C.; Rosanova, M.; Sarasso, S.; Middleton, B.; Luxen, A.; et al. Circadian regulation of human cortical excitability. Nat. Commun. 2016, 7, 11828. [Google Scholar] [CrossRef] [PubMed]
- Bridi, M.C.D.; Zong, F.J.; Min, X.; Luo, N.; Tran, T.; Qiu, J.; Severin, D.; Zhang, X.-T.; Wang, G.; Zhu, Z.-J.; et al. Daily oscillation of the excitation-inhibition balance in visual cortical circuits. Neuron 2020, 105, 621–629.e4. [Google Scholar] [CrossRef] [PubMed]
- Dinse, H.R.; Höffken, O.; Tegenthoff, M. Cortical excitability in human somatosensory and visual cortex: Implications for plasticity and learning—A minireview. Front. Hum. Neurosci. 2023, 17, 1235487. [Google Scholar] [CrossRef]
- Sohal, V.S.; Rubenstein, J.L.R. Excitation-inhibition balance as a framework for investigating mechanisms in neuro-psychiatric disorders. Mol. Psychiatry 2019, 24, 1248–1257. [Google Scholar] [CrossRef]
- Uzunova, G.; Pallanti, S.; Hollander, E. Excitatory/inhibitory imbalance in autism spectrum disorders: Implications for interventions and therapeutics. World J. Biol. Psychiatry 2016, 17, 174–186. [Google Scholar] [CrossRef]
- Goel, A.; Portera-Cailliau, C. Autism in the balance: Elevated E-I ratio as a homeostatic stabilization of synaptic drive. Neuron 2019, 101, 543–545. [Google Scholar] [CrossRef]
- Gao, R.; Peterson, E.J.; Voytek, B. Inferring synaptic excitation/inhibition balance from field potentials. NeuroImage 2017, 158, 70–78. [Google Scholar] [CrossRef]
- Maestú, F.; de Haan, W.; Busche, M.A.; deFelipe, J. Neuronal excitation/inhibition imbalance: Core element of a translational perspective on Alzheimer pathophysiology. Ageing Res. Rev. 2021, 69, 101372. [Google Scholar] [CrossRef]
- Pellegrino, G. Excitation/inhibition balance relates to cognitive function and gene expression in temporal lobe epilepsy: A high density EEG assessment with aperiodic exponent. Brain Commun. 2024, 6, fcae231. [Google Scholar]
- Li, G.; Hsu, L.-M.; Wu, Y.; Bozoki, A.C.; Shih, Y.-Y.I.; Yap, P.-T. Revealing excitation-inhibition imbalance in Alzheimer’s disease using multiscale neural model inversion of resting-state functional MRI. Commun. Med. 2025, 5, 17. [Google Scholar] [CrossRef]
- Sood, A.; Preeti, K.; Fernandes, V.; Khatri, D.K.; Singh, S.B. Glia: A major player in glutamate-GABA dysregulation-mediated neurodegeneration. J. Neurosci. Res. 2021, 99, 3148–3189. [Google Scholar] [CrossRef] [PubMed]
- Biermann, L.; Wunram, H.L.; Pokorny, L.; Breitinger, E.; Großheinrich, N.; Jarczok, T.A.; Bender, S. Changes in the TMS-evoked potential N100 in the dorsolateral prefrontal cortex as a function of depression severity in adolescents. J. Neural Transm. 2022, 129, 1339–1352. [Google Scholar] [CrossRef] [PubMed]
- Tao, C.; Zhang, G.-W.; Sun, W.-J.; Huang, J.J.; Zhang, L.I.; Tao, H.W. Excitation-inhibition imbalance in medial preoptic area circuits underlies chronic stress-induced depression-like states. Nat. Commun. 2024, 15, 8575. [Google Scholar] [CrossRef] [PubMed]
- Howes, O.D.; Shatalina, E. Integrating the neurodevelopmental and dopamine hypotheses of schizophrenia and the role of cortical excitation-inhibition balance. Biol. Psychiatry 2022, 92, 501–513. [Google Scholar] [CrossRef]
- Masri, R.A.; Grünert, U.; Martin, P.R. Analysis of parvocellular and magnocellular visual pathways in human retina. J. Neurosci. 2020, 40, 8132–8148. [Google Scholar] [CrossRef]
- Goodhew, S.C.; Boal, H.L.; Edwards, M. A magnocellular contribution to conscious perception via temporal object segmentation. J. Exp. Psychol. Hum. Percept. Perform. 2014, 40, 948–959. [Google Scholar] [CrossRef]
- Skottun, B.C. On the use of spatial frequency to isolate contributions from the magnocellular and parvocellular systems and the dorsal and ventral cortical streams. Neurosci. Biobehav. Rev. 2015, 56, 266–275. [Google Scholar] [CrossRef]
- Ichinose, T.; Habib, S. ON and OFF signaling pathways in the retina and the visual system. Front. Ophthalmol. 2022, 2, 989002. [Google Scholar] [CrossRef]
- Yoonessi, A.; Yoonessi, A. Functional assessment of magno, parvo and konio-cellular pathways; current state and future clinical applications. J. Ophthalmic Vis. Res. 2011, 6, 119–126. [Google Scholar]
- Teng, M.; Khoo, A.L.; Zhao, Y.J.; Abdin, E.; Mok, Y.M.; Lim, B.P.; Tor, P.C. Neurostimulation therapies in major depressive disorder: A decision-analytic model. Early Interv. Psychiatry 2021, 15, 1531–1541. [Google Scholar] [CrossRef]
- Lundstrom, B.N.; Osman, G.M.; Starnes, K.; Gregg, N.M.; Simpson, H.D. Emerging approaches in neurostimulation for epilepsy. Curr. Opin. Neurol. 2023, 36, 69–76. [Google Scholar] [CrossRef] [PubMed]
- Monteiro, F.; Carvalho, Ó.; Sousa, N.; Silva, F.S.; Sotiropoulos, I. Photobiomodulation and visual stimulation against cognitive decline and Alzheimer’s disease pathology: A systematic review. Alzheimer’s Dement. Transl. Res. Clin. Interv. 2022, 8, e12249. [Google Scholar] [CrossRef] [PubMed]
- Brunelin, J.; Adam, O.; Mondino, M. Recent advances in noninvasive brain stimulation for schizophrenia. Curr. Opin. Psychiatry 2022, 35, 338–344. [Google Scholar] [CrossRef] [PubMed]
- Ávila, F.J. An Arduino-powered device for the study of white perception beyond the visual chromatic critical flicker fusion frequency. J. Imaging 2024, 10, 163. [Google Scholar] [CrossRef]
- Mankowska, N.D.; Marcinkowska, A.B.; Waskow, M.; Sharma, R.I.; Kot, J.; Winklewski, P.J. Critical flicker fusion frequency: A narrative review. Medicina 2021, 57, 1096. [Google Scholar] [CrossRef]
- Peters, J.L.; Bavin, E.L.; Brown, A.; Crewther, D.P.; Crewther, S.G. Flicker fusion thresholds as a clinical identifier of a magnocellular-deficit dyslexic subgroup. Sci. Rep. 2020, 10, 21638. [Google Scholar] [CrossRef]
- Ye, J.; Sinha, P.; Hou, F.; He, X.; Shen, M.; Lu, F.; Shao, Y. Impact of temporal visual flicker on spatial contrast sensitivity in myopia. Front. Neurosci. 2021, 15, 710344. [Google Scholar] [CrossRef]
- Herrmann, C.S. Human EEG responses to 1–100 Hz flicker: Resonance phenomena in visual cortex and their potential correlation to cognitive phenomena. Exp. Brain Res. 2001, 137, 346–353. [Google Scholar] [CrossRef]
- Chen, S.; Lu, H.; Cheng, C.; Ye, Z.; Hua, T. Rapidly repeated visual stimulation induces long-term potentiation of VEPs and increased content of membrane AMPA and NMDA receptors in the V1 cortex of cats. Front. Neurosci. 2024, 18, 1386801. [Google Scholar] [CrossRef]
- Park, Y.; Lee, K.; Park, J.; Bin Bae, J.; Kim, S.-S.; Kim, D.-W.; Woo, S.J.; Yoo, S.; Kim, K.W. Optimal flickering light stimulation for entraining gamma rhythms in older adults. Sci. Rep. 2022, 12, 15550. [Google Scholar] [CrossRef]
- Lee, K.; Park, Y.; Suh, S.W.; Kim, S.-S.; Kim, D.-W.; Lee, J.; Park, J.; Yoo, S.; Kim, K.W. Optimal flickering light stimulation for entraining gamma waves in the human brain. Sci. Rep. 2021, 11, 16206. [Google Scholar] [CrossRef] [PubMed]
- Sahin, L.; Figueiro, M.G. Flickering red-light stimulus for promoting coherent 40 Hz neural oscillation: A feasibility study. J. Alzheimer’s Dis. 2020, 75, 911–921. [Google Scholar] [CrossRef] [PubMed]
- Blanco-Duque, C.; Chan, D.; Kahn, M.C.; Murdock, M.H.; Tsai, L.H. Audiovisual gamma stimulation for the treatment of neurodegeneration. J. Intern. Med. 2024, 295, 146–170. [Google Scholar] [CrossRef]
- Rodrigues-Amorim, D.; Bozzelli, P.L.; Kim, T.; Liu, L.; Gibson, O.; Yang, C.-Y.; Murdock, M.H.; Galiana-Melendez, F.; Schatz, B.; Davison, A.; et al. Multisensory gamma stimulation mitigates the effects of demyelination induced by cuprizone in male mice. Nat. Commun. 2024, 15, 6744. [Google Scholar] [CrossRef]
- Zhao, X.; Huang, L.; Guo, R.; Liu, Y.; Zhao, S.; Guan, S.; Ge, R.; Cui, S.; Wang, S.; Wang, J.-H. Coordinated plasticity among glutamatergic and GABAergic neurons and synapses in the barrel cortex is correlated to learning efficiency. Front. Cell. Neurosci. 2017, 11, 221. [Google Scholar] [CrossRef]
- Schmitt, L.I.; Wimmer, R.D.; Nakajima, M.; Happ, M.; Mofakham, S.; Halassa, M.M. Thalamic amplification of cortical connectivity sustains attentional control. Nature 2017, 545, 219–223. [Google Scholar] [CrossRef]
- Uhlhaas, P.J.; Singer, W. Neural synchrony in brain disorders: Relevance for cognitive dysfunctions and pathophysiology. Neuron 2006, 52, 155–168. [Google Scholar] [CrossRef]
- Abhang, P.A.; Gawali, B.W.; Mehrotra, S.C. Technical aspects of brain rhythms and speech parameters. In Introduction to EEG- and Speech-Based Emotion Recognition; Academic Press: Cambridge, MA, USA, 2016; pp. 51–79. [Google Scholar]
- Sawatari, A.; Callaway, E. Convergence of magno- and parvocellular pathways in layer 4B of macaque primary visual cortex. Nature 1996, 380, 442–446. [Google Scholar] [CrossRef]
- Ávila, F.J. Scattering improves temporal resolution of vision: A pilot study on brain activity. Photonics 2025, 12, 23. [Google Scholar] [CrossRef]
- Iriarte, J.; Urrestarazu, E.; Valencia, M.; Alegre, M.; Malanda, A.; Viteri, C.; Artieda, J. Independent component analysis as a tool to eliminate artifacts in EEG: A quantitative study. J. Clin. Neurophysiol. 2003, 20, 249–257. [Google Scholar] [CrossRef]
- Navarro, R. The optical design of the human eye: A critical review. J. Optom. 2009, 2, 3–18. [Google Scholar] [CrossRef]
- Artal, P. Optics of the eye and its impact in vision: A tutorial. Adv. Opt. Photonics 2014, 6, 340–367. [Google Scholar] [CrossRef]
- Adaikkan, C.; Tsai, L.H. Gamma entrainment: Impact on neurocircuits, glia, and therapeutic opportunities. Trends Neurosci. 2019, 43, 24–41. [Google Scholar] [CrossRef] [PubMed]
- Wang, K.; Chen, K.; Wei, Z.; Wang, T.; Wei, A.; Gao, X.; Qin, Y.; Zhu, Y.; Ge, Y.; Cui, B.; et al. Visual light flicker stimulation: Enhancing alertness in sleep-deprived rats. Front. Neurosci. 2024, 18, 1415614. [Google Scholar] [CrossRef]
- Adaikkan, C.; Middleton, S.J.; Marco, A.; Pao, P.-C.; Mathys, H.; Kim, D.N.-W.; Gao, F.; Young, J.Z.; Suk, H.-J.; Boyden, E.S.; et al. Gamma entrainment binds higher-order brain regions and offers neuroprotection. Neuron 2019, 102, 929–943.e8. [Google Scholar] [CrossRef]
- Gao, R.; Penzes, P. Common mechanisms of excitatory and inhibitory imbalance in schizophrenia and autism spectrum disorders. Curr. Mol. Med. 2015, 15, 146–167. [Google Scholar] [CrossRef]
- Mohammed, H.; Hollis, E.R., II. Cortical reorganization of sensorimotor systems and the role of intracortical circuits after spinal cord injury. Neurotherapeutics 2018, 15, 588–603. [Google Scholar] [CrossRef]
- Lin, S.N.; Lien, Y.R.; Shibata, K.; Sasaki, Y.; Watanabe, T.; Lin, C.-P.; Chang, L.-H. The phase of plasticity-induced neurochemical changes of high-frequency repetitive transcranial magnetic stimulation are different from visual perceptual learning. Sci. Rep. 2023, 13, 5720. [Google Scholar] [CrossRef]
- Stein, J. The magnocellular theory of developmental dyslexia. Dyslexia 2001, 7, 12–36. [Google Scholar] [CrossRef]
- Martínez, A.; Hillyard, S.A.; Dias, E.C.; Hagler, D.J.; Butler, P.D.; Guilfoyle, D.N.; Jalbrzikowski, M.; Silipo, G.; Javitt, D.C. Magnocellular pathway impairment in schizophrenia: Evidence from functional magnetic resonance imaging. J. Neurosci. 2008, 28, 7492–7500. [Google Scholar] [CrossRef]
- Sartucci, F.; Borghetti, D.; Bocci, T.; Murri, L.; Orsini, P.; Porciatti, V.; Origlia, N.; Domenici, L. Dysfunction of the magnocellular stream in Alzheimer’s disease evaluated by pattern electroretinograms and visual evoked potentials. Brain Res. Bull. 2010, 82, 169–176. [Google Scholar] [CrossRef]


| Electrode | Scalp Location | Brain Area | Description |
|---|---|---|---|
| #1: O1 | Left occipital | Occipital lobe (left) | Visual processing |
| #2: O2 | Right occipital | Occipital lobe (right) | Visual processing |
| #3: Pz | Midline parietal | Parietal lobe | Spatial attention, somatosensory integration, coordination |
| #4: Cz | Central midline | Sensorimotor cortex | Motor and somatosensory processing |
| #5: T5 | Left temporal | Temporal lobe (left) | Auditory processing and language |
| #6: T6 | Right temporal | Temporal lobe (right) | Auditory perception and nonverbal memory |
| #7: Fp1 | Left prefrontal | Prefrontal cortex (left) | Attention, decision-making, emotional regulation |
| #8: Fp2 | Right prefrontal | Prefrontal cortex (right) | Executive functions, emotional processing and inhibition |
| Condition | Chromatic/Achromatic | Optical Scattering |
|---|---|---|
| Control | Steady Achromatic | No |
| #1 | Achromatic CFF | No |
| #2 | Blue CFF | No |
| #3 | Green CFF | No |
| #4 | Achromatic CFF | Yes |
| #5 | Blue CFF | Yes |
| #6 | Green CFF | Yes |
| CFF Condition | Difference in Means | t-Statistics | p-Value | Significance |
|---|---|---|---|---|
| Achrom. vs. Blue | 5.80 | 10.27 | <0.001 | Yes |
| Achrom. vs. Green | 3.43 | 6.48 | <0.001 | Yes |
| Blue vs. Green | 2.38 | 3.45 | 0.007 | Yes |
| Delta | Difference in Means | T | p | Significance |
| Achrom. vs. Blue | 0.04 | 2.16 | 0.045 | Yes |
| Achrom. vs. Green | 0.06 | 3.26 | 0.004 | Yes |
| Theta | Difference in Means | T | p | Significance |
| Achrom. vs. Green | 0.02 | 3.87 | 0.001 | Yes |
| Blue vs. Green | 0.03 | 2.11 | 0.049 | Yes |
| Alpha | Difference in Means | T | p | Significance |
| Achrom. vs. Green | 0.034 | 2.34 | 0.031 | Yes |
| Blue vs. Green | 0.04 | 2.35 | 0.030 | Yes |
| Gamma | Difference in Means | T | p | Significance |
| Achrom. vs. Green | 0.007 | 3.59 | 0.002 | Yes |
| Delta | Difference in Means | t-Statistics | p-Value | Significance |
| Achrom. vs. Blue | 0.332 | 2.77 | 0.012 | Yes |
| Ahcrom. vs. Green | 0.465 | 3.69 | 0.001 | Yes |
| Theta | Difference in Means | t-Statistics | p-Value | Significance |
| Achrom. vs. Green | 0.693 | 3.65 | 0.002 | Yes |
| Alpha | Difference in Means | t-Statistics | p-Value | Significance |
| Achrom. vs. Green | 0.41 | 2.74 | 0.013 | Yes |
| Beta | Difference in Means | t-Statistics | p-Value | Significance |
| Achrom. vs. Green | 0.195 | 2.20 | 0.040 | Yes |
| Gamma | Difference in Means | t-Statistics | p-Value | Significance |
| Achrom. vs. Green | 0.181 | 3.67 | 0.001 | Yes |
| Peak Shift (Hz) | R | RMSE | K-S | |
|---|---|---|---|---|
| Beta | −4.0 | 0.574, (p < 0.0001) | 0.081 | p = 0.00458 |
| Gamma | +1.0 | 0.682, (p < 0.0001) | 0.0587 | p = 0.00001 |
| Peak Shift (Hz) | R | RMSE | K-S | |
|---|---|---|---|---|
| Beta | +3.0 | −0.0756, (p = 0.23) | 0.1329 | p = 0.00014 |
| Gamma | −2.0 | 0.168, (p = 0.0077) | 0.0774 | p = 0.00458 |
Disclaimer/Publisher’s Note: The statements, opinions and data contained in all publications are solely those of the individual author(s) and contributor(s) and not of MDPI and/or the editor(s). MDPI and/or the editor(s) disclaim responsibility for any injury to people or property resulting from any ideas, methods, instructions or products referred to in the content. |
© 2025 by the author. Licensee MDPI, Basel, Switzerland. This article is an open access article distributed under the terms and conditions of the Creative Commons Attribution (CC BY) license (https://creativecommons.org/licenses/by/4.0/).
Share and Cite
Ávila, F.J. Visual Neuroplasticity: Modulating Cortical Excitability with Flickering Light Stimulation. J. Imaging 2025, 11, 237. https://doi.org/10.3390/jimaging11070237
Ávila FJ. Visual Neuroplasticity: Modulating Cortical Excitability with Flickering Light Stimulation. Journal of Imaging. 2025; 11(7):237. https://doi.org/10.3390/jimaging11070237
Chicago/Turabian StyleÁvila, Francisco J. 2025. "Visual Neuroplasticity: Modulating Cortical Excitability with Flickering Light Stimulation" Journal of Imaging 11, no. 7: 237. https://doi.org/10.3390/jimaging11070237
APA StyleÁvila, F. J. (2025). Visual Neuroplasticity: Modulating Cortical Excitability with Flickering Light Stimulation. Journal of Imaging, 11(7), 237. https://doi.org/10.3390/jimaging11070237