
Bone Mineral Density (BMD) Assessment Using Dual-Energy CT with Different Base Material Pairs (BMPs)

 , , , ,
Abstract
1. Introduction
1.1. State of the Art
1.2. Aim of the Study
2. Materials and Methods
2.1. Study Population
2.2. Imaging
2.3. Post-Processing
2.4. Data Evaluation and Statistical Analysis
3. Results
4. Discussion
5. Conclusions
Author Contributions
Funding
Institutional Review Board Statement
Informed Consent Statement
Data Availability Statement
Conflicts of Interest
References
- GBD 2019 Fracture Collaborators. Global, regional, and national burden of bone fractures in 204 countries and territories, 1990–2019: A systematic analysis from the Global Burden of Disease Study 2019. Lancet Healthy Longev. 2021, 2, 580–592. [Google Scholar] [CrossRef]
- Kanis, J.A.; McCloskey, E.V.; Johansson, H.; Oden, A.; Melton, L.J., 3rd; Khaltaev, N. A reference standard for the description of osteoporosis. Bone 2008, 42, 467–475. [Google Scholar] [CrossRef]
- Johnell, O.; Kanis, J. An estimate of the worldwide prevalence and disability associated with osteoporotic fractures. Osteoporos. Int. 2006, 17, 1726–1733. [Google Scholar] [CrossRef] [PubMed]
- Kannus, P.; Niemi, S.; Parkkari, J.; Palvanen, M.; Vuori, I.; Järvinen, M. Hip fractures in Finland between 1970 and 1997 and predictions for the future. Lancet 1999, 353, 802–805. [Google Scholar] [CrossRef] [PubMed]
- Pouresmaeili, F.; Kamalidehghan, B.; Kamarehei, M.; Goh, Y.M. A comprehensive overview on osteoporosis and its risk factors. Ther. Clin. Risk Manag. 2018, 14, 2029–2049. [Google Scholar] [CrossRef]
- Curtis, J.R.; Safford, M.M. Management of osteoporosis among the elderly with other chronic medical conditions. Drugs Aging 2012, 29, 549–564. [Google Scholar] [CrossRef]
- Berry, M.E. Using DXA to Identify and Treat Osteoporosis in Pediatric Patients. Radiol. Technol. 2018, 89, 312–317. [Google Scholar] [PubMed]
- Sangondimath, G.; Sen, R.K.; Fazal Rehman, T. DEXA and Imaging in Osteoporosis. Indian J. Orthop. 2023, 57, 82–93. [Google Scholar] [CrossRef]
- El Maghraoui, A.; Roux, C. DXA scanning in clinical practice. QJM Int. J. Med. 2008, 101, 605–617. [Google Scholar] [CrossRef]
- Bolotin, H.H. DXA in vivo BMD methodology: An erroneous and misleading research and clinical gauge of bone mineral status, bone fragility, and bone remodelling. Bone 2007, 41, 138–154. [Google Scholar] [CrossRef]
- Rajiah, P.; Sundaram, M.; Subhas, N. Dual-Energy CT in Musculoskeletal Imaging: What Is the Role Beyond Gout? Am. J. Roentgenol. 2019, 213, 493–505. [Google Scholar] [CrossRef] [PubMed]
- Wang, X.; Li, B.; Tong, X.; Fan, Y.; Wang, S.; Liu, Y.; Fang, X.; Liu, L. Diagnostic Accuracy of Dual-Energy CT Material Decomposition Technique for Assessing Bone Status Compared with Quantitative Computed Tomography. Diagnostics 2023, 13, 1751. [Google Scholar] [CrossRef] [PubMed]
- Patino, M.; Prochowski, A.; Agrawal, M.D.; Simeone, F.J.; Gupta, R.; Hahn, P.F.; Sahani, D.V. Material Separation Using Dual-Energy CT: Current and Emerging Applications. Radiographics 2016, 36, 1087–1105. [Google Scholar] [CrossRef]
- Foti, G.; Ascenti, G.; Agostini, A.; Longo, C.; Lombardo, F.; Inno, A.; Modena, A.; Gori, S. Dual-Energy CT in Oncologic Imaging. Tomography 2024, 10, 299–319. [Google Scholar] [CrossRef]
- Guerrini, S.; Bagnacci, G.; Perrella, A.; Meglio, N.D.; Sica, C.; Mazzei, M.A. Dual Energy CT in Oncology: Benefits for Both Patients and Radiologists From an Emerging Quantitative and Functional Diagnostic Technique. Semin. Ultrasound CT MR 2023, 44, 205–213. [Google Scholar] [CrossRef]
- Wait, J.M.S.; Cody, D.; Jones, A.K.; Rong, J.; Baladandayuthapani, V.; Kappadath, S.C. Performance Evaluation of Material Decomposition with Rapid-Kilovoltage-Switching Dual-Energy CT and Implications for Assessing Bone Mineral Density. Am. J. Roentgenol. 2015, 204, 1234–1241. [Google Scholar] [CrossRef] [PubMed]
- van Hamersvelt, R.W.; Schilham, A.M.R.; Engelke, K.; den Harder, A.M.; de Keizer, B.; Verhaar, H.J.; Leiner, T.; de Jong, P.A.; Willemink, M.J. Accuracy of bone mineral density quantification using dual-layer spectral detector CT: A phantom study. Eur. Radiol. 2017, 27, 4351–4359. [Google Scholar] [CrossRef]
- Touban, B.M.; Sayegh, M.J.; Galina, J.; Pavlesen, S.; Radwan, T.; Anders, M. Computed Tomography Measured Psoas Cross Sectional Area Is Associated with Bone Mineral Density Measured by Dual Energy X-Ray Absorptiometry. J. Clin. Densitom. 2022, 25, 592–598. [Google Scholar] [CrossRef]
- Gruenewald, L.D.; Koch, V.; Martin, S.S.; Yel, I.; Eichler, K.; Gruber-Rouh, T.; Lenga, L.; Wichmann, J.L.; Alizadeh, L.S.; Albrecht, M.H.; et al. Diagnostic accuracy of quantitative dual-energy CT-based volumetric bone mineral density assessment for the prediction of osteoporosis-associated fractures. Eur. Radiol. 2022, 32, 3076–3084. [Google Scholar] [CrossRef]
- Booz, C.; Hofmann, P.C.; Sedlmair, M.; Flohr, T.G.; Schmidt, B.; D’Angelo, T.; Martin, S.S.; Lenga, L.; Leithner, D.; Vogl, T.J.; et al. Evaluation of bone mineral density of the lumbar spine using a novel phantomless dual-energy CT post-processing algorithm in comparison with dual-energy X-ray absorptiometry. Eur. Radiol. Exp. 2017, 1, 11. [Google Scholar] [CrossRef]
- Wichmann, J.L.; Booz, C.; Wesarg, S.; Kafchitsas, K.; Bauer, R.W.; Kerl, J.M.; Lehnert, T.; Vogl, T.J.; Khan, M.F. Dual-energy CT-based phantomless in vivo three-dimensional bone mineral density assessment of the lumbar spine. Radiology 2014, 271, 778–784. [Google Scholar] [CrossRef] [PubMed]
- Choi, K.Y.; Lee, S.-W.; In, Y.; Kim, M.S.; Kim, Y.D.; Lee, S.-Y.; Lee, J.-W.; Koh, I.J. Dual-Energy CT-Based Bone Mineral Density Has Practical Value for Osteoporosis Screening around the Knee. Medicina 2022, 58, 1085. [Google Scholar] [CrossRef]
- Gruenewald, L.D.; Booz, C.; Gotta, J.; Reschke, P.; Martin, S.S.; Mahmoudi, S.; Bernatz, S.; Eichler, K.; D’Angelo, T.; Chernyak, V.; et al. Incident fractures of the distal radius: Dual-energy CT-derived metrics for opportunistic risk stratification. Eur. J. Radiol. 2024, 171, 111283. [Google Scholar] [CrossRef]
- Guo, D.M.; Weng, Y.Z.; Yu, Z.H.; Li, S.H.; Qu, W.R.; Liu, X.N.; Qi, H.; Ma, C.; Tang, X.F.; Li, R.Y.; et al. Semi-automatic proximal humeral trabecular bone density assessment tool: Technique application and clinical validation. Osteoporos. Int. 2024, 35, 1049–1059. [Google Scholar] [CrossRef]
- Tong, X.; Fang, X.; Wang, S.; Fan, Y.; Wei, W.; Xiao, Q.; Chen, A.; Liu, Y.; Liu, L. Opportunistic screening for osteoporosis using enhanced images based on dual-energy computed tomography material decomposition: A comparison with quantitative computed tomography. Quant. Imaging Med. Surg. 2024, 14, 352–364. [Google Scholar] [CrossRef]
- Gruenewald, L.D.; Koch, V.; Yel, I.; Eichler, K.; Gruber-Rouh, T.; Alizadeh, L.S.; Mahmoudi, S.; D’Angelo, T.; Wichmann, J.L.; Wesarg, S.; et al. Association of Phantomless Dual-Energy CT-based Volumetric Bone Mineral Density with the Prevalence of Acute Insufficiency Fractures of the Spine. Acad. Radiol. 2023, 30, 2110–2117. [Google Scholar] [CrossRef] [PubMed]
- Waqar, A.; Bazzocchi, A.; Aparisi Gómez, M.P. Phantomless estimation of bone mineral density on computed tomography: A scoping review. Rofo 2025. [Google Scholar] [CrossRef]
- Kang, Y.; Hwang, S.H.; Han, K.; Shin, H.J. Comparison of image quality, contrast administration, and radiation doses in pediatric abdominal dual-layer detector dual-energy CT using propensity score matching analysis. Eur. J. Radiol. 2023, 169, 111177. [Google Scholar] [CrossRef] [PubMed]
- Ghasemi Shayan, R.; Oladghaffari, M.; Sajjadian, F.; Fazel Ghaziyani, M. Image Quality and Dose Comparison of Single-Energy CT (SECT) and Dual-Energy CT (DECT). Radiol. Res. Pract. 2020, 2020, 1403957. [Google Scholar] [CrossRef]
- Booz, C.; Noeske, J.; Albrecht, M.H.; Lenga, L.; Martin, S.S.; Yel, I.; Huizinga, N.A.; Vogl, T.J.; Wichmann, J.L. Diagnostic accuracy of quantitative dual-energy CT-based bone mineral density assessment in comparison to Hounsfield unit measurements using dual X-ray absorptiometry as standard of reference. Eur. J. Radiol. 2020, 132, 109321. [Google Scholar] [CrossRef]
- Li, X.; Li, X.; Li, J.; Jiao, X.; Jia, X.; Zhang, X.; Fan, G.; Yang, J.; Guo, J. The accuracy of bone mineral density measurement using dual-energy spectral CT and quantitative CT: A comparative phantom study. Clin. Radiol. 2020, 75, 320.e9–320.e15. [Google Scholar] [CrossRef]
- Yue, D.; Fei, S.L.; Jing, C.; Xin, W.R.; Tong, D.R.; Lian, L.A.; Luo, Y.H. The relationship between calcium (water) density and age distribution in adult women with spectral CT: Initial result compared to bone mineral density by dual-energy X-ray absorptiometry. Acta Radiol. 2019, 60, 762–768. [Google Scholar] [CrossRef]
- Warriner, A.H.; Patkar, N.M.; Curtis, J.R.; Delzell, E.; Gary, L.; Kilgore, M.; Saag, K. Which fractures are most attributable to osteoporosis? J. Clin. Epidemiol. 2011, 64, 46–53. [Google Scholar] [CrossRef] [PubMed]
- Khan, A.A.; Slart, R.H.J.A.; Ali, D.S.; Bock, O.; Carey, J.J.; Camacho, P.; Engelke, K.; Erba, P.A.; Harvey, N.C.; Lems, W.F.; et al. Osteoporotic Fractures: Diagnosis, Evaluation, and Significance From the International Working Group on DXA Best Practices. Mayo Clin. Proc. 2024, 99, 1127–1141. [Google Scholar] [CrossRef]
- Stoppino, L.P.; Piscone, S.; Saccone, S.; Ciccarelli, S.A.; Marinelli, L.; Milillo, P.; Gallo, C.; Macarini, L.; Vinci, R. Vertebral and Femoral Bone Mineral Density (BMD) Assessment with Dual-Energy CT versus DXA Scan in Postmenopausal Females. J. Imaging 2024, 10, 104. [Google Scholar] [CrossRef]
- Haworth, C.S.; Selby, P.L.; Webb, A.K.; Dodd, M.E.; Musson, H.; McL Niven, R.; Economou, G.; Horrocks, A.W.; Freemont, A.J.; Mawer, E.B.; et al. Low bone mineral density in adults with cystic fibrosis. Thorax 1999, 54, 961–967. [Google Scholar] [CrossRef] [PubMed]
- Grotz, W.H.; Mundinger, F.A.; Rasenack, J.; Speidel, L.; Olschewski, M.; Exner, V.M.; Schollmeyer, P.J. Bone loss after kidney transplantation: A longitudinal study in 115 graft recipients. Nephrol. Dial. Transplant. 1995, 10, 2096–2100. [Google Scholar] [PubMed]
- Deng, L.; Yao, Y.; Shang, A.L.; Du, T.; Zhang, J.; Yang, Q.; Li, J.; Wang, Q.; Li, X. Opportunistic screening for osteoporosis using hydroxyapatite measurements of the vertebral by thorax dual-energy spectral CT in postmenopausal females. Sci. Rep. 2022, 12, 21642. [Google Scholar] [CrossRef]
- Borggrefe, J.; Neuhaus, V.F.; Le Blanc, M.; Grosse Hokamp, N.; Maus, V.; Mpotsaris, A.; Lennartz, S.; Pinto Dos Santos, D.; Maintz, D.; Abdullayev, N. Accuracy of iodine density thresholds for the separation of vertebral bone metastases from healthy-appearing trabecular bone in spectral detector computed tomography. Eur. Radiol. 2019, 29, 3253–3261. [Google Scholar] [CrossRef]
- Fervers, P.; Fervers, F.; Rinneburger, M.; Weisthoff, M.; Kottlors, J.; Reimer, R.; Zopfs, D.; Celik, E.; Maintz, D.; Große-Hokamp, N.; et al. Physiological iodine uptake of the spine’s bone marrow in dual-energy computed tomography-using artificial intelligence to define reference values based on 678 CT examinations of 189 individuals. Front. Endocrinol. 2023, 14, 1098898. [Google Scholar] [CrossRef]


| Inclusion Criteria | Exclusion Criteria |
|---|---|
| Postmenopausal females | Previous fractures or bone lesions |
| Patients in oncological follow-up | Presence of metal prosthesis |
| Patients with maximum gap of 6 months between DXA and DECT | Post-surgical patients |
| Characteristics | Osteoporosis | Osteopenia | Normal |
|---|---|---|---|
| Mean age (range) | 66.5 ± 11.5 (58–78) | 59 ± 15 (44–74) | 60 ± 16 (44–76) |
| Patients | 10 | 15 | 16 |
| T-score | −3.1 ± 0.6 | −1.65 ± 0.75 | 0.15 ± 0.85 |
| BMD (g/cm2) | 0.586 ± 0.065 | 0.698 ± 0.08 | 0.833 ± 0.07 |
| CaOxMono–water (g/cm3) | 50.93 ± 22.8 | 83.92 ± 47.5 | 167.07 ± 32.2 |
| Calcium–Fat (g/cm3) | 34.68 ± 6.6 | 43.84 ± 12.1 | 65.1 ± 9.2 |
| Calcium–water (g/cm3) | 17.12 ± 9.2 | 26.13 ± 15.0 | 46.7 ± 7.4 |
| HAP–Fat (g/cm3) | 131.4 ± 21.2 | 105.19 ± 32.6 | 82.06 ± 21.3 |
| HAP–water (g/cm3) | 30.58 ± 12.7 | 49.81 ± 28.7 | 94.1 ± 19.7 |
| CaOxMono–Water | Calcium–Fat | Calcium–Water | HAP–Fat | HAP–Water | |
|---|---|---|---|---|---|
| ICC | 0.984 | 0.983 | 0.975 | 0.997 | 0.983 |
| CaOxMono–Water | Calcium–Fat | Calcium–Water | HAP–Fat | HAP–Water | ||
|---|---|---|---|---|---|---|
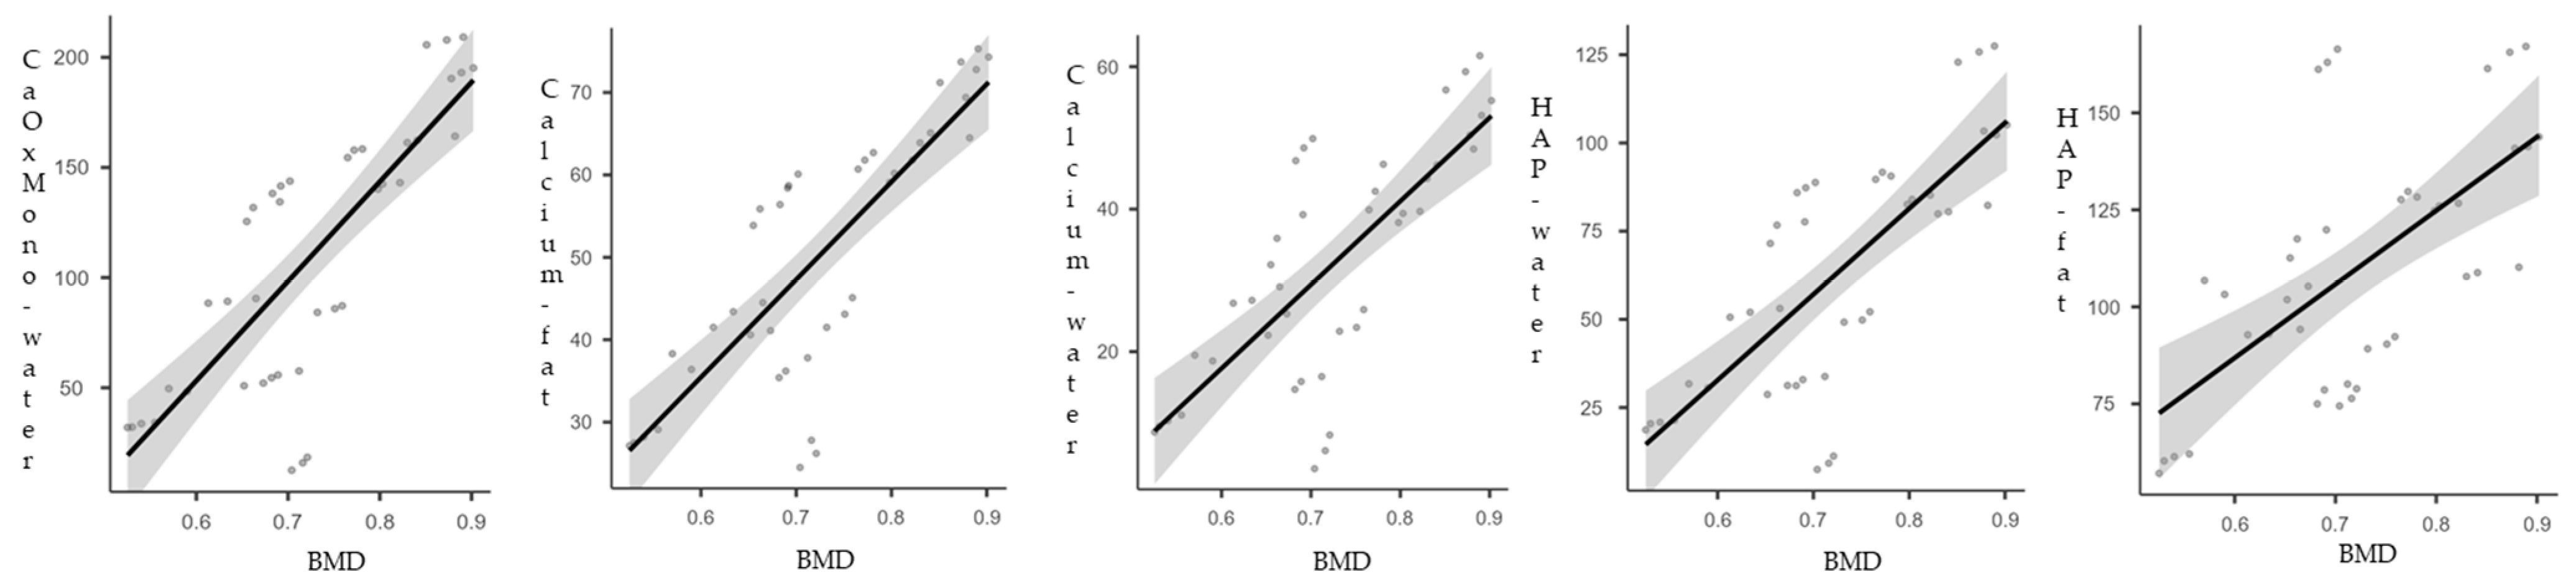
| BMD | Spearman’s rho | 0.783 | 0.797 | 0.702 | 0.616 | 0.725 |
| p-value | <0.001 | <0.001 | <0.001 | <0.001 | <0.001 |
Disclaimer/Publisher’s Note: The statements, opinions and data contained in all publications are solely those of the individual author(s) and contributor(s) and not of MDPI and/or the editor(s). MDPI and/or the editor(s) disclaim responsibility for any injury to people or property resulting from any ideas, methods, instructions or products referred to in the content. |
© 2025 by the authors. Licensee MDPI, Basel, Switzerland. This article is an open access article distributed under the terms and conditions of the Creative Commons Attribution (CC BY) license (https://creativecommons.org/licenses/by/4.0/).
Share and Cite
Piscone, S.; Saccone, S.; Milillo, P.; Schiraldi, G.; Vinci, R.; Macarini, L.; Stoppino, L.P. Bone Mineral Density (BMD) Assessment Using Dual-Energy CT with Different Base Material Pairs (BMPs). J. Imaging 2025, 11, 236. https://doi.org/10.3390/jimaging11070236
Piscone S, Saccone S, Milillo P, Schiraldi G, Vinci R, Macarini L, Stoppino LP. Bone Mineral Density (BMD) Assessment Using Dual-Energy CT with Different Base Material Pairs (BMPs). Journal of Imaging. 2025; 11(7):236. https://doi.org/10.3390/jimaging11070236
Chicago/Turabian StylePiscone, Stefano, Sara Saccone, Paola Milillo, Giorgia Schiraldi, Roberta Vinci, Luca Macarini, and Luca Pio Stoppino. 2025. "Bone Mineral Density (BMD) Assessment Using Dual-Energy CT with Different Base Material Pairs (BMPs)" Journal of Imaging 11, no. 7: 236. https://doi.org/10.3390/jimaging11070236
APA StylePiscone, S., Saccone, S., Milillo, P., Schiraldi, G., Vinci, R., Macarini, L., & Stoppino, L. P. (2025). Bone Mineral Density (BMD) Assessment Using Dual-Energy CT with Different Base Material Pairs (BMPs). Journal of Imaging, 11(7), 236. https://doi.org/10.3390/jimaging11070236