

Dose Reduction in Scintigraphic Imaging Through Enhanced Convolutional Autoencoder-Based Denoising

 , , ,
, , ,  and
and
Abstract
1. Introduction
2. Materials and Methods
2.1. Ethics and Compliance
2.2. Dataset
2.3. Acquisition Protocol
Input–Output Pairing for Supervised Learning
2.4. Enhanced Convolutional Autoencoder Model
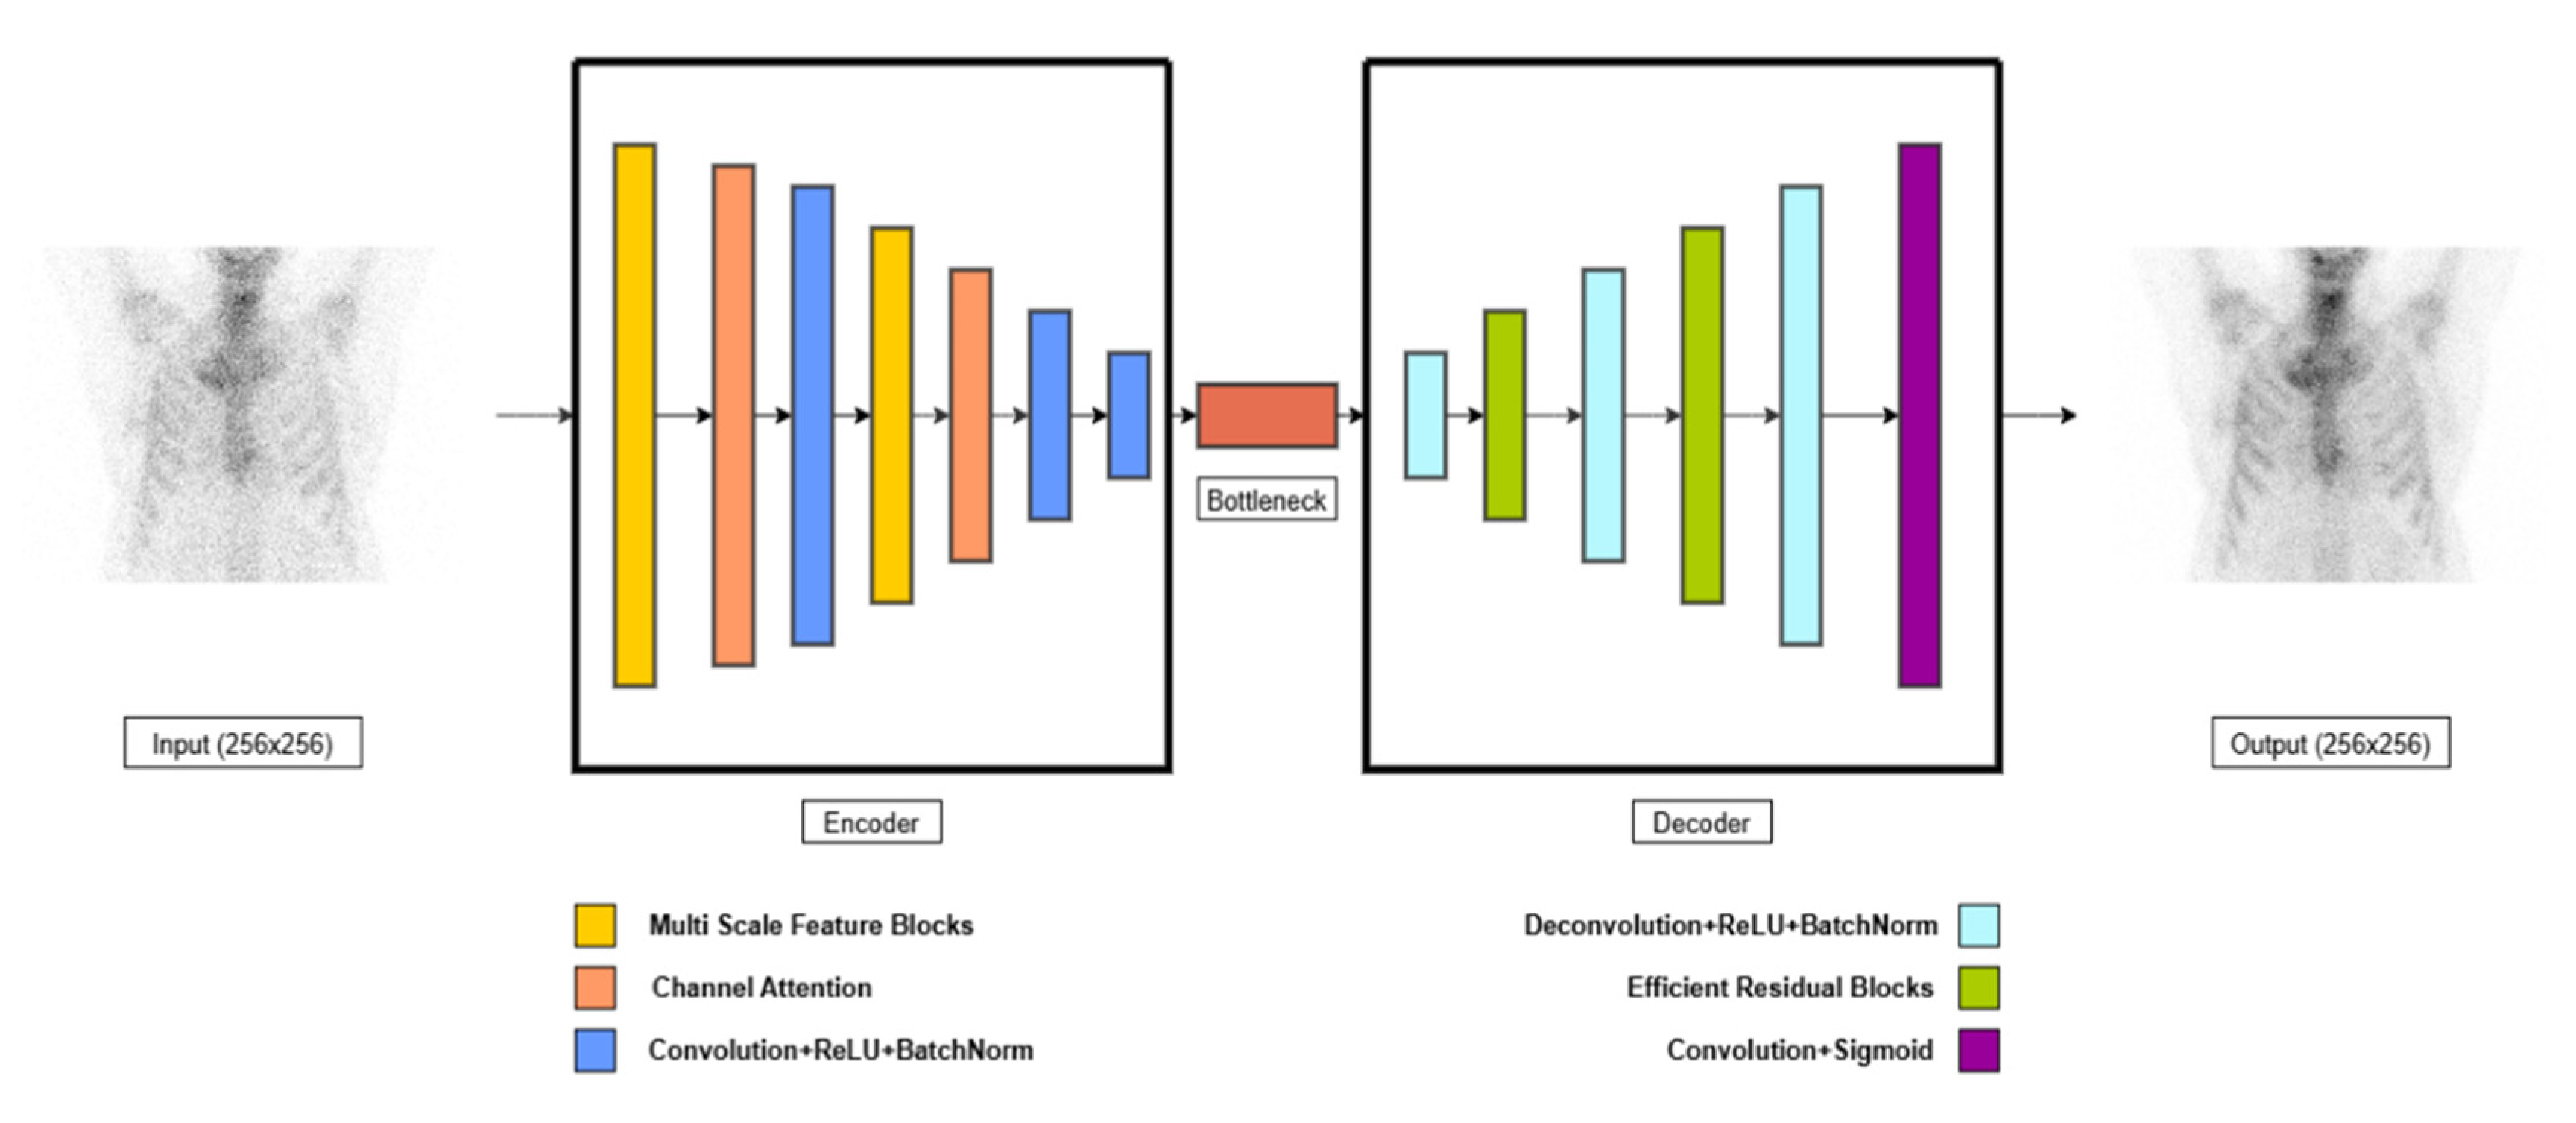
2.4.1. Model Architecture
2.4.2. Loss Function and Optimization
- LMSE is the Mean Squared Error between predicted and target images,
- SSIM (Xoutput, Xtarget) is the Structural Similarity Index between the reconstructed image and the ground truth,
- λ is the weighting factor (default: 0.7), controlling the trade-off between pixel-wise fidelity and perceptual similarity,
- Xoutput is the reconstructed (denoised) image,
- Xtarget is the full-dose reference image.
2.4.3. Training Setup
2.5. Performance Evaluation: Quantitative and Qualitative Metrics
- PSNR (Peak Signal-to-Noise Ratio): PSNR is a measure of the quality of reconstruction, specifically assessing the pixel-wise accuracy between the reconstructed and original images. Higher PSNR values indicate a closer match between the images. The PSNR is defined as
- Imax is the maximum pixel value in the image (255 for 8-bit grayscale images),
- MSE is the Mean Squared Error (MSE) between the reconstructed and reference images,
- N is the total number of pixels in the image,
- Xoutput is the reconstructed (denoised) image,
- Xtarget is the full-dose reference image.
- 2.
- SSIM (Structural Similarity Index): SSIM evaluates the perceived quality of the images by considering structural changes, luminance, and contrast. It is more perceptually meaningful than traditional metrics like MSE. SSIM ranges from −1 to 1, with a value closer to 1 indicating high structural similarity between the original and reconstructed images. The SSIM is defined as
- μΧ and μY are the mean intensities of Xoutput and Xtarget,
- are the variances of Xoutput and Xtarget,
- σXY is the covariance between the two images,
- C1 and C2 are small constants to avoid division by zero.
3. Results
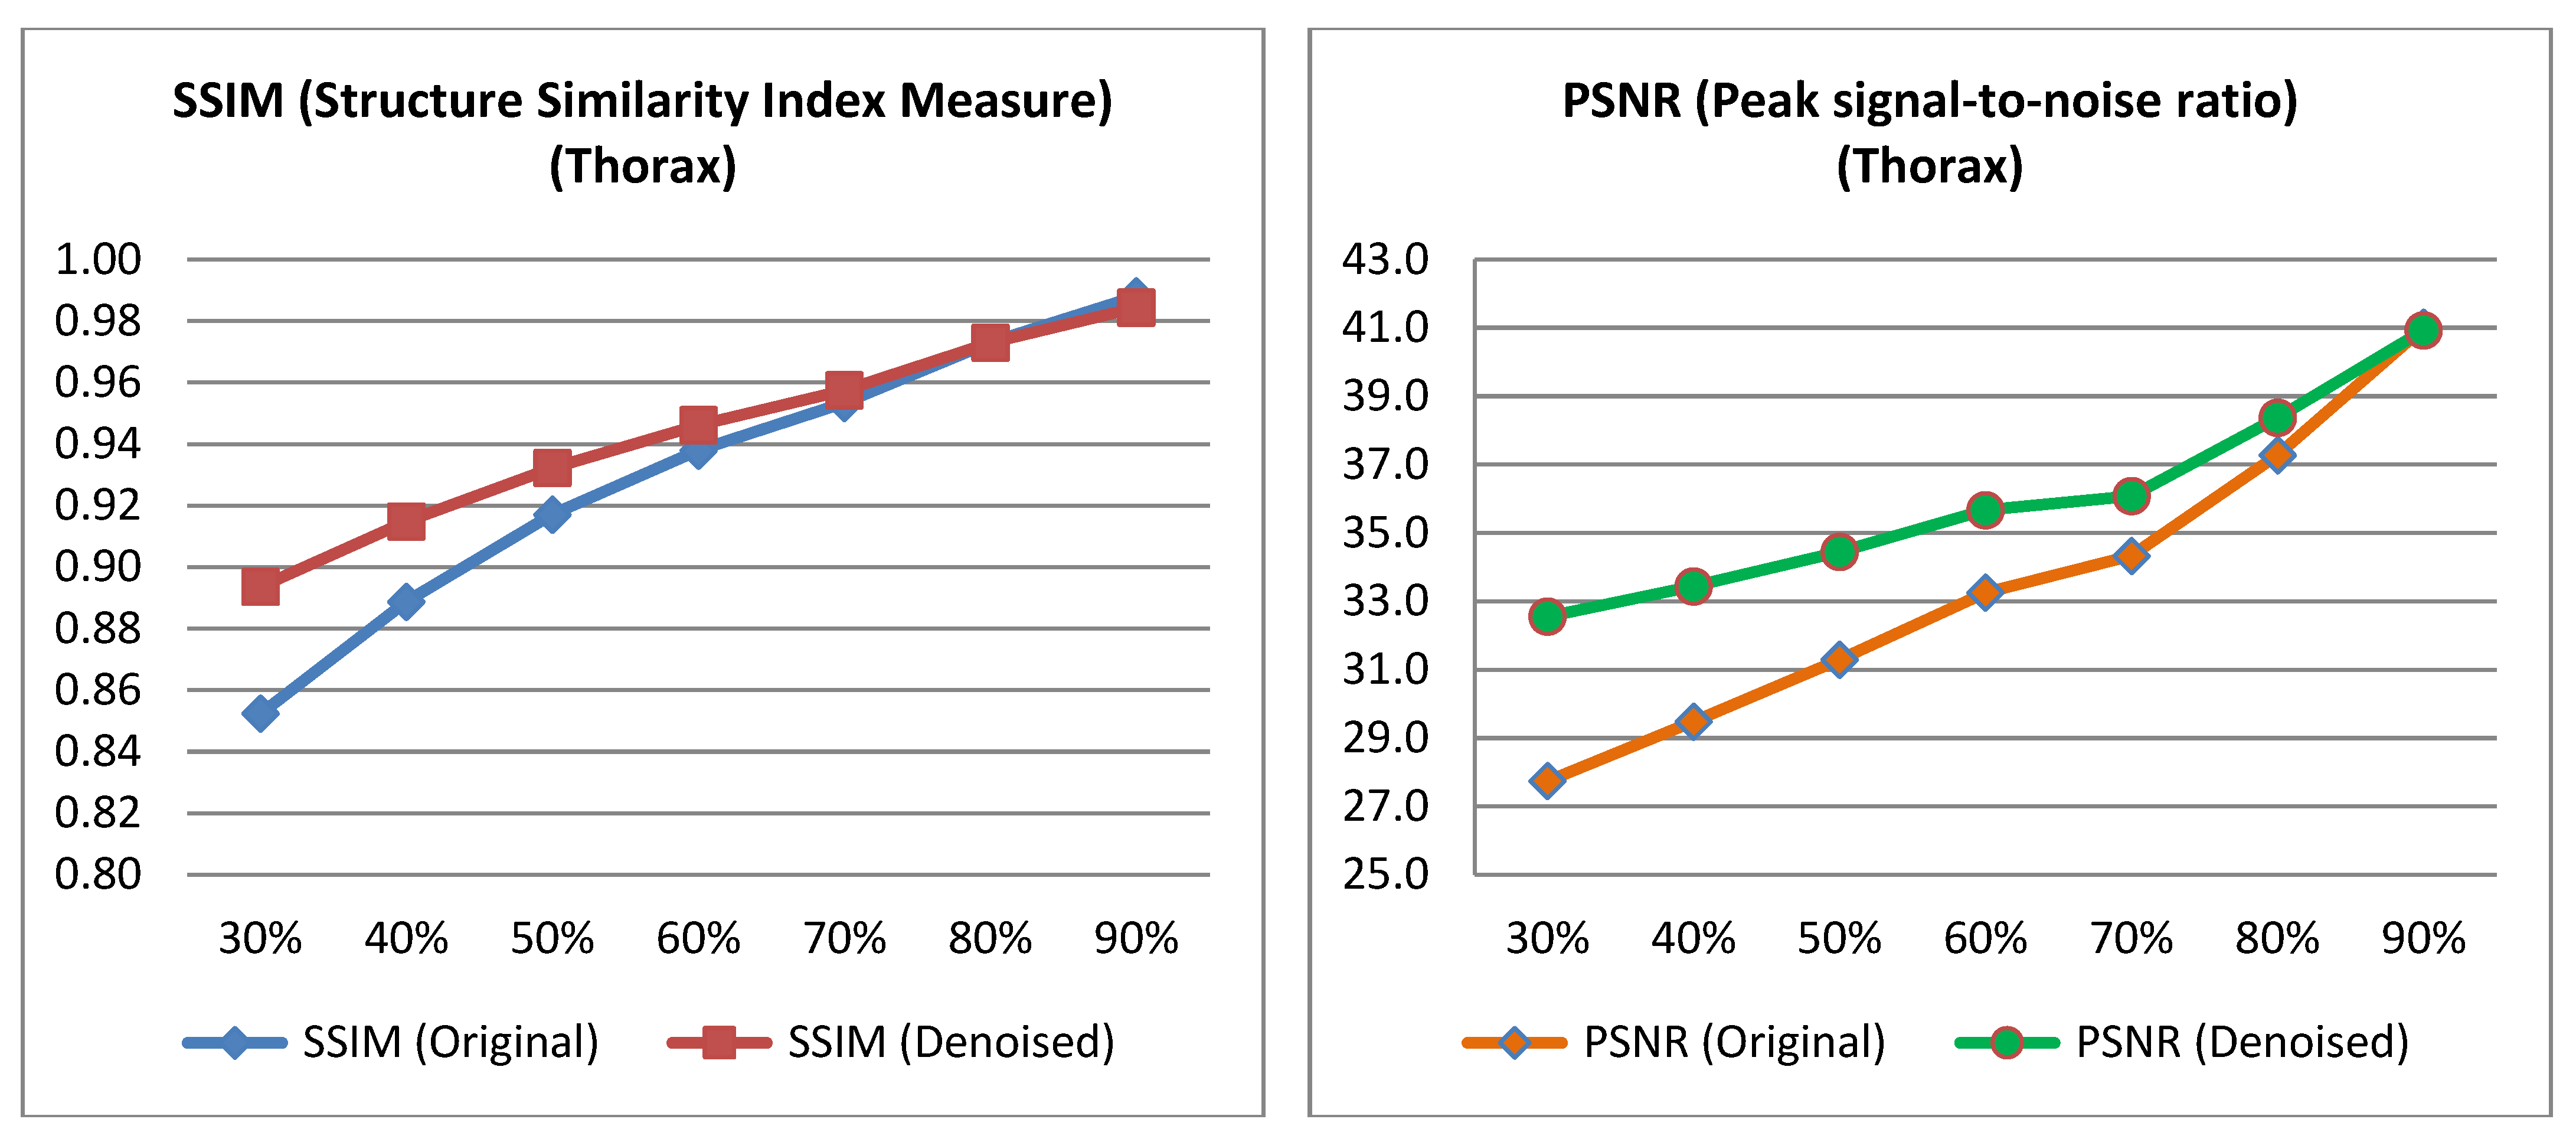
3.1. Quantitative Evaluation
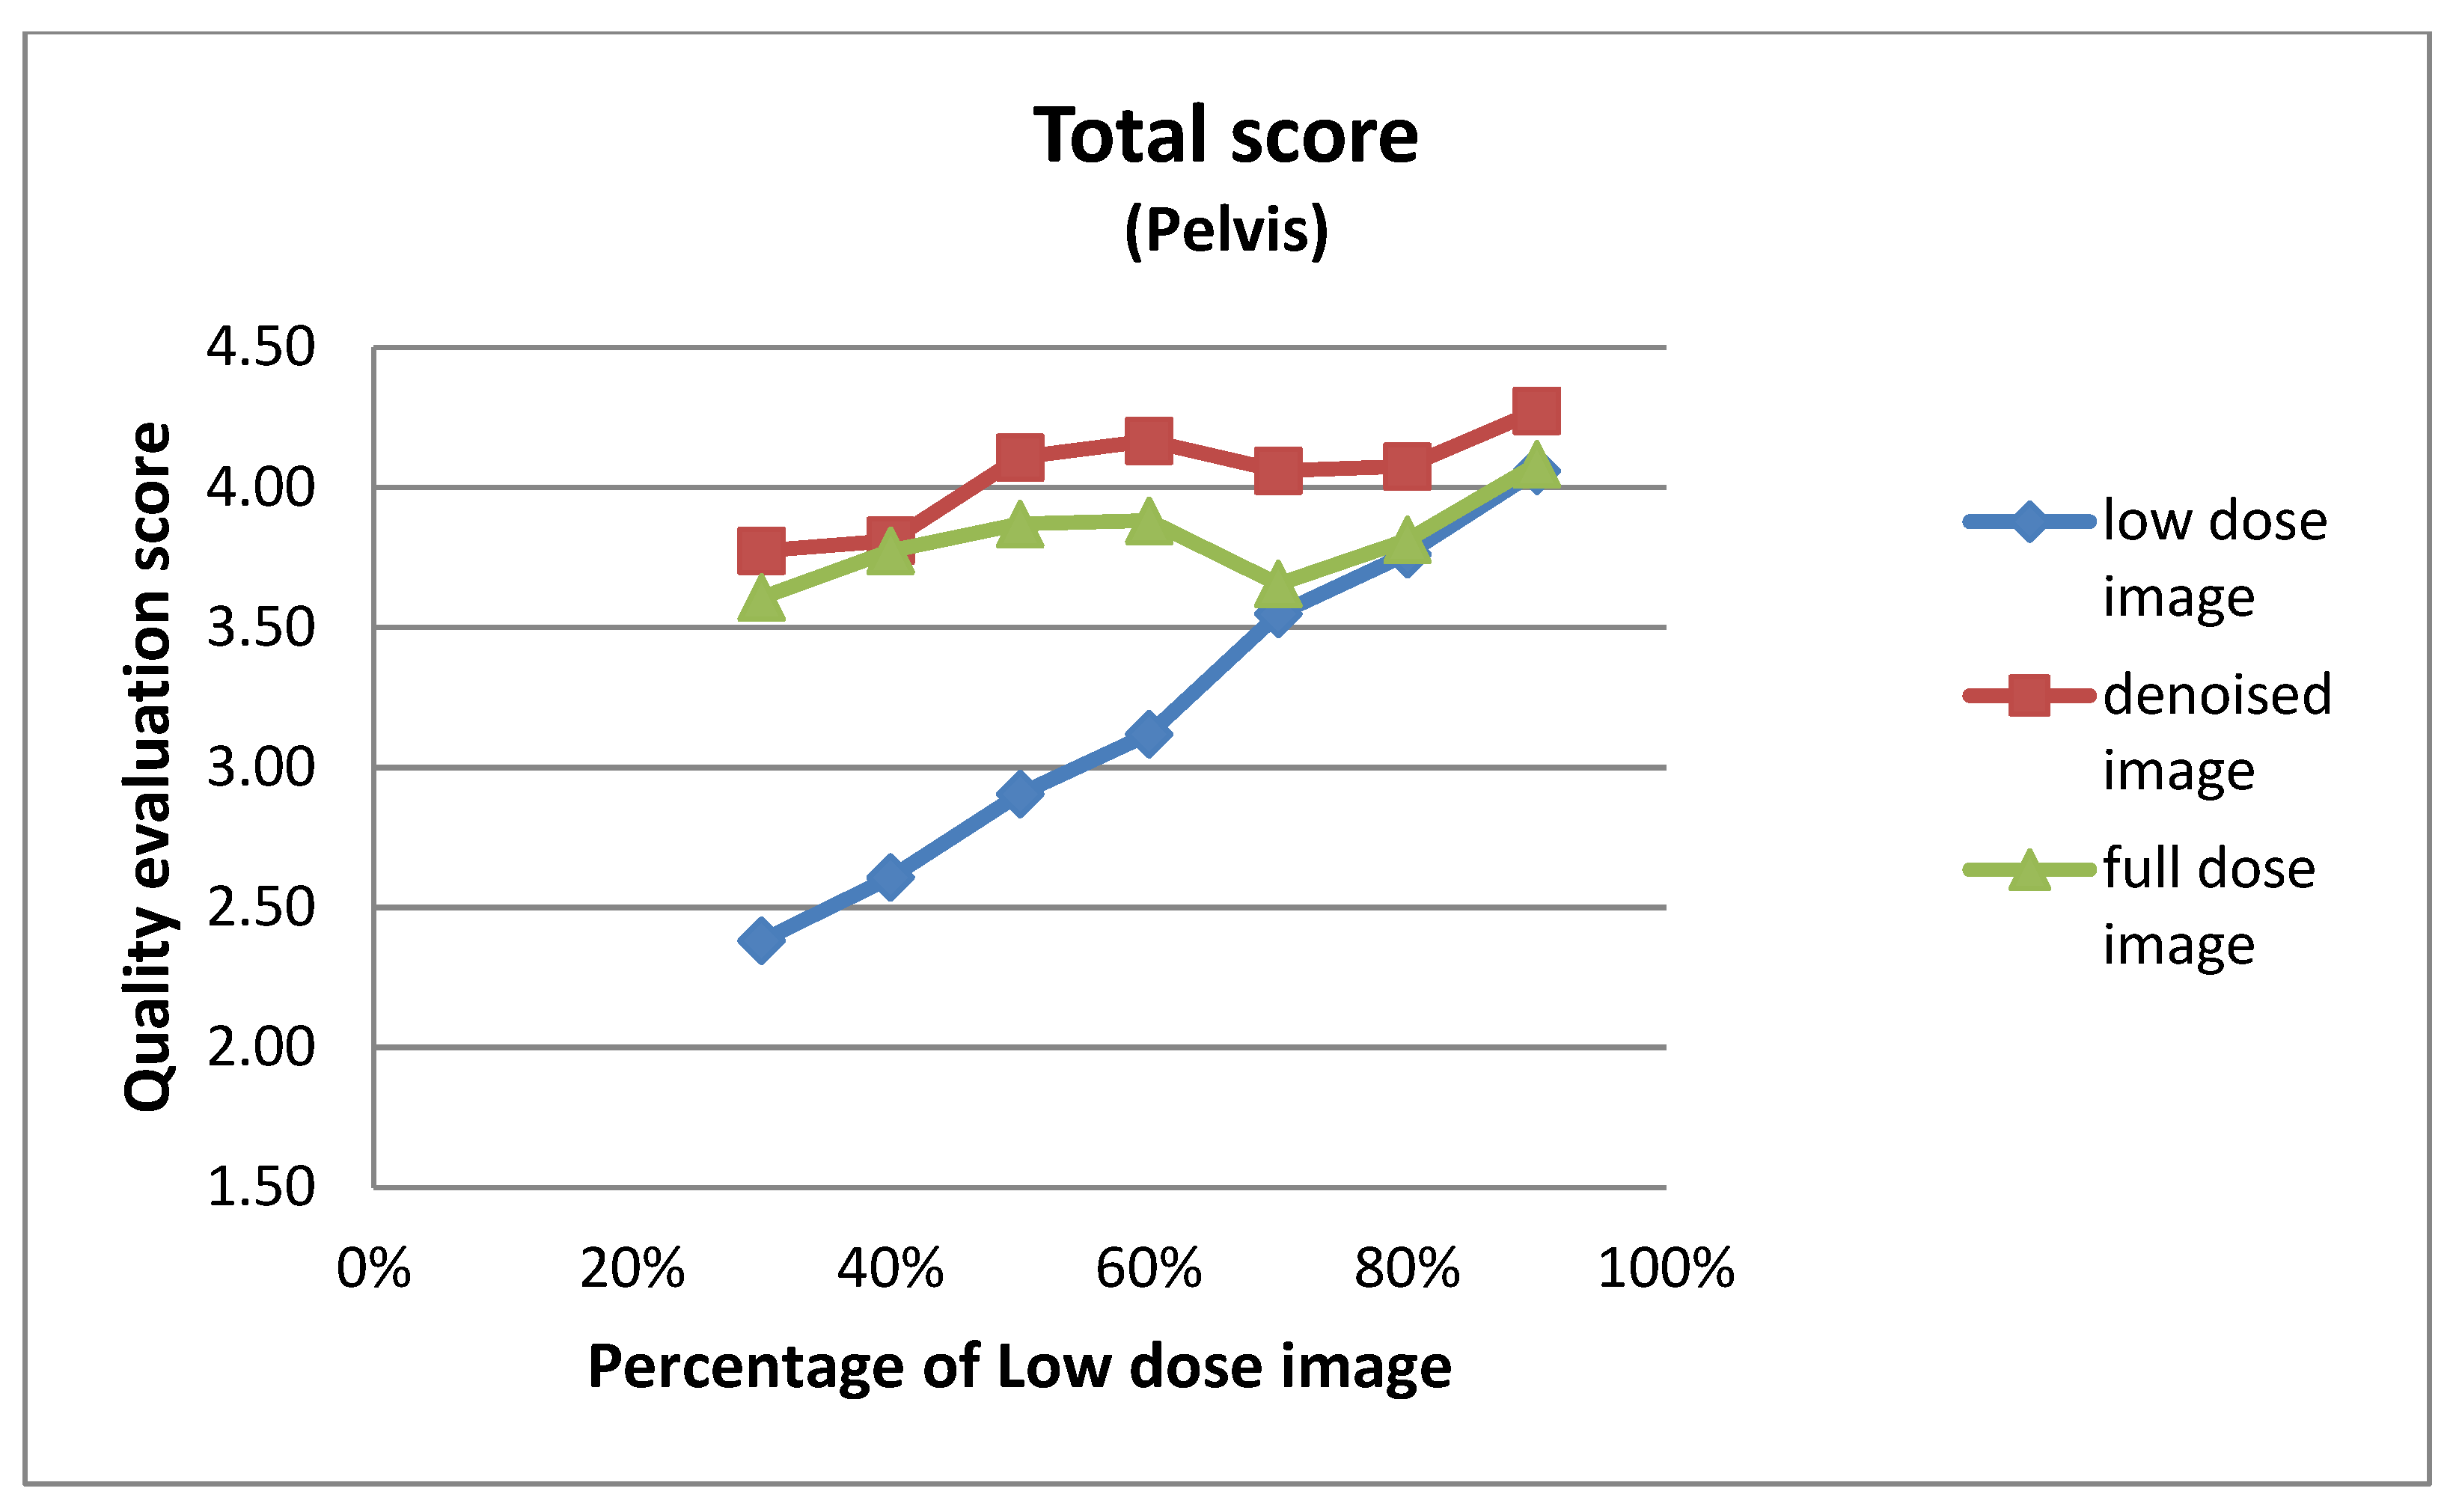
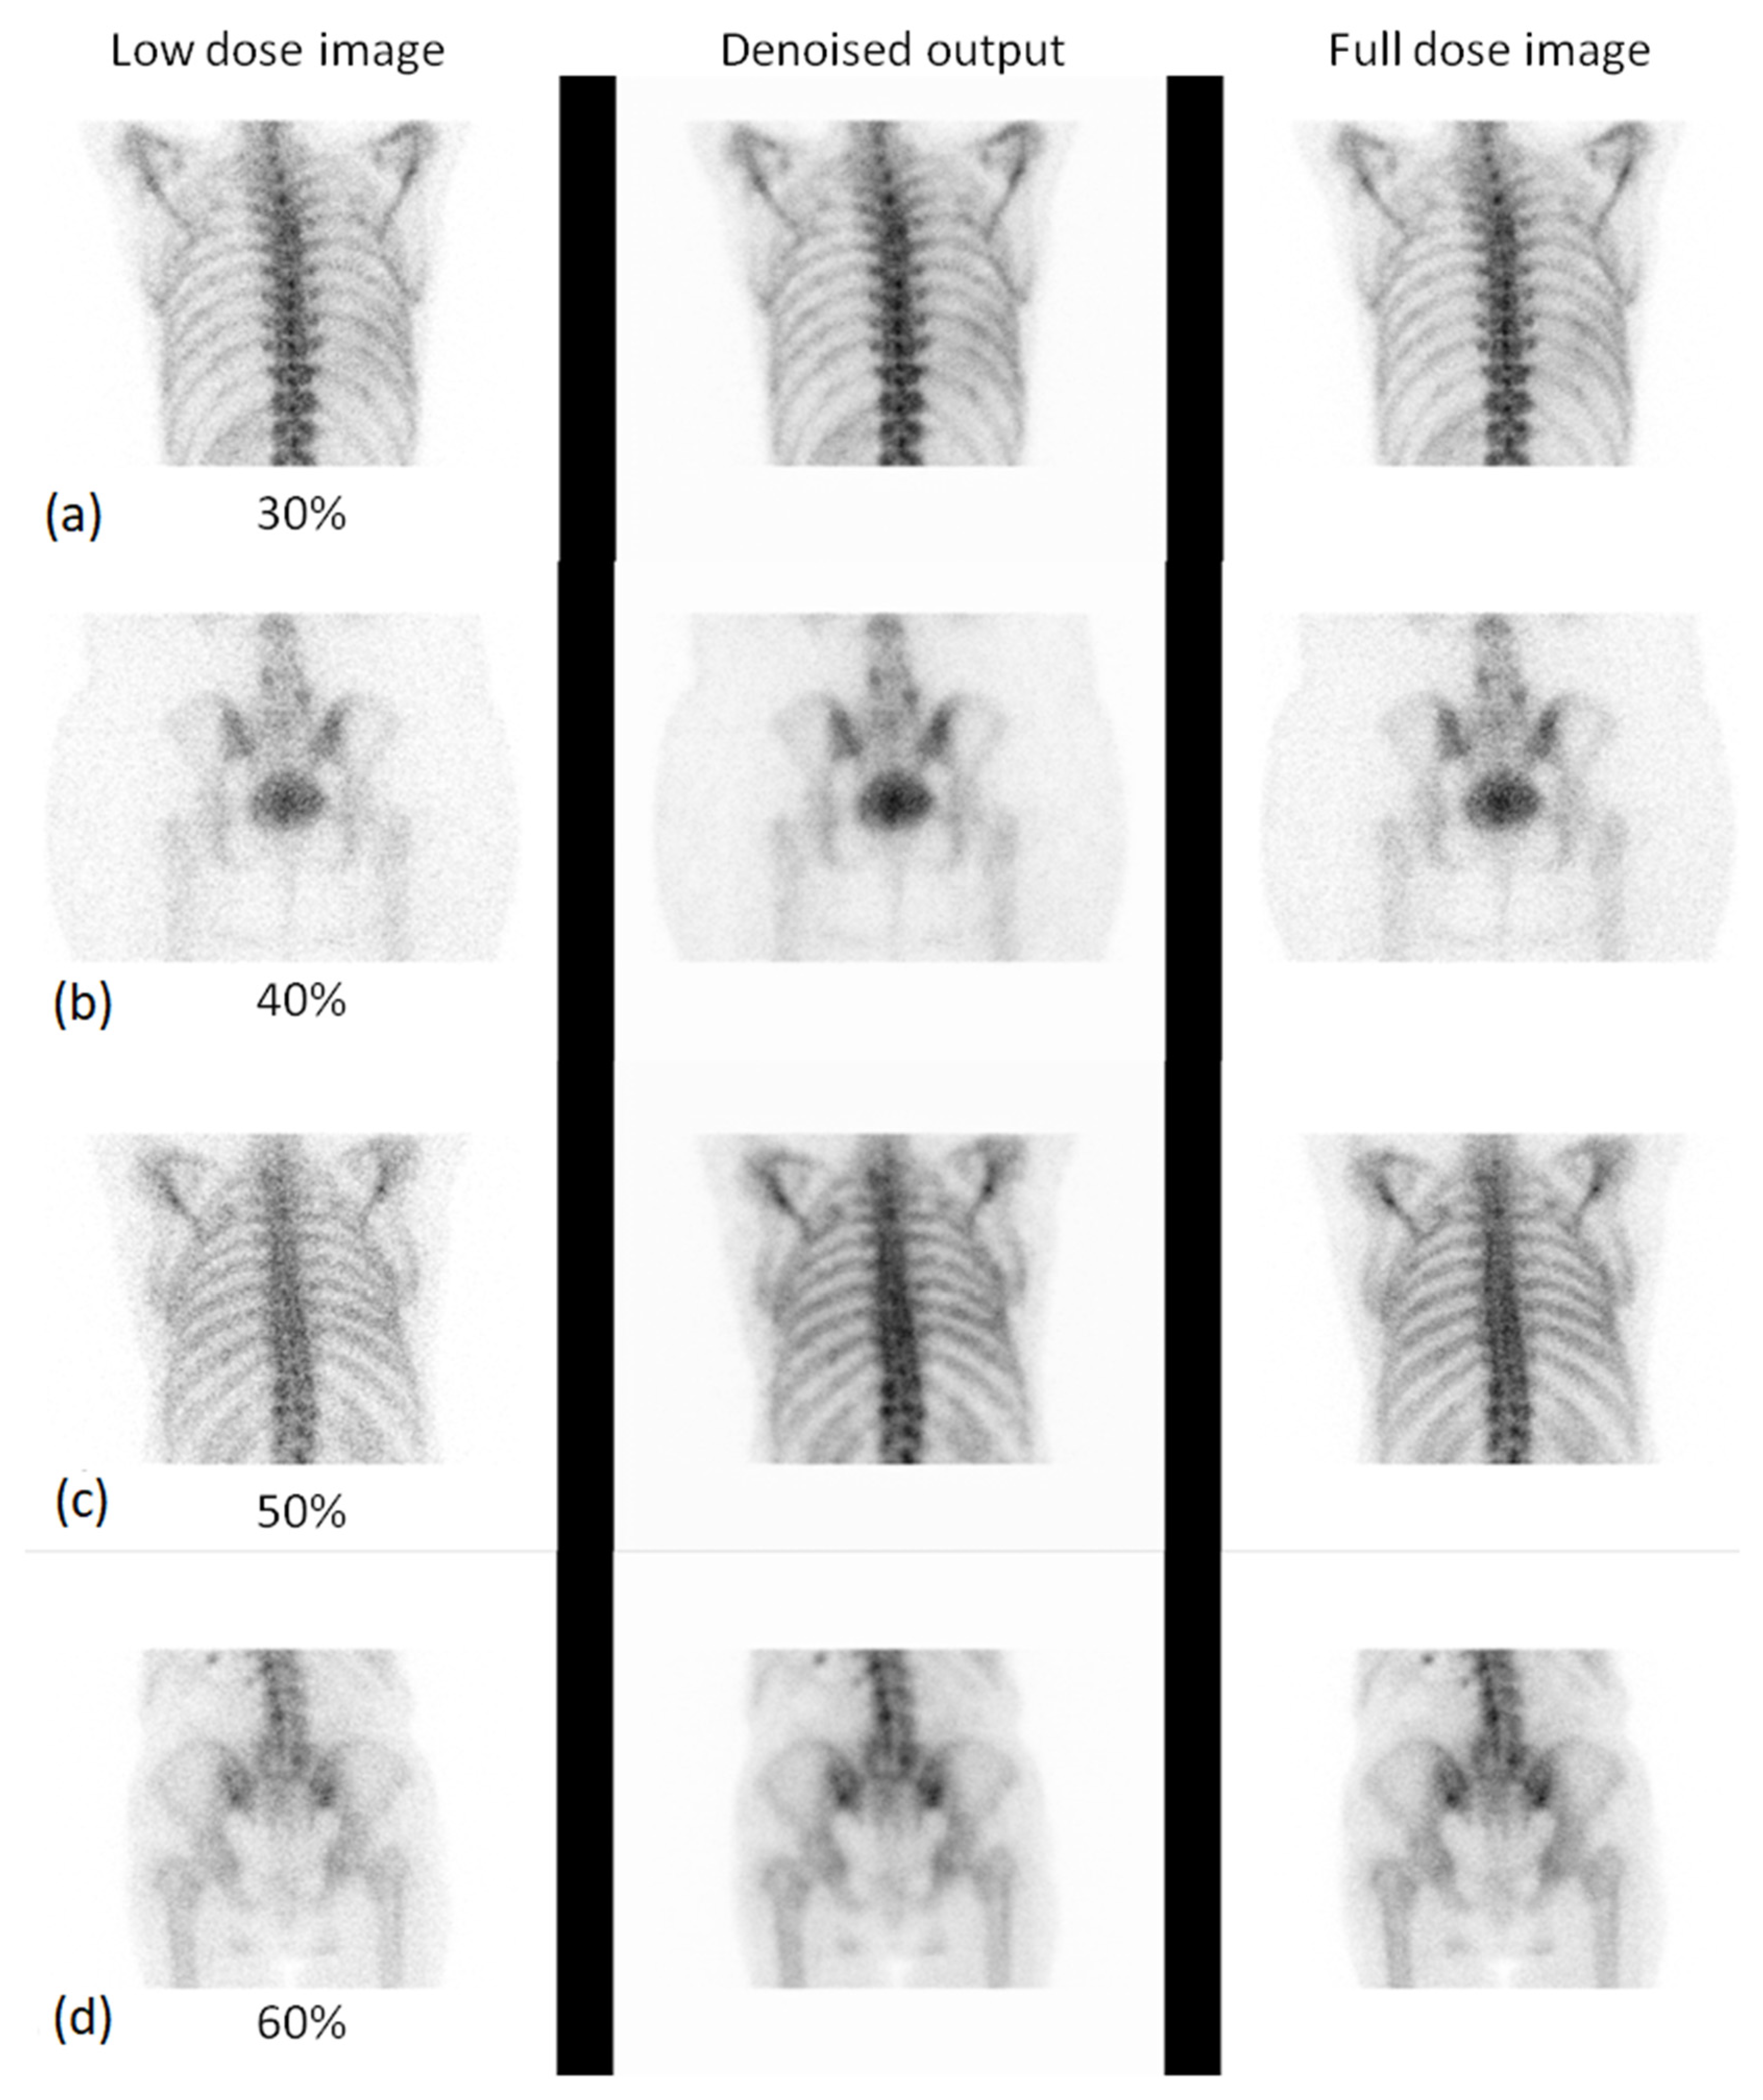
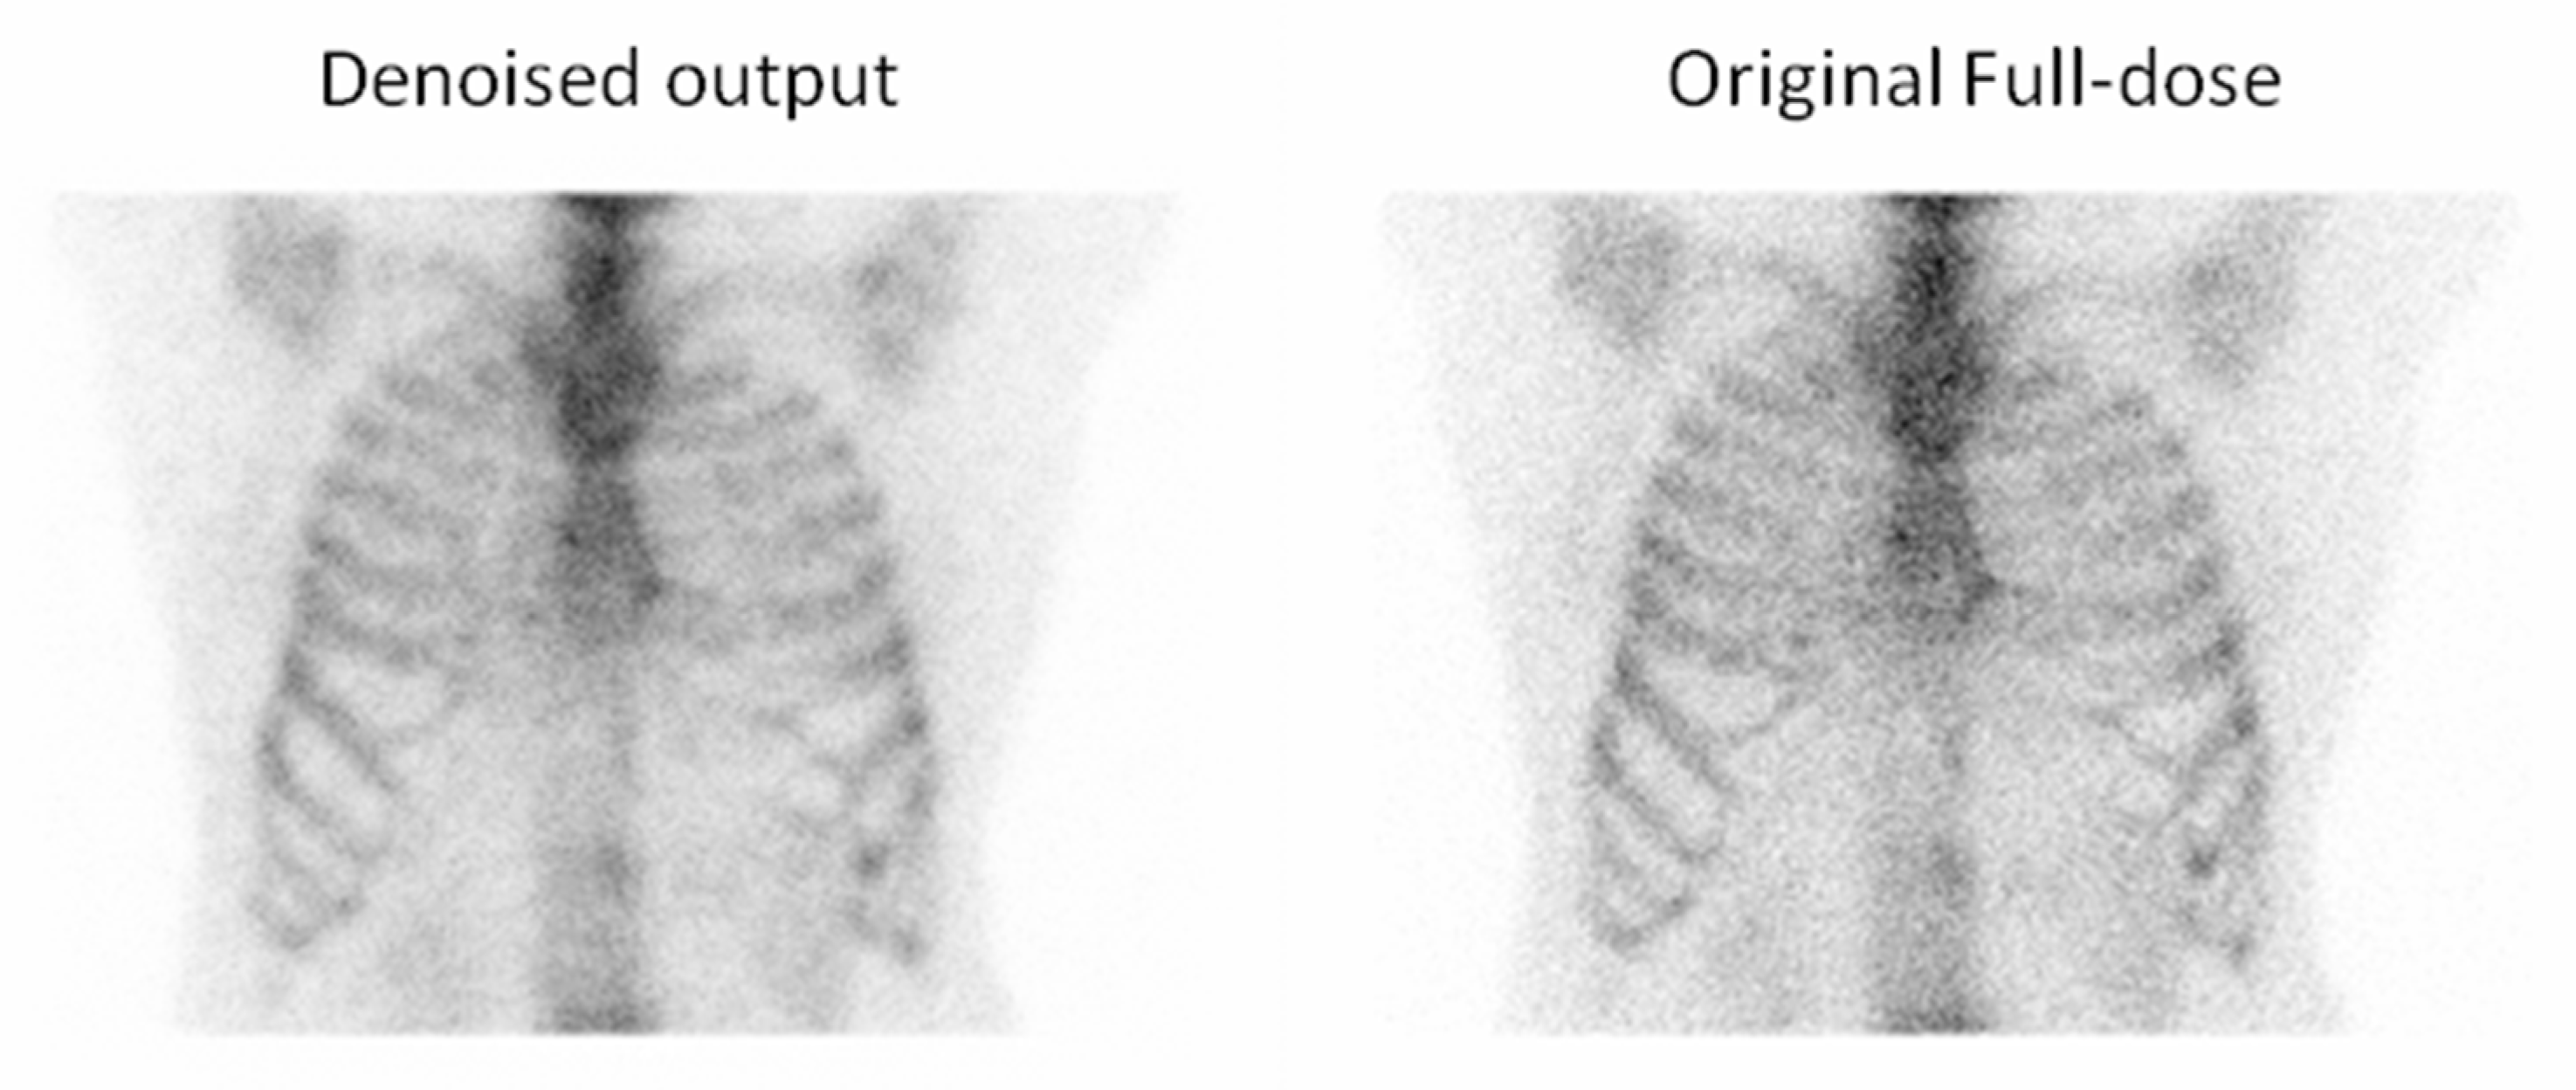
3.2. Qualitative Evaluation
3.2.1. Expert-Based Evaluation: Metrics for Image Quality Assessment
3.2.2. 2AFC Evaluation: Preference-Based Image Quality Assessment
4. Discussion
4.1. Summary of Main Findings
4.2. Comparison with Previous Studies
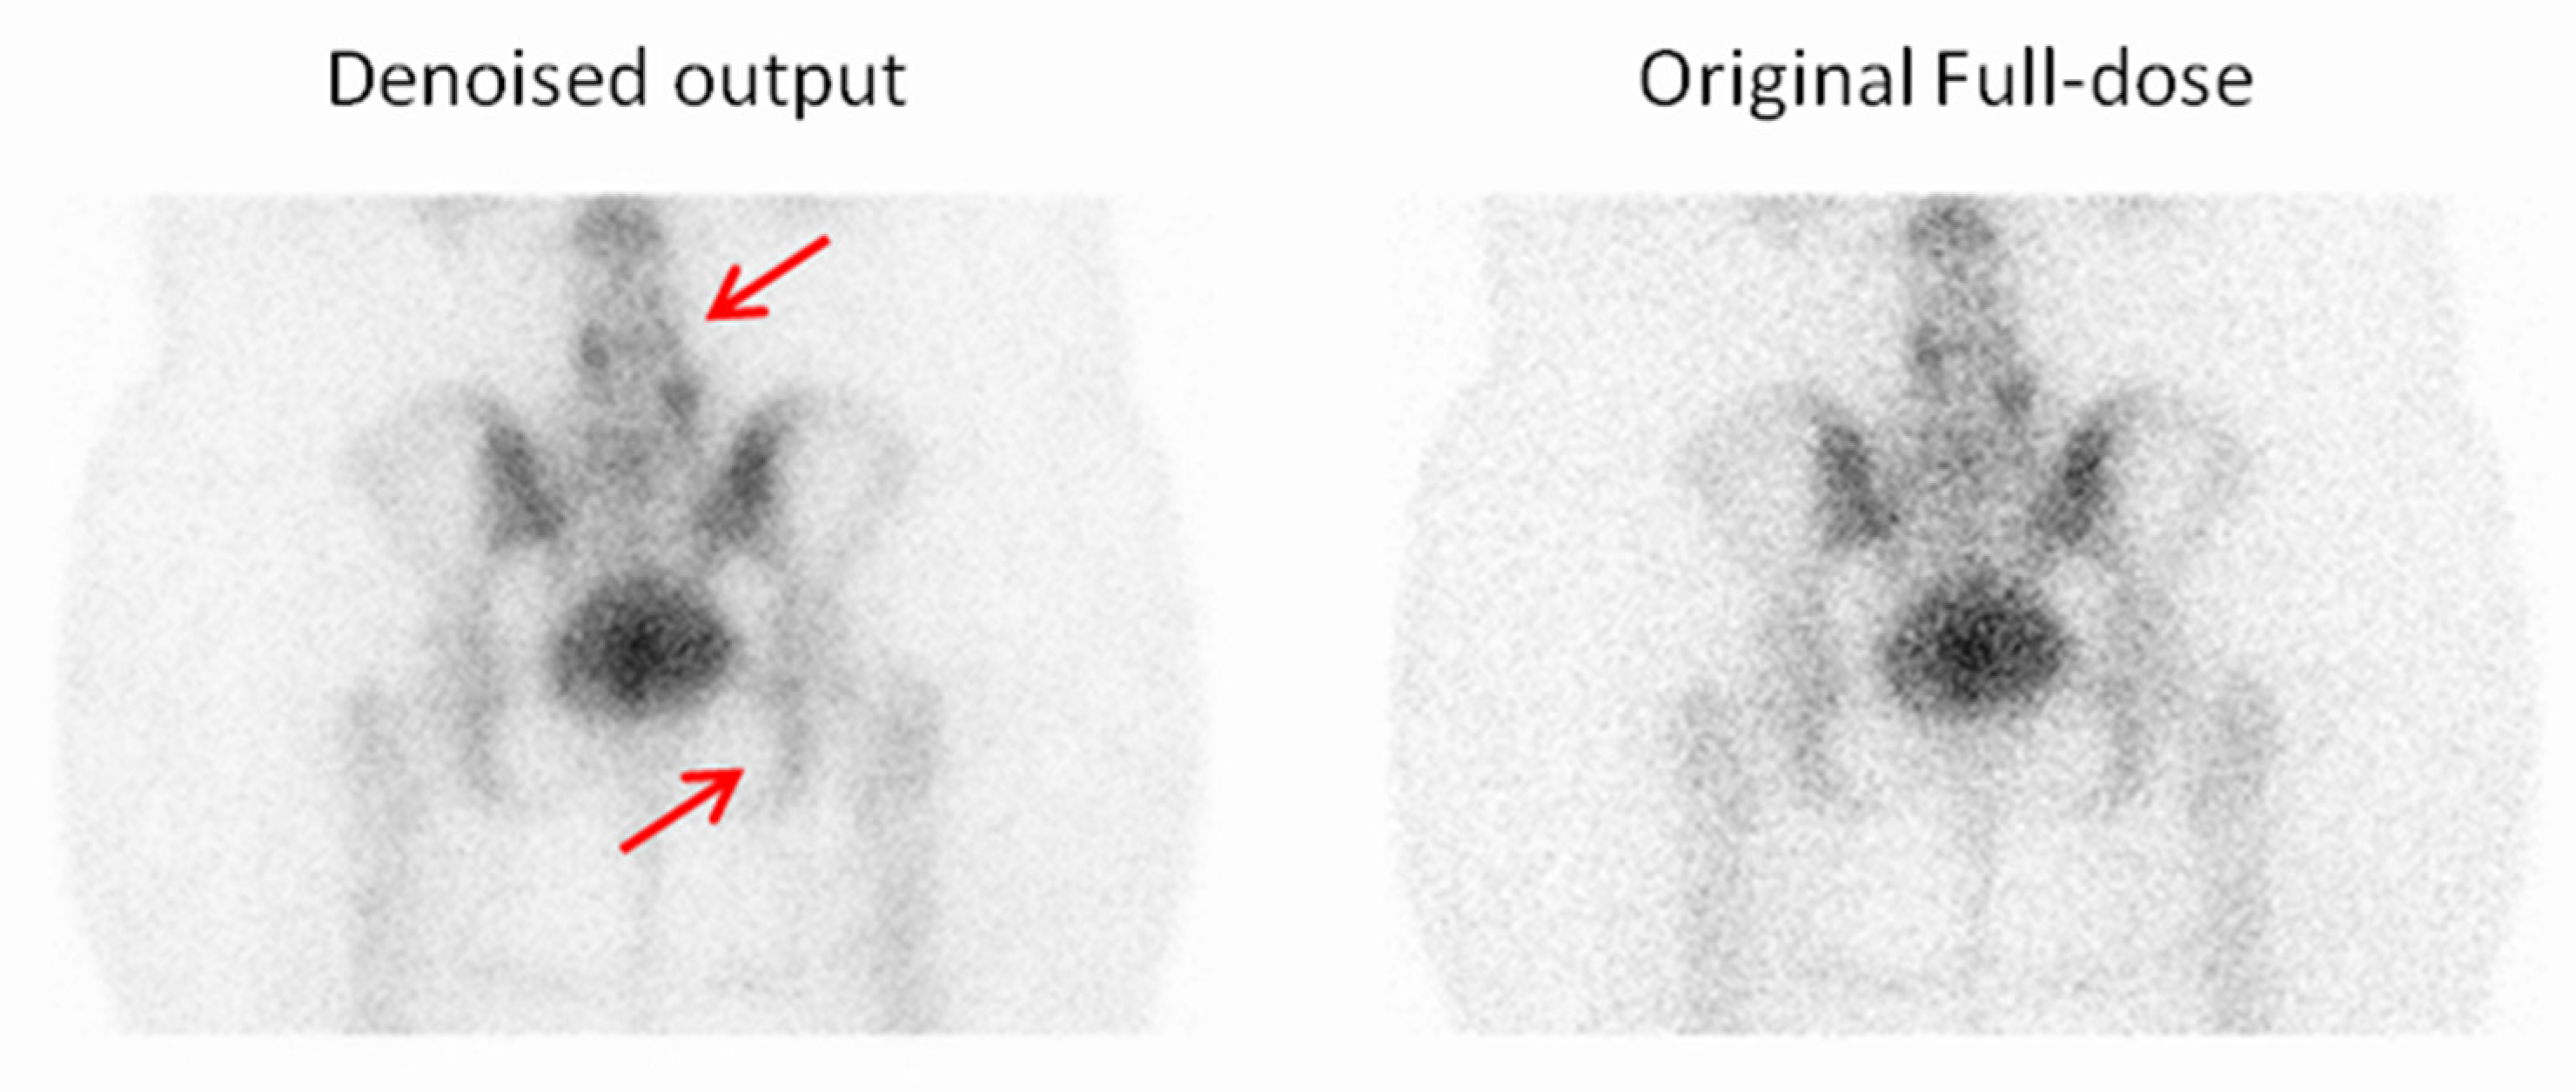
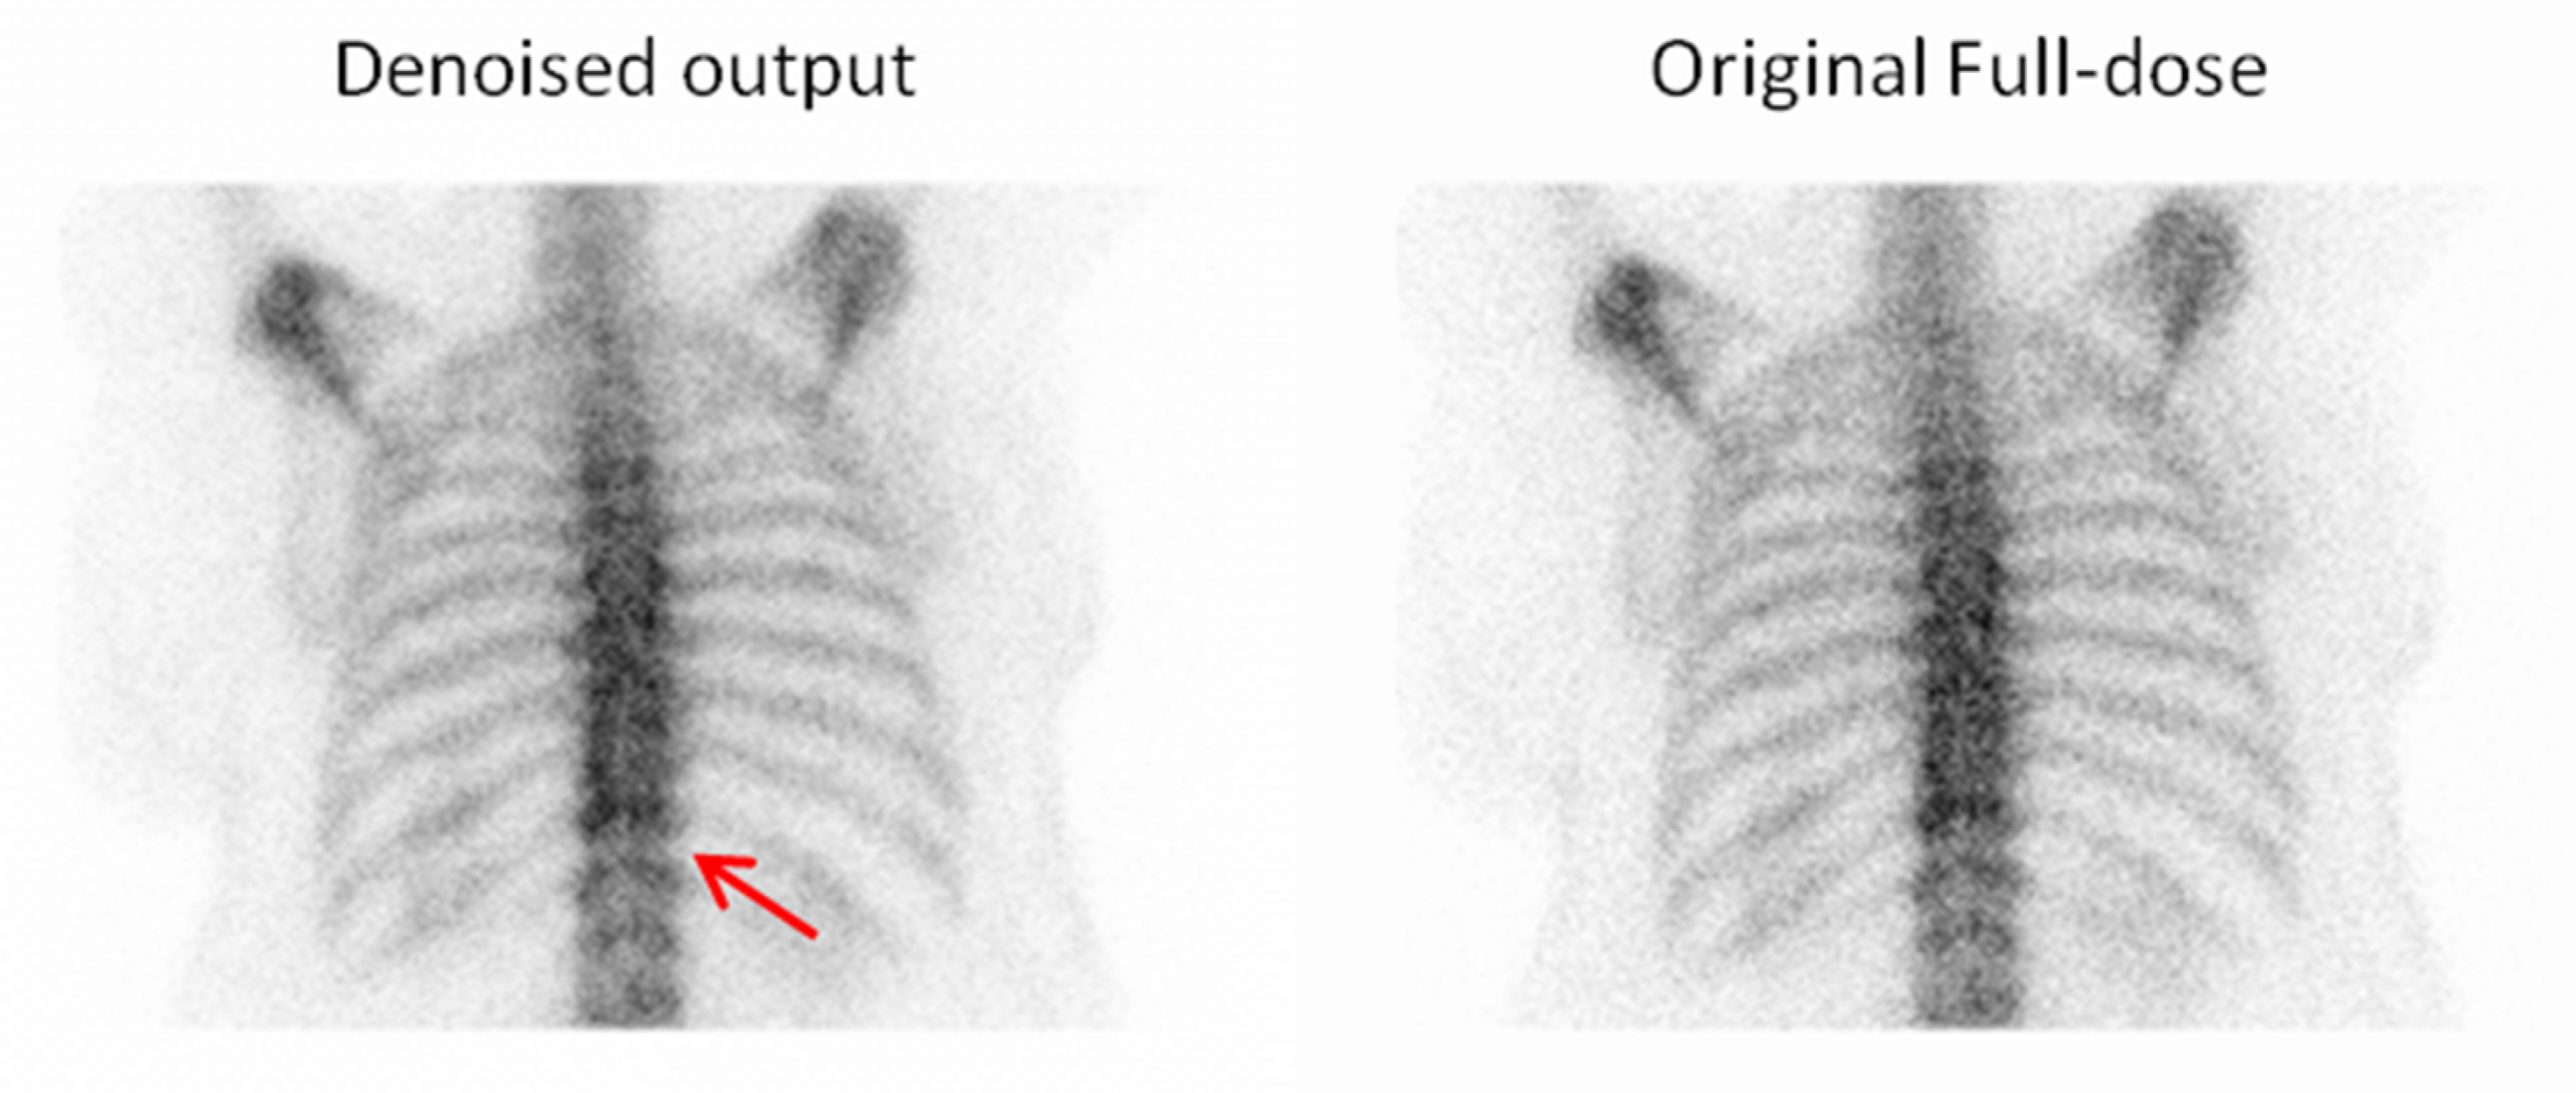
4.3. Clinical Interpretation and Reader Evaluation
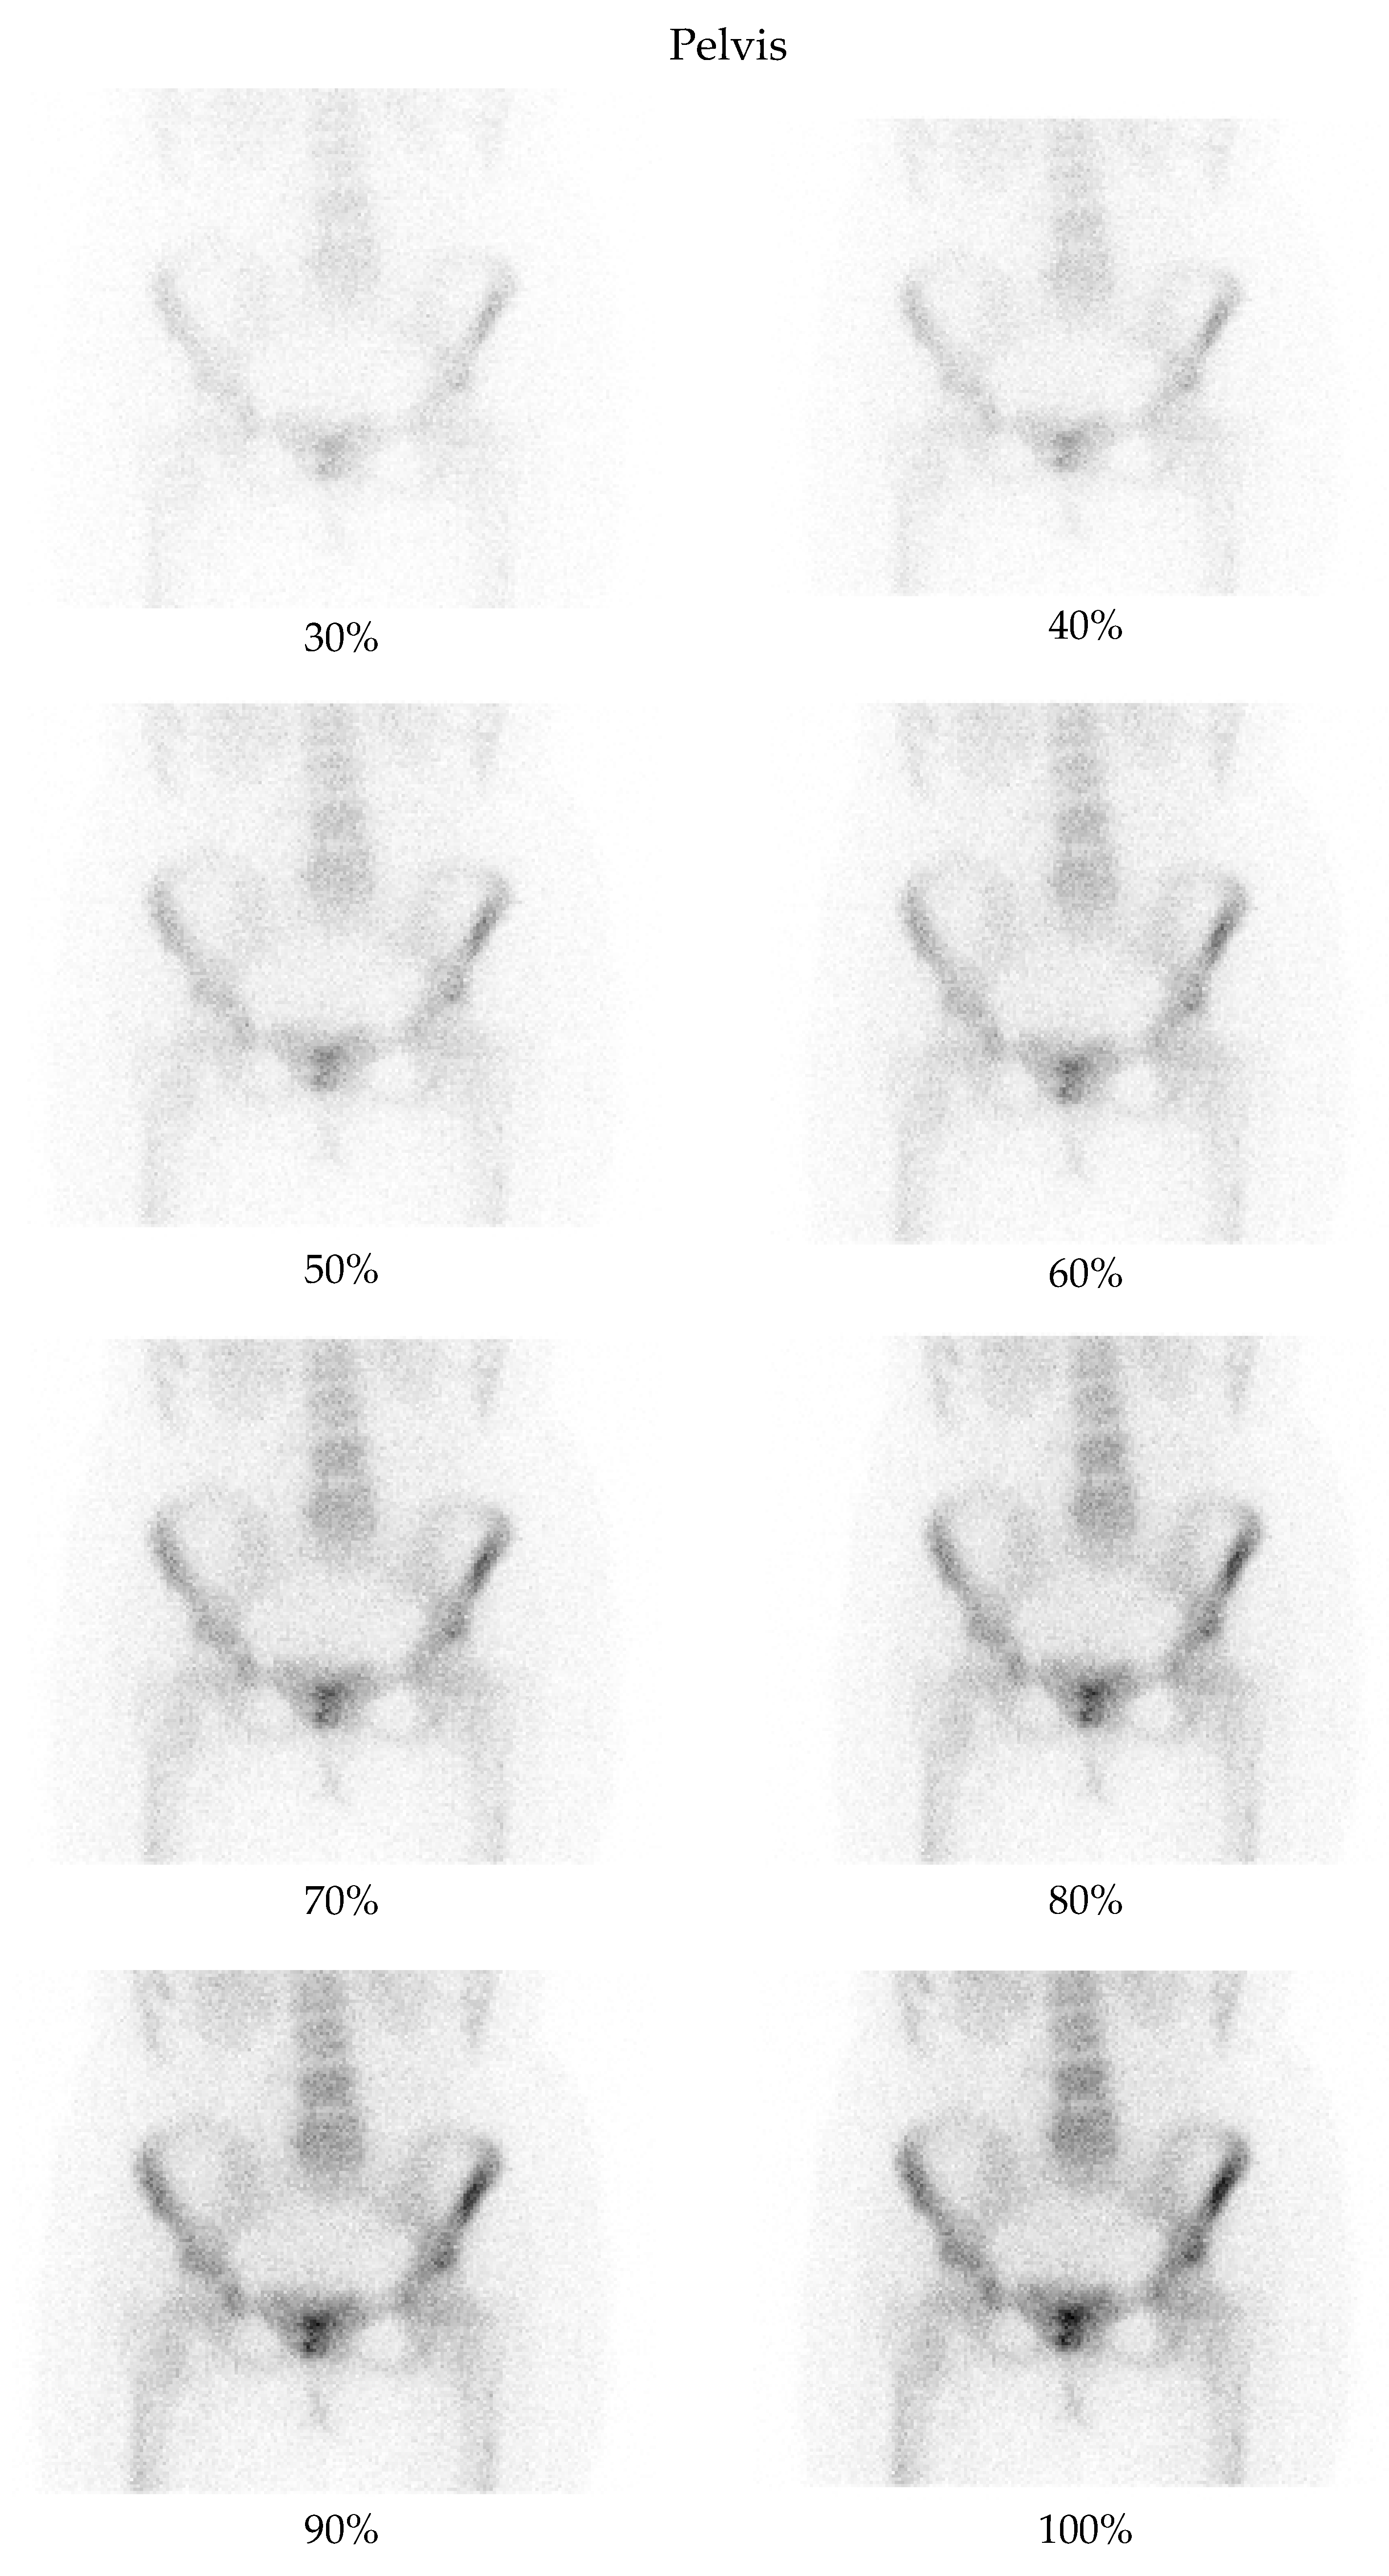
- Pelvis at a 50% dose: 90.48% of comparisons favored the denoised image.
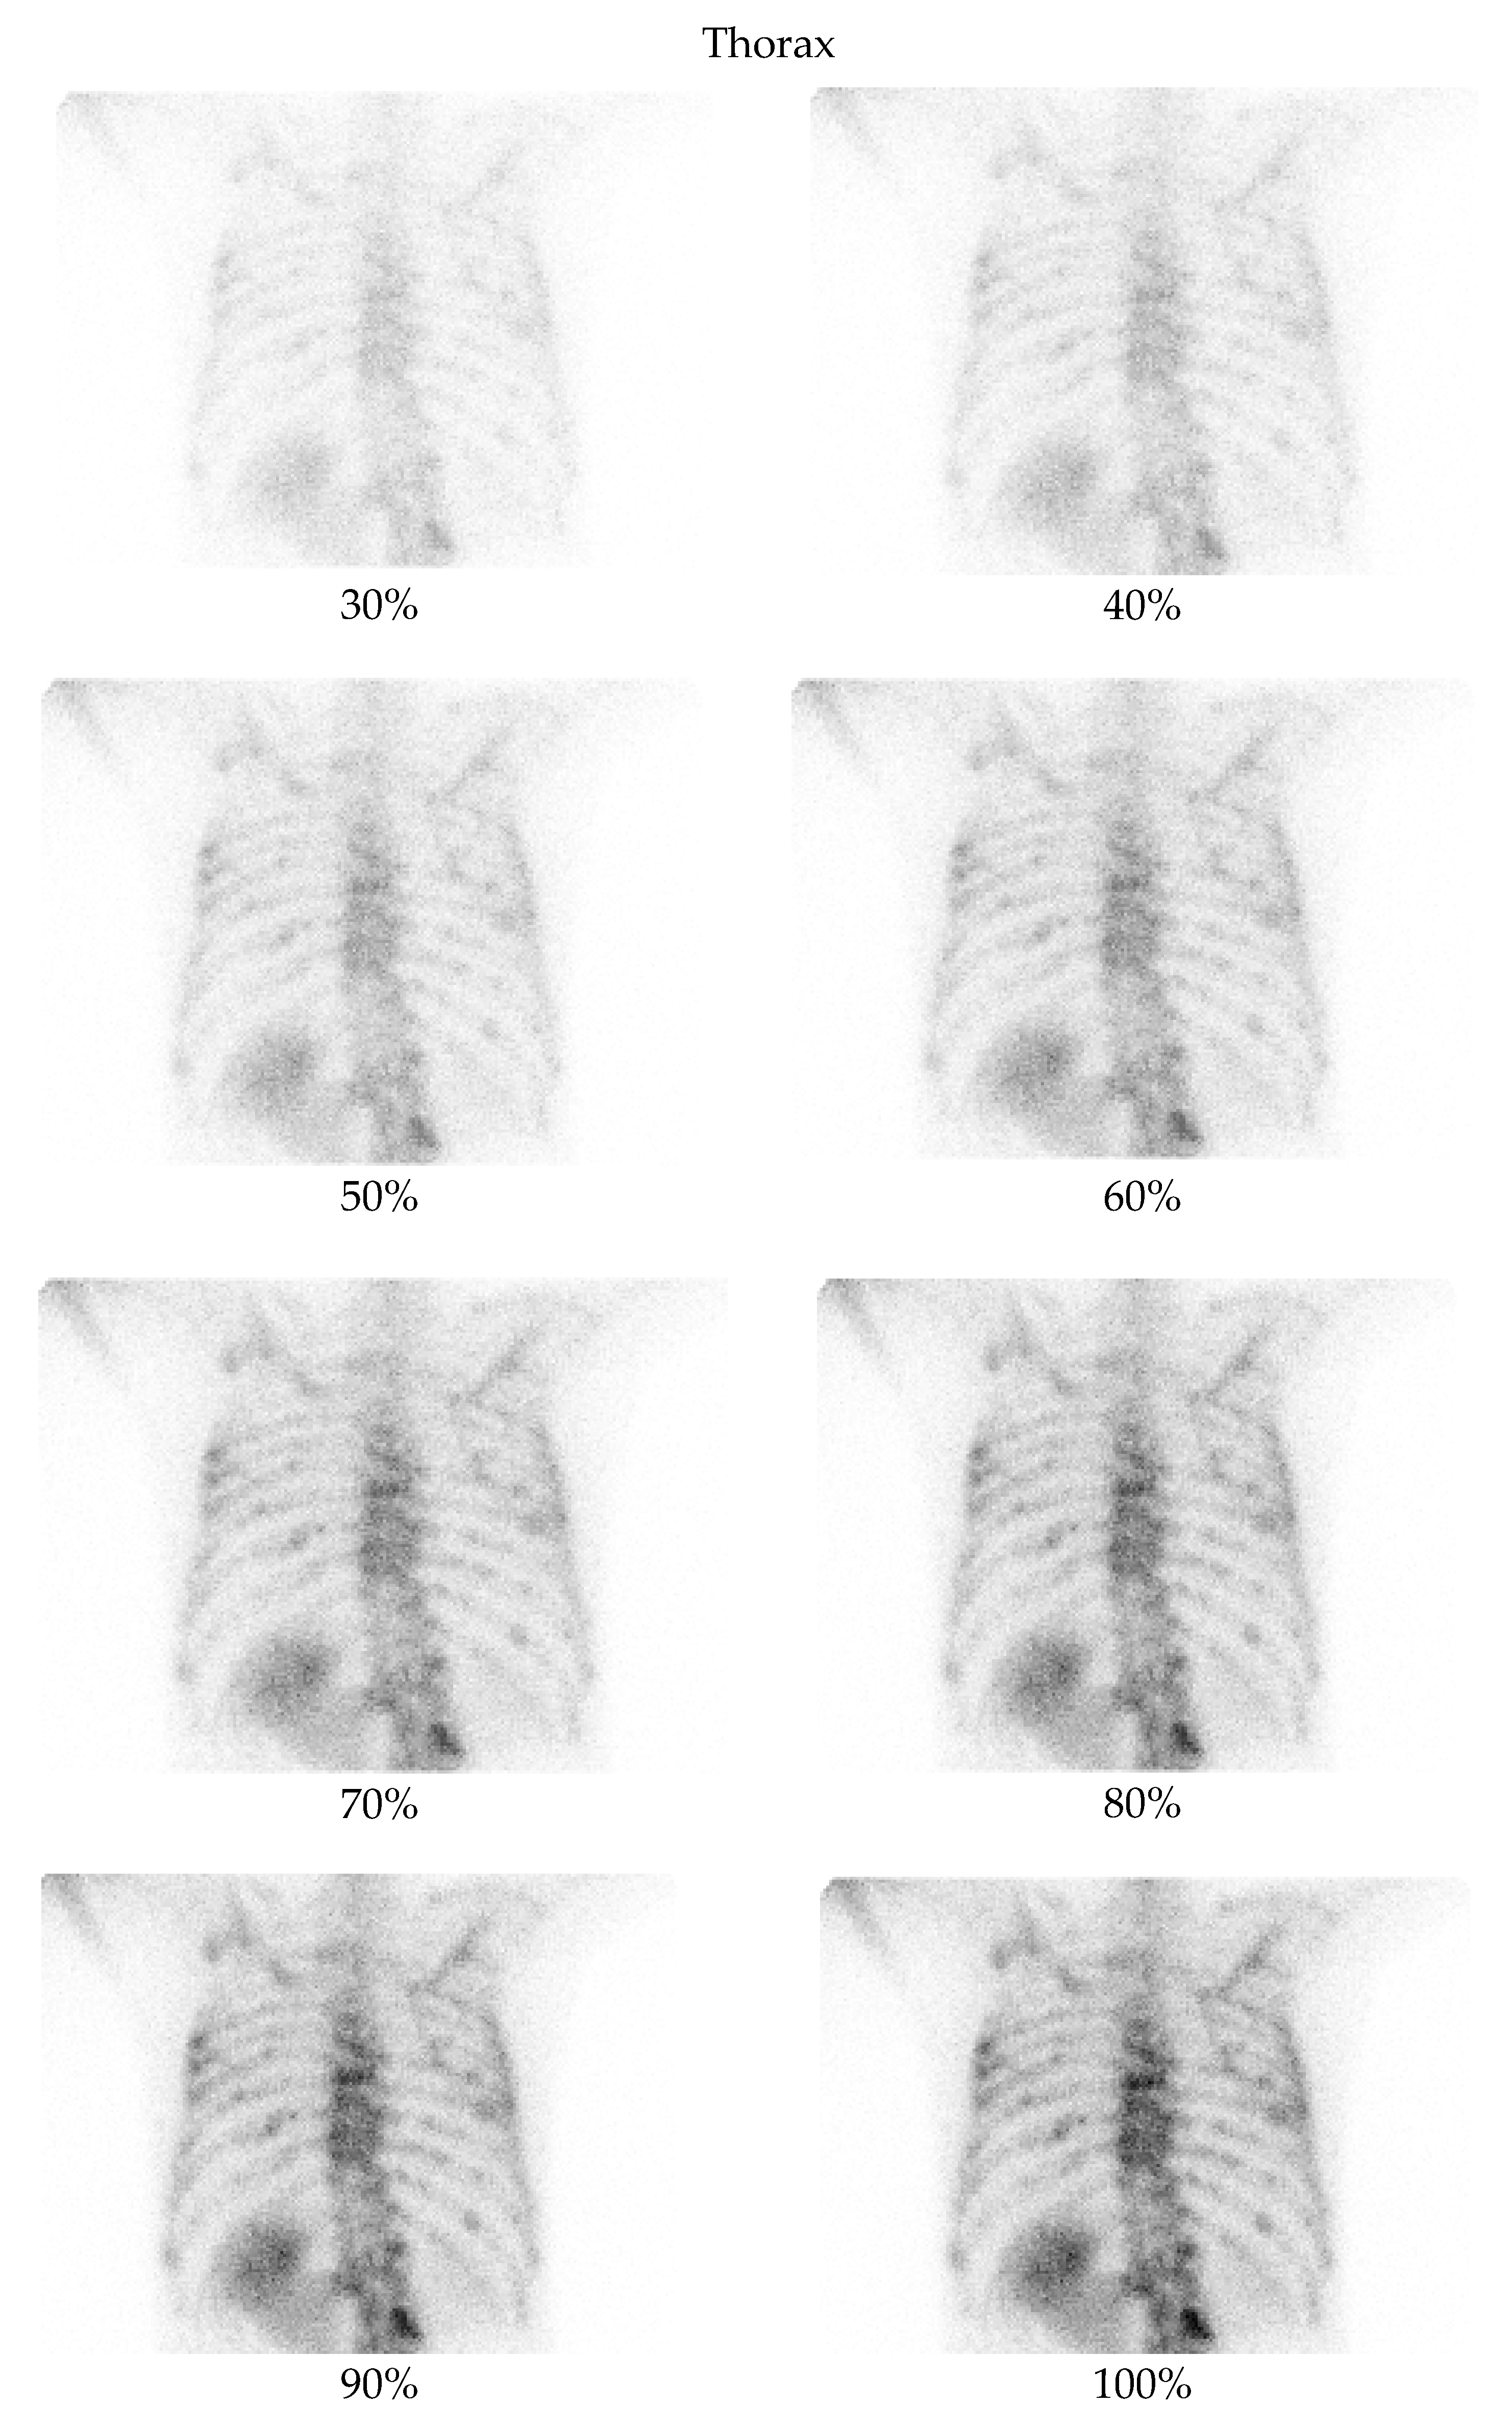
- Thorax at a 70% dose: 81% of comparisons favored the denoised image.
4.4. Strengths and Contributions
4.5. Limitations
4.6. Clinical Implications and Future Directions
5. Conclusions
Author Contributions
Funding
Institutional Review Board Statement
Informed Consent Statement
Data Availability Statement
Conflicts of Interest
Appendix A

| Metric | Region | E-Cam | Symbia |
|---|---|---|---|
| SSIM | Pelvis | 0.944 | 0.934 |
| SSIM | Thorax | 0.933 | 0.928 |
| PSNR | Pelvis | 36.17 | 35.99 |
| PSNR | Thorax | 33.63 | 33.38 |
| Low Dose Image Percentage | Noise Level (Pelvis) | ||
|---|---|---|---|
| Low-Dose | Denoised | Full-Dose | |
| 30% | 2.10 ± 0.54 | 3.90 ± 0.54 | 3.14 ± 0.48 |
| 40% | 2.14 ± 0.48 | 3.86 ± 0.36 | 3.10 ± 0.54 |
| 50% | 2.48 ± 0.51 | 4.10 ± 0.30 | 3.24 ± 0.44 |
| 60% | 2.76 ± 0.54 | 4.57 ± 0.51 | 3.71 ± 0.56 |
| 70% | 3.00 ± 0.32 | 4.14 ± 0.36 | 3.19 ± 0.51 |
| 80% | 3.20 ± 0.41 | 4.10 ± 0.31 | 3.25 ± 0.44 |
| 90% | 3.43 ± 0.51 | 4.19 ± 0.40 | 3.48 ± 0.51 |
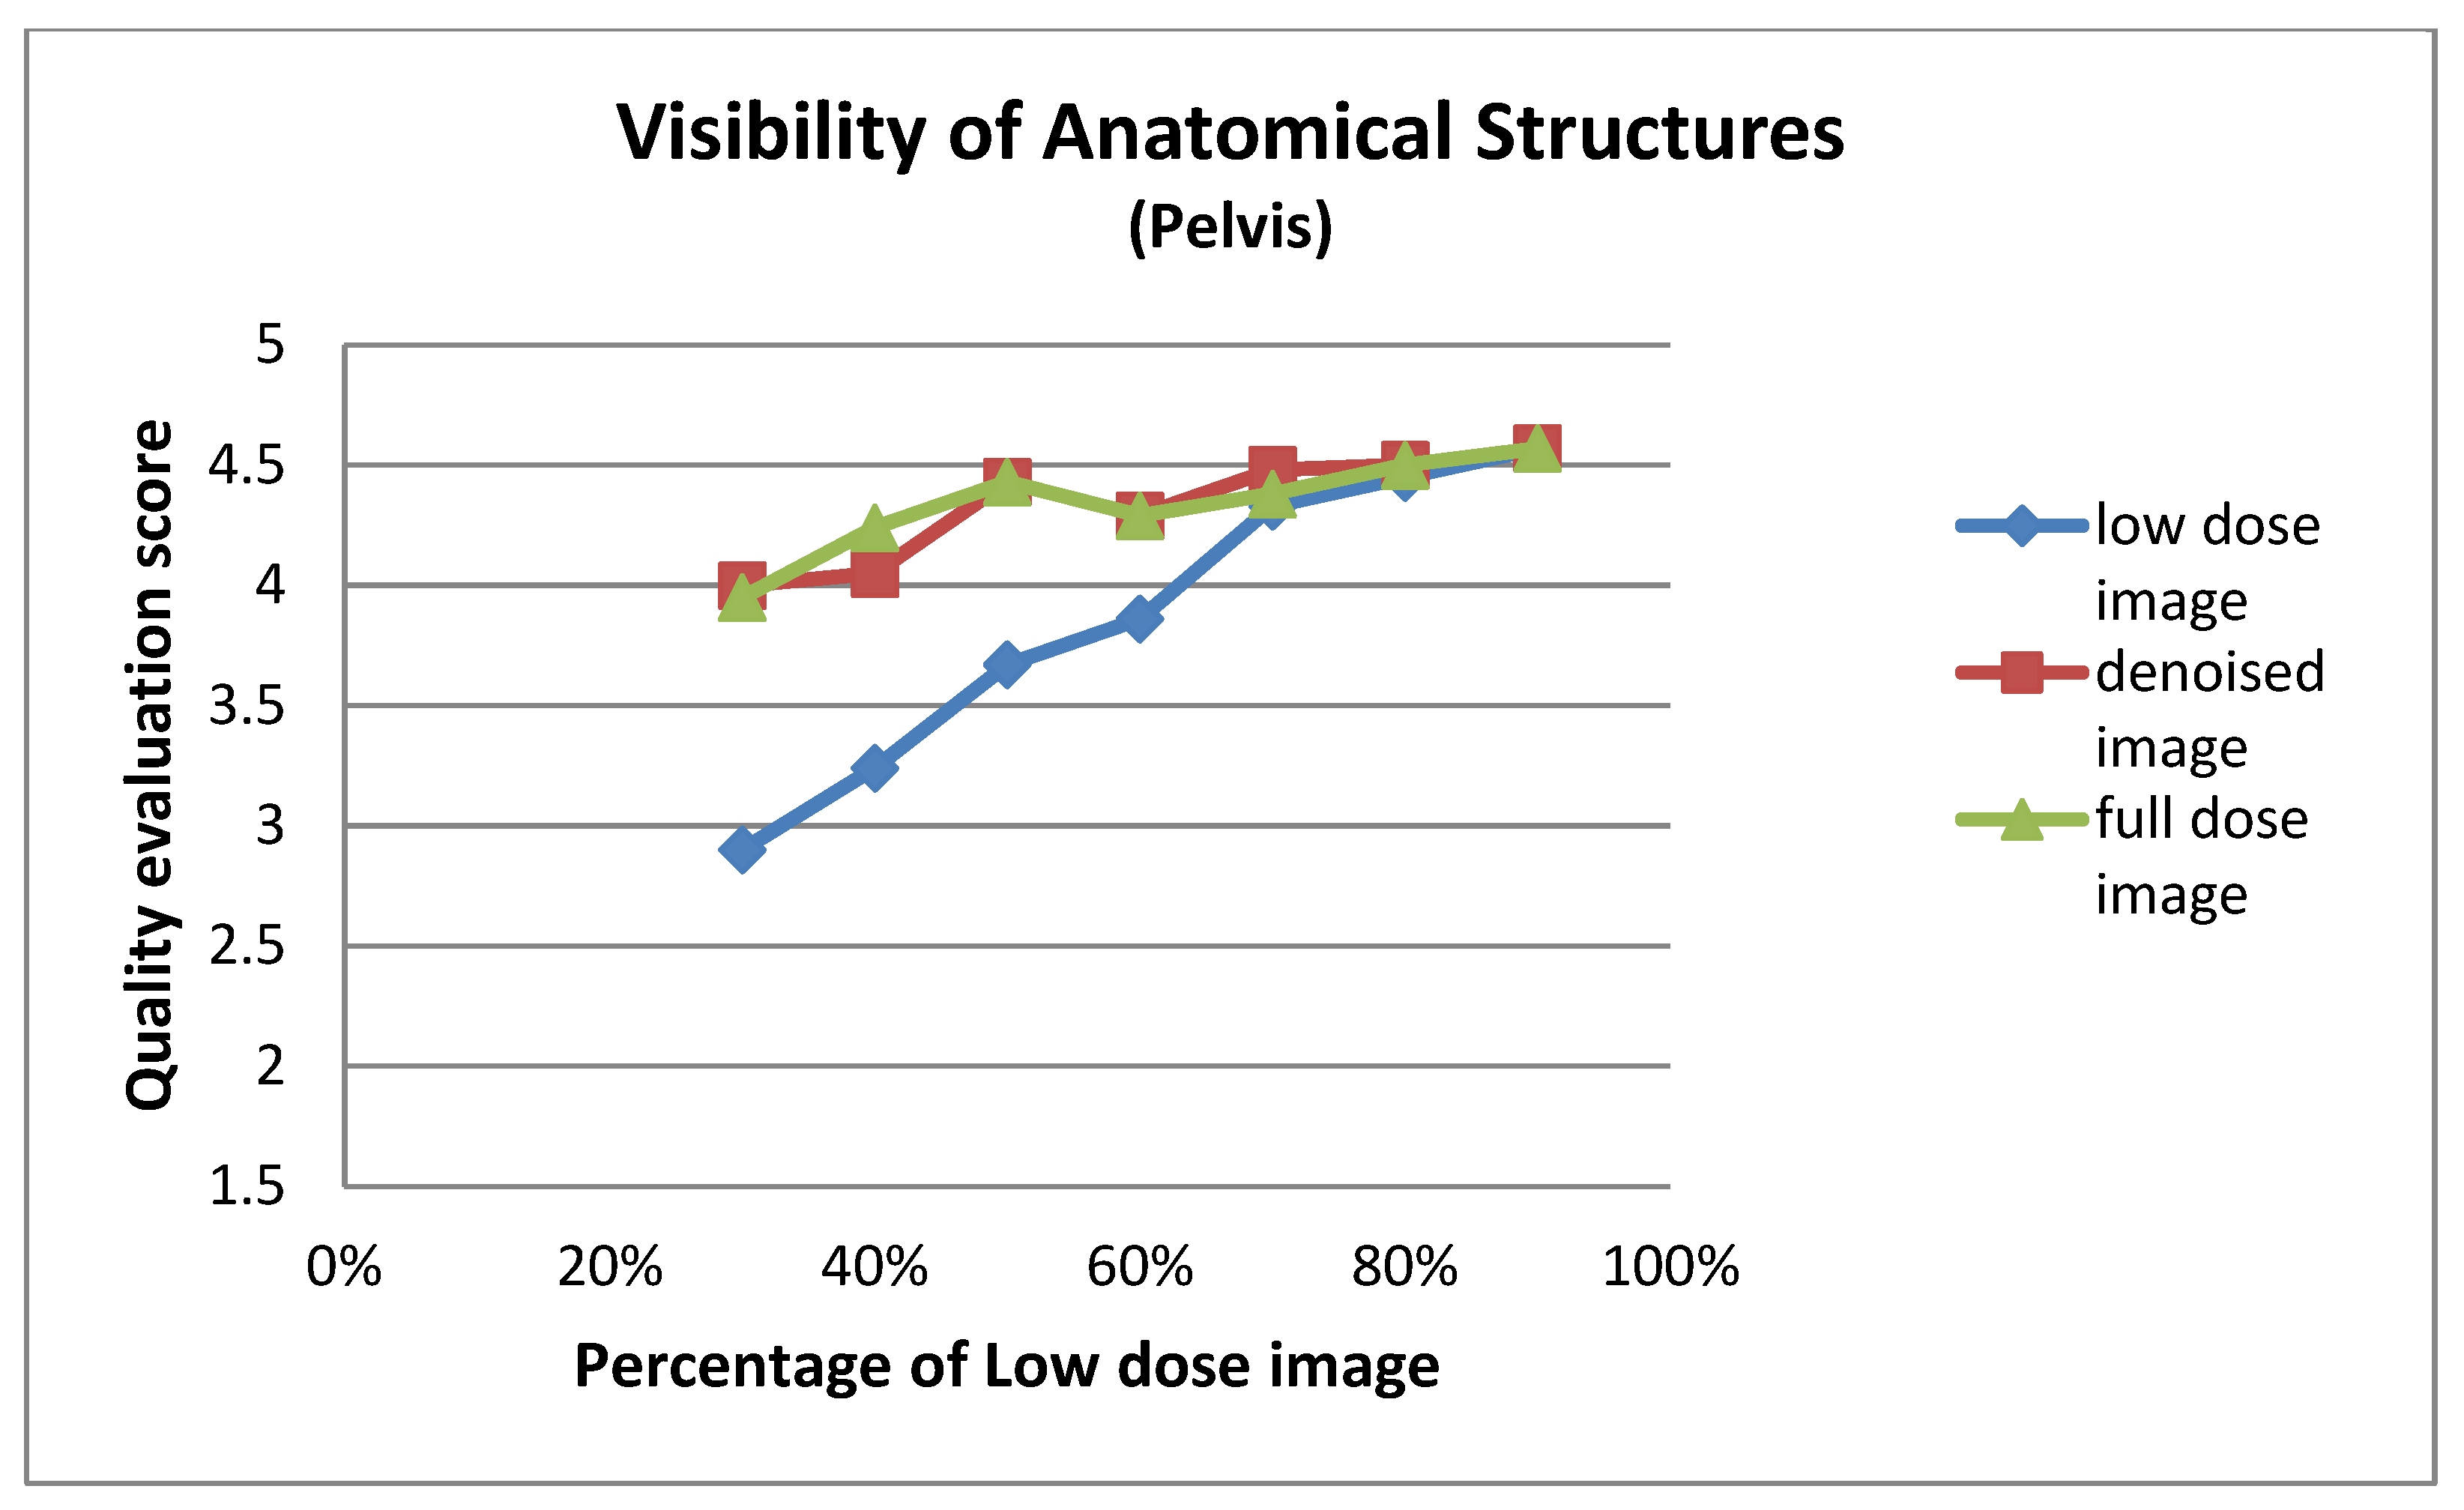
| Low Dose Image Percentage | Visibility of Anatomical Structures (Pelvis) | ||
|---|---|---|---|
| Low-Dose | Denoised | Full-Dose | |
| 30% | 2.90 ± 0.94 | 4.00 ± 0.84 | 3.95 ± 0.86 |
| 40% | 3.24 ± 0.70 | 4.05 ± 0.80 | 4.24 ± 0.77 |
| 50% | 3.67 ± 0.73 | 4.43 ± 0.51 | 4.43 ± 0.51 |
| 60% | 3.86 ± 0.65 | 4.29 ± 0.46 | 4.29 ± 0.46 |
| 70% | 4.33 ± 0.48 | 4.48 ± 0.51 | 4.38 ± 0.50 |
| 80% | 4.45 ± 0.51 | 4.50 ± 0.51 | 4.50 ± 0.51 |
| 90% | 4.57 ± 0.51 | 4.57 ± 0.51 | 4.57 ± 0.51 |
| Low Dose Image Percentage | Structural Detail Preservation (Pelvis) | ||
|---|---|---|---|
| Low-Dose | Denoised | Full-Dose | |
| 30% | 2.05 ± 0.92 | 3.19 ± 1.03 | 3.29 ± 1.01 |
| 40% | 2.19 ± 0.75 | 3.05 ± 0.92 | 3.33 ± 0.80 |
| 50% | 2.62 ± 0.74 | 3.48 ± 0.51 | 3.48 ± 0.51 |
| 60% | 2.90 ± 0.70 | 3.52 ± 0.68 | 3.43 ± 0.68 |
| 70% | 3.38 ± 0.50 | 3.52 ± 0.60 | 3.43 ± 0.60 |
| 80% | 3.40 ± 0.50 | 3.45 ± 0.60 | 3.45 ± 0.60 |
| 90% | 3.62 ± 0.59 | 3.67 ± 0.58 | 3.67 ± 0.58 |
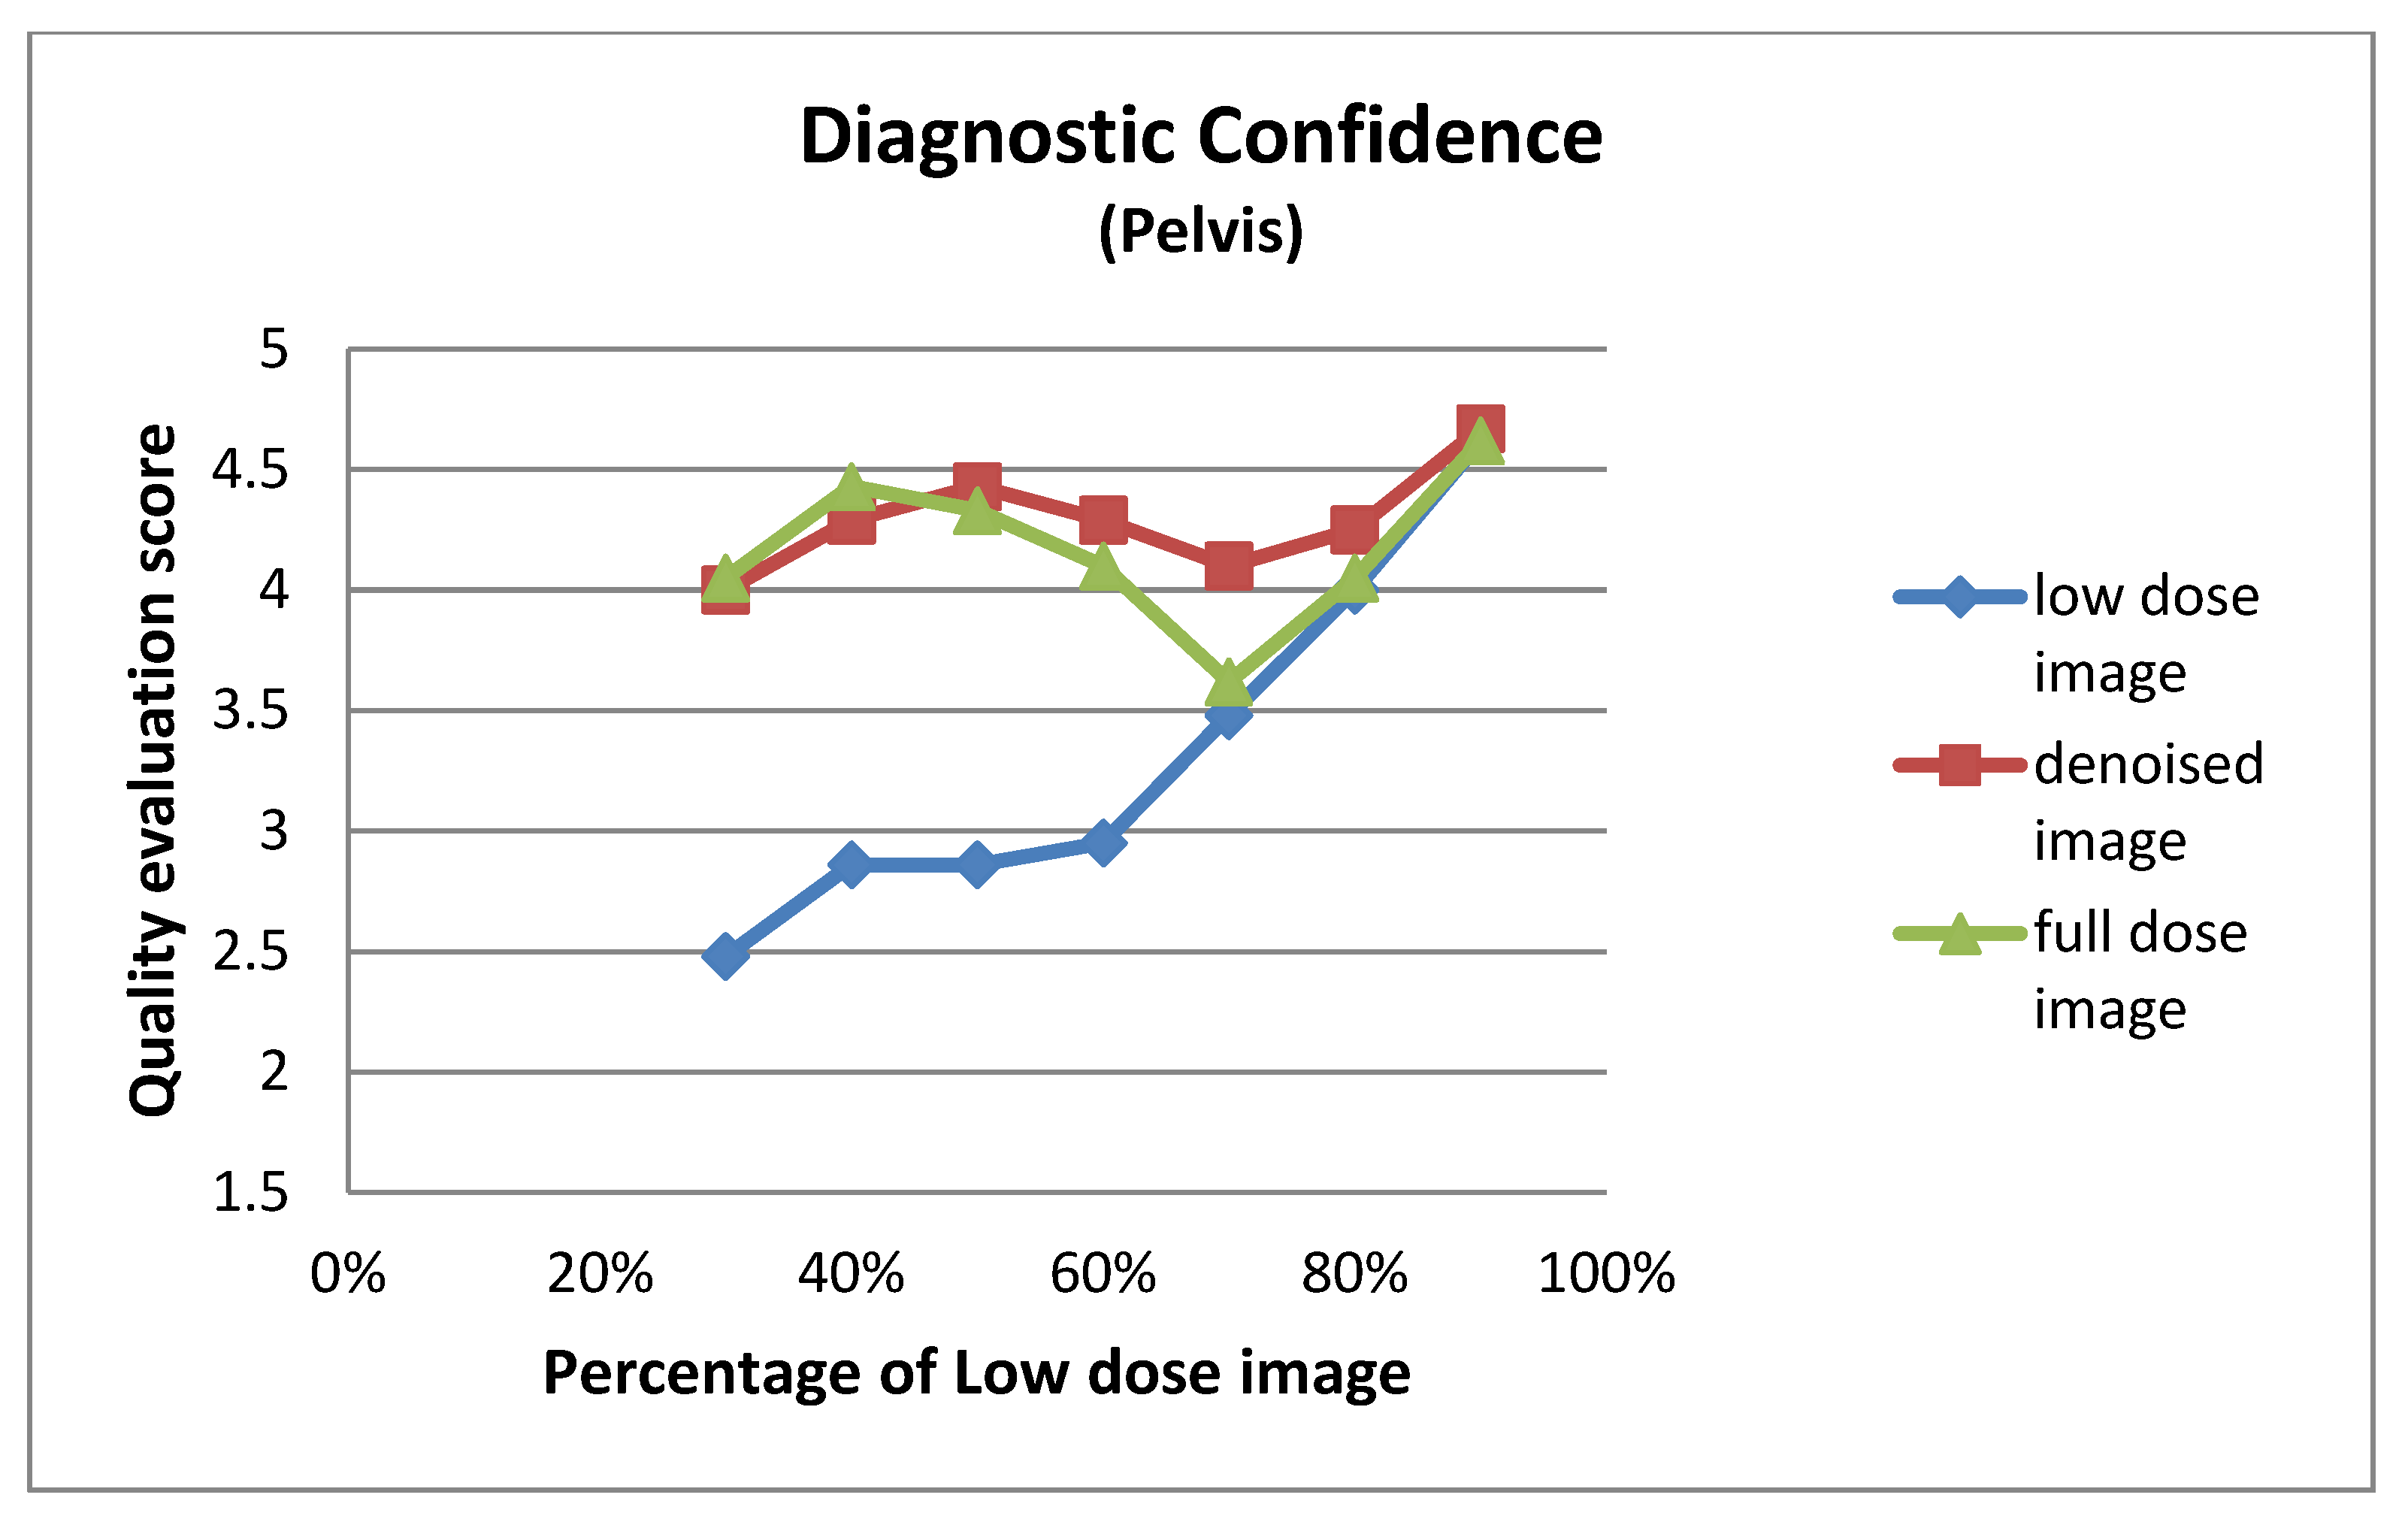
| Low Dose Image Percentage | Diagnostic Confidence (Pelvis) | ||
|---|---|---|---|
| Low-Dose | Denoised | Full-Dose | |
| 30% | 2.48 ± 1.08 | 4.00 ± 0.95 | 4.05 ± 0.92 |
| 40% | 2.86 ± 0.73 | 4.29 ± 0.64 | 4.43 ± 0.60 |
| 50% | 2.86 ± 0.91 | 4.43 ± 0.75 | 4.33 ± 0.80 |
| 60% | 2.95 ± 0.67 | 4.29 ± 0.64 | 4.10 ± 0.62 |
| 70% | 3.48 ± 0.75 | 4.10 ± 0.70 | 3.62 ± 0.67 |
| 80% | 4.00 ± 0.79 | 4.25 ± 0.64 | 4.05 ± 0.76 |
| 90% | 4.62 ± 0.50 | 4.67 ± 0.48 | 4.62 ± 0.50 |


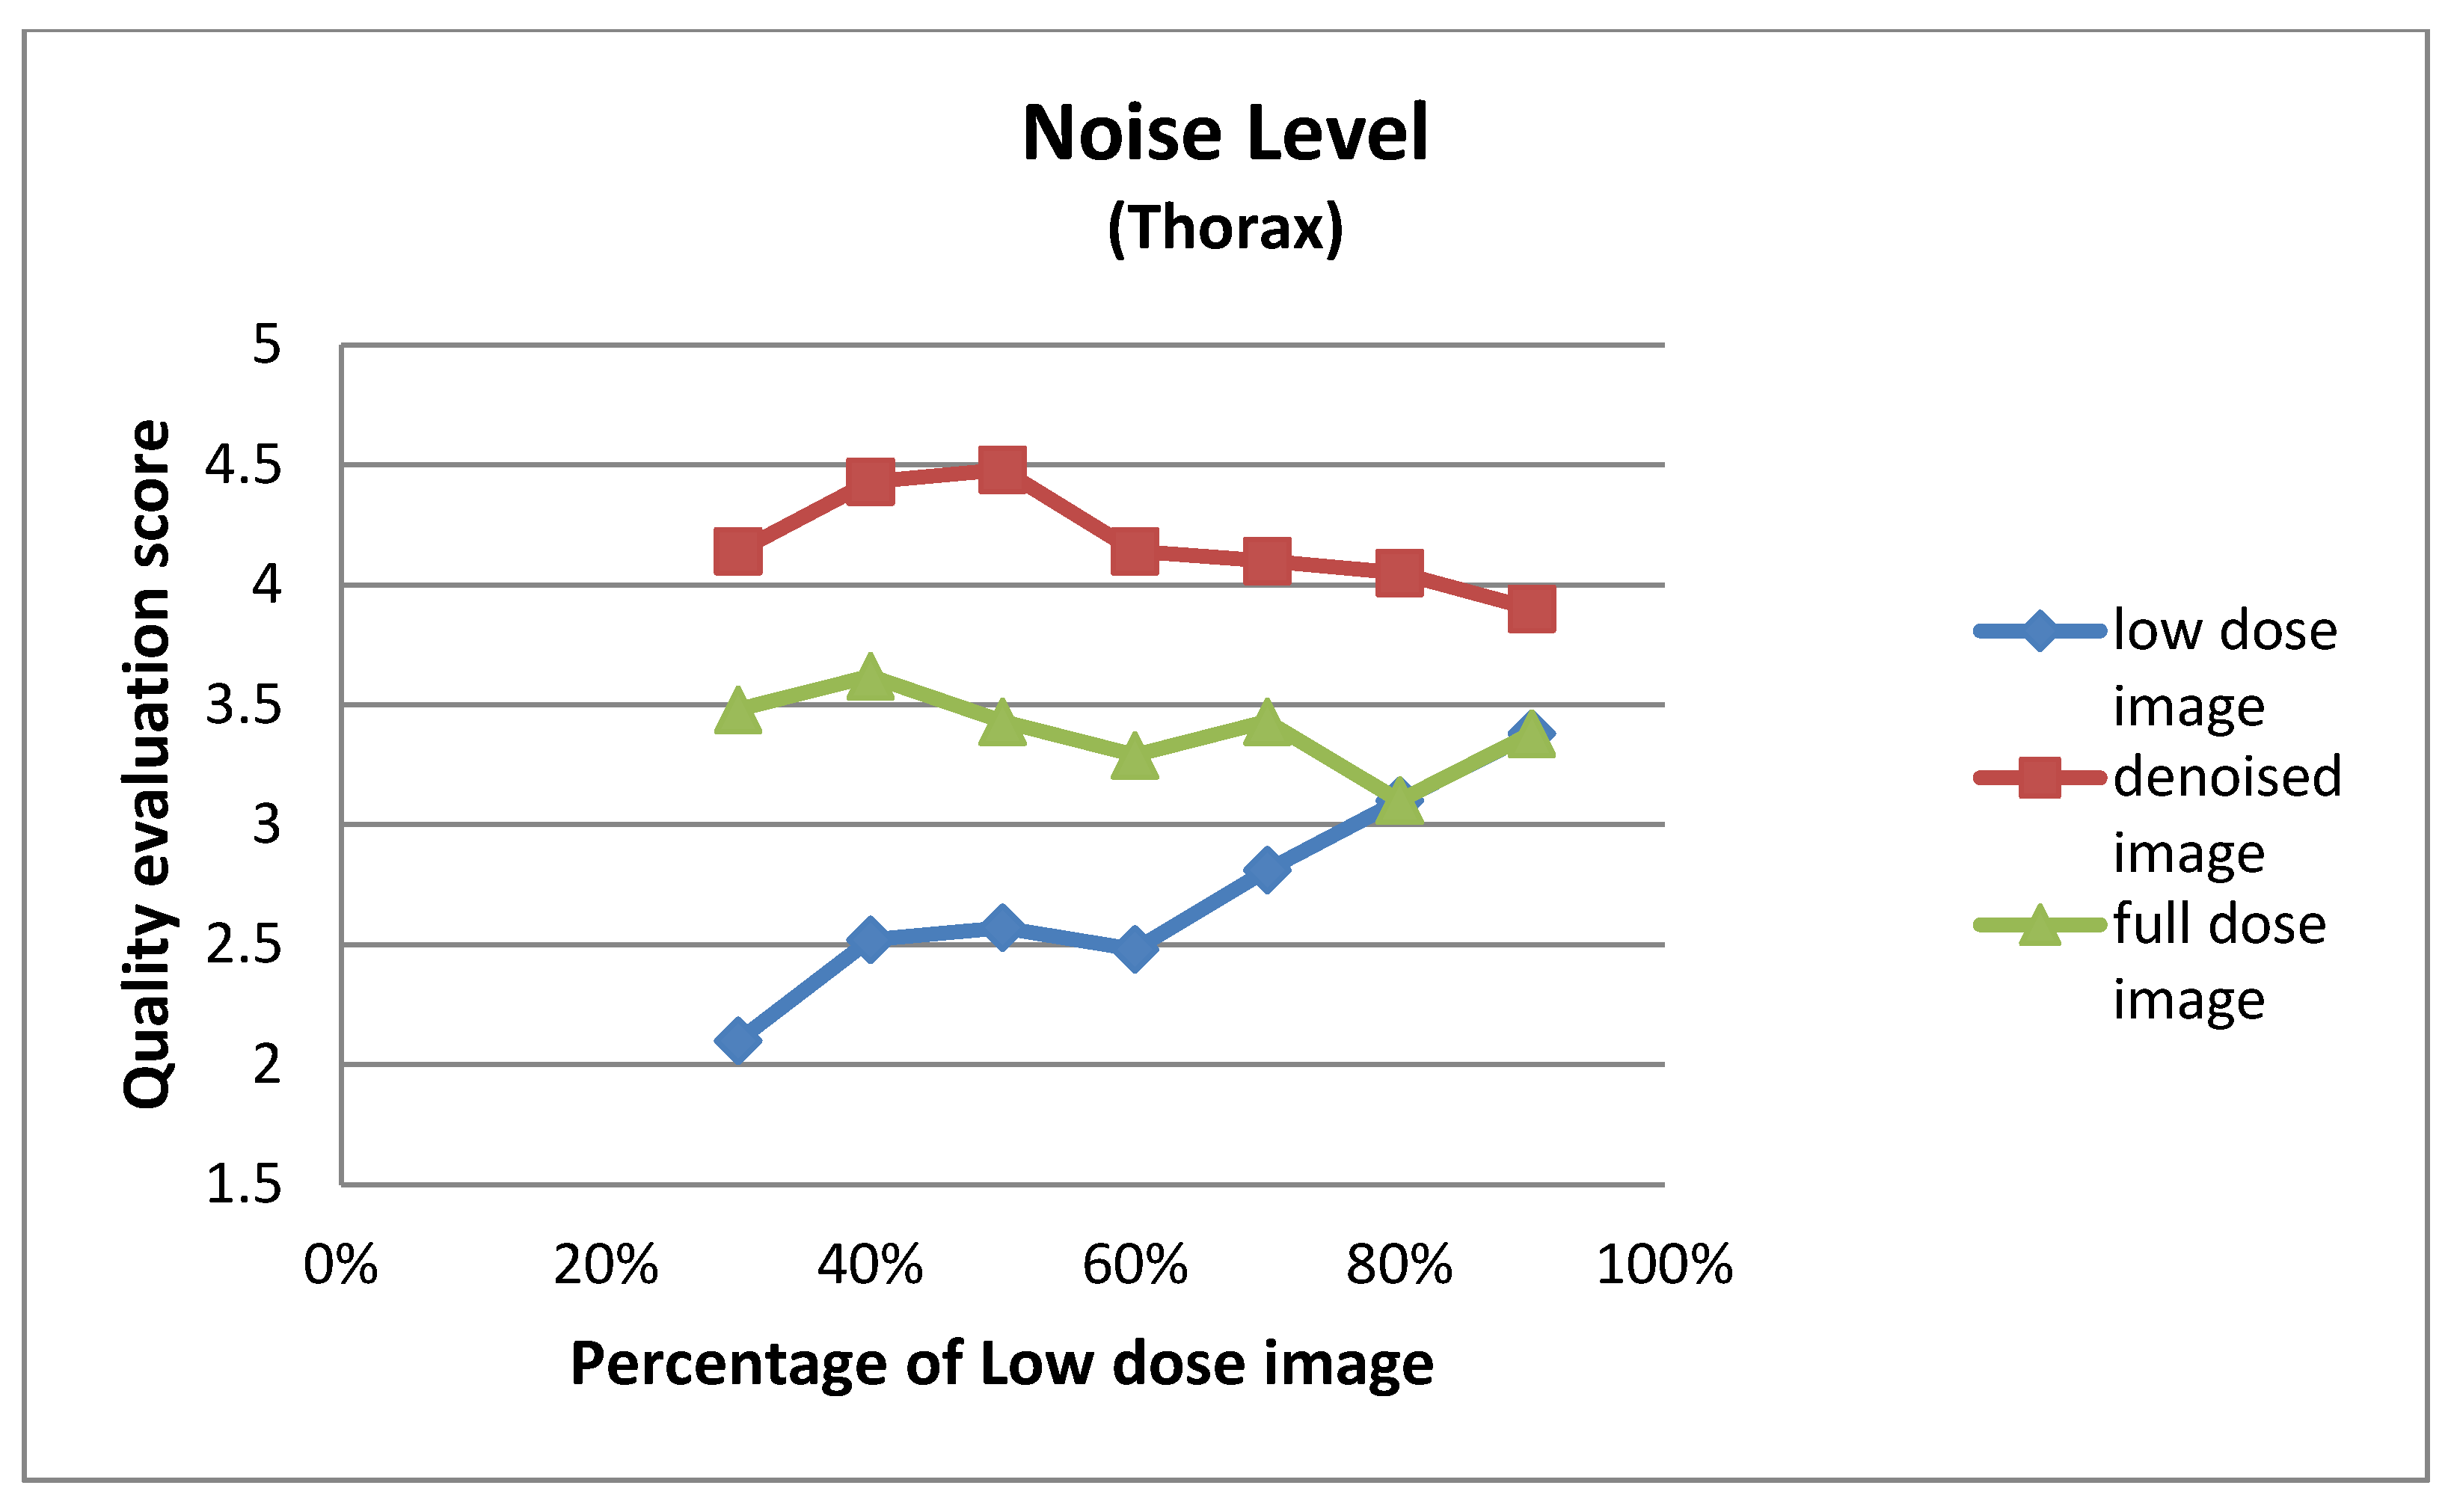
| Low Dose Image Percentage | Noise Level (Thorax) | ||
|---|---|---|---|
| Low-Dose | Denoised | Full-Dose | |
| 30% | 2.10 ± 0.62 | 4.14 ± 0.48 | 3.48 ± 0.51 |
| 40% | 2.52 ± 0.51 | 4.43 ± 0.51 | 3.62 ± 0.50 |
| 50% | 2.57 ± 0.60 | 4.48 ± 0.51 | 3.43 ± 0.51 |
| 60% | 2.48 ± 0.60 | 4.14 ± 0.48 | 3.29 ± 0.46 |
| 70% | 2.81 ± 0.40 | 4.10 ± 0.44 | 3.43 ± 0.51 |
| 80% | 3.10 ± 0.30 | 4.05 ± 0.22 | 3.10 ± 0.30 |
| 90% | 3.38 ± 0.67 | 3.90 ± 0.54 | 3.38 ± 0.67 |
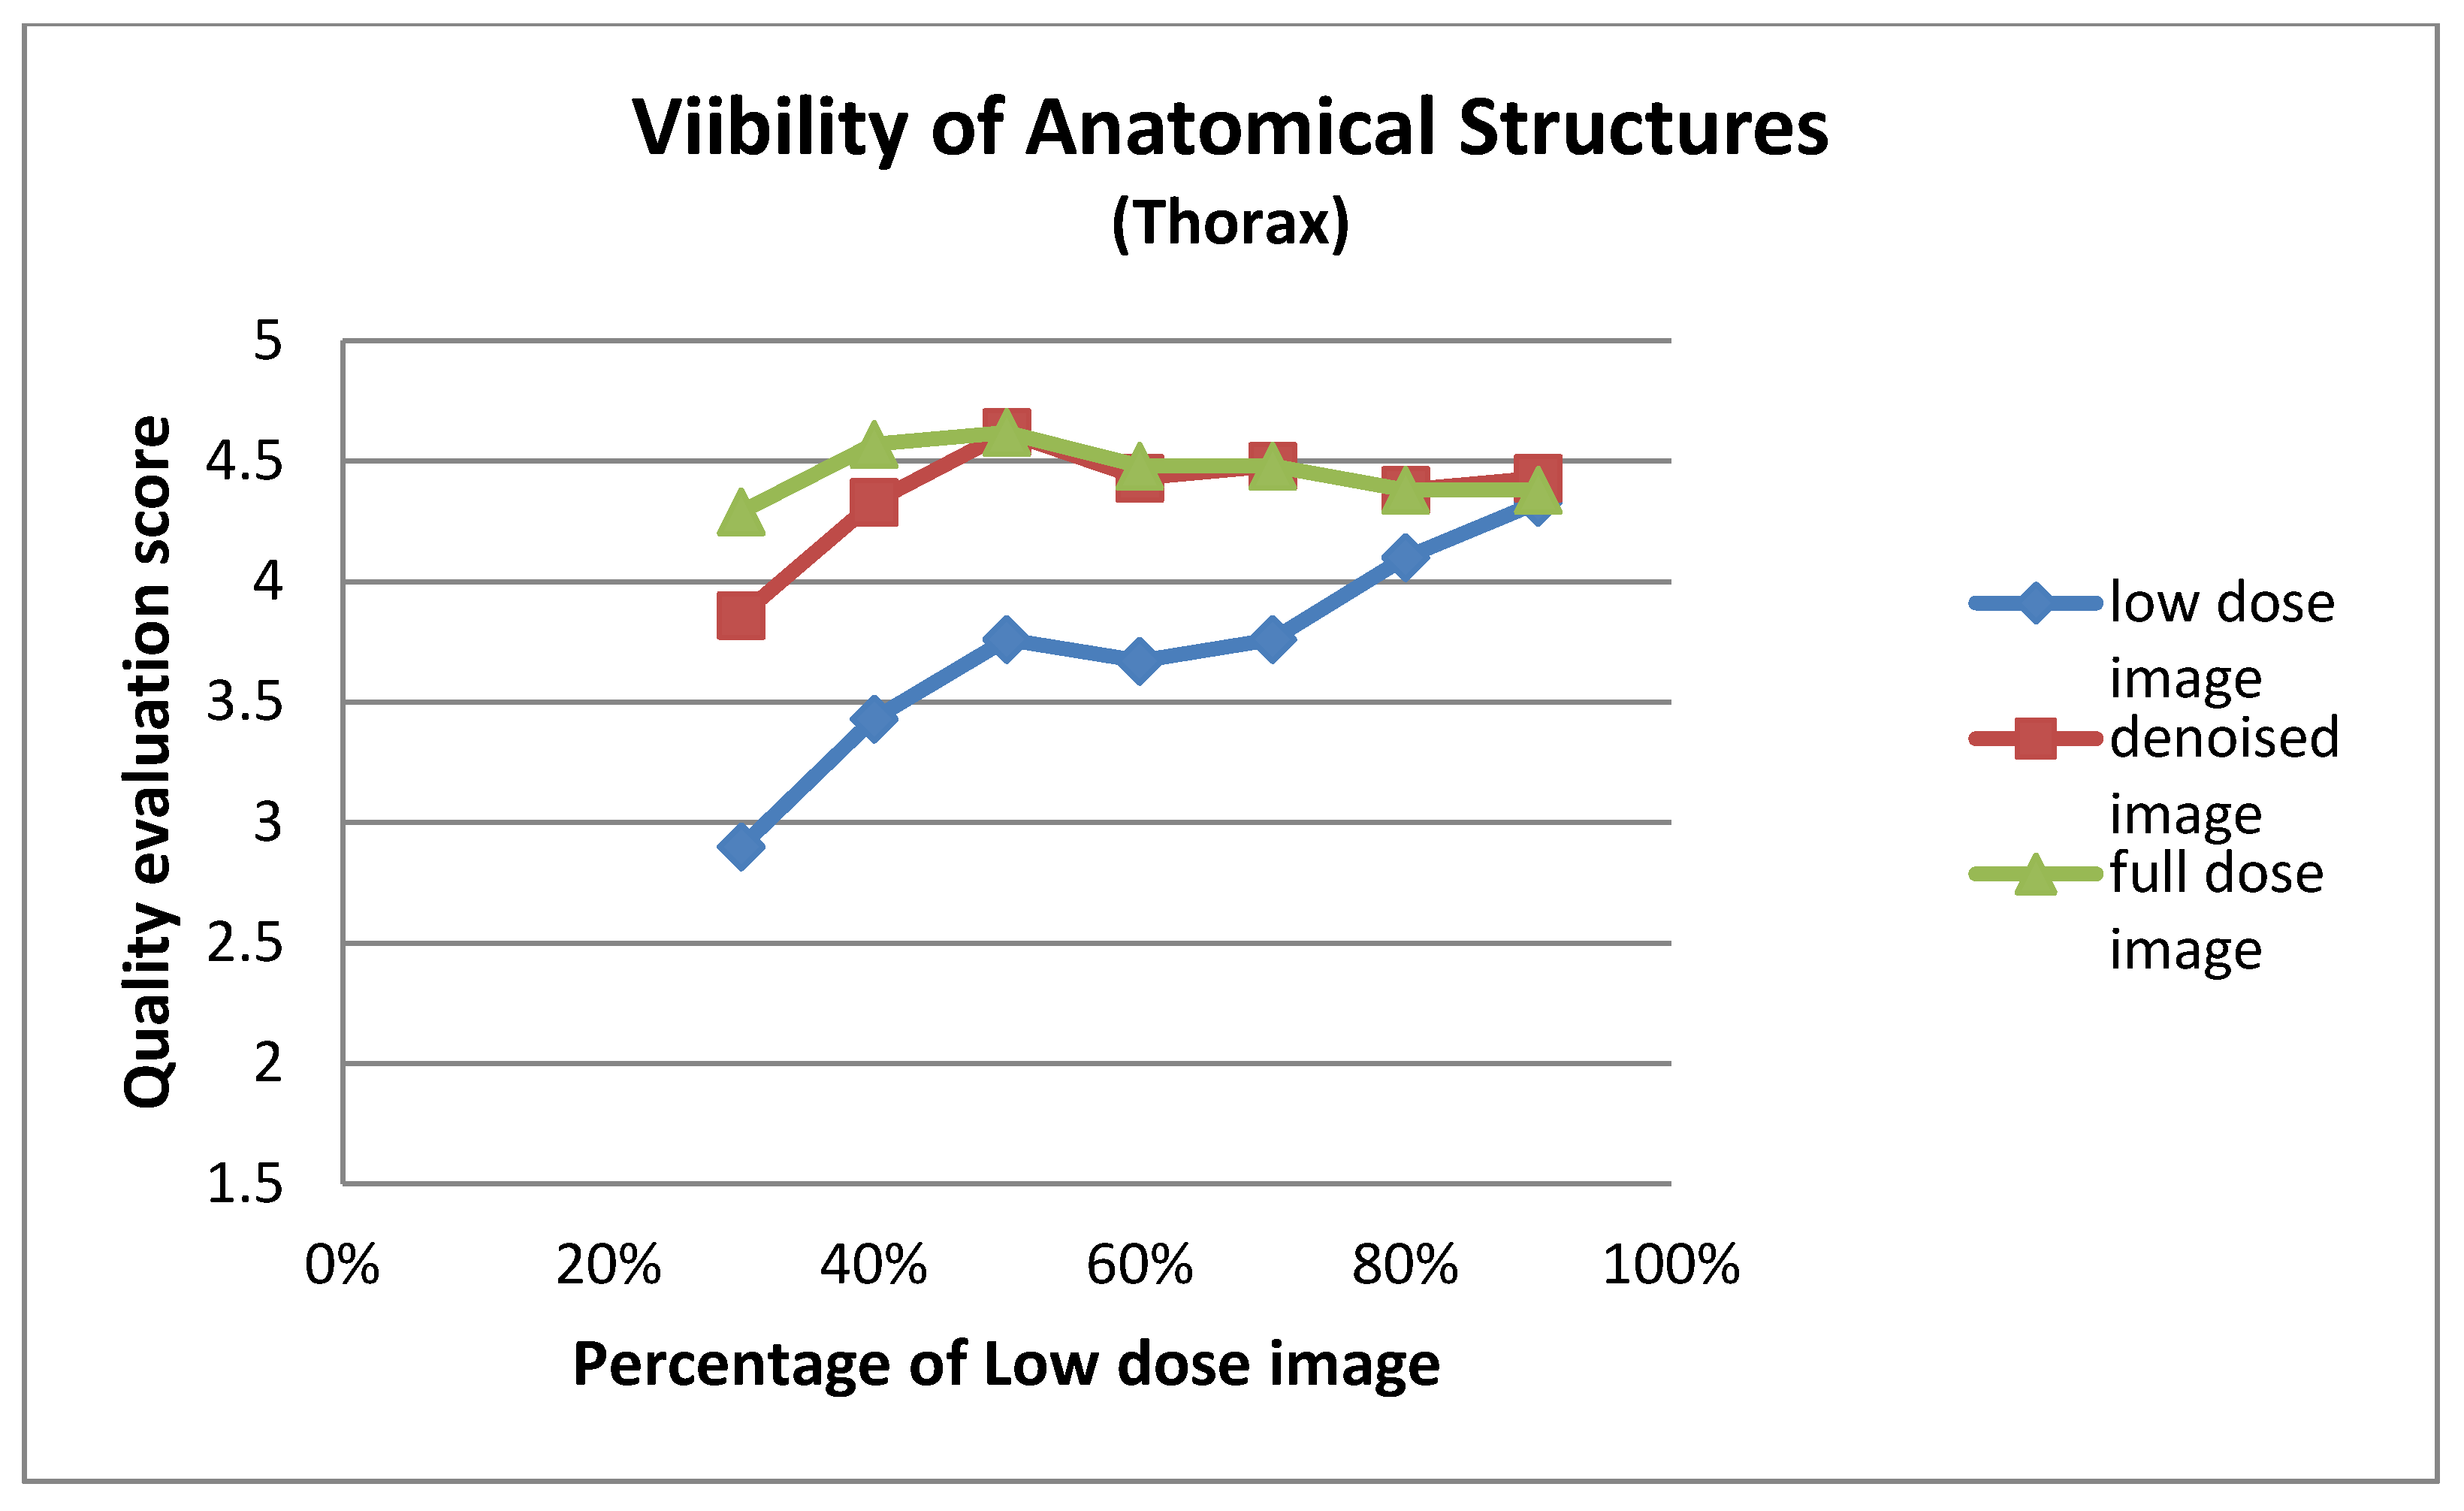
| Low Dose Image Percentage | Visibility of Anatomical Structures (Thorax) | ||
|---|---|---|---|
| Low-Dose | Denoised | Full-Dose | |
| 30% | 2.90 ± 0.94 | 3.86 ± 0.73 | 4.29 ± 0.56 |
| 40% | 3.43 ± 0.75 | 4.33 ± 0.58 | 4.57 ± 0.60 |
| 50% | 3.76 ± 0.70 | 4.62 ± 0.50 | 4.62 ± 0.50 |
| 60% | 3.67 ± 0.80 | 4.43 ± 0.60 | 4.48 ± 0.60 |
| 70% | 3.76 ± 0.70 | 4.48 ± 0.68 | 4.48 ± 0.68 |
| 80% | 4.10 ± 0.54 | 4.38 ± 0.50 | 4.38 ± 0.50 |
| 90% | 4.33 ± 0.66 | 4.43 ± 0.51 | 4.38 ± 0.59 |
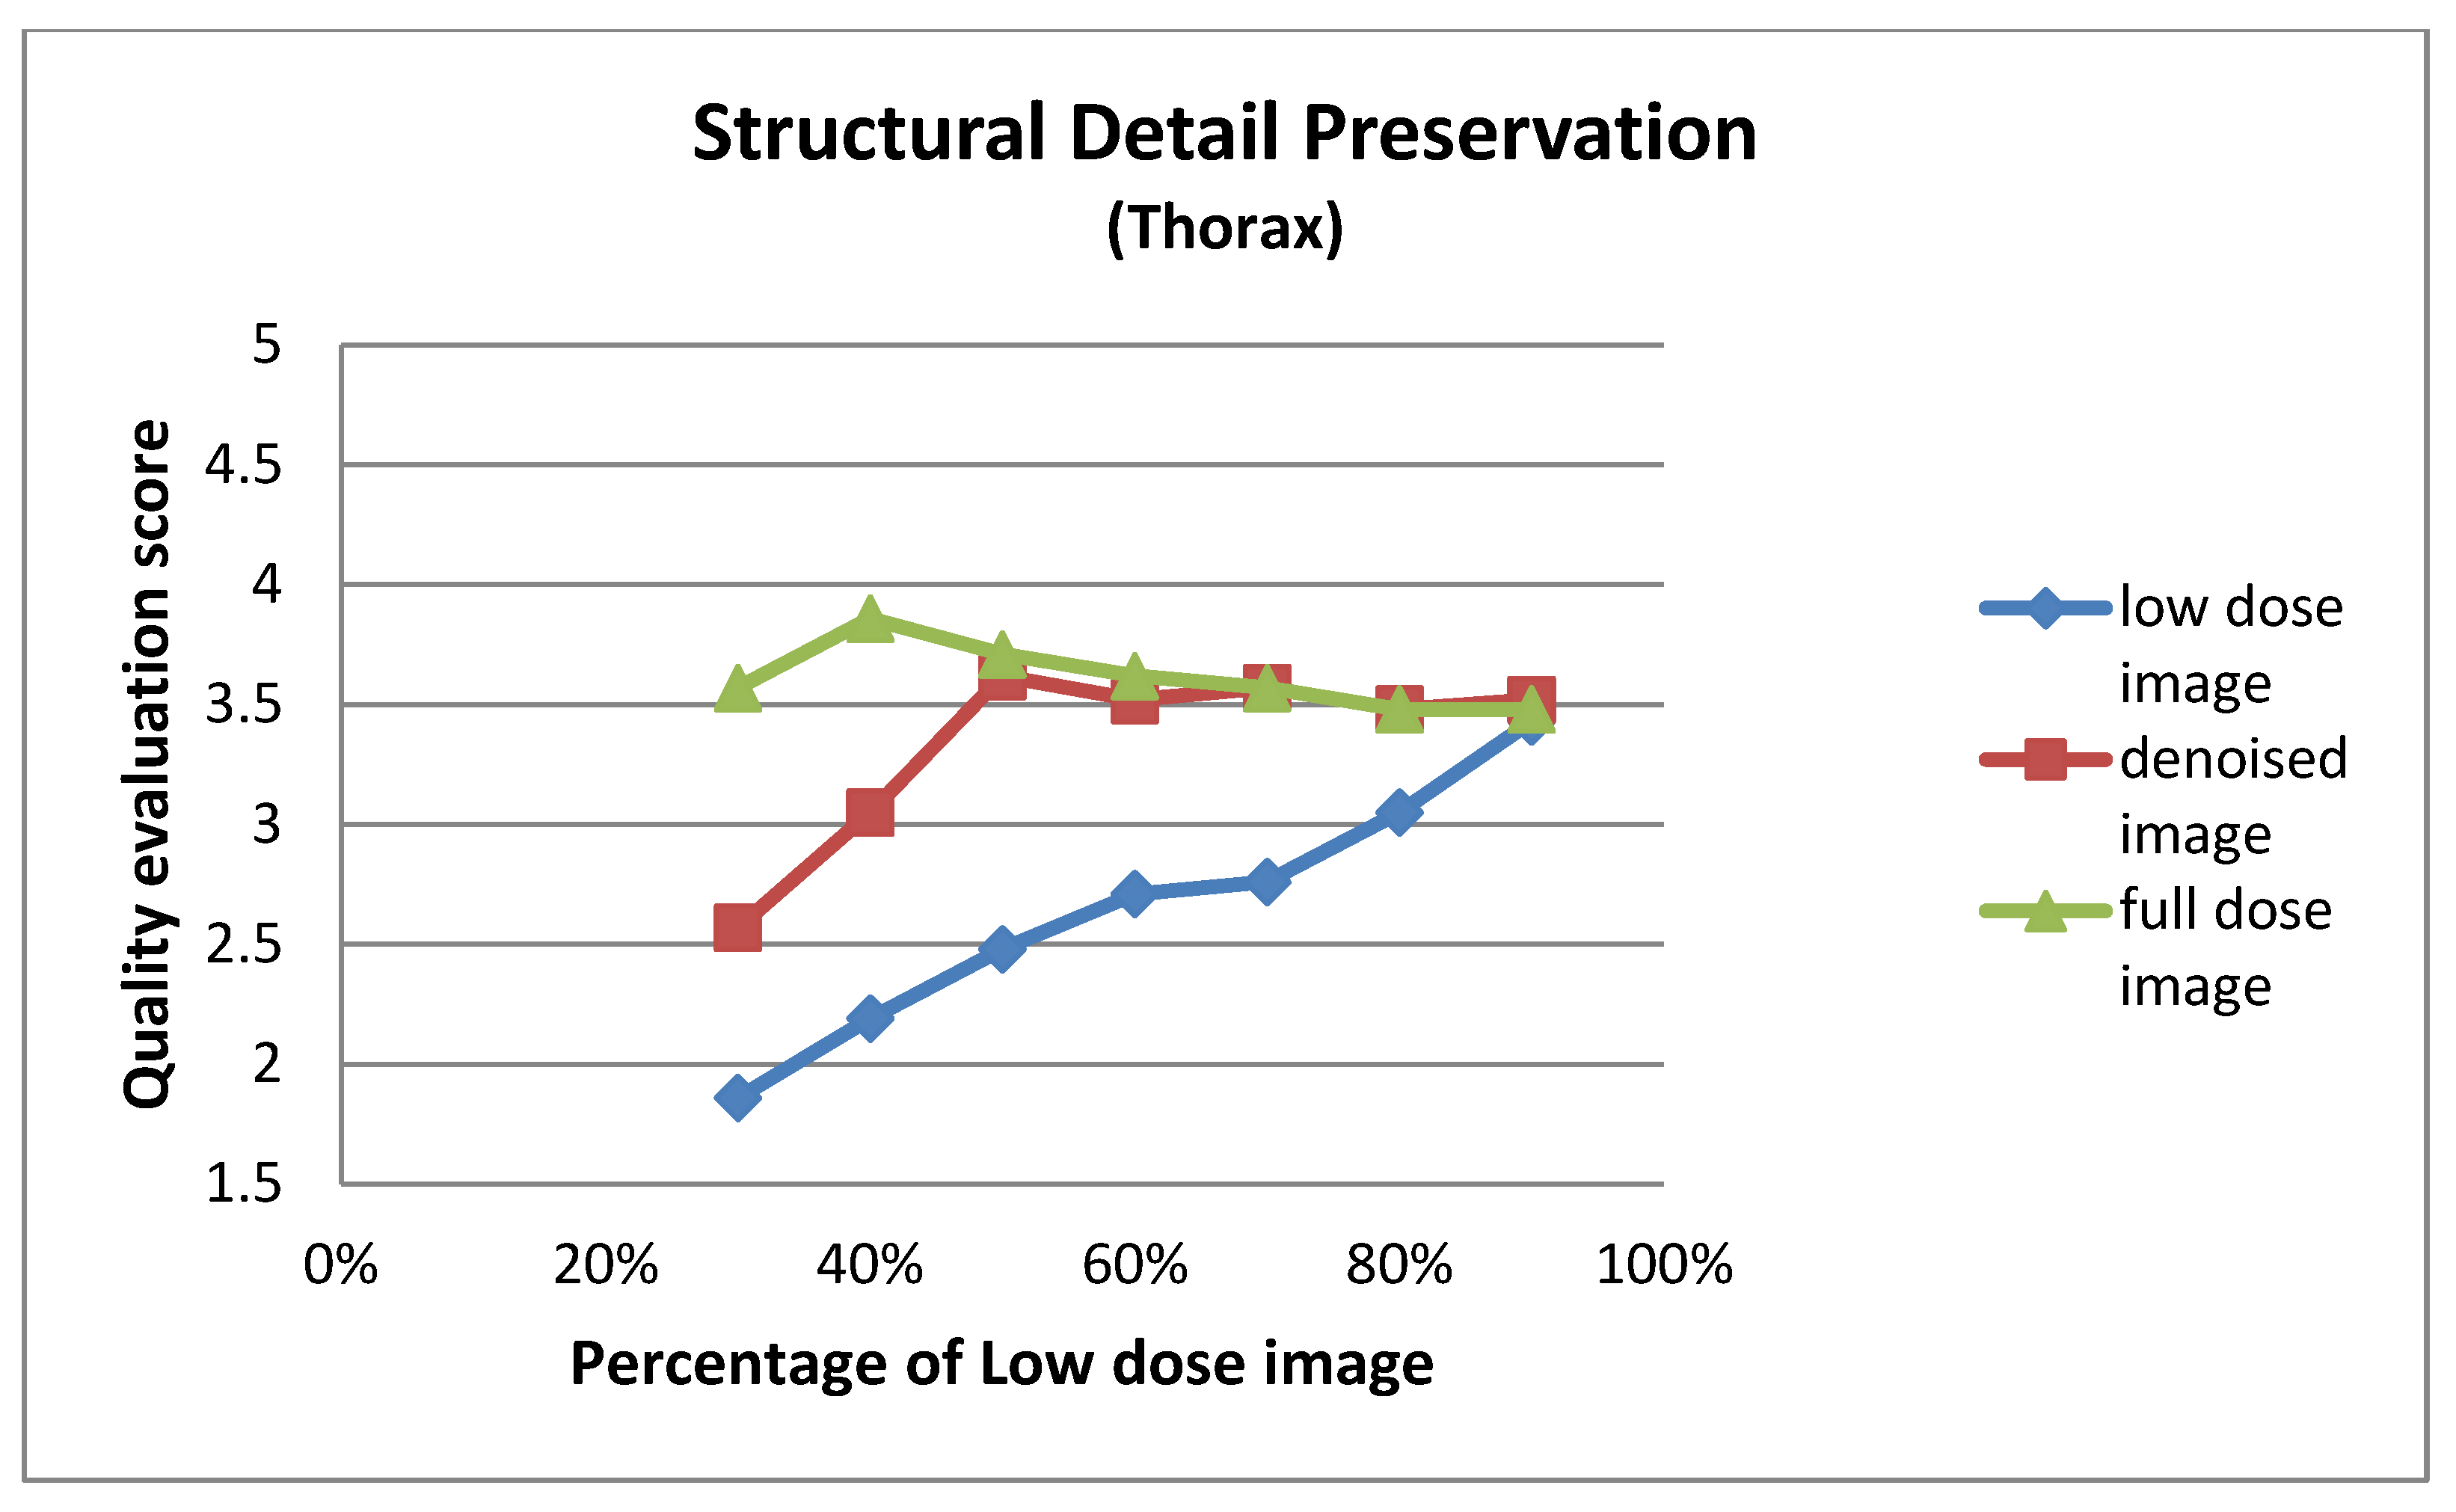
| Low Dose Image Percentage | Structural Detail Preservation (Thorax) | ||
|---|---|---|---|
| Low-Dose | Denoised | Full-Dose | |
| 30% | 1.86 ± 0.73 | 2.57 ± 0.75 | 3.57 ± 0.75 |
| 40% | 2.19 ± 0.75 | 3.05 ± 0.50 | 3.86 ± 0.65 |
| 50% | 2.48 ± 0.60 | 3.62 ± 0.74 | 3.71 ± 0.78 |
| 60% | 2.71 ± 0.78 | 3.52 ± 0.75 | 3.62 ± 0.74 |
| 70% | 2.76 ± 0.70 | 3.57 ± 0.81 | 3.57 ± 0.81 |
| 80% | 3.05 ± 0.59 | 3.48 ± 0.68 | 3.48 ± 0.60 |
| 90% | 3.43 ± 0.68 | 3.52 ± 0.51 | 3.48 ± 0.60 |
| Low Dose Image Percentage | Diagnostic Confidence (Thorax) | ||
|---|---|---|---|
| Low-Dose | Denoised | Full-Dose | |
| 30% | 2.57 ± 0.81 | 3.67 ± 0.73 | 4.24 ± 0.62 |
| 40% | 2.67 ± 0.58 | 3.62 ± 0.59 | 4.52 ± 0.60 |
| 50% | 3.33 ± 0.66 | 4.76 ± 0.44 | 4.86 ± 0.36 |
| 60% | 3.14 ± 0.79 | 4.57 ± 0.60 | 4.57 ± 0.68 |
| 70% | 2.95 ± 0.80 | 4.38 ± 0.74 | 4.38 ± 0.74 |
| 80% | 3.48 ± 0.81 | 4.33 ± 0.66 | 4.10 ± 0.77 |
| 90% | 4.29 ± 0.85 | 4.48 ± 0.60 | 4.33 ± 0.73 |

References
- Giannopoulou, C. The Role of SPET and PET in Monitoring Tumour Response to Therapy. Eur. J. Nucl. Med. Mol. Imaging 2003, 30, 1173–1200. [Google Scholar] [CrossRef] [PubMed]
- Dhoundiyal, S.; Srivastava, S.; Kumar, S.; Singh, G.; Ashique, S.; Pal, R.; Mishra, N.; Taghizadeh-Hesary, F. Radiopharmaceuticals: Navigating the Frontier of Precision Medicine and Therapeutic Innovation. Eur. J. Med. Res. 2024, 29, 26. [Google Scholar] [CrossRef] [PubMed]
- Center for Devices and Radiological Health. White Paper: Initiative to Reduce Unnecessary Radiation Exposure from Medical Imaging; U.S. Food & Drug Administration: Silver Spring, MD, USA, 2019.
- Wells, R.G. Dose Reduction Is Good but It Is Image Quality That Matters. J. Nucl. Cardiol. 2020, 27, 238–240. [Google Scholar] [CrossRef] [PubMed]
- Davila, D.; Antoniou, A.; Chaudhry, M.A. Evaluation of Osseous Metastasis in Bone Scintigraphy. Semin. Nucl. Med. 2015, 45, 3–15. [Google Scholar] [CrossRef]
- Ito, T.; Maeno, T.; Tsuchikame, H.; Shishido, M.; Nishi, K.; Kojima, S.; Hayashi, T.; Suzuki, K. Adapting a Low-Count Acquisition of the Bone Scintigraphy Using Deep Denoising Super-Resolution Convolutional Neural Network. Phys. Medica 2022, 100, 18–25. [Google Scholar] [CrossRef]
- Murata, T.; Hashimoto, T.; Onoguchi, M.; Shibutani, T.; Iimori, T.; Sawada, K.; Umezawa, T.; Masuda, Y.; Uno, T. Verification of Image Quality Improvement of Low-Count Bone Scintigraphy Using Deep Learning. Radiol. Phys. Technol. 2024, 17, 269–279. [Google Scholar] [CrossRef]
- Ramon, A.J.; Yang, Y.; Pretorius, P.H.; Johnson, K.L.; King, M.A.; Wernick, M.N. Improving Diagnostic Accuracy in Low-Dose SPECT Myocardial Perfusion Imaging with Convolutional Denoising Networks. IEEE Trans. Med. Imaging 2020, 39, 2893–2903. [Google Scholar] [CrossRef]
- Litjens, G.; Kooi, T.; Bejnordi, B.E.; Setio, A.A.A.; Ciompi, F.; Ghafoorian, M.; Van Der Laak, J.A.W.M.; Van Ginneken, B.; Sánchez, C.I. A Survey on Deep Learning in Medical Image Analysis. Med. Image Anal. 2017, 42, 60–88. [Google Scholar] [CrossRef]
- Tamam, M.O.; Tamam, M.C. Artificial Intelligence Technologies in Nuclear Medicine. WJR 2022, 14, 151–154. [Google Scholar] [CrossRef]
- Bonardel, G.; Dupont, A.; Decazes, P.; Queneau, M.; Modzelewski, R.; Coulot, J.; Le Calvez, N.; Hapdey, S. Clinical and Phantom Validation of a Deep Learning Based Denoising Algorithm for F-18-FDG PET Images from Lower Detection Counting in Comparison with the Standard Acquisition. EJNMMI Phys. 2022, 9, 36. [Google Scholar] [CrossRef]
- Nensa, F.; Demircioglu, A.; Rischpler, C. Artificial Intelligence in Nuclear Medicine. J. Nucl. Med. 2019, 60, 29S–37S. [Google Scholar] [CrossRef] [PubMed]
- Li, Y.; Zhang, K.; Shi, W.; Miao, Y.; Jiang, Z. A Novel Medical Image Denoising Method Based on Conditional Generative Adversarial Network. Comput. Math. Methods Med. 2021, 2021, 9974017. [Google Scholar] [CrossRef] [PubMed]
- Gondara, L. Medical Image Denoising Using Convolutional Denoising Autoencoders. In Proceedings of the 2016 IEEE 16th International Conference on Data Mining Workshops (ICDMW), Barcelona, Spain, 12–15 December 2016; pp. 241–246. [Google Scholar]
- Nazir, N.; Sarwar, A.; Saini, B.S. Recent Developments in Denoising Medical Images Using Deep Learning: An Overview of Models, Techniques, and Challenges. Micron 2024, 180, 103615. [Google Scholar] [CrossRef] [PubMed]
- European Parliament and Council of the European Union. Regulation (EU) 2016/679 (General Data Protection Regulation, GDPR); Official Journal of the European Union: Luxembourg, 2016.
- Gholizadeh-Ansari, M.; Alirezaie, J.; Babyn, P. Deep Learning for Low-Dose CT Denoising. arXiv 2019, arXiv:1902.10127. [Google Scholar]
- Hu, Z.; Li, Q.; Zhang, Q.; Wu, G. Representation of Block-Based Image Features in a Multi-Scale Framework for Built-Up Area Detection. Remote Sens. 2016, 8, 155. [Google Scholar] [CrossRef]
- Szegedy, C.; Liu, W.; Jia, Y.; Sermanet, P.; Reed, S.; Anguelov, D.; Erhan, D.; Vanhoucke, V.; Rabinovich, A. Going Deeper with Convolutions. In Proceedings of the IEEE Conference on Computer Vision and Pattern Recognition, Columbus, OH, USA, 23–28 June 2014. [Google Scholar]
- Niu, Z.; Zhong, G.; Yu, H. A Review on the Attention Mechanism of Deep Learning. Neurocomputing 2021, 452, 48–62. [Google Scholar] [CrossRef]
- Springenberg, J.T.; Dosovitskiy, A.; Brox, T.; Riedmiller, M. Striving for Simplicity: The All Convolutional Net. arXiv 2014, arXiv:1412.6806. [Google Scholar]
- Howard, A.G.; Zhu, M.; Chen, B.; Kalenichenko, D.; Wang, W.; Weyand, T.; Andreetto, M.; Adam, H. MobileNets: Efficient Convolutional Neural Networks for Mobile Vision Applications. arXiv 2017, arXiv:1704.04861. [Google Scholar]
- He, K.; Zhang, X.; Ren, S.; Sun, J. Deep Residual Learning for Image Recognition. In Proceedings of the 2016 IEEE Conference on Computer Vision and Pattern Recognition (CVPR), Las Vegas, NV, USA, 27–30 June 2016; pp. 770–778. [Google Scholar]
- Yi, X.; Walia, E.; Babyn, P. Generative Adversarial Network in Medical Imaging: A Review. Med. Image Anal. 2019, 58, 101552. [Google Scholar] [CrossRef]
- Creswell, A.; White, T.; Dumoulin, V.; Arulkumaran, K.; Sengupta, B.; Bharath, A.A. Generative Adversarial Networks: An Overview. IEEE Signal Process. Mag. 2018, 35, 53–65. [Google Scholar] [CrossRef]
- Vaswani, A.; Shazeer, N.; Parmar, N.; Uszkoreit, J.; Jones, L.; Gomez, A.N.; Kaiser, L.; Polosukhin, I. Attention is All You Need. Adv. Neural Inf. Process. Systems 2017, 30, 5998–6008. [Google Scholar]
- Ronneberger, O.; Fischer, P.; Brox, T. U-Net: Convolutional Networks for Biomedical Image Segmentation; Springer International Publishing: New York, NY, USA, 2015. [Google Scholar]
- Vincent, P.; Larochelle, H.; Lajoie, I.; Bengio, Y.; Manzagol, P.A. Stacked Denoising Autoencoders: Learning Useful Representations in a Deep Network with a Local Denoising Criterion. J. Mach. Learn. Res. 2010, 11, 3371–3408. [Google Scholar]
- Yi, W.; Dong, L.; Liu, M.; Hui, M.; Kong, L.; Zhao, Y. MFAF-Net: Image Dehazing with Multi-Level Features and Adaptive Fusion. Vis. Comput. 2024, 40, 2293–2307. [Google Scholar] [CrossRef]
- Jia, L.; Huang, A.; He, X.; Li, Z.; Liang, J. A Residual Multi-Scale Feature Extraction Network with Hybrid Loss for Low-Dose Computed Tomography Image Denoising. SIViP 2024, 18, 1215–1226. [Google Scholar] [CrossRef]
- Kingma, D.P.; Ba, J. Adam: A Method for Stochastic Optimization. arXiv 2014, arXiv:1412.6980. [Google Scholar]
- Reddi, S.J.; Kale, S.; Kumar, S. On the Convergence of Adam and Beyond. arXiv 2019, arXiv:1904.09237. [Google Scholar]
- Lewkowycz, A.; Bahri, Y.; Dyer, E.; Sohl-Dickstein, J.; Gur-Ari, G. The Large Learning Rate Phase of Deep Learning: The Catapult Mechanism. arXiv 2020, arXiv:2003.02218. [Google Scholar]
- Paszke, A.; Gross, S.; Massa, F.; Lerer, A.; Bradbury, J.; Chanan, G.; Killeen, T.; Lin, Z.; Gimelshein, N.; Antiga, L.; et al. PyTorch: An Imperative Style, High-Performance Deep Learning Library. arXiv 2019, arXiv:1912.01703. [Google Scholar]
- Kimm, H.; Paik, I.; Kimm, H. Performance Comparision of TPU, GPU, CPU on Google Colaboratory Over Distributed Deep Learning. In Proceedings of the 2021 IEEE 14th International Symposium on Embedded Multicore/Many-Core Systems-on-Chip (MCSoC), Singapore, 20–23 December 2021; pp. 312–319. [Google Scholar]
- Sara, U.; Akter, M.; Uddin, M.S. Image Quality Assessment through FSIM, SSIM, MSE and PSNR—A Comparative Study. JCC 2019, 7, 8–18. [Google Scholar] [CrossRef]
- Wang, Z.; Bovik, A.C.; Sheikh, H.R.; Simoncelli, E.P. Image Quality Assessment: From Error Visibility to Structural Similarity. IEEE Trans. Image Process. 2004, 13, 600–612. [Google Scholar] [CrossRef]
- Shrout, P.E.; Fleiss, J.L. Intraclass Correlations: Uses in Assessing Rater Reliability. Psychol. Bull. 1979, 86, 420–428. [Google Scholar] [CrossRef] [PubMed]
- Fan, J.; Madhav, P.; Sainath, P.; Cao, X.; Wu, H.; Nilsen, R.; Budde, A.; Yadava, G.; Thibault, J.-B.; Hsieh, J. Evaluation of Low Contrast Detectability Performance Using Two-Alternative Forced Choice Method on Computed Tomography Dose Reduction Algorithms; Abbey, C.K., Mello-Thoms, C.R., Eds.; SPIE: Bellingham, WA, USA, 2012; p. 83181F. [Google Scholar]
- Haynes, W. Student’s t-Test. In Encyclopedia of Systems Biology; Dubitzky, W., Wolkenhauer, O., Cho, K.-H., Yokota, H., Eds.; Springer: New York, NY, USA, 2013; pp. 2023–2025. ISBN 978-1-4419-9862-0. [Google Scholar]
- Dixon, P.M.; Saint-Maurice, P.F.; Kim, Y.; Hibbing, P.; Bai, Y.; Welk, G.J. A Primer on the Use of Equivalence Testing for Evaluating Measurement Agreement. Med. Sci. Sports Exerc. 2018, 50, 837–845. [Google Scholar] [CrossRef]
- Kovacs, A.; Bukki, T.; Legradi, G.; Meszaros, N.J.; Kovacs, G.Z.; Prajczer, P.; Tamaga, I.; Seress, Z.; Kiszler, G.; Forgacs, A.; et al. Robustness Analysis of Denoising Neural Networks for Bone Scintigraphy. Nucl. Instrum. Methods Phys. Res. Sect. A Accel. Spectrometers Detect. Assoc. Equip. 2022, 1039, 167003. [Google Scholar] [CrossRef]
- Csikos, C.; Barna, S.; Kovács, Á.; Czina, P.; Budai, Á.; Szoliková, M.; Nagy, I.G.; Husztik, B.; Kiszler, G.; Garai, I. AI-Based Noise-Reduction Filter for Whole-Body Planar Bone Scintigraphy Reliably Improves Low-Count Images. Diagnostics 2024, 14, 2686. [Google Scholar] [CrossRef]
- Minarik, D.; Enqvist, O.; Trägårdh, E. Denoising of Scintillation Camera Images Using a Deep Convolutional Neural Network: A Monte Carlo Simulation Approach. J. Nucl. Med. 2020, 61, 298–303. [Google Scholar] [CrossRef] [PubMed]
- Arsénio, M.; Vigário, R.; Mota, A.M. Recovering Image Quality in Low-Dose Pediatric Renal Scintigraphy Using Deep Learning. J. Imaging 2025, 11, 88. [Google Scholar] [CrossRef]
- Ichikawa, S.; Sugimori, H.; Ichijiri, K.; Yoshimura, T.; Nagaki, A. Acquisition Time Reduction in Pediatric99m Tc-DMSA Planar Imaging Using Deep Learning. J. Appl. Clin. Med. Phys. 2023, 24, e13978. [Google Scholar] [CrossRef] [PubMed]
- Ahmad, W.; Ali, H.; Shah, Z.; Azmat, S. A New Generative Adversarial Network for Medical Images Super Resolution. Sci. Rep. 2022, 12, 9533. [Google Scholar] [CrossRef]
- Gong, K.; Guan, J.; Liu, C.-C.; Qi, J. PET Image Denoising Using Deep Neural Network. In Proceedings of the 2017 IEEE Nuclear Science Symposium and Medical Imaging Conference (NSS/MIC), Atlanta, GA, USA, 21–28 October 2017; pp. 1–2. [Google Scholar]
- Xu, J.; Gong, E.; Pauly, J.; Zaharchuk, G. 200x Low-Dose PET Reconstruction Using Deep Learning. arXiv 2017, arXiv:1712.04119. [Google Scholar]
- Kim, K.; Wu, D.; Gong, K.; Dutta, J.; Kim, J.H.; Son, Y.D.; Kim, H.K.; El Fakhri, G.; Li, Q. Penalized PET Reconstruction Using Deep Learning Prior and Local Linear Fitting. IEEE Trans. Med. Imaging 2018, 37, 1478–1487. [Google Scholar] [CrossRef]
- Katsari, K.; Penna, D.; Arena, V.; Polverari, G.; Ianniello, A.; Italiano, D.; Milani, R.; Roncacci, A.; Illing, R.O.; Pelosi, E. Artificial Intelligence for Reduced Dose 18F-FDG PET Examinations: A Real-World Deployment through a Standardized Framework and Business Case Assessment. EJNMMI Phys. 2021, 8, 25. [Google Scholar] [CrossRef] [PubMed]
- Weyts, K.; Lasnon, C.; Ciappuccini, R.; Lequesne, J.; Corroyer-Dulmont, A.; Quak, E.; Clarisse, B.; Roussel, L.; Bardet, S.; Jaudet, C. Artificial Intelligence-Based PET Denoising Could Allow a Two-Fold Reduction in [18F]FDG PET Acquisition Time in Digital PET/CT. Eur. J. Nucl. Med. Mol. Imaging 2022, 49, 3750–3760. [Google Scholar] [CrossRef] [PubMed]


| Criteria | 1 | 2 | 3 | 4 | 5 |
|---|---|---|---|---|---|
| Noise Level | Very high—severe noise, difficult to interpret | High—noticeable noise | Moderate—acceptable noise | Low—minimal noise | Very low—almost no noise |
| Visibility of Key Anatomical Structures | Not visible at all | Poorly visible | Moderately visible | Clearly visible | Perfectly visible |
| Structural Detail Preservation | Severe loss of detail | Moderate loss | Acceptable loss | Well-preserved | Fully preserved |
| Overall Diagnostic Confidence | Not confident at all | Low confidence | Neutral | Confident | Very confident |
| Pelvis | ||||||
|---|---|---|---|---|---|---|
| % Low Dose Image | SSIM (Original) | SSIM (Denoised) | p-Value | PSNR (Original) | PSNR (Denoised) | p-Value |
| 30% | 0.875 | 0.918 | <0.005 | 31.43 | 36.37 | <0.005 |
| 40% | 0.896 | 0.923 | <0.005 | 32.37 | 36.42 | <0.005 |
| 50% | 0.926 | 0.941 | <0.005 | 33.90 | 36.71 | <0.005 |
| 60% | 0.945 | 0.953 | <0.005 | 35.87 | 38.15 | <0.005 |
| 70% | 0.959 | 0.963 | <0.005 | 37.19 | 38.92 | <0.005 |
| 80% | 0.975 | 0.975 | 0.977 | 38.82 | 40.24 | <0.005 |
| 90% | 0.988 | 0.988 | 0.985 | 42.58 | 42.94 | 0.192 |
| Thorax | ||||||
|---|---|---|---|---|---|---|
| % Low Dose Image | SSIM (Original) | SSIM (Denoised) | p-Value | PSNR (Original) | PSNR (Denoised) | p-Value |
| 30% | 0.852 | 0.894 | <0.005 | 27.75 | 32.56 | <0.005 |
| 40% | 0.889 | 0.915 | <0.005 | 29.48 | 33.44 | <0.005 |
| 50% | 0.917 | 0.932 | <0.005 | 31.29 | 34.45 | <0.005 |
| 60% | 0.938 | 0.946 | <0.005 | 33.25 | 35.67 | <0.005 |
| 70% | 0.953 | 0.957 | <0.005 | 34.33 | 36.08 | <0.005 |
| 80% | 0.973 | 0.973 | 0.977 | 37.28 | 38.37 | <0.005 |
| 90% | 0.988 | 0.988 | 0.982 | 41.01 | 40.93 | 0.769 |
Disclaimer/Publisher’s Note: The statements, opinions and data contained in all publications are solely those of the individual author(s) and contributor(s) and not of MDPI and/or the editor(s). MDPI and/or the editor(s) disclaim responsibility for any injury to people or property resulting from any ideas, methods, instructions or products referred to in the content. |
© 2025 by the authors. Licensee MDPI, Basel, Switzerland. This article is an open access article distributed under the terms and conditions of the Creative Commons Attribution (CC BY) license (https://creativecommons.org/licenses/by/4.0/).
Share and Cite
Bouzianis, N.; Stathopoulos, I.; Valsamaki, P.; Rapti, E.; Trikopani, E.; Apostolidou, V.; Kotini, A.; Zissimopoulos, A.; Adamopoulos, A.; Karavasilis, E. Dose Reduction in Scintigraphic Imaging Through Enhanced Convolutional Autoencoder-Based Denoising. J. Imaging 2025, 11, 197. https://doi.org/10.3390/jimaging11060197
Bouzianis N, Stathopoulos I, Valsamaki P, Rapti E, Trikopani E, Apostolidou V, Kotini A, Zissimopoulos A, Adamopoulos A, Karavasilis E. Dose Reduction in Scintigraphic Imaging Through Enhanced Convolutional Autoencoder-Based Denoising. Journal of Imaging. 2025; 11(6):197. https://doi.org/10.3390/jimaging11060197
Chicago/Turabian StyleBouzianis, Nikolaos, Ioannis Stathopoulos, Pipitsa Valsamaki, Efthymia Rapti, Ekaterini Trikopani, Vasiliki Apostolidou, Athanasia Kotini, Athanasios Zissimopoulos, Adam Adamopoulos, and Efstratios Karavasilis. 2025. "Dose Reduction in Scintigraphic Imaging Through Enhanced Convolutional Autoencoder-Based Denoising" Journal of Imaging 11, no. 6: 197. https://doi.org/10.3390/jimaging11060197
APA StyleBouzianis, N., Stathopoulos, I., Valsamaki, P., Rapti, E., Trikopani, E., Apostolidou, V., Kotini, A., Zissimopoulos, A., Adamopoulos, A., & Karavasilis, E. (2025). Dose Reduction in Scintigraphic Imaging Through Enhanced Convolutional Autoencoder-Based Denoising. Journal of Imaging, 11(6), 197. https://doi.org/10.3390/jimaging11060197