
SADiff: Coronary Artery Segmentation in CT Angiography Using Spatial Attention and Diffusion Model


Abstract
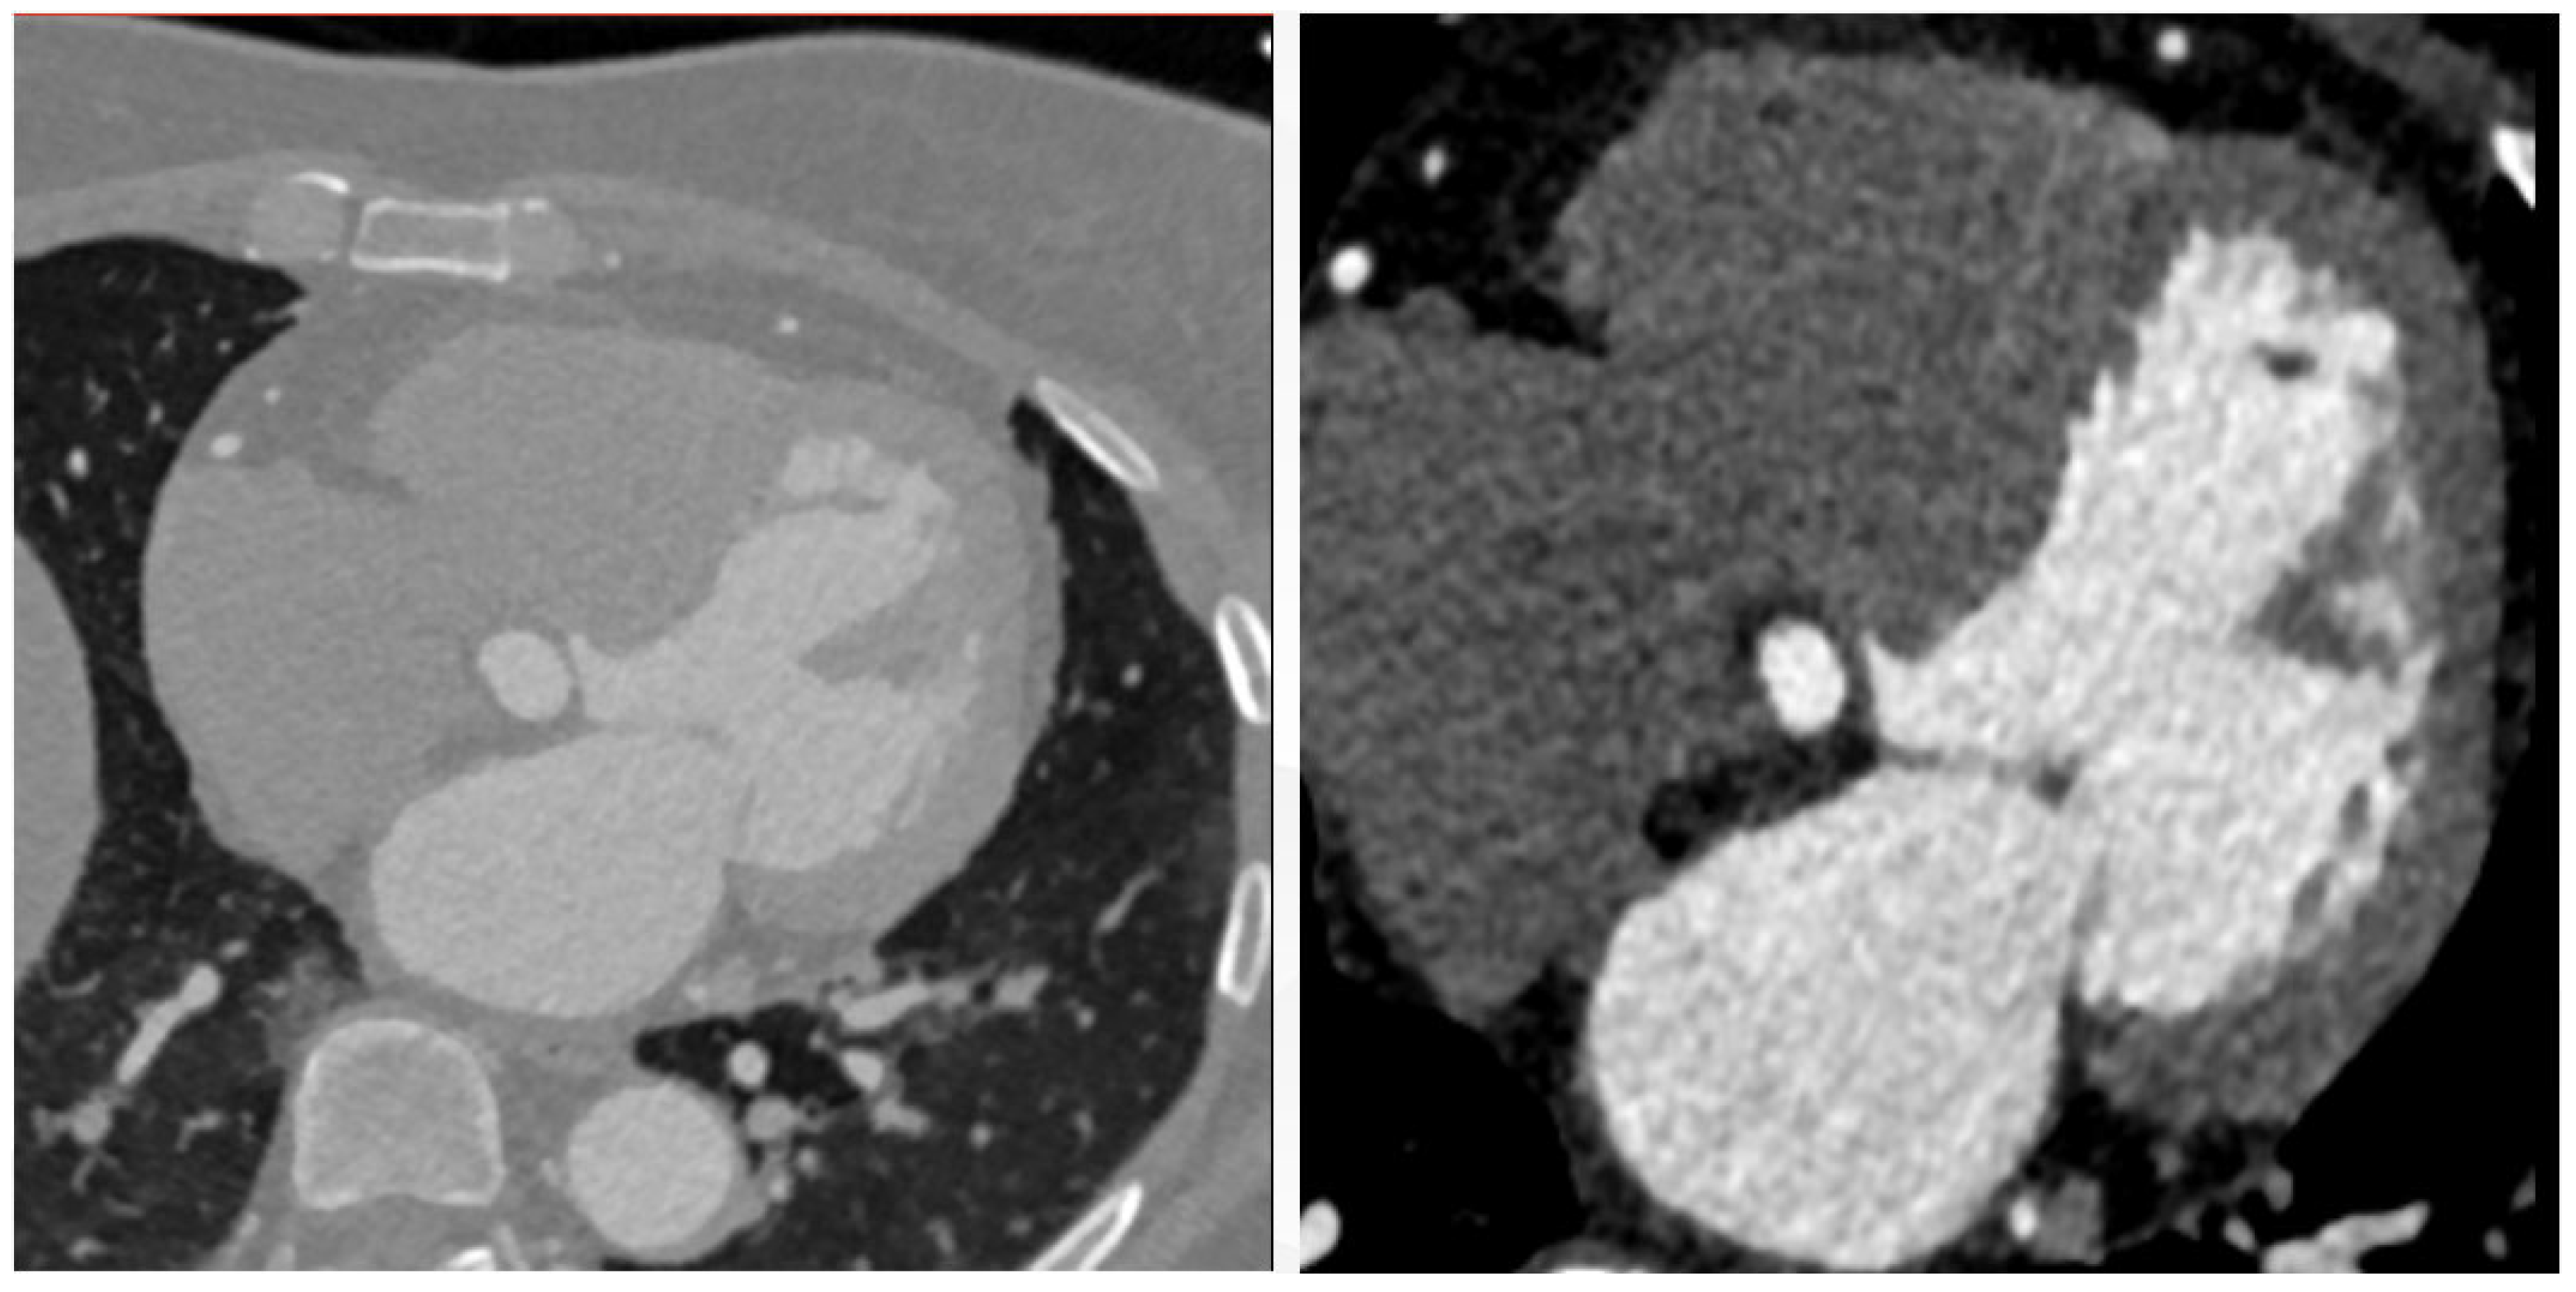
1. Introduction
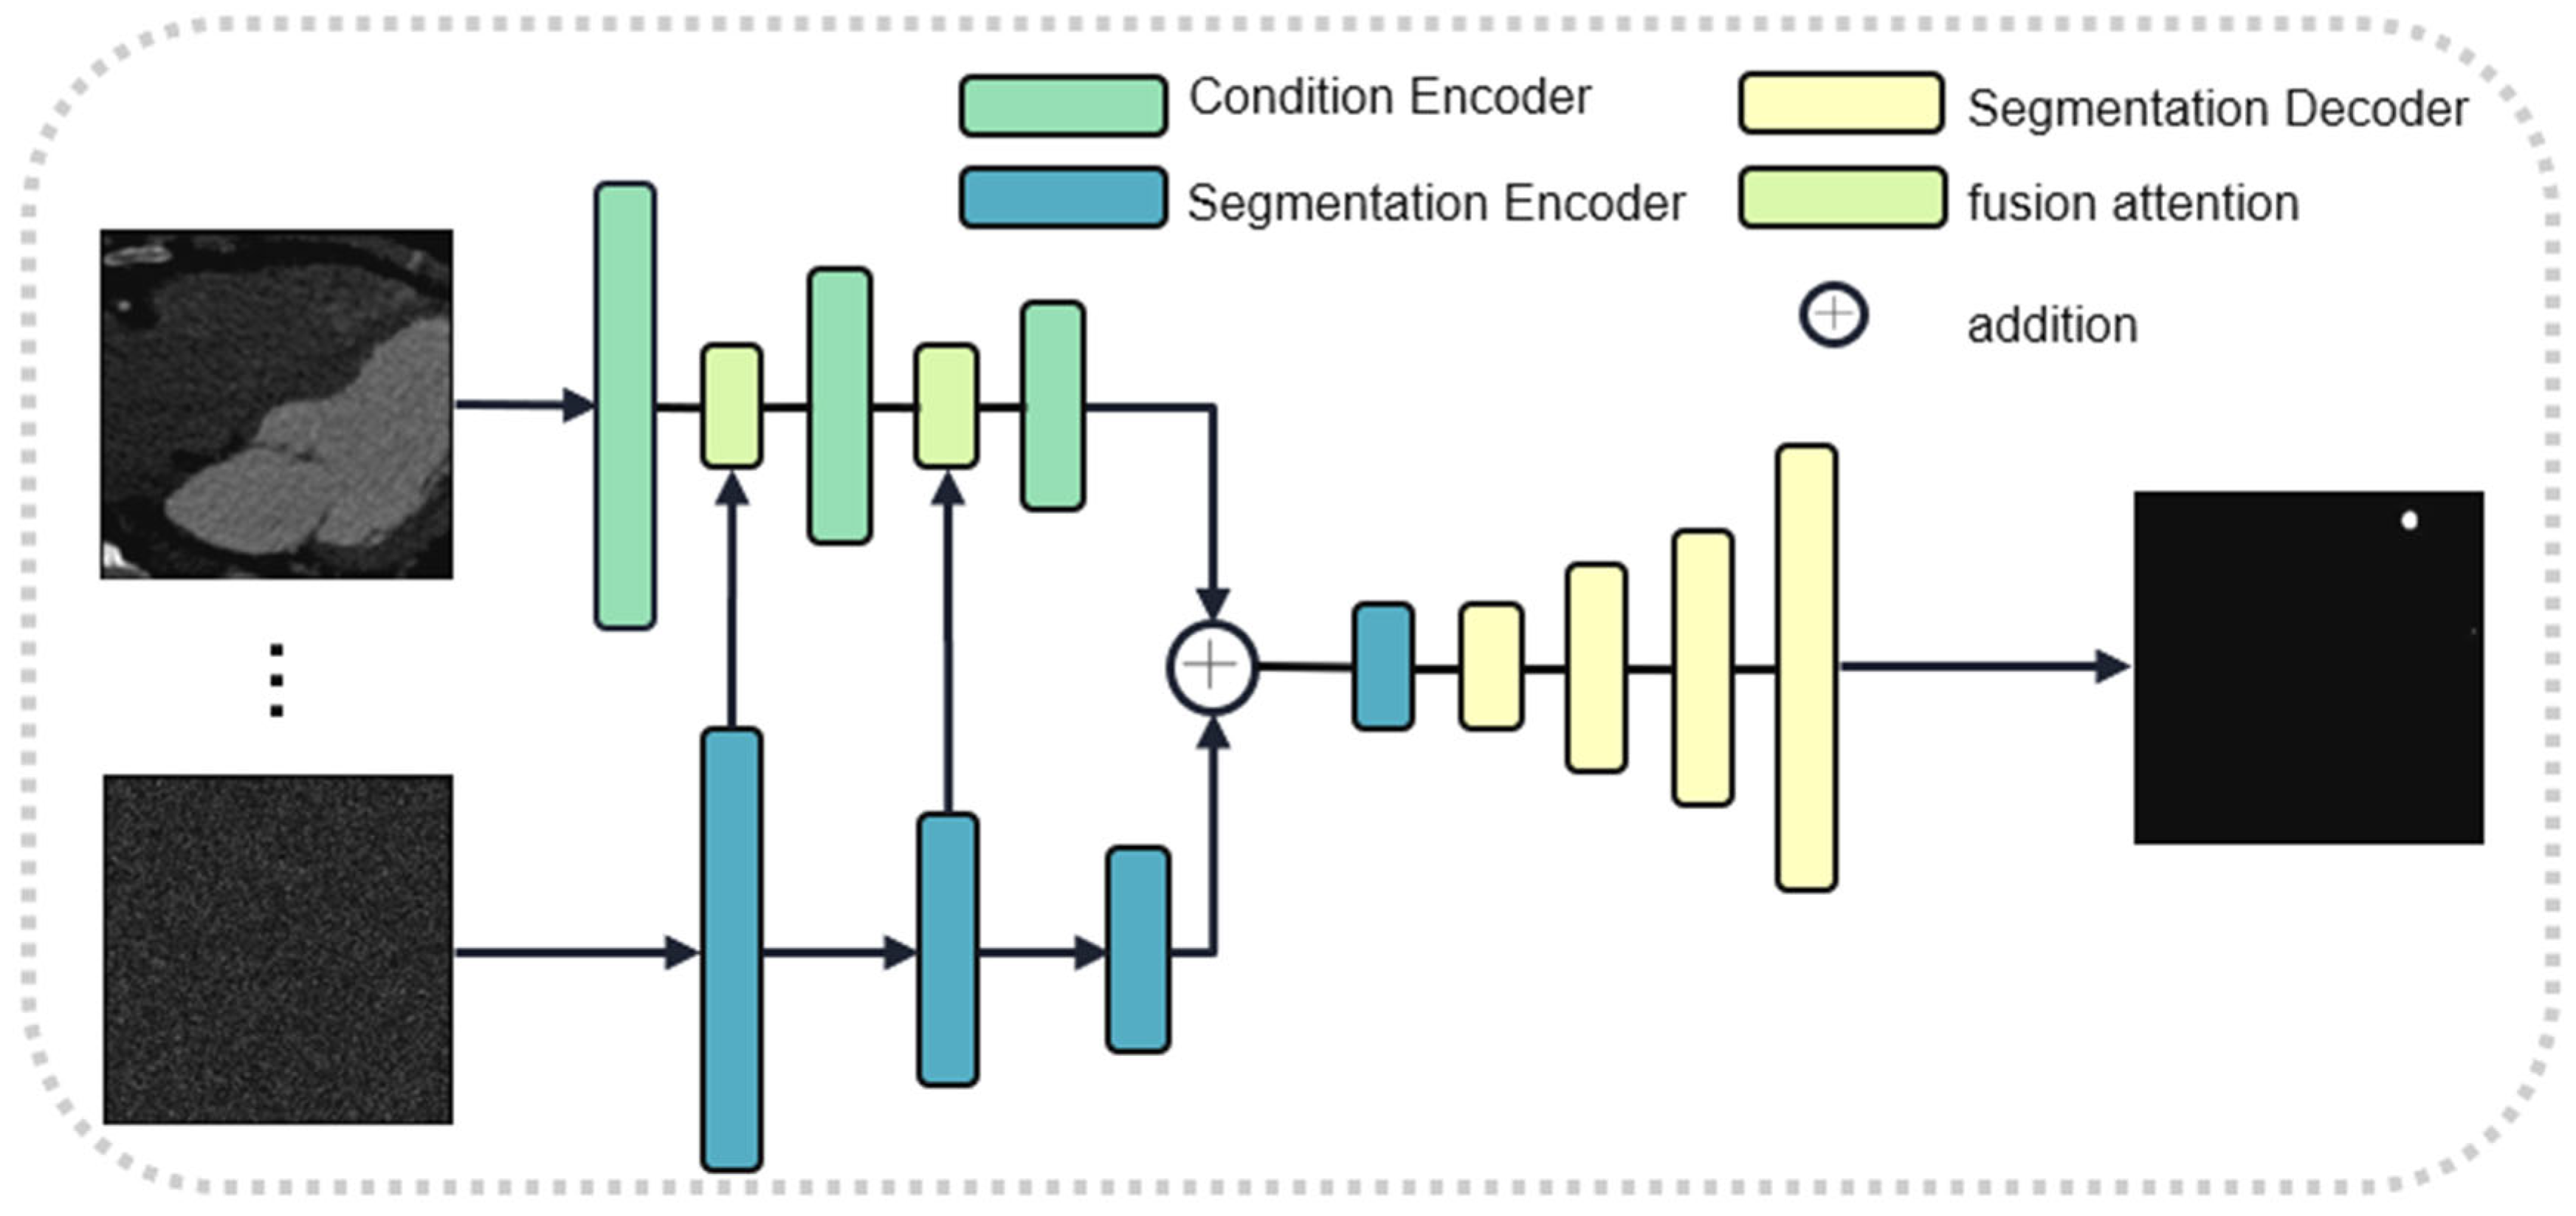
- We propose a novel cascade coronary segmentation model, amalgamating both generative and discriminative networks. The DAN extracts coronary ROI information and 3D information. The accuracy of extracted 2D information is improved by introducing diffusion model learning. The SAN refines the segmentation based on 3D and 2D information and finally obtains excellent results.
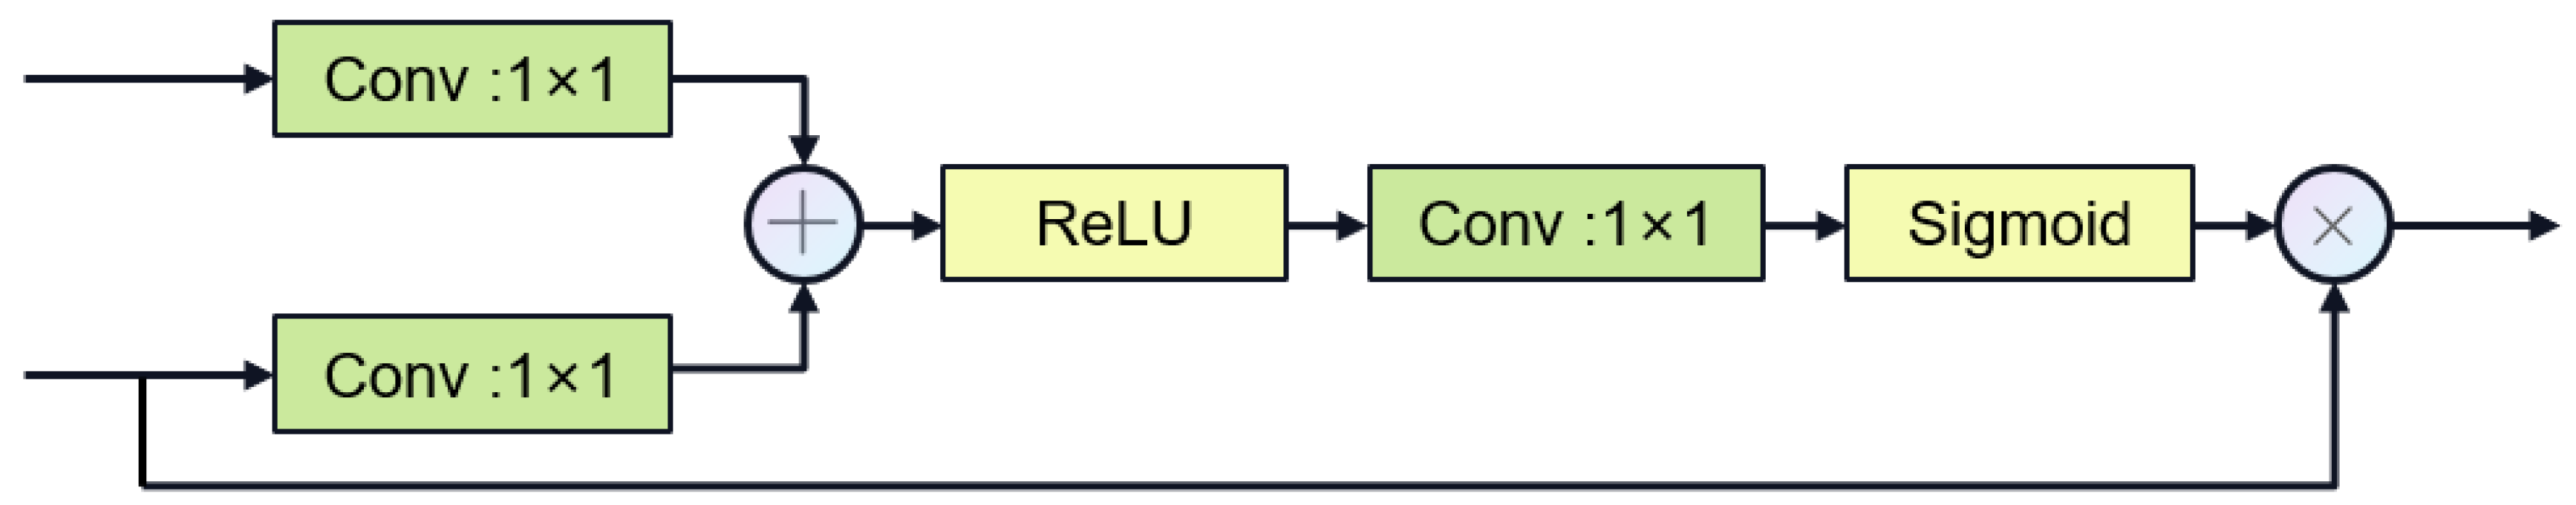
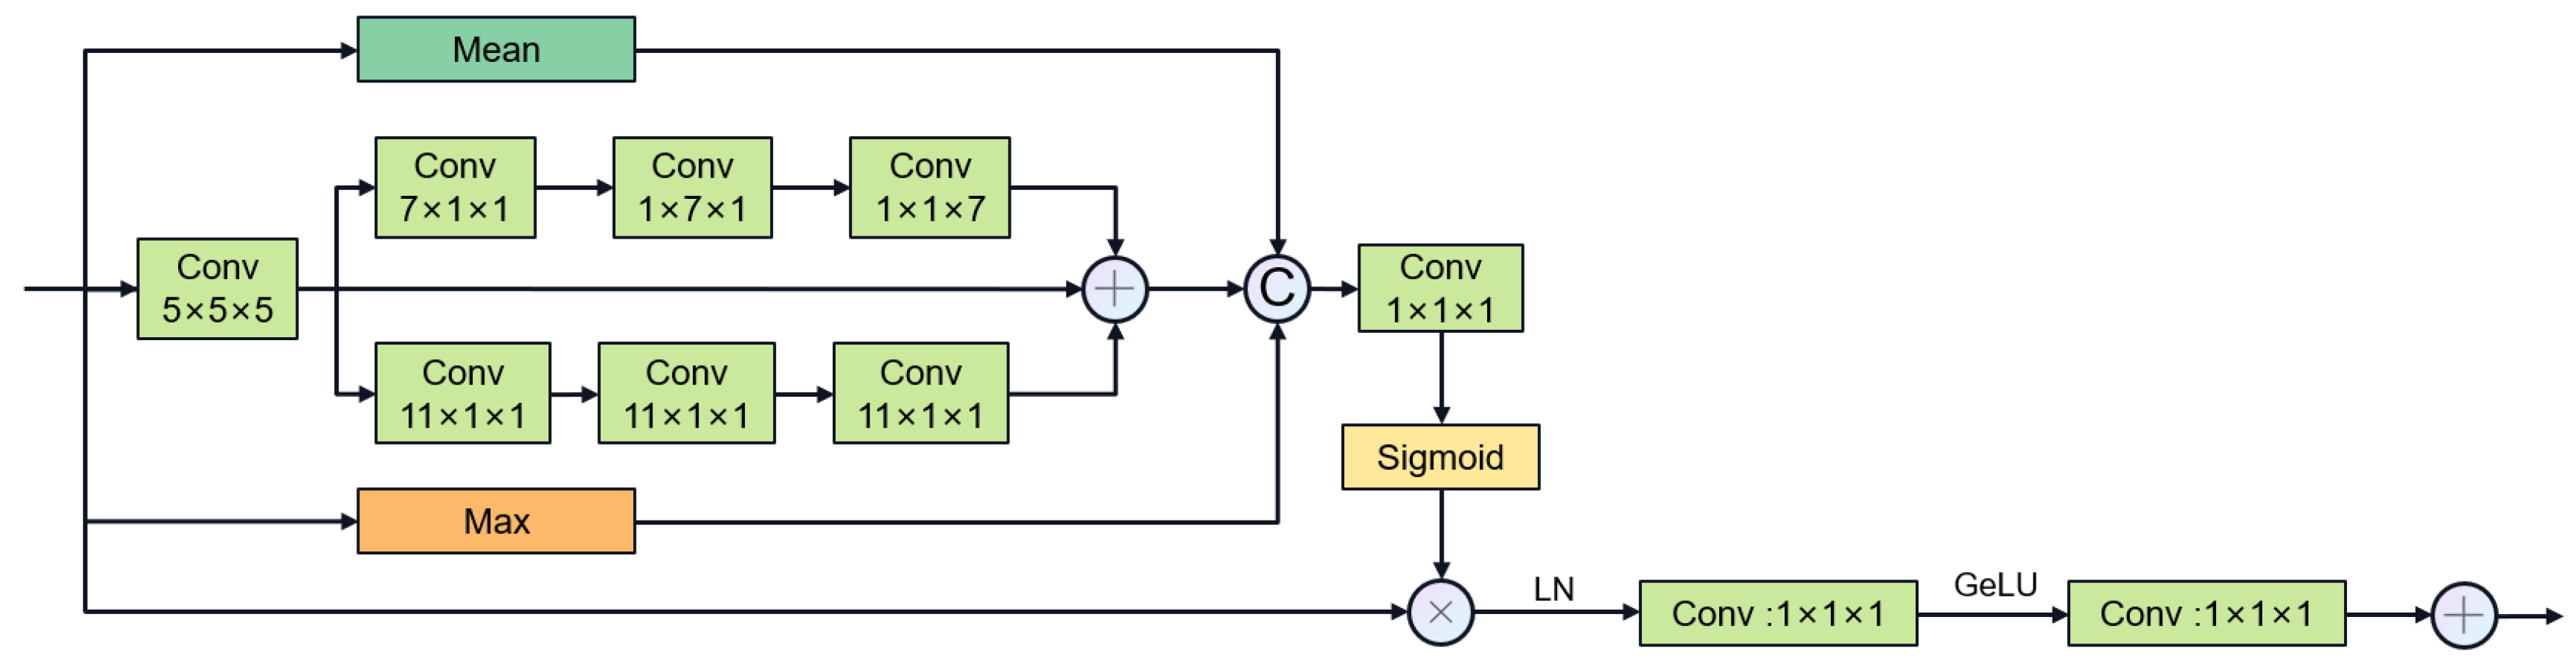
- The SAN tackles the semantic gap in encoder–decoder frameworks through a tubular-structure-specific encoder-feature fusion-decoder architecture. To enhance the model’s ability to capture multi-scale information, we introduce a novel multi-stage gated attention mechanism within the SAN.
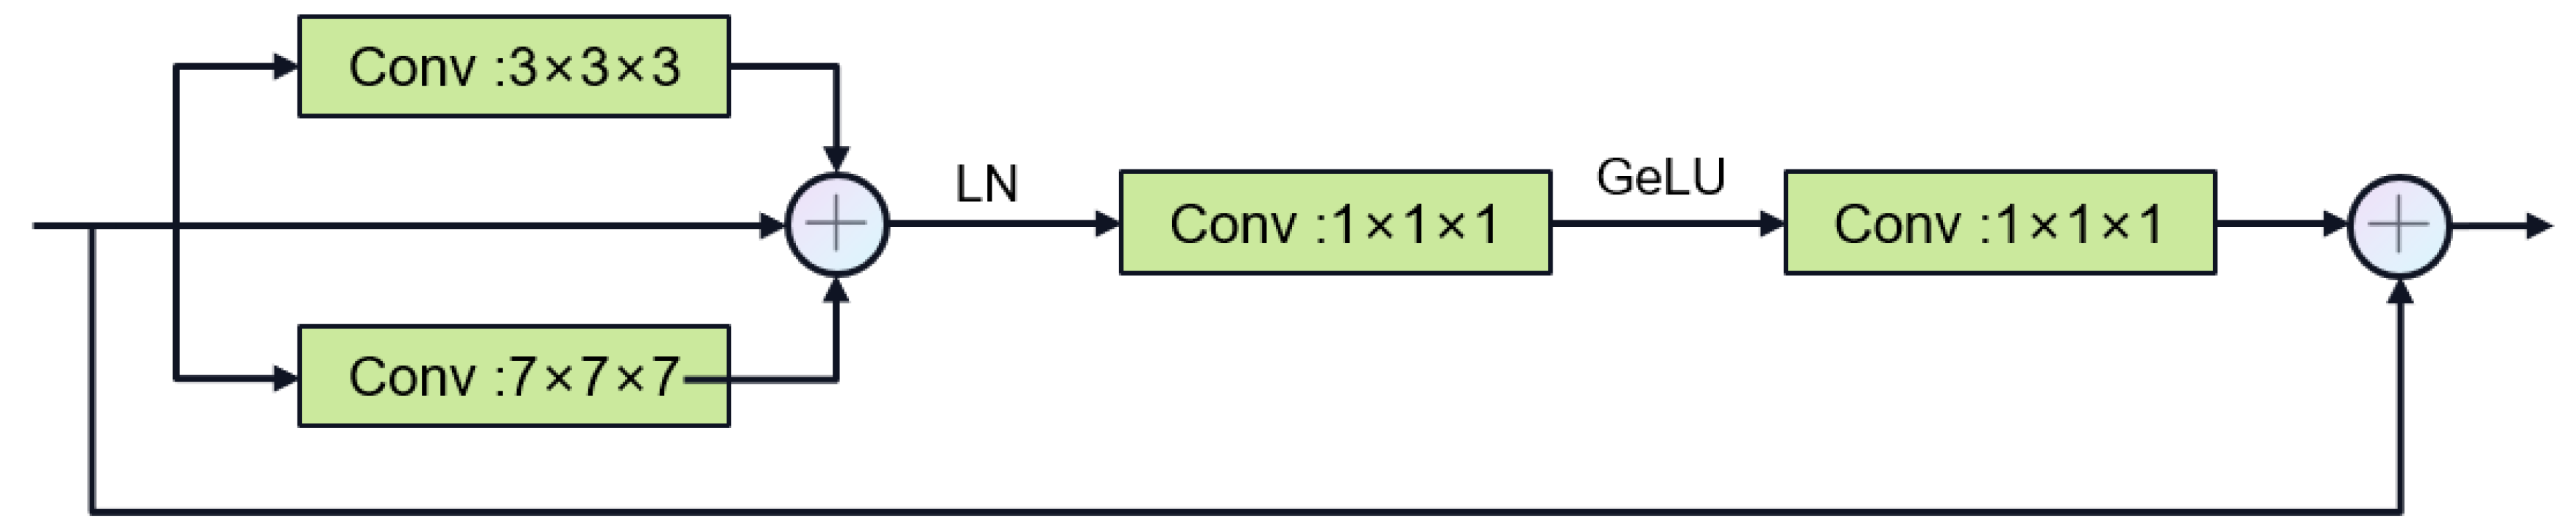
- We propose two plug-and-play mechanisms for spatial attention. The first expands the receptive field through dilated convolution, allowing for the rapid retrieval of coronary voxel information. The second takes into account both global and local features through strip convolution, with a particular focus on capturing the tubular features of coronary arteries.
- The dual dataset experiments with the public dataset ImageCAS (Dice = 83.48%) and the private dataset ImageLaPP (Dice = 79.42%) verified the advantages of the model in noise robustness and cross-center generalization, and its performance is significantly better than that of the mainstream methods, such as U-Net3D, TransU-Net, etc., which provides a reliable solution for the clinical automation segmentation.
2. Related Works
2.1. Cardiac Coronary Artery Segmentation
2.2. Diffusion Model
2.3. U-Net Improvements
2.4. Large Kernel Convolution
3. Our Framework/Coronary Artery Segmentation in CCTA with a Diffusion Model and Spatial Attention
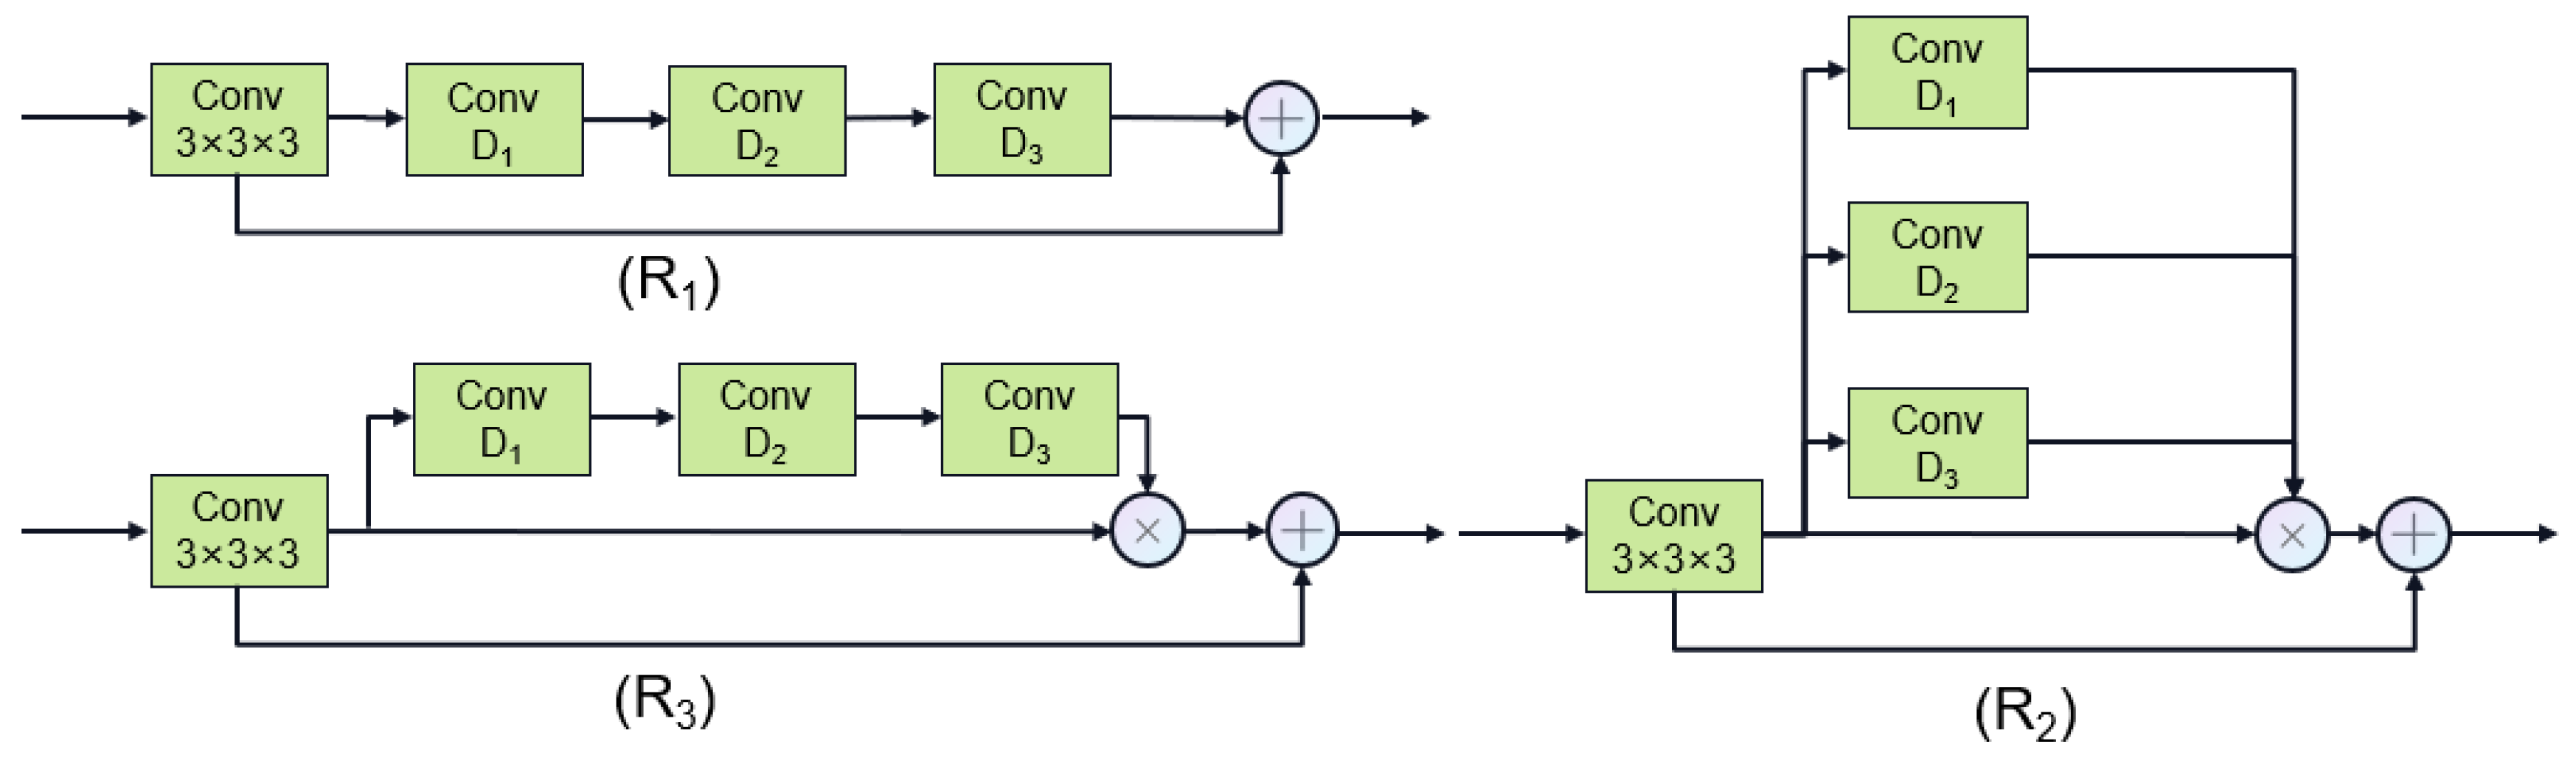
3.1. Dilated Attention Network (DAN)
3.2. Segmentation Network
3.2.1. Generative Subnet
3.2.2. Discriminant Subnet
4. Experimental Result and Analysis
4.1. Datasets and Preprocessing
4.2. Parameter Setting
4.3. Evaluation Indicators
4.4. Comparative Experiment
4.4.1. Quantitative Results
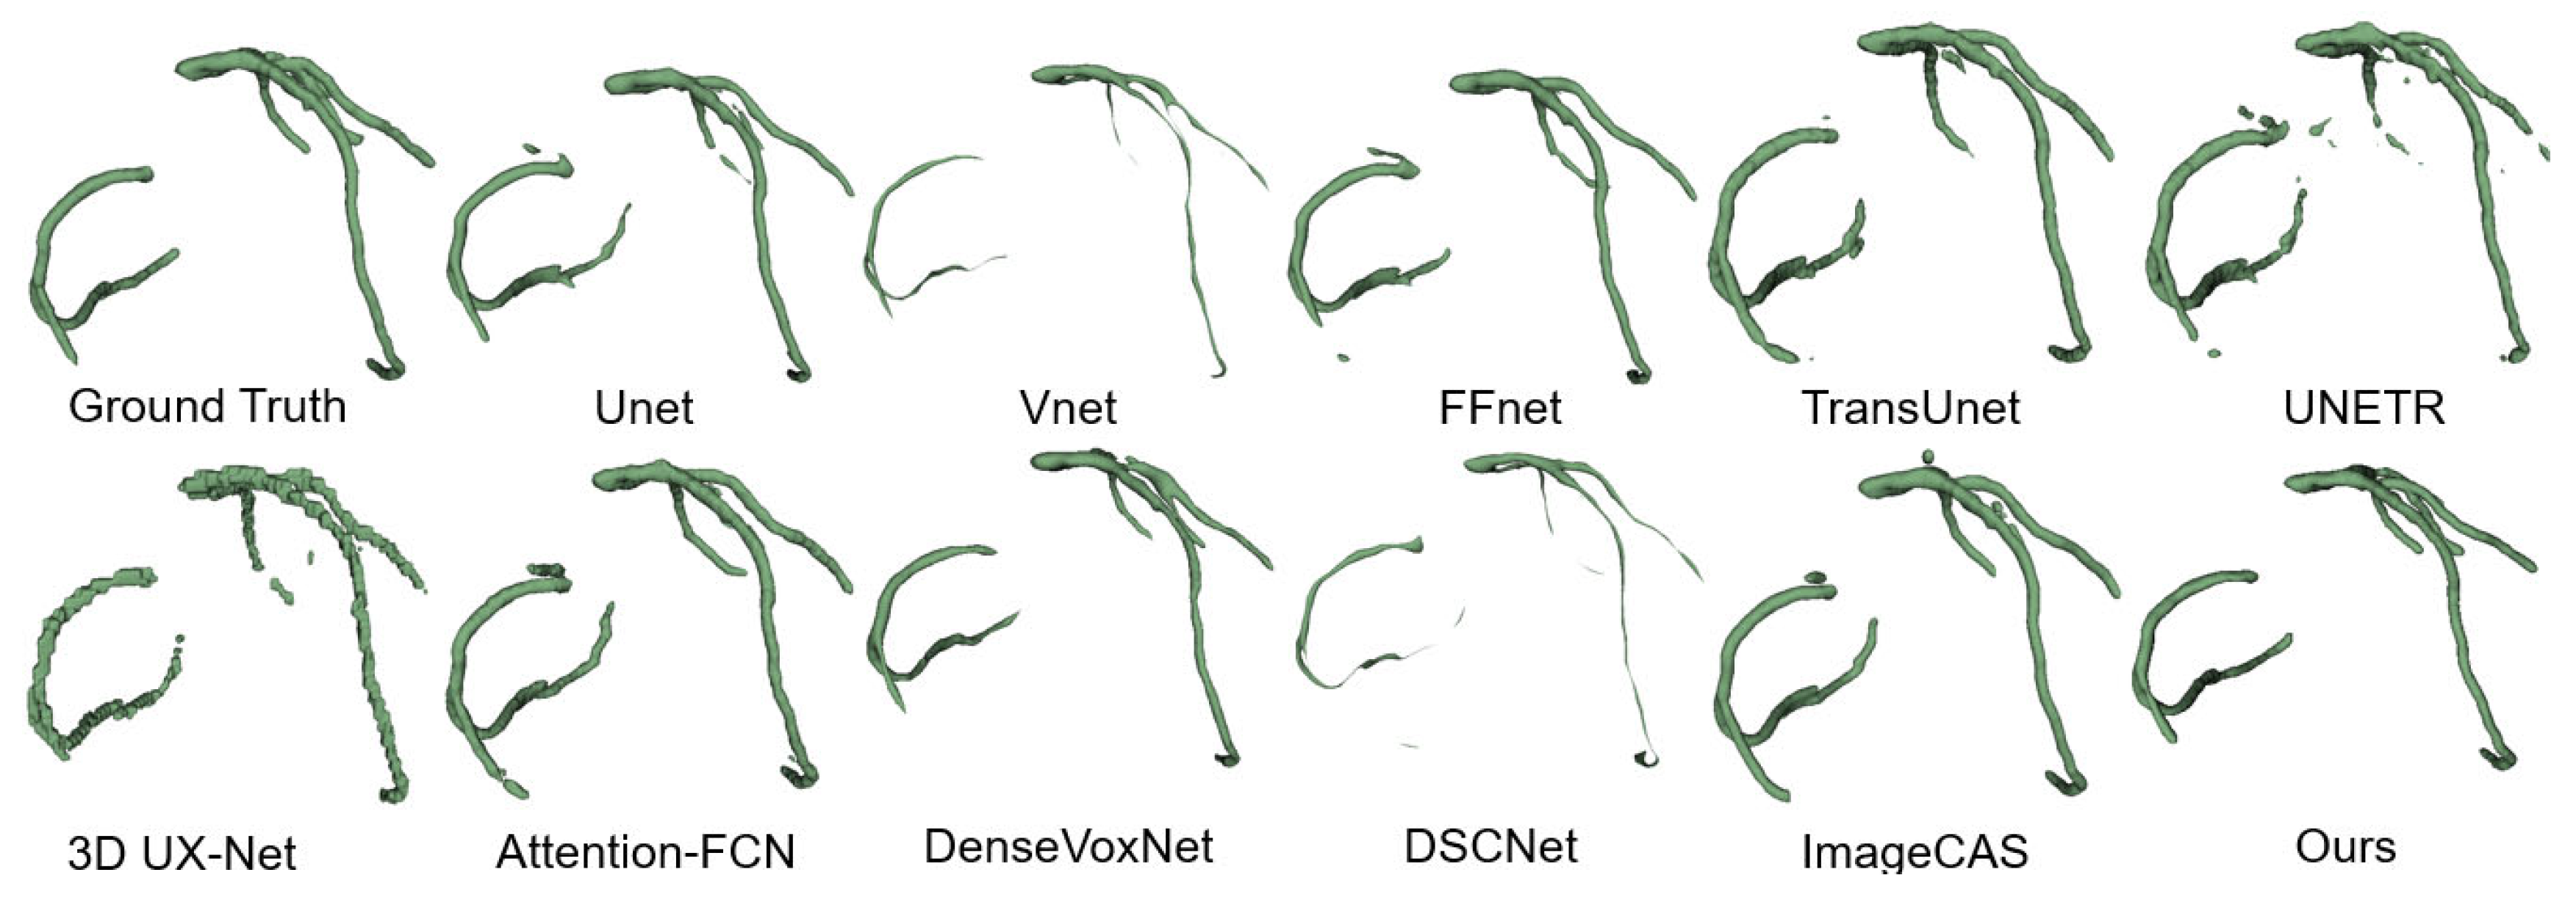
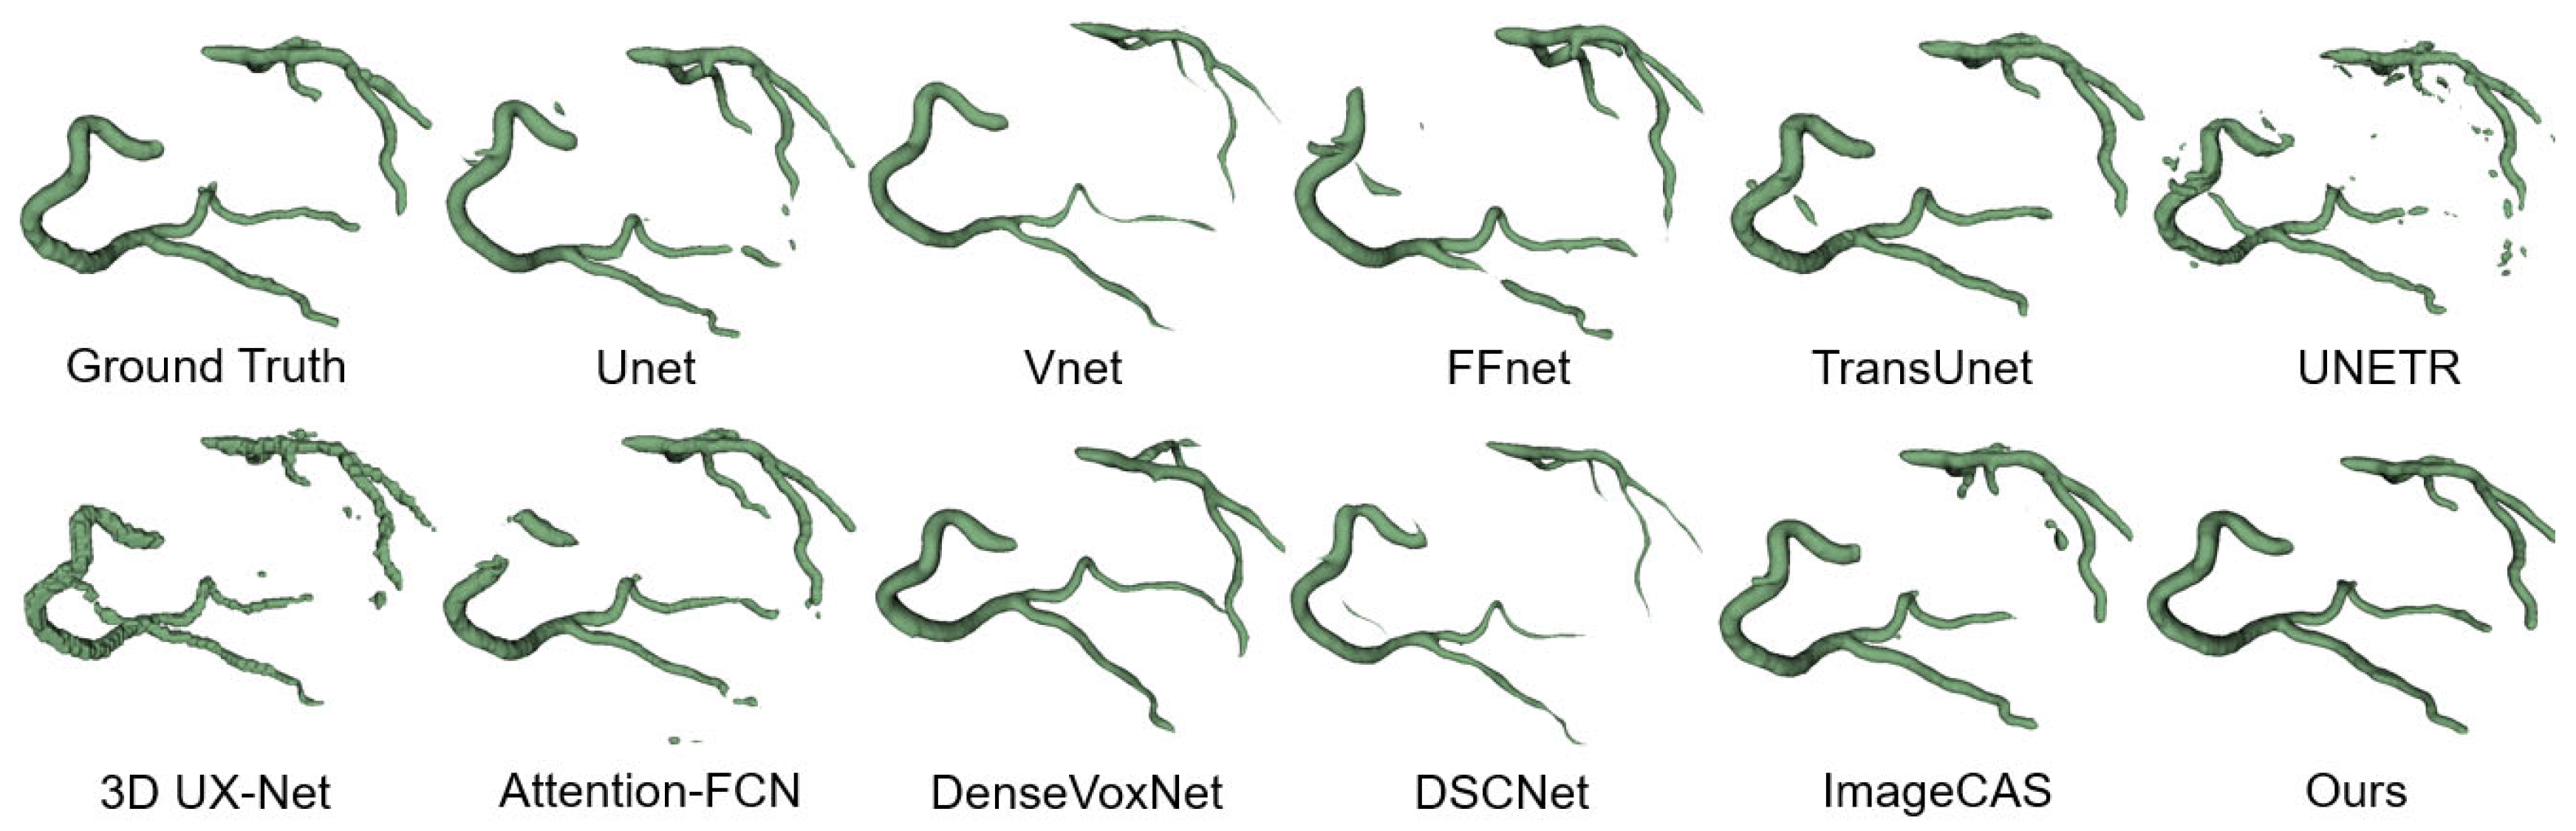
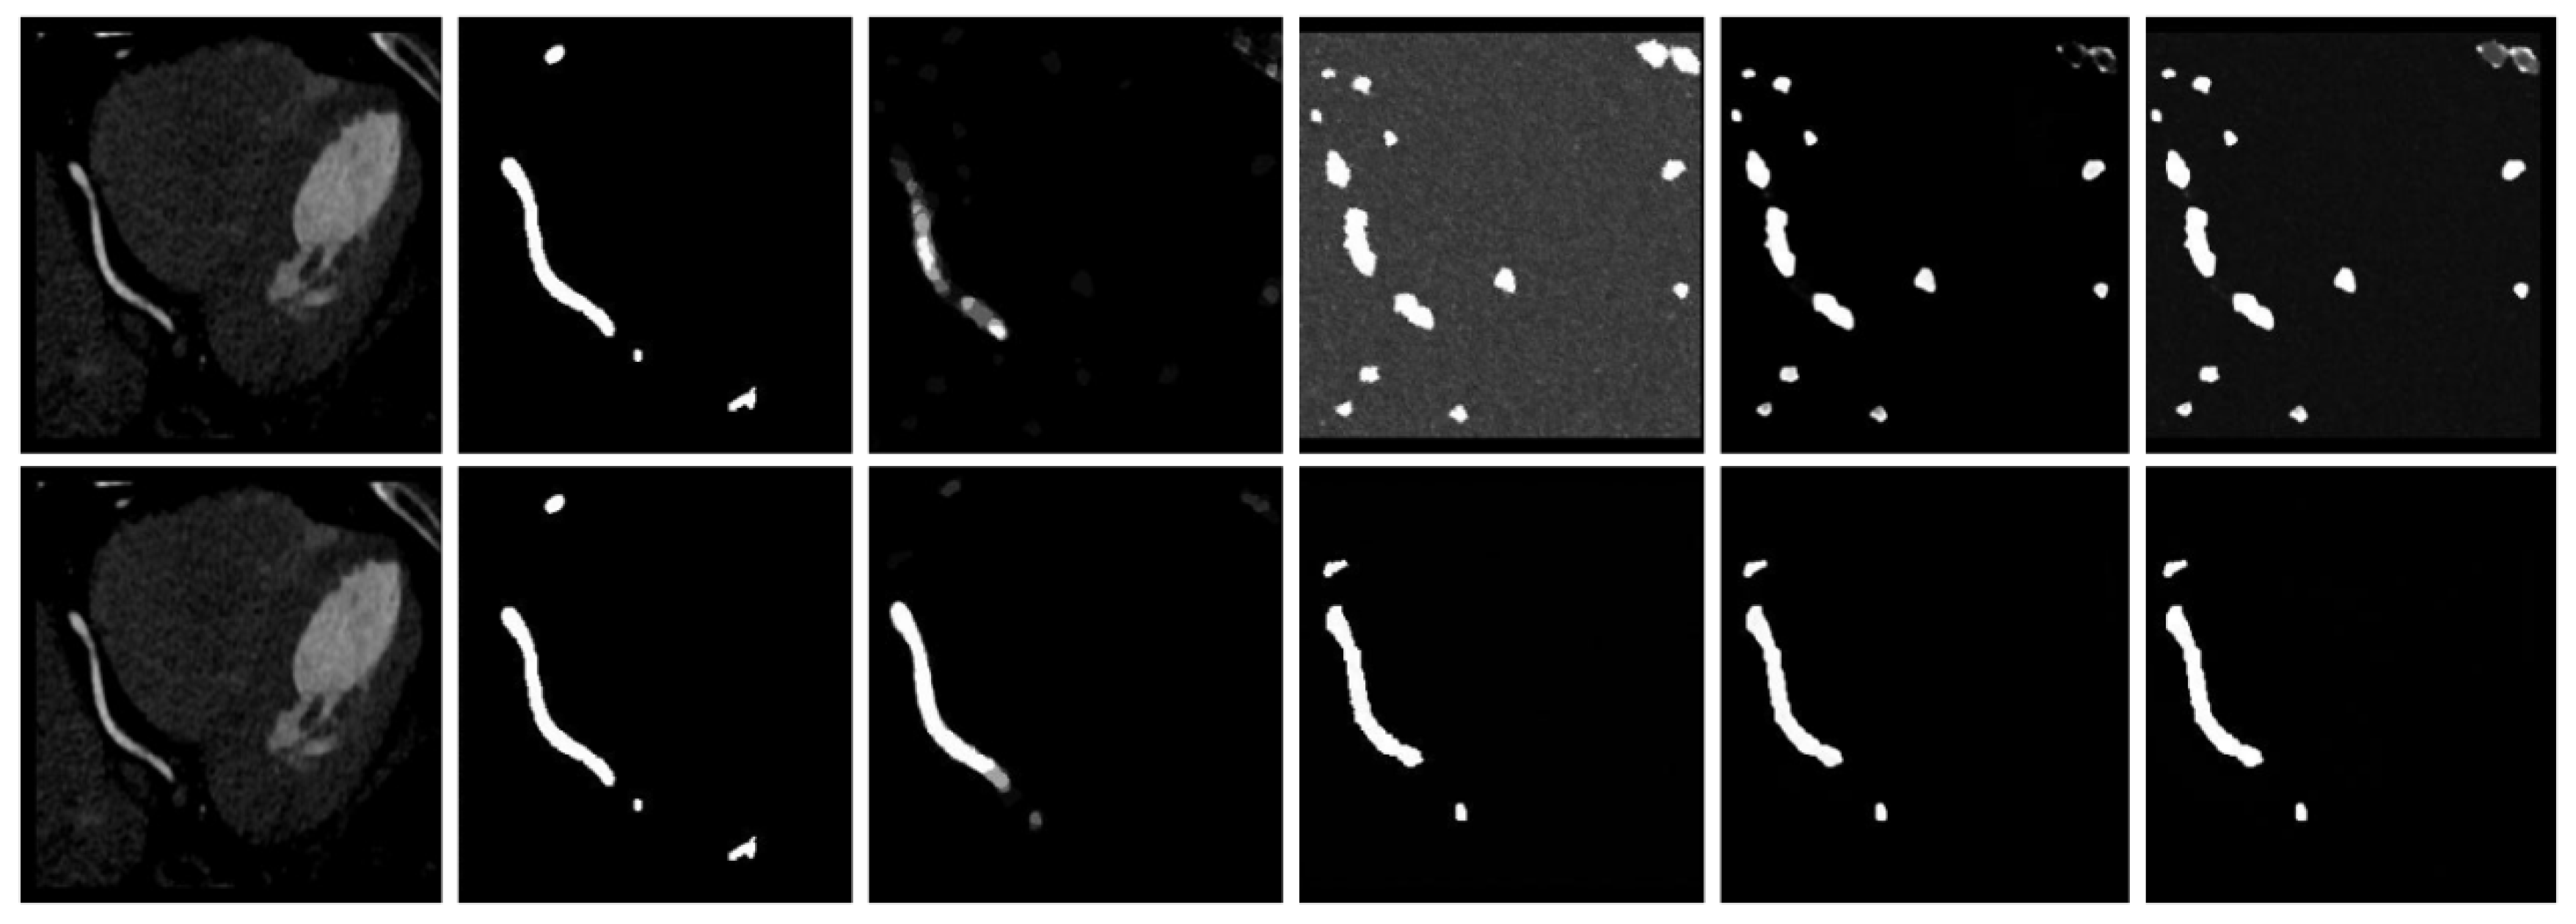
4.4.2. Qualitative Results
4.5. Generalization Experiment
4.6. Ablation Studies
4.6.1. DAN
4.6.2. Diffusion Model
4.6.3. SAN
4.7. Clinical Translation of Metrics
5. Discussion and Conclusions
Author Contributions
Funding
Institutional Review Board Statement
Informed Consent Statement
Data Availability Statement
Conflicts of Interest
References
- Safiri, S.; Karamzad, N.; Singh, K.; Carson-Chahhoud, K.; Adams, C.; Nejadghaderi, S.A.; Almasi-Hashiani, A.; Sullman, M.J.M.; Mansournia, M.A.; Bragazzi, N.L.; et al. Burden of ischemic heart disease and its attributable risk factors in 204 countries and territories, 1990–2019. Eur. J. Prev. Cardiol. 2022, 29, 420–431. [Google Scholar] [CrossRef] [PubMed]
- Ko, B.S.; Cameron, J.D.; Munnur, R.K.; Wong, D.T.L.; Fujisawa, Y.; Sakaguchi, T.; Hirohata, K.; Hislop-Jambrich, J.; Fujimoto, S.; Takamura, K.; et al. Noninvasive CT-derived FFR based on structural and fluid analysis: A comparison with invasive FFR for detection of functionally significant stenosis. JACC Cardiovasc. Imaging 2017, 10, 663–673. [Google Scholar] [PubMed]
- Azad, R.; Aghdam, E.K.; Rauland, A.; Jia, Y.; Avval, A.H.; Pour, A.B.; Jafarbigloo, S.K.; Cohen, J.P.; Adeli, E.; Merhof, D. Medical image segmentation review: The success of u-net. IEEE Trans. Pattern Anal. Mach. Intell. 2024, 46, 10076–10095. [Google Scholar] [CrossRef] [PubMed]
- Chen, J.; Lu, Y.; Yu, Q.; Luo, X.; Adeli, E.; Wang, Y.; Lu, L.; Yuille, A.L.; Zhou, Y. Transunet: Transformers make strong encoders for medical image segmentation. arXiv 2021, arXiv:2102.04306. [Google Scholar]
- Oktay, O.; Schlemper, J.; Folgoc, L.L.; Lee, M.; Heinrich, M.; Misawa, K.; Mori, K.; McDonagh, S.; Hammerla N., Y.; Kainz, B.; et al. Attention u-net: Learning where to look for the pancreas. arXiv 2018, arXiv:1804.03999. [Google Scholar]
- Han, K.; Wang, Y.; Chen, H.; Chen, X.; Guo, J.; Liu, Z.; Tang, Y.; Xiao, A.; Xu, C.; Xu, Y.; et al. A Survey on Transformer Compression. arXiv 2024, arXiv:2402.05964. [Google Scholar]
- Shen, Y.; Fang, Z.; Gao, Y.; Xiong, N.; Zhong, C.; Tang, X. Coronary arteries segmentation based on 3D FCN with attention gate and level set function. IEEE Access 2019, 7, 42826–42835. [Google Scholar] [CrossRef]
- Pan, L.-S.; Li, C.W.; Su, S.F.; Tay, S.Y.; Tran, Q.V.; Chan, W.P. Coronary artery segmentation under class imbalance using a U-Net based architecture on computed tomography angiography images. Sci. Rep. 2021, 11, 14493. [Google Scholar] [CrossRef]
- Harms, J.; Lei, Y.; Tian, S.; McCall, N.S.; Higgins, K.A.; Bradley, J.D.; Curran, W.J.; Liu, T.; Yang, X. Automatic delineation of cardiac substructures using a region-based fully convolutional network. Med. Phys. 2021, 48, 2867–2876. [Google Scholar] [CrossRef]
- Ren, S.; He, K.; Girshick, R.; Sun, J. Faster R-CNN: Towards Real-Time Object Detection with Region Proposal Networks. Adv. Neural Inf. Process. Syst. 2015, 28. [Google Scholar] [CrossRef]
- Huang, C.; Yin, C. A coronary artery CTA segmentation approach based on deep learning. J. X-Ray Sci. Technol. 2022, 30, 245–259. [Google Scholar] [CrossRef] [PubMed]
- Dong, C.; Xu, S.; Li, Z. A novel end-to-end deep learning solution for coronary artery segmentation from CCTA. Med. Phys. 2022, 49, 6945–6959. [Google Scholar] [CrossRef] [PubMed]
- Zhang, H.; Zhang, W.; Shen, W.; Li, N.; Chen, Y.J.; Li, S.; Chen, B.; Guo, S.J.; Wang, Y.Q. Automatic segmentation of the cardiac MR images based on nested fully convolutional dense network with dilated convolution. Biomed. Signal Process. Control 2021, 68, 102684. [Google Scholar] [CrossRef]
- Sun, S.; Tian, Y.; Qi, Z.; Wu, Y.; Gao, W.Z.; Wu, Y.H. Two-stage training strategy combined with neural network for segmentation of internal mammary artery graft. Biomed. Signal Process. Control 2023, 80, 104278. [Google Scholar] [CrossRef]
- Dong, C.; Xu, S.; Dai, D.; Zhang, Y.; Zhang, C.; Li, Z. A novel multi-attention, multi-scale 3D deep network for coronary artery segmentation. Med. Image Anal. 2023, 85, 102745. [Google Scholar] [CrossRef]
- Zeng, A.; Wu, C.; Huang, M.; Zhuang, J.; Bi, S.; Pan, D.; Ullah, N.; Khan, K.N.; Wang, T.; Shi, Y. ImageCAS: A Large-Scale Dataset and Benchmark for Coronary Artery Segmentation based on Computed Tomography Angiography Images. arXiv 2022, arXiv:2211.01607. [Google Scholar] [CrossRef]
- Qi, Y.; He, Y.; Qi, X.; Zhang, Y.; Yang, G. Dynamic Snake Convolution based on Topological Geometric Constraints for Tubular Structure Segmentation. arXiv 2023, arXiv:2307.08388. [Google Scholar]
- Ho, J.; Jain, A.; Abbeel, P. Denoising diffusion probabilistic models. Adv. Neural Inf. Process. Syst. 2020, 33, 6840–6851. [Google Scholar]
- Baranchuk, D.; Rubachev, I.; Voynov, A.; Khrulkov, V.; Babenko, A. Label-efficient semantic segmentation with diffusion models. arXiv 2021, arXiv:2112.03126. [Google Scholar]
- Amit, T.; Shaharbany, T.; Nachmani, E.; Wolf, L. Segdiff: Image segmentation with diffusion probabilistic models. arXiv 2021, arXiv:2112.00390. [Google Scholar]
- Rahman, A.; Valanarasu, J.M.J.; Hacihaliloglu, I.; Patel, V.M. Ambiguous medical image segmentation using diffusion models. In Proceedings of the IEEE/CVF Conference on Computer Vision and Pattern Recognition, Vancouver, BC, Canada, 17–24 June 2023; pp. 11536–11546. [Google Scholar]
- Wu, J.; Fu, R.; Fang, H.; Zhang, Y.; Yang, Y.; Xiong, H.; Liu, H.; Xu, Y. Medsegdiff: Medical image segmentation with diffusion probabilistic model. arXiv 2022, arXiv:2211.00611. [Google Scholar]
- Zou, J.; Zhu, Z.; Ye, Y.; Wang, X. DiffBEV: Conditional Diffusion Model for Bird’s Eye View Perception. arXiv 2023, arXiv:2303.08333. [Google Scholar] [CrossRef]
- Feng, C.M. Enhancing Label-efficient Medical Image Segmentation with Text-guided Diffusion Models. In Proceedings of the International Conference on Medical Image Computing and Computer-Assisted Intervention, Marrakech, Morocco, 6–10 October 2024; Springer Nature: Cham, Switzerland, 2024; pp. 253–262. [Google Scholar]
- Ronneberger, O.; Fischer, P.; Brox, T. U-net: Convolutional networks for biomedical image segmentation. In Proceedings of the Medical Image Computing and Computer-Assisted Intervention—MICCAI 2015: 18th International Conference, Munich, Germany, 5–9 October 2015; Proceedings, Part III 18. Springer International Publishing: Berlin/Heidelberg, Germany, 2015; pp. 234–241. [Google Scholar]
- Vaswani, A.; Shazeer, N.; Parmar, N.; Uszkoreit, J.; Jones, L.; Gomez, A.N.; Kaiser, L.; Polosukhin, I. Attention is all you need. Adv. Neural Inf. Process. Syst. 2017, 30. [Google Scholar] [CrossRef]
- Zhang, C.; Lin, G.; Liu, F.; Yao, R.; Shen, C. Canet: Class-agnostic segmentation networks with iterative refinement and attentive few-shot learning. In Proceedings of the IEEE/CVF Conference on Computer Vision and Pattern Recognition, Long Beach, CA, USA, 15–20 June 2019; pp. 5217–5226. [Google Scholar]
- Hatamizadeh, A.; Tang, Y.; Nath, V.; Yang, D.; Myronenko, A.; Landman, B.; Roth, H.; Xu, D. Unetr: Transformers for 3d medical image segmentation. In Proceedings of the IEEE/CVF Winter Conference on Applications of Computer Vision, Waikoloa, HI, USA, 3–8 January 2022; pp. 574–584. [Google Scholar]
- Liu, Z.; Lin, Y.; Cao, Y.; Hu, H.; Wei, Y.; Zhang, Z. Swin transformer: Hierarchical vision transformer using shifted windows. In Proceedings of the IEEE/CVF International Conference on Computer Vision, Montreal, BC, Canada, 11–17 October 2021; pp. 10012–10022. [Google Scholar]
- Zhou, Z.; Rahman Siddiquee, M.M.; Tajbakhsh, N.; Liang, J. Unet++: A nested u-net architecture for medical image segmentation. In Proceedings of the Deep Learning in Medical Image Analysis and Multimodal Learning for Clinical Decision Support: 4th International Workshop, DLMIA 2018, and 8th International Workshop, ML-CDS 2018, Held in Conjunction with MICCAI 2018, Granada, Spain, 20 September 2018; Proceedings 4. Springer International Publishing: Berlin/Heidelberg, Germany, 2018; pp. 3–11. [Google Scholar]
- Ibtehaz, N.; Rahman, M.S. MultiResUNet: Rethinking the U-Net architecture for multimodal biomedical image segmentation. Neural Netw. 2020, 121, 74–87. [Google Scholar] [CrossRef]
- Hung, A.L.Y.; Zheng, H.; Miao, Q.; Raman, S.S.; Terzopoulos, D.; Sung, K. CAT-Net: A cross-slice attention transformer model for prostate zonal segmentation in MRI. IEEE Trans. Med. Imaging 2022, 42, 291–303. [Google Scholar] [CrossRef] [PubMed]
- Wang, H.; Cao, P.; Wang, J.; Zaiane, O.R. Uctransnet: Rethinking the skip connections in u-net from a channel-wise perspective with transformer. In Proceedings of the AAAI Conference on Artificial Intelligence, Virtual, 22 February–1 March 2022; Volume 36, pp. 2441–2449. [Google Scholar]
- Wang, J.; Liao, C.; Li, D.; Zhao, Z.; Chen, J.; Yang, K. An Efficient Large Kernel Convolution Network Designed for Neural Processing Unit. Eng. Appl. Artif. Intell. 2025, 142, 109887. [Google Scholar] [CrossRef]
- Liu, Z.; Mao, H.; Wu, C.-Y.; Feichtenhofer, C.; Darrell, T.; Xie, S. A convnet for the 2020s. In Proceedings of the IEEE/CVF Conference on Computer Vision and Pattern Recognition, New Orleans, LA, USA, 18–24 June 2022; pp. 11976–11986. [Google Scholar]
- Xiao, Z.; Cai, D.; Dong, Z.; Xiao, Y.; Shi, Y.; Liu, K. CNXA: A Novel Attention Mechanism Aided Convolution Network. In Proceedings of the 2022 IEEE 8th International Conference on Cloud Computing and Intelligent Systems (CCIS), Chengdu, China, 26–28 November 2022; IEEE: Piscataway, NJ, USA, 2022; pp. 227–233. [Google Scholar]
- Shen, W.H.; Xu, W.B.; Zhang, H.Y.; Sun, Z.X.; Ma, J.X.; Ma, X.L.; Zhou, S.J.; Guo, S.J.; Wang, Y.Q. Automatic segmentation of the femur and tibia bones from X-ray images based on pure dilated residual U-Net. Inverse Probl. Imaging 2020, 15, 1333–1346. [Google Scholar] [CrossRef]
- Ding, X.; Zhang, X.; Han, J.; Ding, G. Scaling up your kernels to 31×31: Revisiting large kernel design in cnns. In Proceedings of the IEEE/CVF Conference on Computer Vision and Pattern Recognition, New Orleans, LA, USA, 18–24 June 2022; pp. 11963–11975. [Google Scholar]
- Chen, Y.; Liu, J.; Zhang, X.; Qi, X.; Jia, J. LargeKernel3D: Scaling Up Kernels in 3D Sparse CNNs. In Proceedings of the IEEE/CVF Conference on Computer Vision and Pattern Recognition, Vancouver, BC, Canada, 17–24 June 2023; pp. 13488–13498. [Google Scholar]
- Li, H.; Nan, Y.; Yang, G. LKAU-Net: 3D large-kernel attention-based u-net for automatic MRI brain tumor segmentation. In Proceedings of the Annual Conference on Medical Image Understanding and Analysis, Cambridge, UK, 27–29 July 2022; Springer International Publishing: Cham, Switzerland, 2022; pp. 313–327. [Google Scholar]
- Guo, M.H.; Lu, C.Z.; Hou, Q.B.; Liu, Z.N.; Cheng, M.M.; Hu, S.M. Segnext: Rethinking convolutional attention design for semantic segmentation. Adv. Neural Inf. Process. Syst. 2022, 35, 1140–1156. [Google Scholar]
- Liu, S.W.; Chen, T.L.; Chen, X.H.; Chen, X.X.; Xiao, Q.; Wu, B.Q.; Kärkkäinen, T.; Pechenizkiy, M.; Mocanu, D.; Wang, Z.Y. More convnets in the 2020s: Scaling up kernels beyond 51×51 using sparsity. arXiv 2022, arXiv:2207.03620. [Google Scholar]
- Jafari, M.; Auer, D.; Francis, S.; Garibaldi, J.; Chen, X. DRU-Net: An efficient deep convolutional neural network for medical image segmentation. In Proceedings of the 2020 IEEE 17th International Symposium on Biomedical Imaging (ISBI), Iowa City, IA, USA, 3–7 April 2020; IEEE: Piscataway, NJ, USA, 2020; pp. 1144–1148. [Google Scholar]
- Ulhaq, A.; Akhtar, N.; Pogrebna, G. Efficient Diffusion Models for Vision: A Survey. arXiv 2022. [Google Scholar] [CrossRef]
- Cao, H.Q.; Tan, C.; Gao, Z.Y.; Xu, Y.L.; Chen, G.Y.; Heng, P.-A.; Li, S.Z. A Survey on Generative Diffusion Model. arXiv 2022. [Google Scholar] [CrossRef]
- Bieder, F.; Wolleb, J.; Durrer, A.; Sandkühler, R.; Cattin, P. Memory-Efficient 3D Denoising Diffusion Models for Medical Image Processing. In Proceedings of the Medical Imaging with Deep Learning, Nashville, TN, USA, 10–12 July 2023. [Google Scholar]
- Mehta, D.; Skliar, A.; Ben Yahia, H.; Borse, S.; Porikli, F.; Habibian, A.; Blankevoort, T. Simple and Efficient Architectures for Semantic Segmentation. In Proceedings of the IEEE/CVF Conference on Computer Vision and Pattern Recognition, New Orleans, LA, USA, 18–24 June 2022; pp. 2628–2636. [Google Scholar]
- Wang, Q.; Li, B.; Xiao, T.; Zhu, J.; Li, C.; Wong, D.F.; Chao, L.S. Learning deep transformer models for machine translation. arXiv 2019, arXiv:1906.01787.49. [Google Scholar]
- Wang, Q.L.; Wu, B.G.; Zhu, P.F.; Li, P.H.; Zuo, W.M.; Hu, Q.H. ECA-Net: Efficient channel attention for deep convolutional neural networks. In Proceedings of the IEEE/CVF Conference on Computer Vision and Pattern Recognition, Seattle, WA, USA, 14–19 June 2020; pp. 11534–11542. [Google Scholar]
- Wang, W.; Xia, Q.; Yan, Z.; Hu, Z.; Chen, Y.; Zheng, W.; Wang, X.; Nie, S.; Metaxas, D.; Zhang, S. AVDNet: Joint coronary artery and vein segmentation with topological consistency. Med. Image Anal. 2023, 91, 102999. [Google Scholar] [CrossRef]
- Lin, T.Y.; Goyal, P.; Girshick, R.; He, K.; Dollár, P. Focal loss for dense object detection. In Proceedings of the IEEE International Conference on Computer Vision, Venice, Italy, 22–29 October 2017; pp. 2980–2988. [Google Scholar]
- Roth, G.A.; Mensah, G.A.; Fuster, V. The global burden of cardiovascular diseases and risks: A compass for global action. J. Am. Coll. Cardiol. 2020, 76, 2980–2981. [Google Scholar] [CrossRef] [PubMed]
- Chen, Y.-C.; Lin, Y.-C.; Wang, C.-P.; Lee, C.-Y.; Lee, W.-J.; Wang, T.-D.; Chen, C.-M. Coronary artery segmentation in cardiac ct angiography using 3d multi-channel u-net. arXiv 2019, arXiv:1907.12246. [Google Scholar]
- Milletari, F.; Navab, N.; Ahmadi, S.A. V-Net: Fully Convolutional Neural Networks for Volumetric Medical Image Segmentation. In Proceedings of the 2016 Fourth International Conference on 3D Vision (3DV), Stanford, CA, USA, 25–28 October 2016; IEEE: Piscataway, NJ, USA, 2016. [Google Scholar]
- Lee, H.H.; Bao, S.X.; Huo, Y.K.; Landman, B.A. 3D UX-Net: A Large Kernel Volumetric ConvNet Modernizing Hierarchical Transformer for Medical Image Segmentation. arXiv 2022, arXiv:2209.15076. [Google Scholar]
- Yu, L.Q.; Cheng, J.Z.; Dou, Q.; Yang, X.; Chen, H.; Qin, J.; Heng, P.A. Automatic 3D cardiovascular MR segmentation with densely-connected volumetric convnets. In Proceedings of the Medical Image Computing and Computer-Assisted Intervention—MICCAI 2017: 20th International Conference, Quebec City, QC, Canada, 11–13 September 2017; Proceedings, Part II 20. Springer International Publishing: Berlin/Heidelberg, Germany, 2017; pp. 287–295. [Google Scholar]
- Kirillov, A.; Mintun, E.; Ravi, N.; Mao, H.; Rolland, C.; Gustafson, L.; Xiao, T.; Whitehead, S.; Berg, A.C.; Lo, W.Y. Segment anything. arXiv 2023, arXiv:2304.02643. [Google Scholar]


| Method | Input Size | |||
|---|---|---|---|---|
| 3D U-Net | 256 × 256 × 128 | 76.91 | 34.2554 | 0.6704 |
| Vnet | 256 × 256 × 128 | 75.31 | 27.5506 | 0.6798 |
| FFnet | 256 × 256 × 128 | 76.87 | 20.5529 | 0.6231 |
| TransU-Net | 256 × 256 × 128 | 76.12 | 28.5101 | 0.9316 |
| UNTER | 256 × 256 × 128 | 77.88 | 41.0667 | 0.9348 |
| 3D UX-Net | 256 × 256 × 128 | 76.16 | 30.1137 | 0.9835 |
| Attention-FCN | 256 × 256 × 128 | 76.05 | 26.2148 | 0.7957 |
| DenseVoxelNet | 256 × 256 × 128 | 77.72 | 27.2357 | 0.9963 |
| DSCNet | 256 × 256 × 128 | 79.24 | 15.9039 | 0.5069 |
| ImageCAS | 128 × 128 × 64, 163,323,643 | 82.74 | 27.1289 | 0.8381 |
| SADiff | 256 × 256 × 128 256 × 256 | 83.48 | 19.4321 | 0.6007 |
| Method | Input Size | |||
|---|---|---|---|---|
| 3D U-Net | 256 × 256 × 128 | 76.27 | 38.3548 | 0.7784 |
| Vnet | 256 × 256 × 128 | 76.01 | 28.5184 | 0.7412 |
| FFnet | 256 × 256 × 128 | 76.18 | 23.9421 | 0.7764 |
| TransU-Net | 256 × 256 × 128 | 75.33 | 29.5405 | 0.9982 |
| UNTER | 256 × 256 × 128 | 77.86 | 43.7563 | 1.0215 |
| 3D UX-Net | 256 × 256 × 128 | 77.54 | 32.5816 | 0.9754 |
| Attention-FCN | 256 × 256 × 128 | 75.17 | 31.1182 | 0.9457 |
| DenseVoxNet | 256 × 256 × 128 | 76.85 | 27.2357 | 0.8981 |
| DSCNet | 256 × 256 × 128 | 78.71 | 18.2419 | 0.6118 |
| ImageCAS | 128 × 128 × 64, 163,323,643 | 78.87 | 30.5516 | 0.8325 |
| SADiff | 256 × 256 × 128 256 × 256 | 79.42 | 22.6284 | 0.7501 |
| R1 | R2 | R3 | |||
|---|---|---|---|---|---|
| 1,2,3 | 77.96 | 31.1721 | 0.8792 | ||
| 1,2,5 | 77.42 | 31.0834 | 0.9111 | ||
| 1,2,3 | 78.4 | 28.3864 | 0.8013 | ||
| 1,2,5 | 78.26 | 29.2643 | 0.8028 | ||
| 1,2,3 | 78.99 | 27.0866 | 0.7425 | ||
| 1,2,5 | 79.01 | 26.2473 | 0.8329 |
| Step | |||
|---|---|---|---|
| 50 | 80.33 | 45.9501 | 0.9265 |
| 1000 | 81.43 | 30.1126 | 0.8331 |
| FFnet | Multi-Kernel Block | Multi-Stage Gated Attention | Strip Spatial Attention | ||||
|---|---|---|---|---|---|---|---|
| 1 | √ | 81.87 | 26.2366 | 0.8152 | |||
| 2 | √ | √ | 82.01 | 21.5543 | 0.7529 | ||
| 3 | √ | √ | 81.97 | 24.9755 | 0.7966 | ||
| 4 | √ | √ | 82.14 | 21.9588 | 0.7416 | ||
| 5 | √ | √ | √ | 82.18 | 23.1745 | 0.7015 | |
| 6 | √ | √ | √ | 82.24 | 21.3149 | 0.6953 | |
| 7 | √ | √ | √ | 82.89 | 20.4752 | 0.6681 | |
| 8 | √ | √ | √ | √ | 83.48 | 19.4321 | 0.6007 |
| Loss. | |||
|---|---|---|---|
| dice loss | 83.17 | 22.8244 | 0.9521 |
| cldice + dice loss | 83.46 | 21.5993 | 0.7016 |
| focal + dice loss | 83.48 | 19.4321 | 0.6007 |
Disclaimer/Publisher’s Note: The statements, opinions and data contained in all publications are solely those of the individual author(s) and contributor(s) and not of MDPI and/or the editor(s). MDPI and/or the editor(s) disclaim responsibility for any injury to people or property resulting from any ideas, methods, instructions or products referred to in the content. |
© 2025 by the authors. Licensee MDPI, Basel, Switzerland. This article is an open access article distributed under the terms and conditions of the Creative Commons Attribution (CC BY) license (https://creativecommons.org/licenses/by/4.0/).
Share and Cite
Xu, R.; Dai, L.; Wang, J.; Zhang, L.; Wang, Y. SADiff: Coronary Artery Segmentation in CT Angiography Using Spatial Attention and Diffusion Model. J. Imaging 2025, 11, 192. https://doi.org/10.3390/jimaging11060192
Xu R, Dai L, Wang J, Zhang L, Wang Y. SADiff: Coronary Artery Segmentation in CT Angiography Using Spatial Attention and Diffusion Model. Journal of Imaging. 2025; 11(6):192. https://doi.org/10.3390/jimaging11060192
Chicago/Turabian StyleXu, Ruoxuan, Longhui Dai, Jianru Wang, Lei Zhang, and Yuanquan Wang. 2025. "SADiff: Coronary Artery Segmentation in CT Angiography Using Spatial Attention and Diffusion Model" Journal of Imaging 11, no. 6: 192. https://doi.org/10.3390/jimaging11060192
APA StyleXu, R., Dai, L., Wang, J., Zhang, L., & Wang, Y. (2025). SADiff: Coronary Artery Segmentation in CT Angiography Using Spatial Attention and Diffusion Model. Journal of Imaging, 11(6), 192. https://doi.org/10.3390/jimaging11060192