
Establishing Diagnostic Reference Levels for Mammography Digital Breast Tomosynthesis, Contrast Enhance, Implants, Spot Compression, Magnification and Stereotactic Biopsy in Dubai Health Sector


Abstract
1. Introduction
2. Material and Methods
Statistical Analysis
3. Results
3.1. Scan Acquisition Parameters
3.2. Patient Characteristic and Diagnostic Mammograms LDRL
4. Discussion
5. Conclusions
Author Contributions
Funding
Institutional Review Board Statement
Informed Consent Statement
Data Availability Statement
Acknowledgments
Conflicts of Interest
References
- Daskalaki, A.; Bliznakova, K.; Pallikarakis, N. Evaluation of the effect of silicone breast interts on X-ray mammography and breast tomosynthesis images: A monte Carlo simulation study. Phys. Medica 2016, 32, 353–361. [Google Scholar] [CrossRef]
- Sa dos Reis, C.; Gremion, I.; Meystre, N.R. Study of breast implants mammography examinations for identification of suitable image quality criteria. Insights Imaging 2020, 11, 3–11. [Google Scholar] [CrossRef]
- Sharpe, R.E., Jr.; Venkataraman, S.; Phillips, J.; Dialani, V.; Fein-Zachary, V.J.; Prakash, S.; Slanetz, P.J.; Mehta, T.S.; Østerås, B.H.; Martinsen, A.C.T.; et al. Increased cancer detection rate and variations in the recall rate resulting from implementation of 3D digital breast tomosynthesis into a population-based screening program. Radiology 2016, 278, 698–706. [Google Scholar] [CrossRef] [PubMed]
- Conant, E.F.; Beaber, E.F.; Sprague, B.L.; Herschorn, S.D.; Weaver, D.L.; Onega, T.; Tosteson, A.N.A.; McCarthy, A.M.; Poplack, S.P.; Haas, J.S.; et al. Breast cancer screening using tomosynthesis in combination with digital mammography compared to digital mammography alone: A cohort study within the PROSPR consortium. Breast Cancer Res. Treat. 2016, 156, 109–116. [Google Scholar] [CrossRef]
- Alakhras, M.; Bourne, R.; Rickard, M.; Ng, K.H.; Pietrzyk, M.; Brennan, P.C. Digital tomosynthesis: A new future for breast imaging? Clin. Radiol. 2013, 68, e225–e236. [Google Scholar] [CrossRef] [PubMed]
- Asbeutah, A.M.; AlMajran, A.A.; Brindhaban, A.; ASbeutah, S.A. Comparison of radiation doses between diagnostic full-field digital mammography (FFDM) and digital breast tomosynthesis (DBT): A clinical study. J. Med. Radiat. Sci. 2020, 67, 185–192. [Google Scholar] [CrossRef]
- Gennaro, G.; Cozzi, A.; Schiaffino, S.; Sardanelli, F.; Caumo, F. Radiation dose of contrast-enhanced mammography: A two-center prospective comparison. Cancers 2022, 14, 1774. [Google Scholar] [CrossRef] [PubMed]
- Alcantara, R.; Posso, M.; Arenas, N.; Ejarque, B.; Lotti, V.; Besutti, G. Contrast-enhanced mammography-guided biopsy: Technical feasibility and first outcomes. Eur. Radiol. 2023, 33, 417–428. [Google Scholar] [CrossRef]
- Alcantara, R.; Azcona, J.; Pitarch, M.; Arenas, N.; Castells, X.; Milioni, P.; Lotti, V.; Besutti, G. Breast radiation dose with contrast-enhanced mammography-guided biopsy: A retrospective comparison with stereotactic and tomosynthesis guidance. Eur. Radiol. 2024. [Google Scholar] [CrossRef]
- Jochelson, M.S.; Lobbes, M.B. Contrast-enhanced mammography: State of the Art. Radiology 2021, 299, 36–48. [Google Scholar] [CrossRef]
- Nicosia, L.; Bozzini, A.C.; Pesapane, F.; Rotili, A.; Marinucci, I.; Signorelli, G.; Frassoni, S.; Balestreri, N.; Corso, G.; Cassano, E. Breast digital tomosynthesis versus contrast-enhanced mammography: Comparison of diagnostic application and radiation dose in screening setting. Cancer 2023, 15, 2413. [Google Scholar] [CrossRef] [PubMed]
- Hooshmand, S.; Reed, W.M.; Suleiman, M.E.; Brennan, P. Breast-iRRISC: A novel model for predicting the individualized lifetime risk of radiation-induced breast cancer from a single screening event. Br. J Radiol. 2020, 94, 20200734. [Google Scholar] [CrossRef]
- Liu, J.; Zaershenas, A.; Qadir, A.; Wei, Z.; Yang, L.; Fajardo, L.; Suzuki, K.; Qadir, A. Radiation dose reduction in digital breast tomosynthesis (DBT) by means of deep-learning-based supervised image processing. In Medical Imaging 2018: Image Processing; International Society for Optics and Photonics: Bellingham, WA, USA, 2018; Volume 10574, p. 105740F. [Google Scholar] [CrossRef]
- Lee, C.S.; Aminololama-Shakeri, S.; Appleton, C.M. ACR Practice Parameter for the Performance of Screening and Diagnostic Mammography. Revised 2023 (Resolution 10). Available online: https://wiki.radiology.wisc.edu/images/a/a8/SOG_Outreach_ACRattachment.pdf (accessed on 20 February 2025).
- Baek, J.E.; Kang, B.J.; Kim, S.H.; Lee, H.S. Radiation dose affected by mammographic composition and breast size: First application of a radiation dose management system for full-field digital mammography in Korean women. World J. Surg. Oncol. 2017, 15, 38. [Google Scholar] [CrossRef] [PubMed]
- Liu, Q.; Suleimani, M.E.; McEntee, F.M.; Soh, B.P. Diagnostic reference levels in digital mammography: A systematic review. J. Radiol. Prot. 2020, 42, 011503. [Google Scholar] [CrossRef]
- Dalah, E.Z.; Alkaabi, M.K.; Ai-Awadhi, H.M.; Antony, N.A. Screening mammography diagnostic reference level system according to compressed breast thickness: Dubai Health. J. Imaging 2024, 10, 188. [Google Scholar] [CrossRef] [PubMed]
- Vano, E.; Miller, D.L.; Martin, C.J.; Rehani, M.M.; Kang, K.; Rosenstein, M.; Ortiz-Lopez, P.; Mattsson, S.; Padovani, M.R.; Rogers, A. Diagnostic reference levels in medical imaging. Ann. ICRP 2017, 46, 1–144. [Google Scholar] [CrossRef]
- ICRP. Radiological protection in Medicine. In Annals of the ICRP; ICRP 105; ICRP: London, UK, 2007. [Google Scholar]
- ICRP. The 2007 recommendations of the international commission on radiological protection. In Annals of the ICRP; ICRP 103; ICRP: London, UK, 2007. [Google Scholar]
- Hendrick, R.E. Radiation doses and cancer risks from breast imaging studies. Radiology 2010, 257, 246–253. [Google Scholar] [CrossRef]
- BEIR VII Council NR. Health Risks from Exposure to Low Levels of Ionizing Radiation: BEIR VII Phase; National Academies Press: Washington, DC, USA, 2006; Volume 7. [Google Scholar]
- Qaelum, N.V. Dose Patient Radiation Dose Monitoring System User Manual, Version 19.02; Qaelum: Leuven, Belgium, 2019; pp. 1–135. [Google Scholar]
- Dupont, L.; Aberle, C.; Botsikas, D.; Ith, M.; Lima, T.V.; Menz, R.; Monnin, P.; Poletti, P.A.; Presilla, S.; Schegerer, A.; et al. Proposed DRLs for mammography in Switzerland. J. Radiol. Prot. 2024, 44, 021512. [Google Scholar] [CrossRef]
- Weir, A.; Schofield, K.A.; McCurrach, A. Setting Scottish diagnostic reference levels for mammography incorporating both craniocaudal and oblique projections between 30 and 80 mm. J. Radiol. Prot. 2021, 41, 97–117. [Google Scholar] [CrossRef]
- Parmaksız, A.; Ataç, G.K.; Bulur, E.; Inal, T.; Alhan, A. Average glandular doses and national diagnostic reference levels in mammography examinations in Turkey. Radiat. Prot. Dosim. 2020, 190, 100–107. [Google Scholar] [CrossRef]
- Amir, T.; Zuckerman, S.P.; Barufaldi, B.; Maidment, A.D.; Conant, E.F. Comparison of radiation dose between 2D digital stereotactic versus digital breast tomosynthesis-guided breast biopsy. Eur. J. Radiol. 2021, 134, 109407. [Google Scholar] [CrossRef] [PubMed]


| Study | Clinical Indication |
|---|---|
| Diagnostic mammography | Bilateral fibroadenoma follow-up, Breast cancer, Breast implants, Breast assessment, Ductal carcinoma in-situ, Breast lesion, Breast calcification |
| Magnification technique | Screening, Ductal carcinoma in-situ, Genetic breast cancer risk, Bilateral fibroadenoma |
| Magnification plus spot technique | Mastectomy, Follow-up, Breast lump, Breast pain |
| Implant protocol | Breast implants, Implants flipped or punctured, BI-RADS 2, Benign changes, Axillary lump, Follow-up, Breast cancer |
| Stereotactic biopsy | Guidewire localization stereotactic 1st lesion, Microcalcifications pre-biopsy |
| View (Study Name) | Age (Years) | kVp | mAs | Focal Spot | Collimation |
|---|---|---|---|---|---|
| Min–Max | Min–Max | (Min–Max) | Width/Length | ||
| 2D CC (Diagnostic) | 29–88 | 25–31 | 18–251 | 0.3 | 24 × 31 |
| 2D MLO (Diagnostic) | 29–88 | 26–31 | 31–303 | 0.3 | 24 × 31 |
| 3D MLO (Diagnostic) | 37–72 | 26–31 | 45–297 | 0.0 | 24 × 31 |
| 2D SCC (Diagnostic) | 37–76 | 25–30 | 30–72 | 0.3 | 13 × 18 |
| 2D SMLO (Diagnostic) | 40–72 | 25–30 | 41–78 | 0.3 | 13 × 18 |
| 2D MSCC (Diagnostic) | 34–84 | 25–33 | 14–93 | 0.1 | 13 × 18 |
| 2D MSMLO (Diagnostic) | 32–69 | 27–33 | 41–156 | 0.1 | 13 × 18 |
| 2D IMCC (Diagnostic) | 29–68 | 28–31 | 56–125 | 0.3 | 24 × 31 |
| 2D IMMLO (Diagnostic) | 29–68 | 28–31 | 63–140 | 0.3 | 24 × 31 |
| 2D CECC (Diagnostic with Contrast) | 41–59 | 28–31 | 58–135 | 0.3 | 24 × 31 |
| 2D CEMLO (Diagnostic with Contrast) | 41–59 | 28–31 | 66–135 | 0.3 | 24 × 31 |
| 2D SBCC (Stereotactic Biopsy) | 35–72 | 25–31 | 40–168 | 0.3 | 24 × 31 |
| Mammogram | Patients | Number of Images | MGD (mGy) | ||||
|---|---|---|---|---|---|---|---|
| 5th per | 25th per | Median (DRL) | 75th per | 95th per | |||
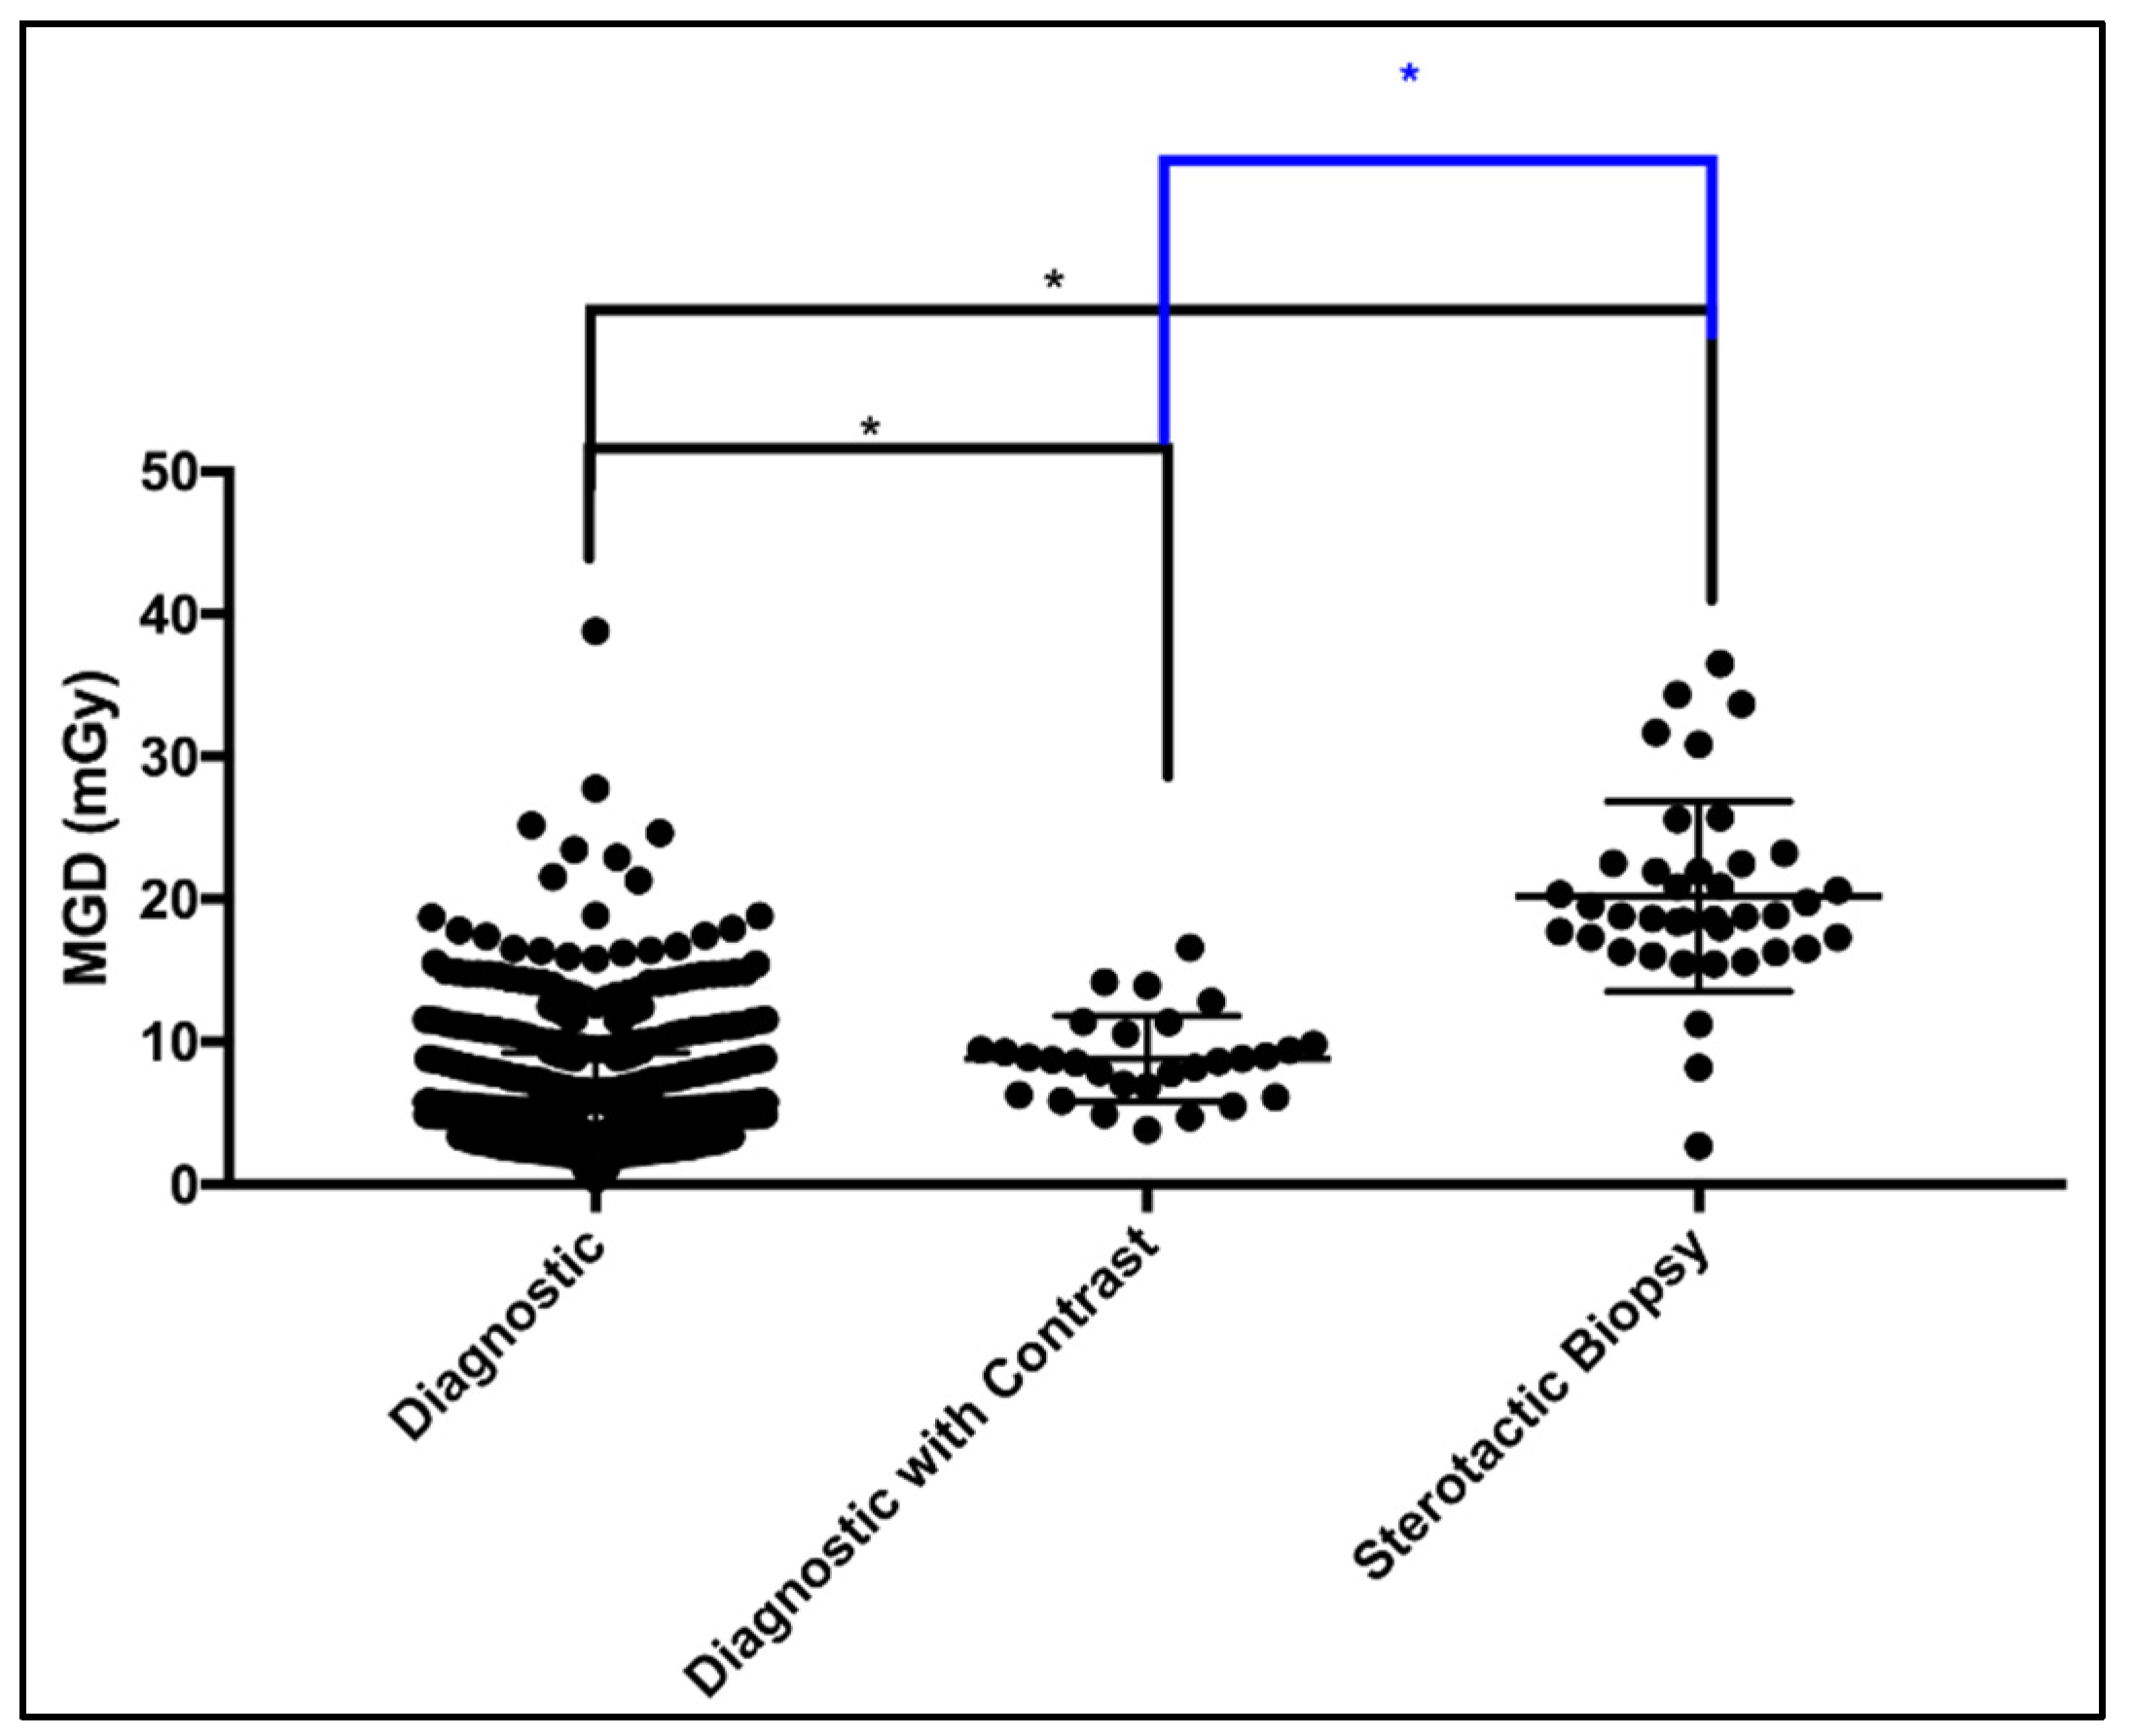
| Diagnostic | 1123 | Minimum 2 up to 10 | 2.19 | 4.07 | 5.06 | 6.46 | 12.29 |
| Diagnostic with Contrast | 29 | Minimum 3 up to 6 | 4.24 | 6.57 | 8.71 | 10.19 | 15.41 |
| Stereotactic Biopsy | 39 | Minimum 10 up to 14 | 8.18 | 16.54 | 18.83 | 22.49 | 34.36 |
| View (Study Name) | Number of Images | MGD (mGy) | |||||
|---|---|---|---|---|---|---|---|
| 5th per | 25th per | Median (DRL) | 75th per | 95th per | Literature | ||
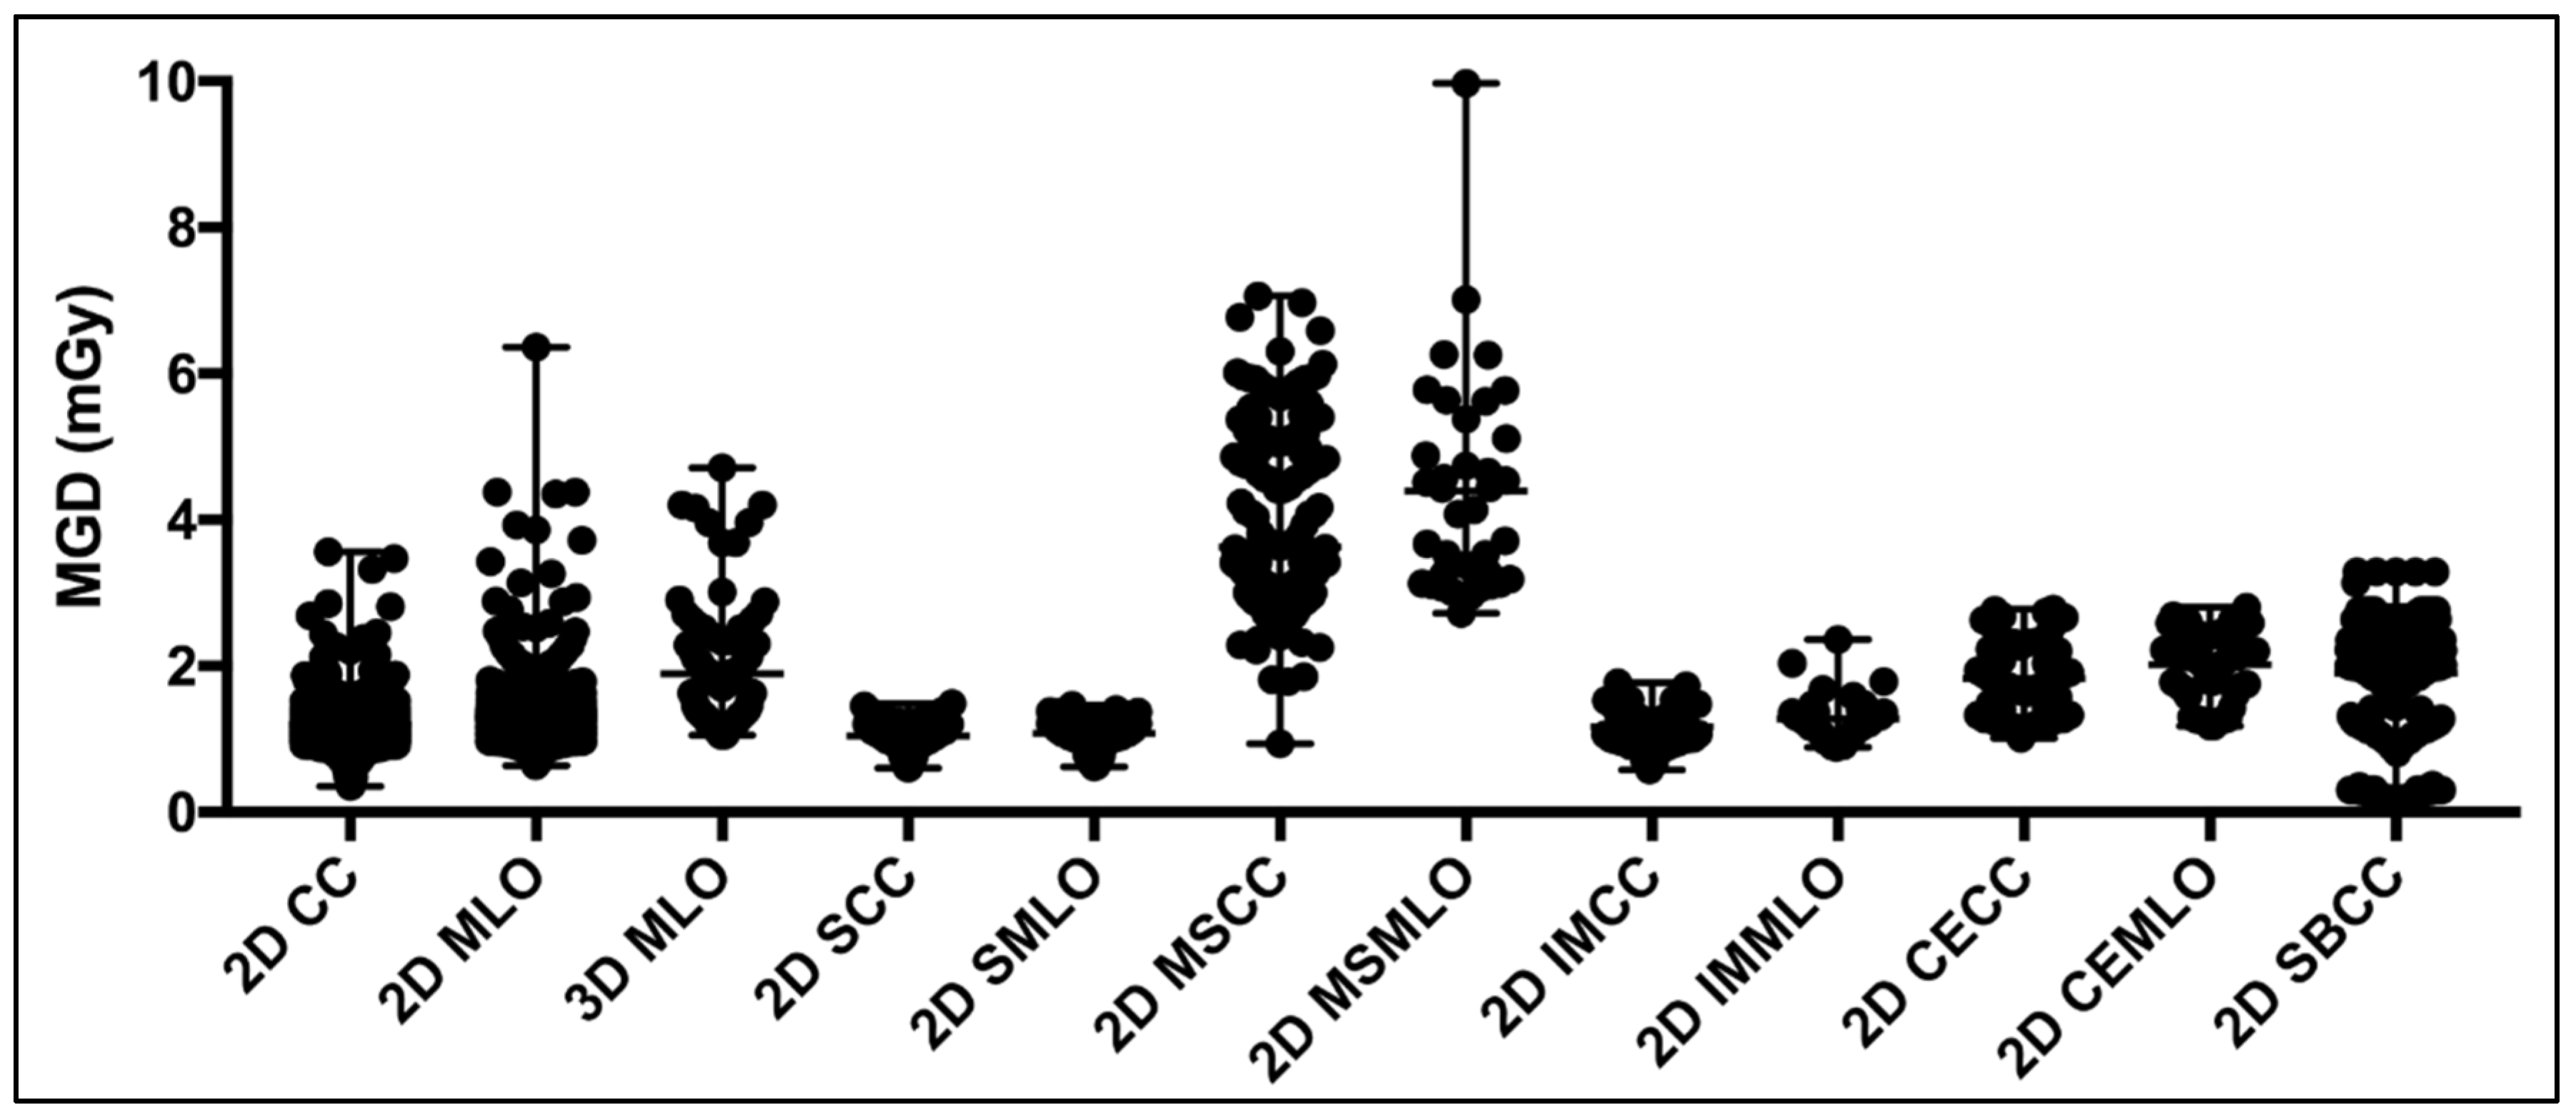
| 2D CC (Diagnostic) | 1882 | 0.93 | 1.07 | 1.17 | 1.30 | 1.50 | |
| 2D MLO (Diagnostic) | 1820 | 0.98 | 1.15 | 1.27 | 1.42 | 1.70 | |
| 3D MLO (Diagnostic) | 104 | 1.07 | 1.28 | 1.72 | 2.29 | 3.96 | 1.55 * [9] |
| 2D SCC (Diagnostic) | 88 | 0.67 | 0.95 | 1.05 | 1.19 | 1.39 | |
| 2D SMLO (Diagnostic) | 49 | 0.65 | 0.99 | 1.08 | 1.22 | 1.39 | |
| 2D MSCC (Diagnostic) | 254 | 2.48 | 3.0 | 3.35 | 3.96 | 5.92 | |
| 2D MSMLO (Diagnostic) | 37 | 2.94 | 3.16 | 4.14 | 5.25 | 7.31 | |
| 2D IMCC (Diagnostic) | 48 | 0.68 | 0.96 | 1.10 | 1.34 | 1.66 | |
| 2D IMMLO (Diagnostic) | 35 | 0.90 | 1.07 | 1.22 | 1.37 | 2.10 | |
| 2D CECC (Diagnostic with Contrast) | 60 | 2.26 | 1.33 | 1.74 | 2.31 | 2.74 | 2.33 *, 2.46 * [7], 1.47 * [9] |
| 2D CEMLO (Diagnostic with Contrast) | 61 | 1.23 | 1.70 | 2.14 | 2.44 | 2.64 | |
| 2D SBCC (Stereotactic Biopsy) | 384 | 0.29 | 1.77 | 2.06 | 2.31 | 2.66 | 1.48 * [9] |
| CBT (mm) | View | Images | MGD (mGy) | ||||
|---|---|---|---|---|---|---|---|
| 5th per | 25th per | Median (DRL) | 75th per | 95th per | |||
| 20–29 | 2D CC | 12 | 0.66 | 0.72 | 0.81 | 1.14 | 1.34 |
| 30–39 | 2D CC | 67 | 0.78 | 0.90 | 0.97 | 1.20 | 1.46 |
| 2D MLO | 33 | 0.80 | 0.86 | 0.99 | 1.19 | 1.43 | |
| 2D SCC | 10 | 0.60 | 0.88 | 1.07 | 1.27 | 1.39 | |
| 2D MSCC | 32 | 2.37 | 2.56 | 2.84 | 3.08 | 3.63 | |
| 2D SBRCC | 80 | 0.94 | 2.00 | 2.28 | 3.08 | 2.58 | |
| 2D SBLCC | 54 | 1.76 | 1.91 | 2.04 | 2.35 | 2.66 | |
| 40–49 | 2D CC | 289 | 0.89 | 0.96 | 1.01 | 1.07 | 1.17 |
| 2D MLO | 133 | 0.89 | 0.98 | 1.03 | 1.08 | 1.20 | |
| 3D MLO | 18 | 1.05 | 1.07 | 1.14 | 1.27 | 1.56 | |
| 2D SCC | 29 | 0.74 | 0.95 | 0.99 | 1.09 | 1.20 | |
| 2D SMLO | 17 | 0.76 | 0.93 | 1.02 | 1.09 | 1.21 | |
| 2D MSCC | 88 | 2.56 | 2.92 | 3.12 | 3.8 | 3.60 | |
| 2D SBRCC | 65 | 1.24 | 2.02 | 2.18 | 2.59 | 3.29 | |
| 2D SBLCC | 57 | 1.13 | 2.03 | 2.06 | 2.12 | 2.55 | |
| 50–59 | 2D CC | 652 | 0.96 | 1.06 | 1.12 | 1.18 | 1.27 |
| 2D MLO | 399 | 0.98 | 1.07 | 1.14 | 1.20 | 1.28 | |
| 3D MLO | 23 | 1.14 | 1.23 | 1.45 | 1.92 | 2.10 | |
| 2D SCC | 28 | 0.61 | 0.95 | 1.09 | 1.22 | 1.40 | |
| 2D SMLO | 15 | 0.65 | 0.97 | 1.00 | 1.19 | 1.24 | |
| 2D MSCC | 83 | 2.94 | 3.22 | 3.50 | 3.81 | 4.13 | |
| 2D SBRCC | 28 | 1.02 | 1.22 | 2.00 | 2.76 | 2.76 | |
| 2D SBLCC | 12 | 1.13 | 1.16 | 2.01 | 2.01 | 2.01 | |
| 2D CECC | 17 | 1.01 | 1.21 | 1.33 | 1.73 | 1.91 | |
| 60–69 | 2D CC | 569 | 1.12 | 1.19 | 1.25 | 1.33 | 1.41 |
| 2D MLO | 537 | 1.13 | 1.20 | 1.26 | 1.33 | 1.42 | |
| 3D MLO | 37 | 1.20 | 1.37 | 1.93 | 2.00 | 2.91 | |
| 2D SCC | 18 | 0.65 | 0.96 | 1.13 | 1.25 | 1.49 | |
| 2D SMLO | 11 | 0.70 | 1.14 | 1.23 | 1.34 | 1.50 | |
| 2D MSCC | 36 | 4.13 | 4.75 | 5.15 | 5.75 | 6.80 | |
| 2D MSMLO | 14 | 3.71 | 4.12 | 4.93 | 5.77 | 9.97 | |
| 2D SBRCC | 24 | 1.06 | 1.04 | 2.12 | 2.34 | 2.64 | |
| 2D SBLCC | 14 | 1.19 | 1.23 | 2.09 | 2.13 | 2.13 | |
| 2D CECC | 22 | 1.38 | 1.77 | 2.26 | 2.62 | 2.77 | |
| 2D CEMLO | 13 | 1.23 | 1.70 | 2.14 | 2.48 | 1.43 | |
| 70–79 | 2D CC | 223 | 1.16 | 1.31 | 1.39 | 1.48 | 1.66 |
| 2D MLO | 467 | 1.17 | 1.31 | 1.40 | 1.47 | 1.61 | |
| 3D MLO | 16 | 1.39 | 1.80 | 2.00 | 3.45 | 3.96 | |
| 2D IMCC | 14 | 0.58 | 0.91 | 1.17 | 1.47 | 1.57 | |
| 2D IMMLO | 10 | 0.90 | 0.94 | 1.26 | 1.42 | 1.68 | |
| 2D CEMLO | 25 | 1.43 | 2.15 | 2.39 | 2.51 | 2.63 | |
| 80–89 | 2D CC | 56 | 0.92 | 1.43 | 1.56 | 1.77 | 2.92 |
| 2D MLO | 202 | 1.29 | 1.47 | 1.58 | 1.71 | 2.22 | |
| 90–108 | 2D MLO | 41 | 1.12 | 1.64 | 1.88 | 2.74 | 4.38 |
Disclaimer/Publisher’s Note: The statements, opinions and data contained in all publications are solely those of the individual author(s) and contributor(s) and not of MDPI and/or the editor(s). MDPI and/or the editor(s) disclaim responsibility for any injury to people or property resulting from any ideas, methods, instructions or products referred to in the content. |
© 2025 by the authors. Licensee MDPI, Basel, Switzerland. This article is an open access article distributed under the terms and conditions of the Creative Commons Attribution (CC BY) license (https://creativecommons.org/licenses/by/4.0/).
Share and Cite
Dalah, E.Z.; Alkaabi, M.K.; Antony, N.A.; Al-Awadhi, H.M. Establishing Diagnostic Reference Levels for Mammography Digital Breast Tomosynthesis, Contrast Enhance, Implants, Spot Compression, Magnification and Stereotactic Biopsy in Dubai Health Sector. J. Imaging 2025, 11, 79. https://doi.org/10.3390/jimaging11030079
Dalah EZ, Alkaabi MK, Antony NA, Al-Awadhi HM. Establishing Diagnostic Reference Levels for Mammography Digital Breast Tomosynthesis, Contrast Enhance, Implants, Spot Compression, Magnification and Stereotactic Biopsy in Dubai Health Sector. Journal of Imaging. 2025; 11(3):79. https://doi.org/10.3390/jimaging11030079
Chicago/Turabian StyleDalah, Entesar Z., Maryam K. Alkaabi, Nisha A. Antony, and Hashim M. Al-Awadhi. 2025. "Establishing Diagnostic Reference Levels for Mammography Digital Breast Tomosynthesis, Contrast Enhance, Implants, Spot Compression, Magnification and Stereotactic Biopsy in Dubai Health Sector" Journal of Imaging 11, no. 3: 79. https://doi.org/10.3390/jimaging11030079
APA StyleDalah, E. Z., Alkaabi, M. K., Antony, N. A., & Al-Awadhi, H. M. (2025). Establishing Diagnostic Reference Levels for Mammography Digital Breast Tomosynthesis, Contrast Enhance, Implants, Spot Compression, Magnification and Stereotactic Biopsy in Dubai Health Sector. Journal of Imaging, 11(3), 79. https://doi.org/10.3390/jimaging11030079