Abstract
Cement is a widely used building material, with more than 4.4 billion metric tons produced in 2021. Unfortunately, the excessive use of cement raises several environmental issues, one of which is the massive amounts of CO2e produced as a by-product. Using recycled materials in the concrete mix is widely employed to solve this problem. A method for minimizing the use of natural cement by substituting it with secondary cementitious material that consists of wood–cement board manufacturing waste has been studied in this paper. The cement in the waste stream was reactivated by a mechanical treatment method—the use of a planetary mill, allowing it to regain its cementitious properties and be used as a binder. Physical and mineralogical analysis of the binder material was performed using X-ray diffraction (XRD), thermogravimetry/differential thermal analysis (TG/DTA) and Brunauer–Emmett–Teller analysis; granulometry and compressive strength tests were also carried out. The results show that the grinding process did not significantly change the mineralogical composition and the specific surface area; it did, however, affect the compressive strength of the samples prepared by using the reactivated binding material; also, the addition of plasticizer to the mix increased compressive strength by 2.5 times. Samples were cured in high-humidity conditions. The optimal water-to-binder (W/B) ratio was found to be 0.7 because of the wood particles that absorb water in their structure. Compressive strength increased as the grinding time increased.
1. Introduction
For the past nine years, Portland cement has been manufactured at more than 4 billion metric tons per year, with 4.4 billion metric tons produced in 2021 [1]. Cement production has some environmental issues that have been addressed in the last decade and need to be more actively studied for sustainable cement production. Some of the issues are that raw materials used for cement manufacturing are limited natural resources that will end one day if sustainable production is not developed. High energy consumption and greenhouse gas production are significant issues contributing to global warming and global energy consumption [2].
Cement manufacturing, which accounts for 8% of greenhouse gas emissions [3], is the most significant industrial producer of greenhouse gases, excluding agriculture. CaCO3 (typically limestone) as a primary component accounts for around half of the CO2 released, with the remaining CO2 mainly coming from fossil fuel burning in the cement kiln [4]. As the world’s population and economy increase and rising nations invest in infrastructure, cement demand rises. Each kilogram of cement produced releases 0.9 kg of CO2e [5], and 3.96 Gt of CO2e was emitted in 2021, emphasizing the importance of decarbonizing cement manufacturing.
Current efforts to reduce cement’s carbon footprint include carbon capture from flue gases, alternative fuels, or the development of supplementary cementitious materials [3,6,7,8,9,10,11]. Using supplementary materials in concrete has a limited impact on the carbon emissions from Portland cement and may compromise the physical properties [3,7,8,12]. Another approach to reducing cement’s carbon footprint is to use recycled or waste aggregates as filler material in cement [13,14] or to recycle already used cement by processing it into new raw materials. These raw materials can be added as supplementary cementitious material (SCM) or used as a new cementitious binder made entirely from recycled hydrated cement (RHC) [15,16,17,18,19].
Cement has many possibilities and uses; for instance, it can be used as a binder in wood–cement boards (WCBs). WCBs and their use in construction have quickly gained acceptance in recent years. They offer great fire, insect, and fungal resistance and superior acoustic insulation to wood-based particleboard [20], with conventional concerns linked with urea- and phenol-formaldehyde [21,22]. In the future, these desired characteristics may open up a bigger market and application sector [23]. WCB manufacturing produces different kinds of waste, one of which is processed dust that occurs in the quality control zone of the manufacturing plant, either by sanding or grinding the particleboard. This dust contains cement and wood particles and can be modified to develop a new sustainable binder containing hydrated cement that has been reactivated and a small share of wood particles that act as filler material [24].
One way to recycle hydrated cement is to mechanically process it by grinding it into smaller particles, breaking down the hydrated conglomerate and revealing the unhydrated portion of the cement [25,26,27]. Unhydrated cement will hydrate as expected, and the hydrated cement particles will act as crystallization centers [28,29].
To characterize this novel binder, extensive testing has to be carried out, incorporating the effect of different factors. Firstly, it has to be determined that the curing conditions are the same as virgin cement material [30] since this is recycled cement. To do so, three curing conditions have been introduced and analyzed. Secondly, as the binder contains wood particles, the overall W/B ratio was increased based on the absorptive nature of wood [31]. To test that, two different W/B ratios and the addition of a superplasticizer are used, and the effect has been determined. As the wood particles decreased the binder’s compressive strength compared to virgin cement [32], a sifting process was incorporated to remove the excess wood particles. Lastly, the effect of milling was analyzed, as it can mechanically activate the dust [33], and its increase can increase the compressive strength of the novel binder.
This study aims to reactivate and characterize hydrated cement from the waste stream of cement–wood composite manufacturing by using a planetary mill to grind particles into smaller sizes, which can be used as supplementary cementitious material or as a controlled low-strength cementitious binder for use in building products.
2. Results and Discussion
Different factors affected the characterized results. Unalike curing conditions were impacted, and conclusions were made and adapted to further sample series. The impact of the water-to-binder ratio was evaluated. After that, the effects of superplasticizer addition and dust sifting were determined. Lastly, the effect of grinding time was assessed based on the W/B ratio and mini-slump test diameter.
2.1. Effect of Curing Conditions
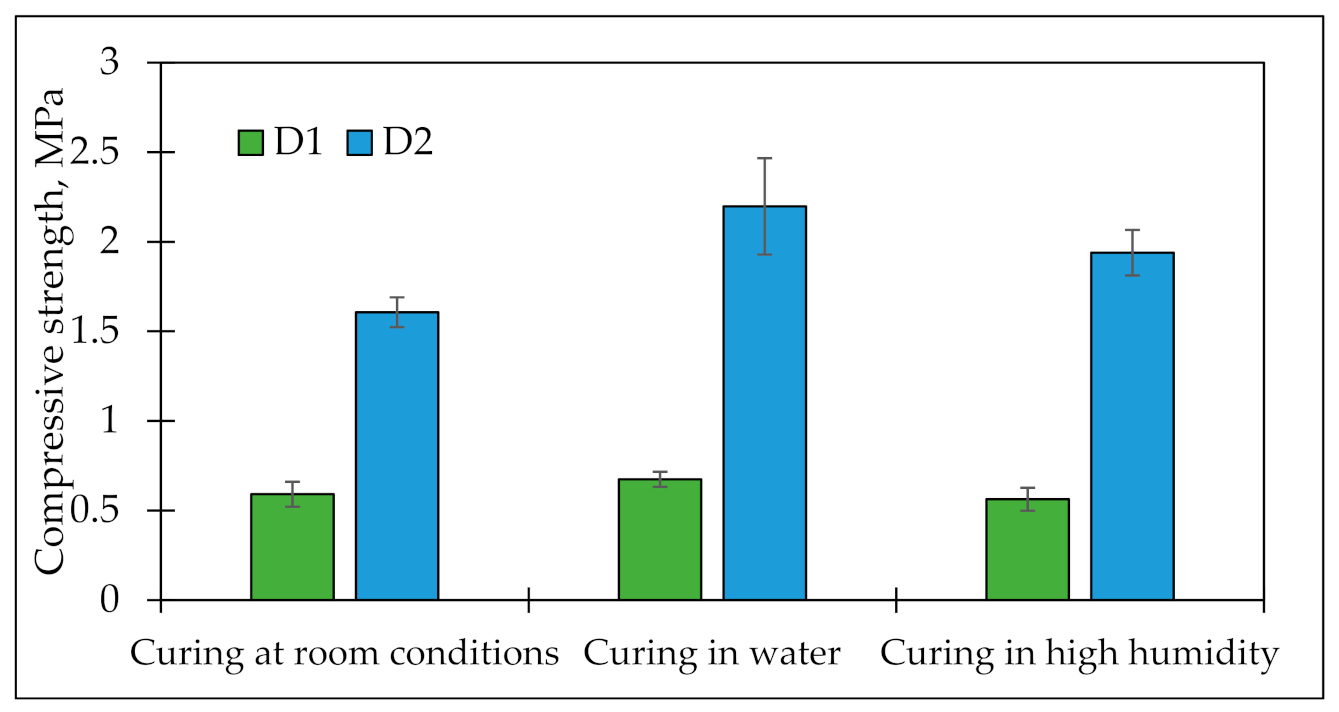
Curing conditions are essential in the high-quality hydration of cement and the hardening of samples. The rheological properties summarized for the dust are shown in Table 1. It can be noticed that a W/B ratio of 0.6 was used for both sample series, but different spread diameters were obtained. The grinding of the material can explain the difference. It is observed that the spread diameter of sifted dust is 17 cm after 20 jolts. However, if the material is processed in a planetary mill (D2), it is possible to obtain a less viscous material with a spread diameter of 21 cm after 20 jolts. The setting start was 4 h for D1 and 3 h for D2. The total setting time of both series was about 15 h.

Table 1.
Physical and rheological properties of the samples used to analyze curing conditions.
The mechanical data (Figure 1) show a tendency to increase the strength with increasing curing time for curing in a high-humidity environment and water. This trend was not observed for curing in room conditions. Comparing the mechanical data obtained on day 28, it can be seen that the highest compressive strength was achieved by the D2 sample series, which were processed in a planetary mill and cured in water and high humidity conditions, reaching 2.19 and 1.94 MPa, respectively. Based on other research [34,35,36], it is true that for a complete cement curing process, high humidity is needed. Few researchers have analyzed the use of steam [34] and increased temperature curing [36], but humidity is needed for the qualitative hydration of cement for all curing methods. Summarizing the obtained data, it was concluded that for further research, the samples would be cured in a high-humidity environment because the obtained data were the most optimal, and the reproducibility of the conditions was sufficiently easy to achieve. Moreover, it can be concluded that the dust processed in the planetary mill (D2) can increase the compressive strength of the developed binder. The effect on grinding time will be discussed in Section 2.5.
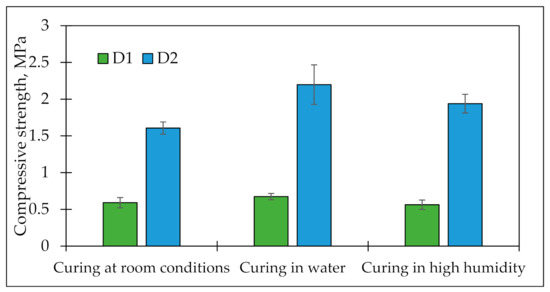
Figure 1.
Compressive strength data of 28th day for differently cured samples.
2.2. Effect of Increasing the W/B Ratio
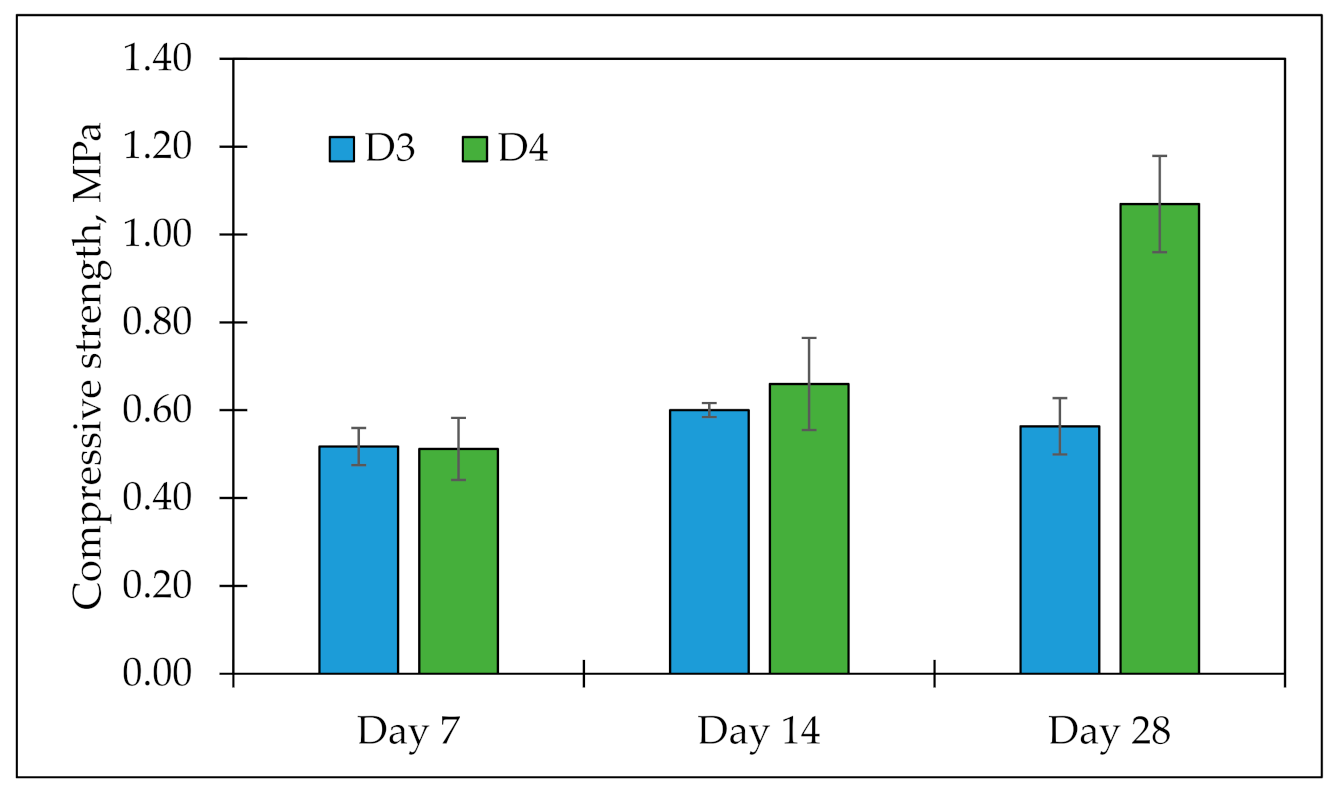
The compiled data on the change in the W/B ratio are shown in Table 2, while in Figure 2, these data are visualized. Mixture designs for D3 and D4 differ in the W/B ratio. For D3, a W/B ratio of 0.6 was used, and for D4, a W/B ratio of 0.8 was used. The samples were cured in a high-humidity environment to induce sufficient moisture in the curing process, referring to the results in the previous section.

Table 2.
Water to binder ratio change effect on compressive strength.
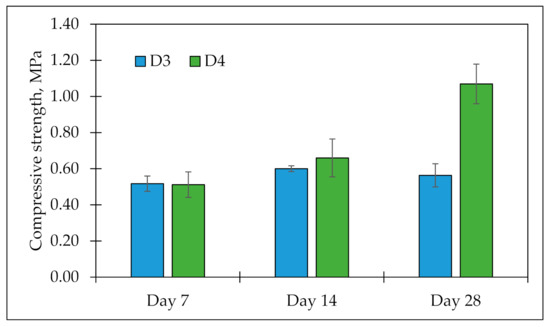
Figure 2.
Influence of W/B ratio on mechanical compressive strength.
Analyzing other research, it has been deduced that compressive strength can be increased for recycled cementing materials if the W/B ratio is higher [37,38,39] than virgin cement needed W/B ratio. Table 2 shows that the data are similar and vary within error limits on days 7 and 14. On day 28, D4 showed 90% higher mechanical compressive strength than D3, reaching 1.07 MPa. From these data, it can be deduced that increasing the W/B ratio can improve the mechanical compressive strength on day 28 due to the sufficient amount of water that helps to continue the hydration of the cement in the samples.
2.3. Influence of Superplasticizer Addition
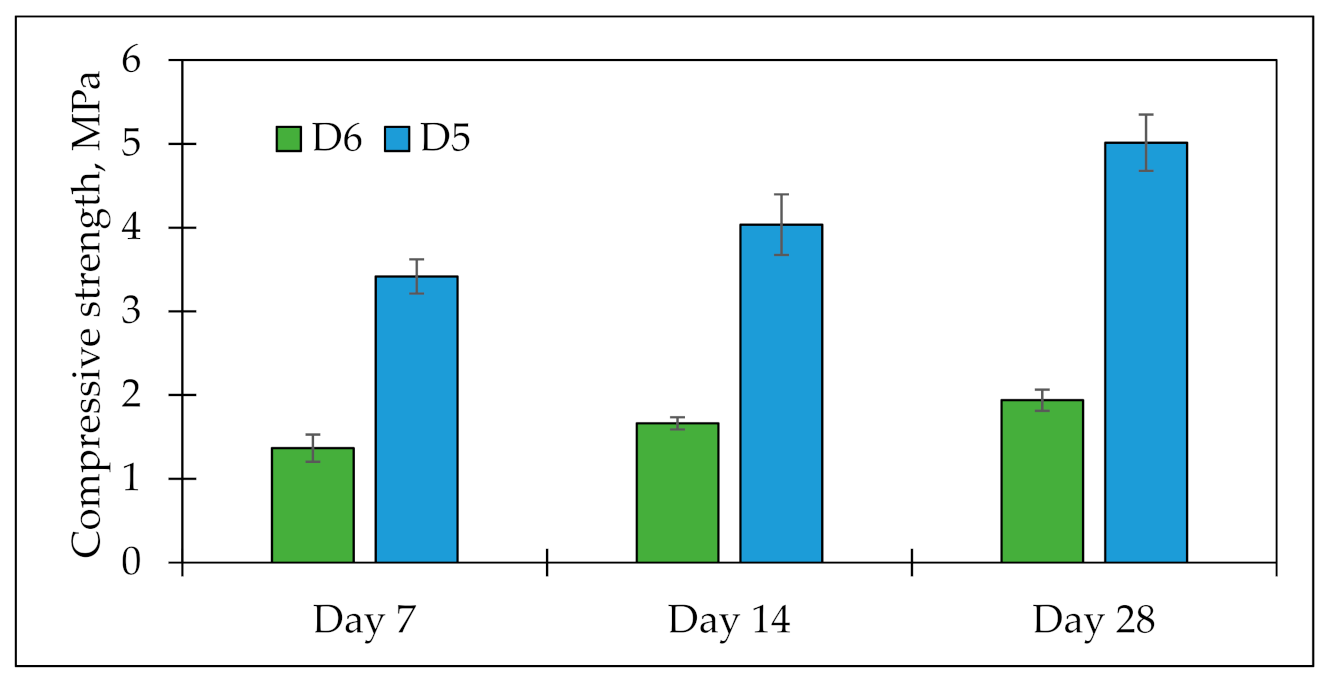
The collected data on the effect of plasticizer are shown in Table 3, and their visualization is in Figure 3.

Table 3.
Summary of mechanical compressive strength to evaluate the effect of plasticizer.
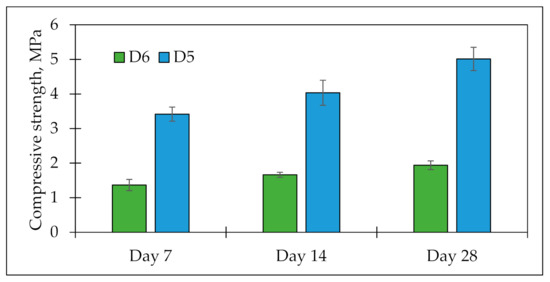
Figure 3.
Influence of plasticizer on mechanical compressive strength.
The data in the table show a tendency for both sample series to increase compressive strength from day 7 to day 28. This trend is similar for both series. The addition of a plasticizer has improved the material’s compressive strength by 2.5 times throughout its curing period. The increase in compressive strength by using plasticizers is also mentioned in the research by Clarissa Sousa [40], where adding different plasticizers increases the compressive strength of the samples. Other researchers [41] have also found a similar conclusion about the plasticizers’ effect on compressive strength. These data conclude that a plasticizer in the amount of 0.0043% by weight of the processing dust will be added for further studies.
2.4. Affect of Raw Material Sifting
To determine the effect of sifting on the samples’ rheological properties and compressive strength, the setting time, the spread diameter after 20 jolts, and the mechanical compressive strength was determined on days 7, 14, and 28 (see Table 4). For unsifted dust samples (D7), the mechanical compressive strength was determined from day 14 due to the inability to demold the samples as they had not yet been set. Table 4 summarizes the data on rheological properties and the graphs on the effect of sifting on bulk density and mechanical compressive strength. Based on other research [23,42,43,44], wood content in cement is an essential factor. The more wood cement contains, the lower the compressive strength is for the composite.

Table 4.
Summary of rheological properties for sifted and unsifted processing dust.
It is observed that the W/B ratio was 1.02 for unsifted dust samples (D7) but 0.6 for sifted samples (D8), from which it can be concluded that a lower W/B ratio is needed when processing dust is sifted beforehand. The spread diameter reached 15 cm for unsifted dust and 17 cm for sifted dust. From the W/B ratio and the spread diameter, it can be concluded that it is possible to reduce the needed W/B ratio and obtain a workable material by sifting the dust. The wood content can explain this in the samples. Wood absorbs water, so it is necessary to increase the W/B ratio to obtain a workable material. The less wood particles the material has, the less water is needed for qualitative hydration.
Compiling the data, it is noticeable that the unsifted dust’s (D7) start setting time is 5 h and 40 min, but for sifted dust (D8), the material starts to set after 32 min.
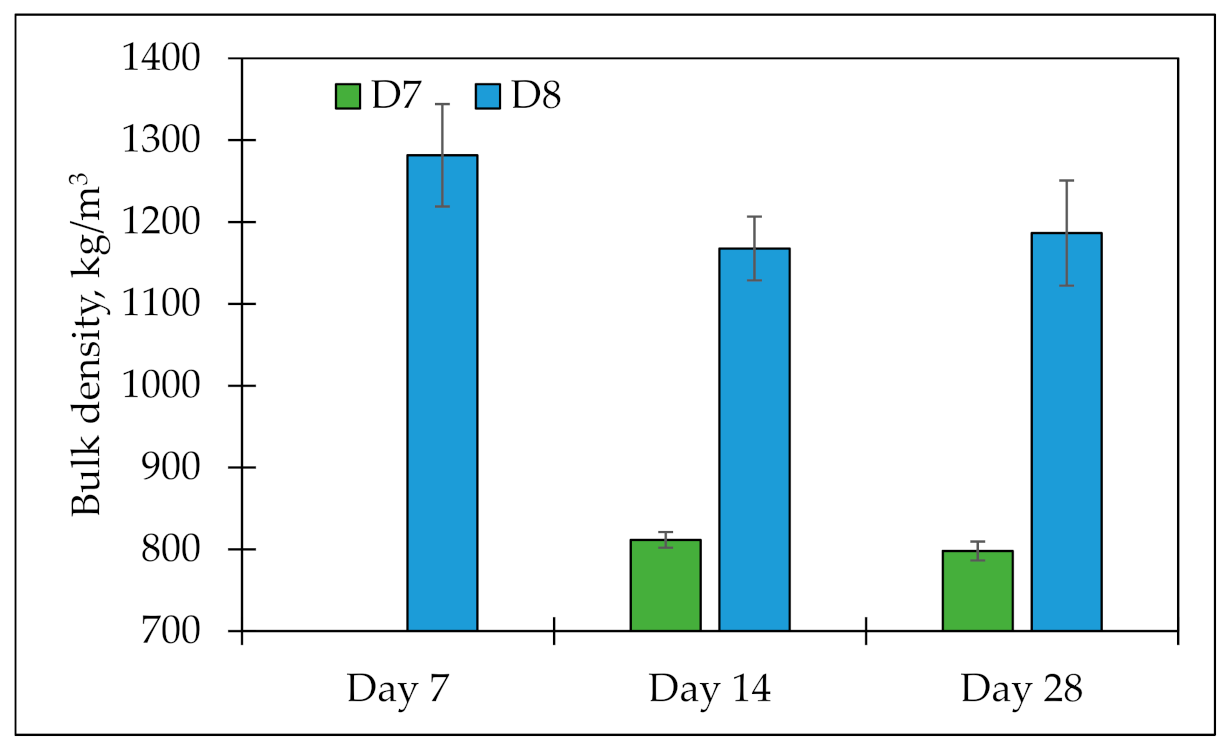
Figure 4 summarizes data on changes in bulk density. It is observed that D7 has a smaller bulk density than D8. Due to higher concentrations of wood, wood has a lower bulk density than cement; therefore, a more significant wood fraction decreases the total bulk density. The bulk density changes from 1282 to 1187 kg/m3 for D8 with a tendency to decrease on day 28; due to insufficient drying of samples on day 7, the free water in the microstructure could be desorbed from the material by more prolonged drying. For D7, the bulk density changes from 812 to 798 kg/m3 on days 14 and 28, but changes may not be significant as the bulk density changes within the limits of errors.
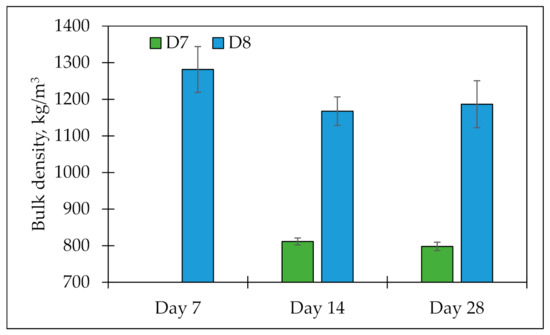
Figure 4.
Effect of sieving on bulk density.
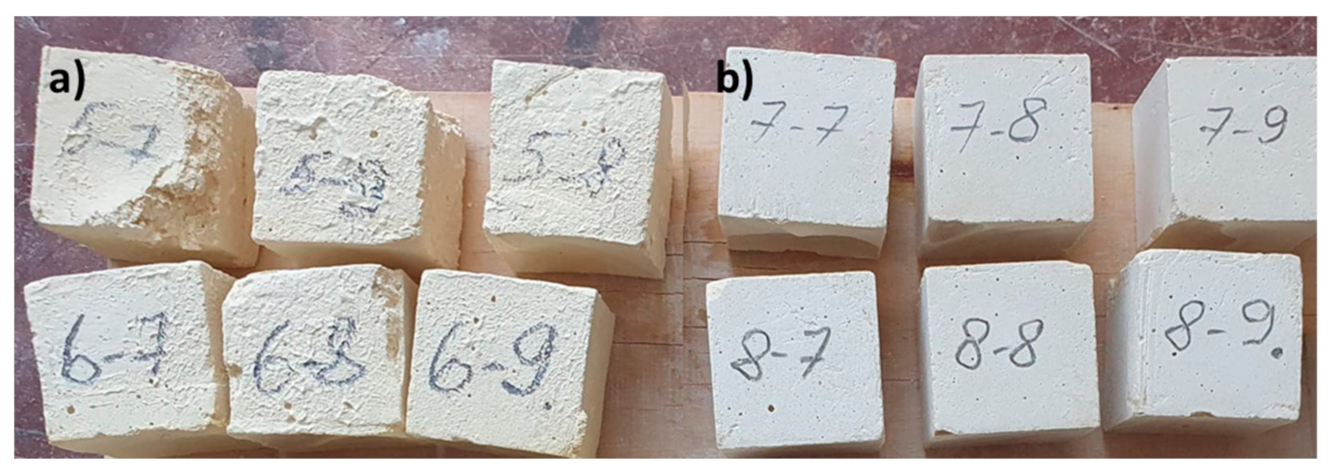
Comparing the mechanical compressive strength data, it is possible to observe a tendency for the strength to increase as the curing time increases. For the unsifted dust samples (D7), the compressive strength did not improve on day 28 compared to day 14, possibly because part of the wood particles absorbed some of the water, preventing the qualitative hydration of the cement in the composition. The visual appearance of the samples is shown in Figure 5.
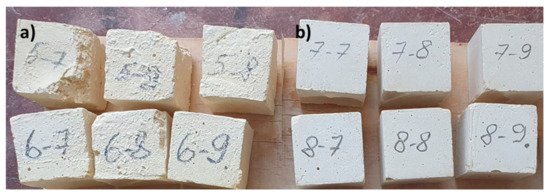
Figure 5.
The visual appearance of samples on day 28; (a) D7 tested samples; (b) D8 tested samples.
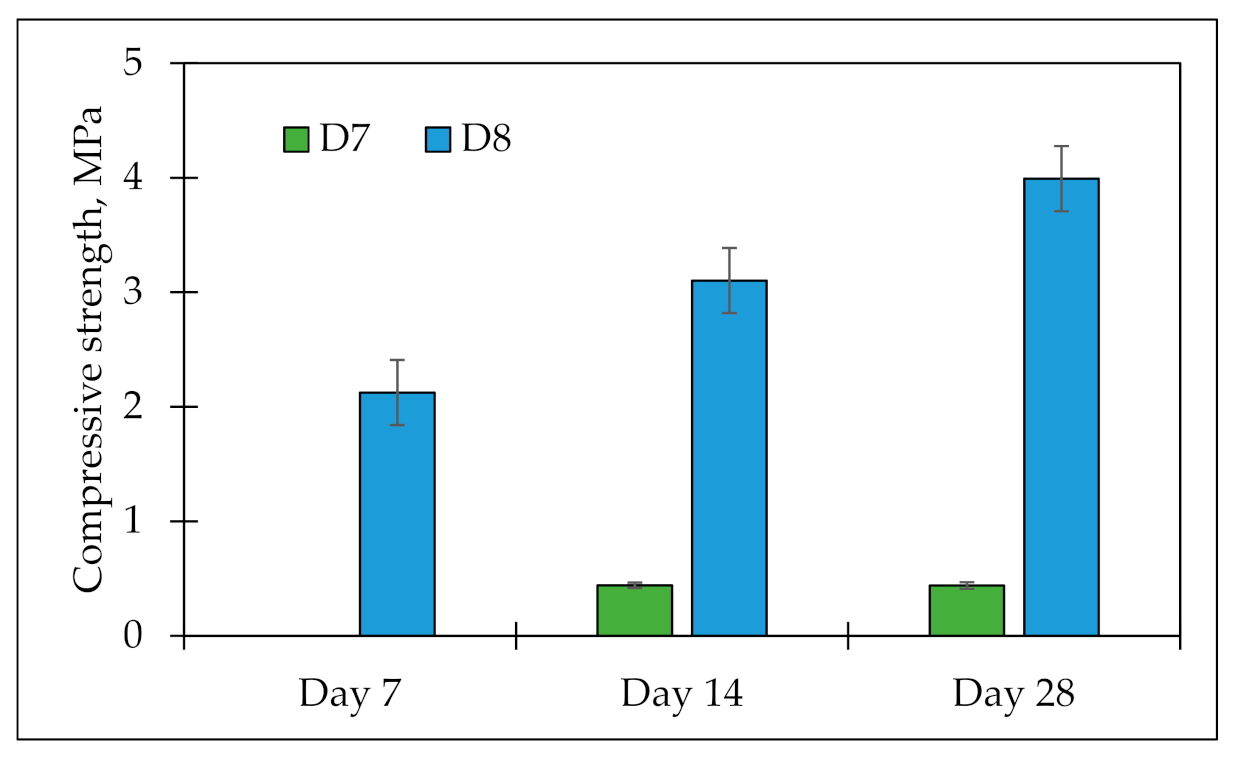
For unsifted dust samples (D7), the compressive strength was 0.44 MPa on day 14 and day 28 (see Figure 6). From the mechanical data of D7, it can be concluded that the sifting process significantly improves the mechanical compressive strength of the dust. For sifted dust samples (D8), the mechanical compressive strength on day 7 was 2.12 MPa, on day 14, it was 3.10 MPa, and on day 28, it was 3.99 MPa, which is nine times higher than the mechanical compressive strength of D7. From these data, it can be observed that the sifting process positively affects the rheological and mechanical properties. The sifting process will be used to separate the wood particles from the cement particles for further experiments.
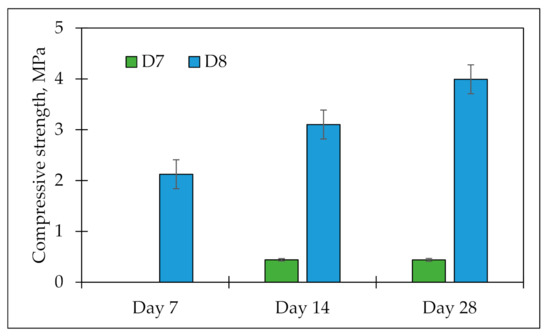
Figure 6.
Effect of sieving on mechanical compressive strength.
2.5. Effect of the Increase in Grinding Time
In the grinding process, the dust particles are ground to a finer fraction, improving the overall cement strength by inducing fine-grained cement particles that act as fine-grained crystallization centers. The effect of grinding time is determined in two ways. First, the grinding efficiency is determined using the same W/B ratio of 0.7. Second, the mini-slump test determines the effect, expressed as the workability of a homogeneous material. Other researchers that have performed similar research in the cement sector have found that the fineness of the SCM can contribute to the increase in compressive strength [45]. Research from Sweden [46] studied the effect of ultrafine particle effect on compressive strength and found that the fines improve the overall properties of the cement.
2.5.1. W/B Ratio of 0.7
Using the same W/B ratio, it is possible to directly conclude the effect on the material’s workability by changing the grinding time. By changing the grinding time, there are no mineralogical changes in the material; the changes occur at the physical level as the particle size decreases. Table 5 summarizes the data obtained on the rheological properties and sample setting time.

Table 5.
Summary of rheological properties and setting time with increasing grinding time without changing the W/B ratio.
There is a difference in the spread diameter when comparing the reference sample with the ground samples. Without grinding, sample D9 has a spread diameter of 11.5 cm. However, if the dust is ground for at least 1 min, the material becomes easier to apply, reaching a spread diameter of 17 cm after 20 jolts (sample D10). If the grinding time is increased more, for example, to 5 min, a spread diameter of 19.5 cm after 20 jolts can be obtained, making the material more workable. The grinding time increase to 10 min (D13) does not change the workability compared to the 5-min grinding time for sample D12.
Comparing the setting times makes it noticeable that grinding time does affect the setting time. The earliest time of setting start was for sample D13 (ground for 10 min), 32 min after the end of the mixing procedure. The latest time of setting start was for D12, where the dust was ground for 5 min, achieving 1 h and 2 min. The reference sample D9 showed similar results, and the setting started 1 h after the mixing had ended. D12 showed the shortest total setting time, reaching under 23 h. The D9 sample total setting time reached over 24 h.
From these data, it can be established that increasing the grinding time of the raw materials makes it possible to achieve a more workable material with a faster onset of setting time, but this does not significantly affect the total setting time.
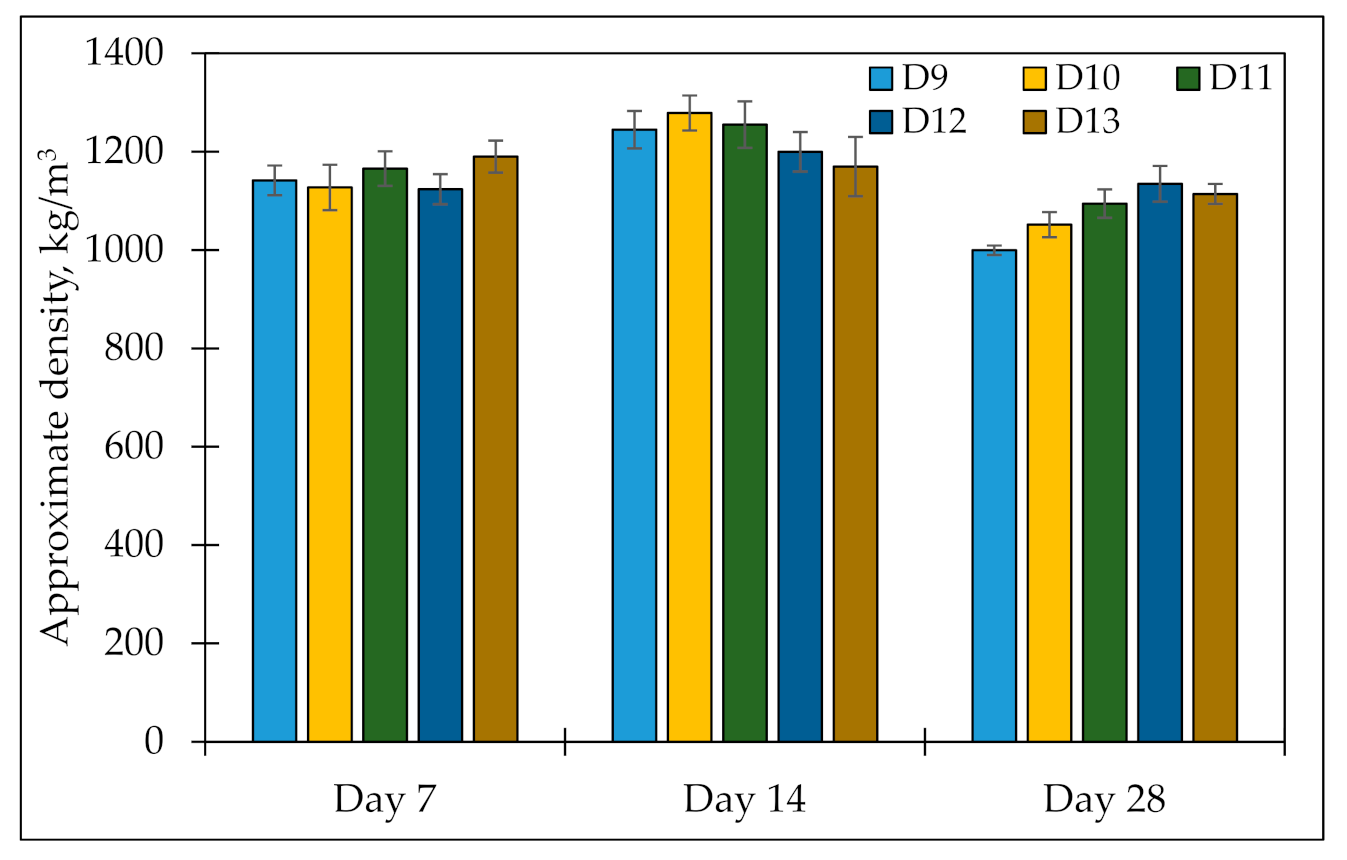
Comparing the changes in approximate density without changing the W/B ratio (Figure 7), it can be observed that the approximate density of the samples changes within the error limits regardless of the grinding time. A drop in approximate density from day 7 to day 28 can be examined, which the prolonged drying process could be used to explain. Long-term drying can change a material’s structure by desorbing the free water and lowering the material’s approximate density.
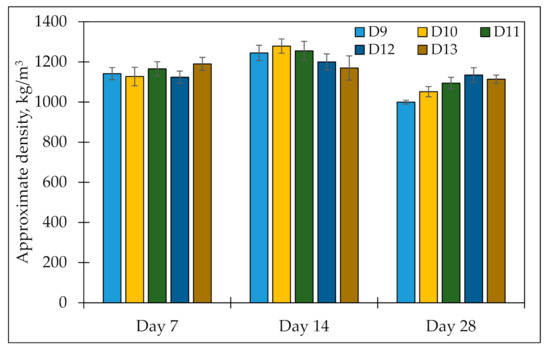
Figure 7.
Effect of grinding time on bulk density by W/B ratio 0.7.
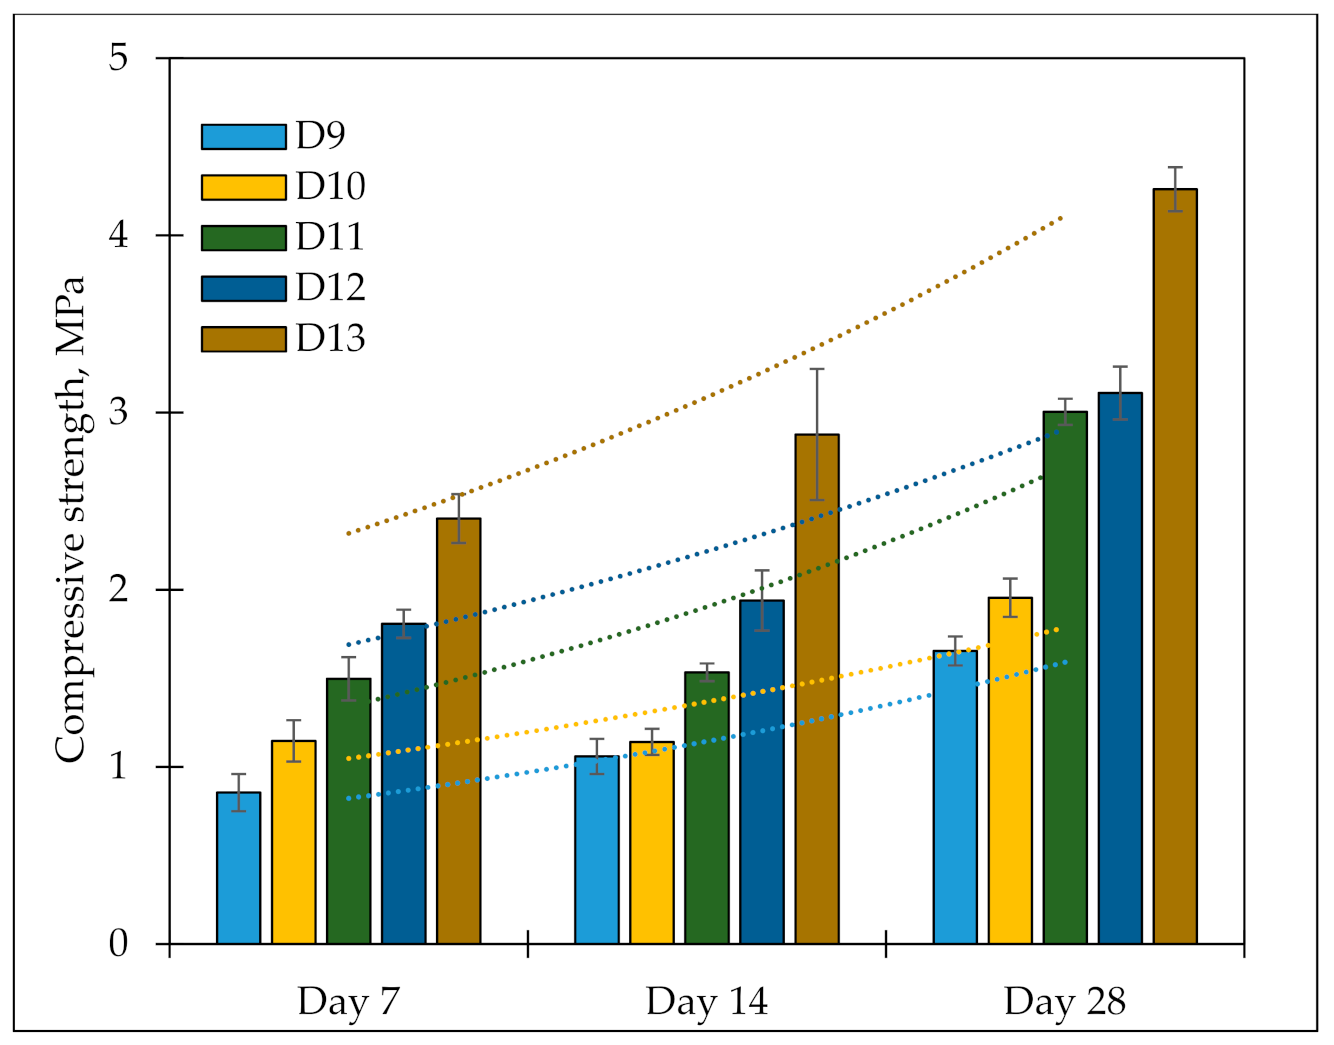
Looking at the obtained results of mechanical compressive strength (Figure 8), a tendency for strength to increase from 7 to 28 days is observed (progressive curve Figure 8), which means that the hydration of the cement took place throughout the curing process. Comparing the mechanical data obtained from raw and processed dust, it can be noticed that the grinding of the dust in the planetary mill has positively affected the mechanical compressive strength, improving it with increasing grinding time.
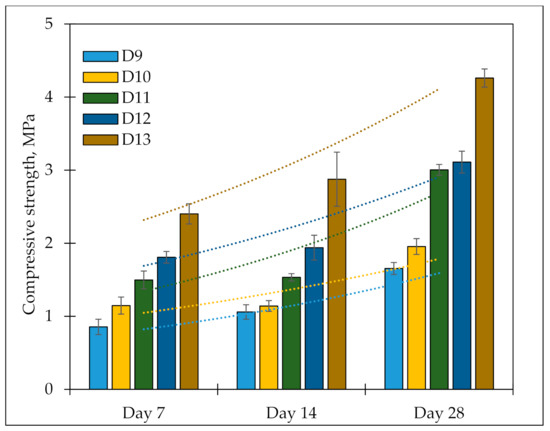
Figure 8.
Effects of grinding time on mechanical compressive strength by W/B ratio 0.7.
The D9 (reference sample series) reached 0.85 MPa on day 7 and increased to 1.65 MPa on day 28. After processing the dust for 1 min in a planetary mill (sample D10), the mechanical compressive strength reached 1.15 MPa on day 7 and increased to 1.96 MPa on day 28. More considerable changes were observed after 2 min of grinding (D11). On day 28, the mechanical compressive strength reached 3 MPa. The strength varies within the error limits for D12 (ground for 5 min) compared to D11. The highest mechanical compressive strength was observed by increasing the dust grinding to 10 min (D13), showing 2.40 MPa on day 7 and 4.26 MPa on day 28. From these data, it can be ensured that increasing the grinding time makes it possible to increase the mechanical compressive strength.
2.5.2. Mini-Slump Test Diameter
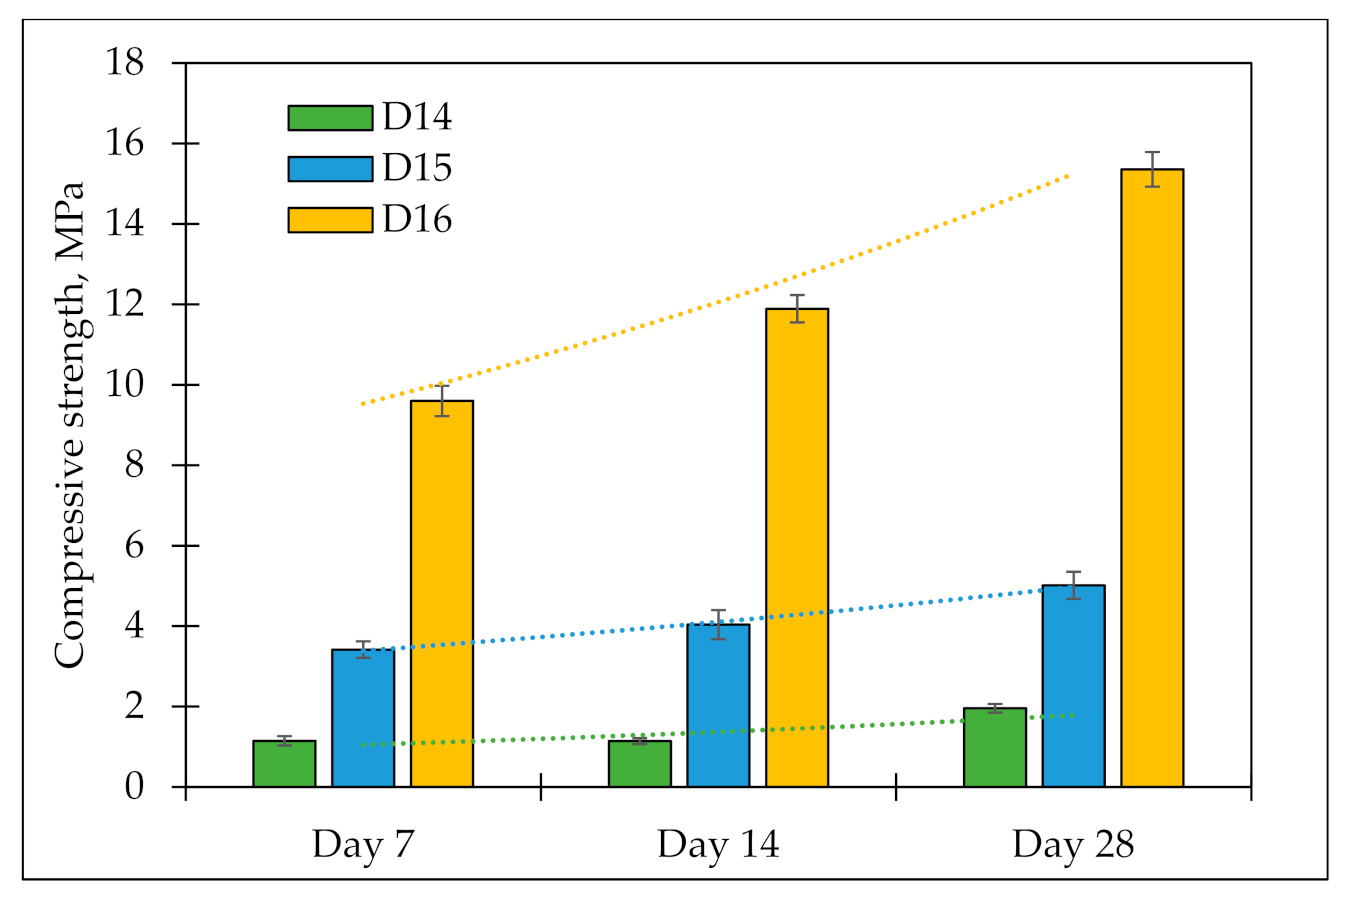
By comparing the workability properties of the material, it is possible to compare the mechanical compressive strength of materials of the exact nature. The assumed working limit is 15–17 cm for the spread diameter measured after 20 jolts of the impact table from ASTM C143 [47]. After grinding for 1 (D14) and 30 min (D16), the spread diameter of 17 cm was obtained, but different W/B ratios were used, 0.7 and 0.5, respectively. After grinding for 10 min (D15), a spread diameter of 15 cm was obtained with a W/B ratio of 0.6.
The setting time of the D15 was about 3 h; for D16, the setting time was more—3 h and 13 min. This difference is not so significant to make conclusions about grinding times’ effect on setting time.
Summarizing the data on compressive strength (Figure 9), there is a similar tendency as Figure 8 for strength to increase when comparing day 28 data to day 7 (progressive curve Figure 9). Increasing the grinding time to 30 min makes it possible to obtain a material with a mechanical compressive strength of at least 15 MPa on the 28th day.
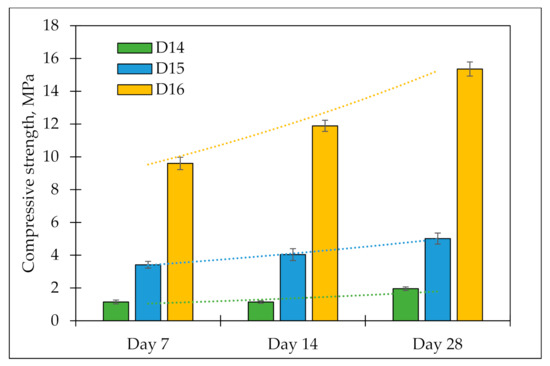
Figure 9.
Influence of grinding time on mechanical compressive strength.
Comparing the data for dust processed at different duration, a correlation can be observed that the compressive strength improves approximately three-fold between the 1- and 10- and 10- and 30-min ground samples.
3. Materials and Methods
3.1. Raw Materials
In this study, the primary raw material used is processing waste that contains cement and wood particles. Processing waste is generated during the quality assessment phase, where the wood–cement boards are cut, prefabricated, polished, and milled for a smoother surface. Processing waste is dust particles with dimensions not over 1 cm. In the quality assessment phase, these particles are vacuumed in a storage facility near the factory where they can settle and not pollute the factory. Processing waste is collected and transferred to a landfill after the storage facility is full since it is a waste product created along with the primary product. The first issue with this dust is that it is light, and when it is dumped in a landfill, dust particles are spread across the area, polluting the surrounding area. The second problem is that it is not economical to landfill this dust, and it should be recycled, as it contains the same materials as the primary manufacturing product. Processing waste in this study will be referred to as dust.
Dust contains hydrated and non-hydrated cement as well as different fractions of wood. The granulometry of the dust has been compiled in Table 6.

Table 6.
Granulometry of the dust.
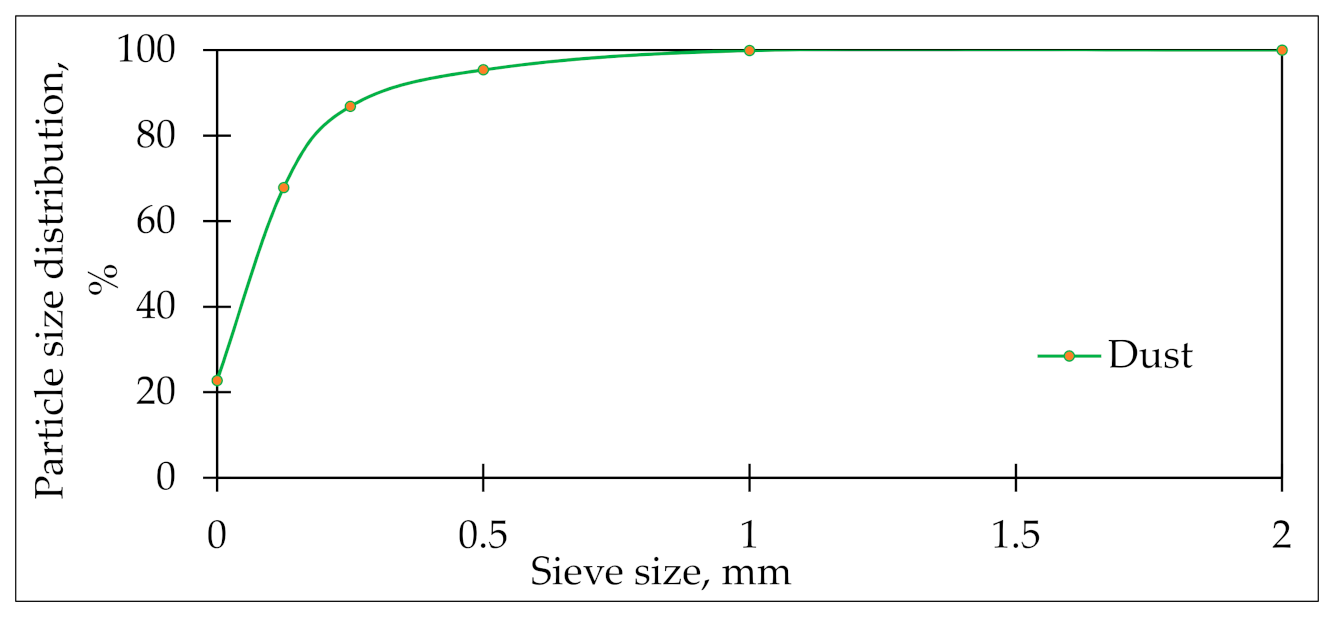
For visualization purposes, data from the table have also been adapted to a graph (see Figure 10), where it is observable that for dust, 100% of the particles are below 4 mm. Fraction 2–4 mm contains 0.1% of the total tested material, and 1–2 mm fractions contain 4.5%. Fraction 0.5–1 mm contains 8.6%.
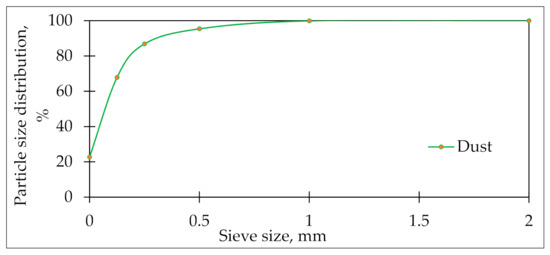
Figure 10.
Particle size distribution for the used dust.
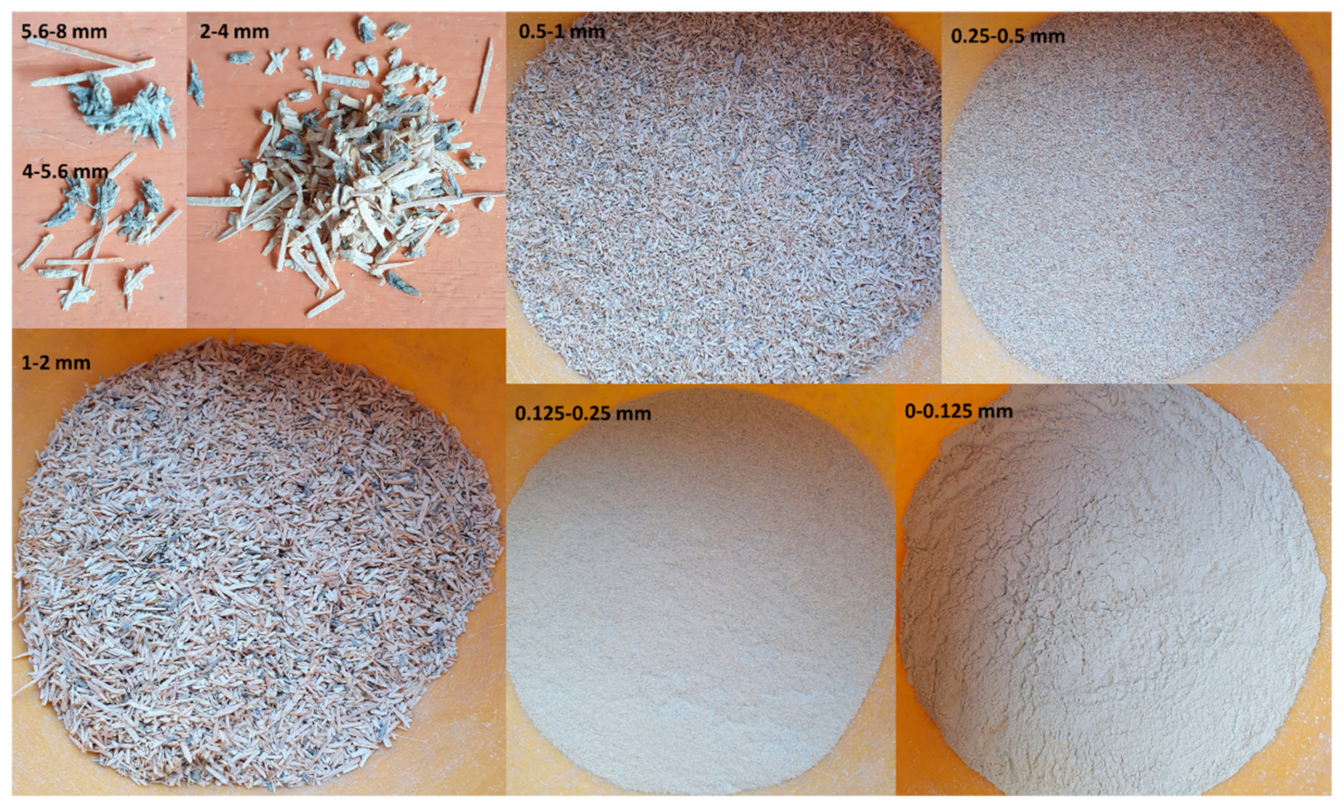
More significant changes occur when the particle size decreases below 0.5 mm. 0.25–0.5 mm fraction makes up 19% of the tested material, while the 0.125–0.25 mm fraction accounts for 45.1%. The tiniest fraction, 0–0.125 mm, makes up 22.7% of the total tested material. For this research, dust was sifted to obtain a fraction of <0.25 mm to increase the ratio of cement to wood and reduce the particle size of the wood particles. Each fraction was photographed for visual assessment and can be seen in Figure 11.
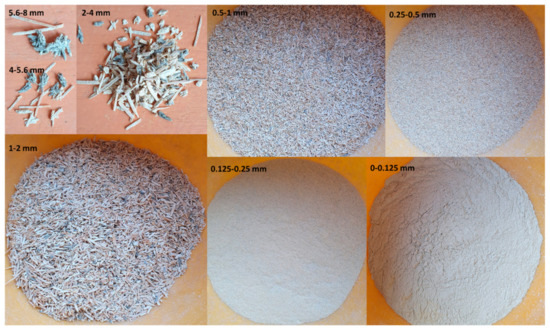
Figure 11.
Dust appearance by fractions.
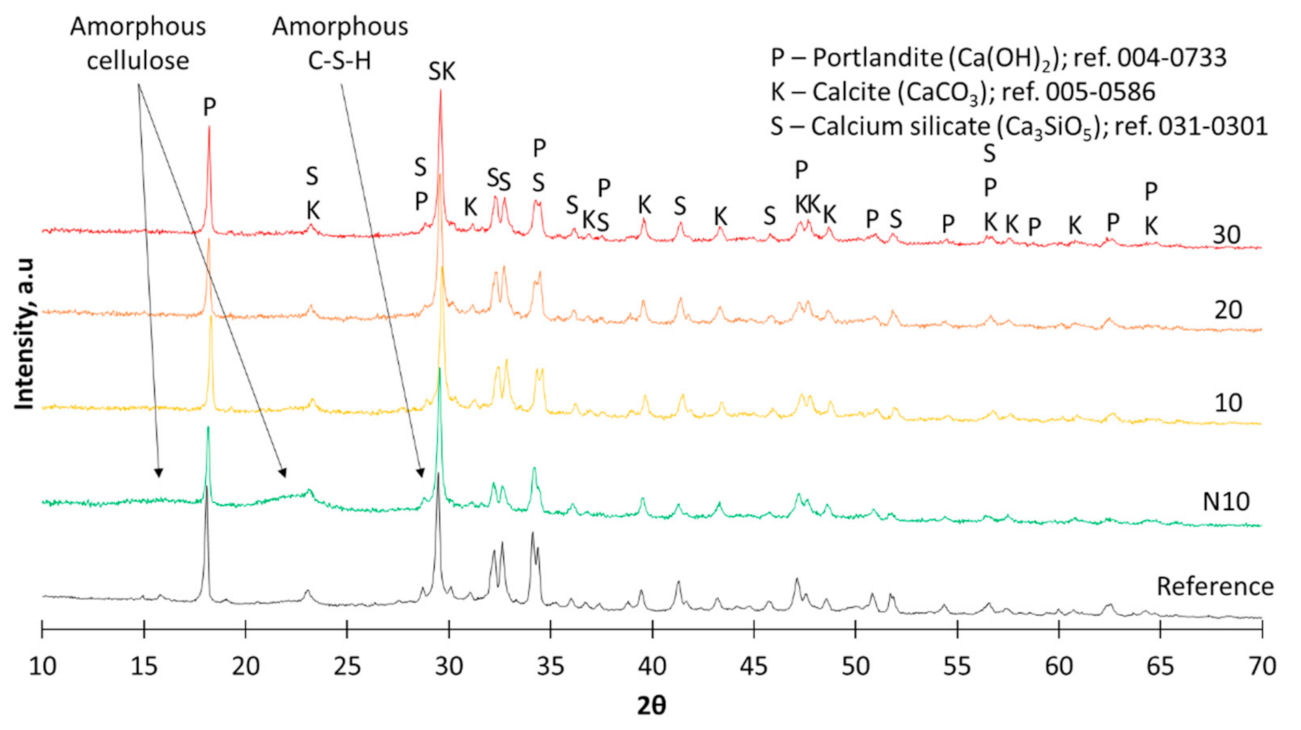
X-ray diffractometry and thermogravimetric analysis were performed on the dust to evaluate the effect of specific processes on them. In Figure 12, XRD data were compared. Data are compiled for reference dust, sifted dust, and one series of unsifted dust marked N10. Reference dust was sifted but was not ground. All samples but the reference were ground for the test to obtain a more homogenous material. Abbreviations 10, 20, and 30 mean the grinding time for the dust to be processed in the planetary mill. Comparing these diffractograms, it can be proposed that the grinding time does not affect the mineralogical composition of the dust. However, the unsifted dust has amorphous cellulose phases [48,49,50] because the sifting process separates the wood from the cement. Amorphous cellulose phases are examined as curvature in the ranges of 13.1° to 17.5° and 19.8° to 25.4°. In addition to amorphous cellulose, a different amorphous phase is observed in all samples—the amorphous calcium silicate hydrate phase is depicted as a curvature at 28.5° to 37.7°. In addition to the amorphous phases, crystalline phases of portlandite, calcite and calcium silicate hydrates were detected. The crystalline phases of portlandite are ascertained at diffractogram extremes of 18.1°; 28.8°; 34.3°; 47.3°; 51.2°; 54.4°, and 62.4°. Calcite extremes are detected at 23.2°; 29.5°; 31.1°; 36.1°; 39.5°; 43.3°; 47.6°, and 48.7°. The main crystalline phases of calcium silicate hydrates are observed at diffractogram extremes of 23.2°; 28.8°; 29.5°; 32.2°; 32.6°; 34.3°; 36.2°, and 43.4° [51,52,53,54,55].
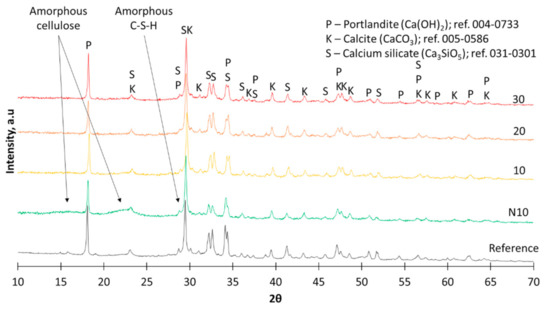
Figure 12.
X-ray diffractograms for differently modified dust.
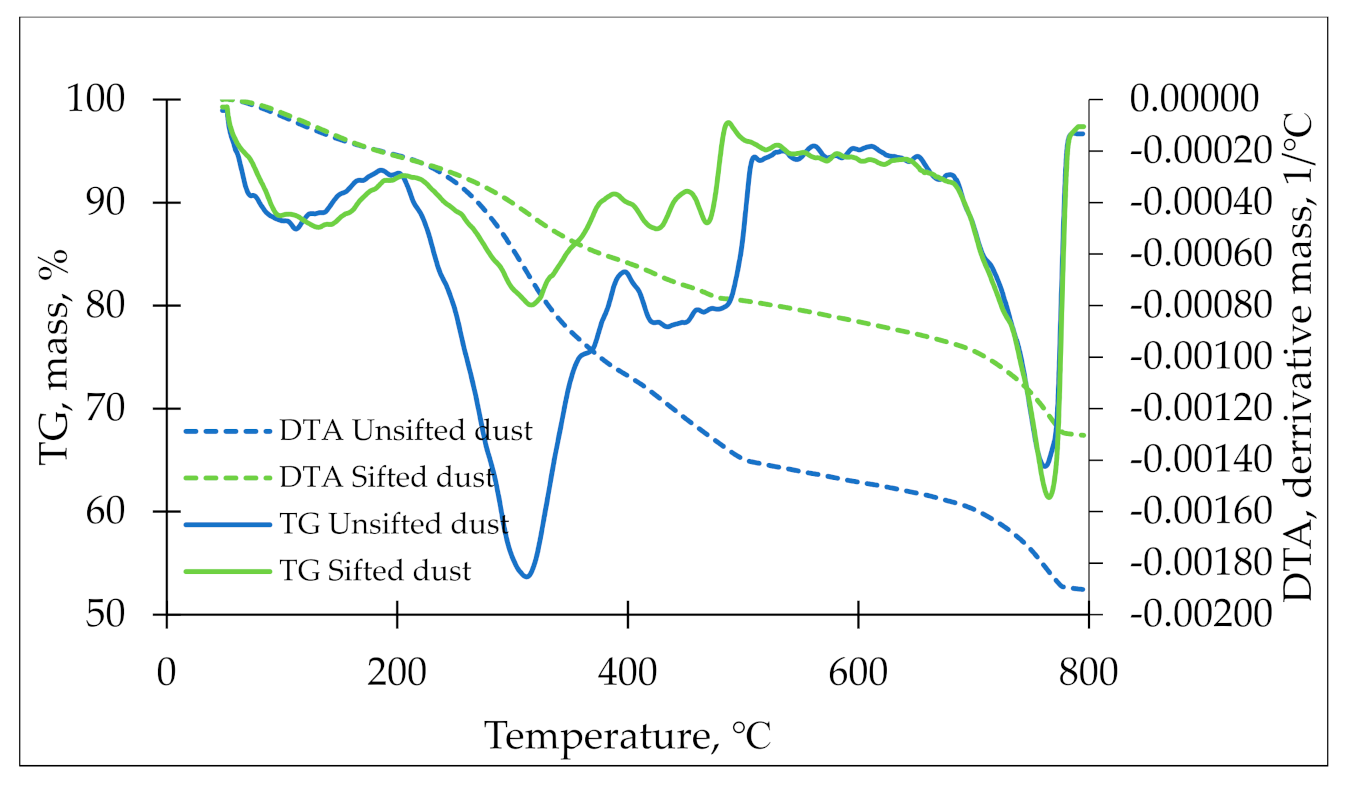
Thermal properties were characterized with the help of TG/DTA analysis for two samples—sifted and unsifted dust. As the sample is only 10 mg, it needed to be homogenous for a qualitative test. For that reason, both samples were ground for 10 min in a planetary mill. In Figure 13, TG/DTA curves are displayed. The solid line displays the TG and the dashed line—DTA results.
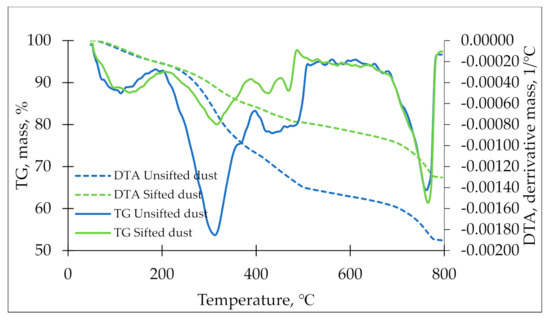
Figure 13.
TG/DTA curves for unsifted and sifted dust.
The left side of the curve shows the percentage change in weight, and the right side shows the derived change in weight. The two curves are similar, which means that sifting did not affect the chemical composition, although it changed the material by reducing the wood concentration. The blue curve is an unsifted dust curve in which we can observe that when the sample is heated to 800 °C, the mass decreases by 47.5%, of which 18% consists of wood particles that pyrolyze in the temperature range from 200 to 370 °C. The green curve sifted dust curve with a total weight loss of 32.6%, of which 10% is wood particles that pyrolyze in the temperature range of 204 to 390 °C. Table 7 shows the explanations for the DTA peaks.

Table 7.
Explanations for TG/DTA peaks.
In addition to XRD and TG/DTA, specific surface area and pore properties were determined for different samples. The data are compiled in Table 8. N10 is an unsifted sample that has been ground for 10 min in a planetary mill. The other three samples were sifted and differed with the grinding time. From the table, it can be seen that there is no significant change in surface area by an increase in grinding time. Sample N10 showed the lowest specific surface area, 7.649 m2/g, which can be explained by more wood content in the sample that decreases the overall specific surface area. Samples 10, 20, and 30 presented 8.990, 8.793, and 8.885 m2/g, respectively. Comparing pore volumes, pore diameters, and pore widths, no correlation was observed between the effect of grinding time, which means that more extensive research has to be carried out to evaluate the grinding effect of the processing waste’s specific surface area and pore properties for qualitative conclusions to be made.

Table 8.
Specific surface area and pore properties of the tested samples.
3.2. Mixture Design and Sample Preparation
Mixture designs were based on the analysis and testing of factors of interest. Table 9 compiles the mixture designs used in this study and their representative result chapter.

Table 9.
Mixture designs of the studied binder.
The curing conditions were chosen as room curing (RC), involving samples in common room conditions with a temperature of 23 ± 2 °C and relative humidity (RH) of 30–60%. Water curing (WC) was accomplished by immersing the samples in water for the rest of the curing time. Before testing, the samples were taken out of the water and dried in an oven at 45 °C for 24 h. In high-humidity curing (HHC) setting, samples were placed in plastic resealable bags, where moisture desorption from the samples created a microclimate inside the bag, raising the ambient relative humidity and providing additional moisture to the samples for continued curing.
The sifting process plays an essential role in forming the overall composition. The dust is sifted with a 0.25 mm mechanical sieve to remove as much wood as possible from the cement because the wood can release sugars and other organic compounds to the cement binder that work as retarders and decrease the cement’s compressive strength [31]. Sifting was performed before grinding in a planetary mill.
Samples with plasticizer were made according to the plasticizer’s instructions. “Dynamon SP-1” by MAPEI—a modified acrylic polymer, was used as a plasticizer. The plasticizer was added to the required amount of water 0.0043% by the weight of the dust and mixed. The water/plasticizer solution was added to the dust in an adequate ratio and mixed with a hand mixer.
A planetary mill was chosen as the grinding method of the dust, as it is energy-efficient in milling the samples based on energy consumption. Due to the combined action of the drum and the centrifugal drum and abrasive efforts, it is possible to achieve a highly dispersed powder [33]. Furthermore, increasing the grinding time can obtain a more reactive cementitious material.
The mini-slump test adjusted the water/binder ratio for all sample series to give a spread diameter of 15 to 17 cm after 20 jolts. The required amount of dust was poured into a mixing vessel, the appropriate volume of water and plasticizer solution was added, and the mortar was mixed for 2 min with a hand mixer at the speed of 300 RPM. After mixing, the spread diameter of the mortar was determined. If the spread diameter did not reach at least 15 cm, additional water was added to the mortar and mixed until the water was incorporated into the mortar. The mini-slump test was repeated until the spread diameter was within the required range after 20 jolts. The setting time with a Vicat device was determined after the mini-slump test based on standard BS 196-3 [63]. The mixed material was placed in molds (20 × 20 × 20 mm) and left to cure in the mold wrapped in plastic film (atmospheric pressure, 23 ± 2 °C) for the next five days. The samples were demolded, labelled, and placed in a resealable plastic bag to provide sufficient moisture for further curing for the next 28 days.
Sixteen sample series were made. Series differed with the grinding time, W/B ratio and curing conditions. Other external conditions were also tested to assess their impact on the material. The samples were tested on days 7, 14, and 28. For each test, six samples were tested to obtain more reliable results.
3.3. Characterization Techniques
Granulometry of dust was performed according to ASTM C136 [64] standard with a mesh size of 0.125 mm to 8 mm.
Following mixing, the material was put in a moistened cone on an ASTM C143 [47] impact table and compacted to prevent air entrapment. The cone was then raised, and the material’s viscosity is measured. The diameter and height of the cone were also measured. On the impact table, twenty thread twists were performed, resulting in twenty vertical jolts, and the reaction of the cone to this force is observed. The cone’s diameter was measured, and conclusions about the cone’s viscosity were made.
The thermal properties of the raw materials were determined with a MettlerToledo TGA1/SF thermogravimetric analysis device. At the same time, the Mettler STARe software helped obtain thermograms through which the change in mass and the release of destruction products could be determined. The mode used for analysis: 25–800 °C with 10 °C/min in air. The sample weighed about 10 mg.
A BRUKER-AXS D8 ADVANCE X-ray diffractometer (Bruker, Billerica, MA, USA) was used to characterize the dust using CuK1 and CuK2 radiation at a 2θ range of 5–70°.
Degassing was performed with the device “Autosorb Degasser Model AD-9”. For degassing, we selected 9 mm round sample cells. The weights of the samples were approximately 0.45–0.65 g; degassing time–24 h at 25 °C temperature.
The samples’ specific surface area and pore structure were analyzed using the Quadrasorb SI gas sorption system from low temperature (77 K or −196 °C) nitrogen physical adsorption–desorption isotherms. Specific surface values were obtained using the Brunauer–Emmett–Teller (BET) method.
The compressive strength of cubic specimens was tested at 0.5 mm/min using a Zwick Z100 universal testing system (ZwickRoell, Kennesaw, GA, USA). The cubic specimens were also measured before crushing to determine the material density and volume. The density of a sample was determined by dividing its mass by volume. The compressive strength was calculated using the force applied to the sample’s specific surface area. Samples were dried at 45 °C for 16 h before testing to remove excess water from the structure and tested on days 7, 14, and 28.
4. Conclusions
Compiling the gathered data shows that mechanical treatment of processed dust is a viable option for cement–wood wool board binder recycling. The compressive strength data show that mechanical dust grinding increases overall compressive strength without increasing the surface area. From the study, a few more conclusions have been made:
- After the data of the dust granulometry, it has been concluded that 99% of the particles are less than 2 mm, and it can be seen that large wood particles can be separated from the cement by sifting. The sifting process also improves the workability of the material, accelerates the onset time of setting, increases the bulk density of the samples by an average of 400 kg/m3, and improves the mechanical compressive strength by 3.55 MPa on day 28;
- The X-ray diffractograms for the dust showed the hydrate phases of portlandite, calcite, and calcium silicates, while the X-ray diffractograms for unsifted dust showed the amorphous cellulose phases.
- Mechanical treatment of the dust does not significantly affect its mineralogical composition. The sifting process affects the surface area of the dust, the surface area of the unsifted dust is 7.649 m2/g, and that of the sifted is 8.990 m2/g. Increasing the grinding time does not significantly affect the surface area of the dust;
- Thermogravimetric analysis showed weight loss for unsifted dust in the amount of 47.5%, of which 18% was wood particles, but for sifted dust, the total weight loss was 32.6%, of which 10% was wood particles;
- The best curing conditions were in high humidity, reaching 5 MPa, compared to the obtained 3 MPa, when the samples were cured in room conditions. It has been concluded that recycled hydrated cement paste will need an increased W/B ratio compared to virgin cement;
- By adding a plasticizer in the amount of 0.0043% of the weight of the dust, during the mixing procedure, it is possible to improve the mechanical compressive strength by 2.5 times, both on day 7 and day 28;
- By increasing the grinding time, it is possible to achieve a material that is easier to work with, at a W/B ratio of 0.7, as well as it is possible to achieve a faster onset of setting, but this does not significantly affect the total setting time;
- The grinding time does not affect the change in bulk density, but it affects the mechanical compressive strength; increasing the grinding time makes it possible to obtain a material with higher compressive strength.
Author Contributions
Conceptualization, P.P.A. and M.S.; methodology, P.P.A., M.S. and D.B.; formal analysis, P.P.A. and M.S.; investigation, P.P.A., M.S. and D.B.; resources, M.S. and D.B.; data curation, M.S.; writing—original draft preparation, P.P.A. and M.S.; writing—review and editing, P.P.A.; visualization, P.P.A.; supervision, M.S. and D.B.; project administration, D.B.; funding acquisition, M.S. and D.B. All authors have read and agreed to the published version of the manuscript.
Funding
This research was supported by Riga Technical University’s Doctoral Grant program.
Data Availability Statement
The data presented in this study are available on request from the corresponding author.
Acknowledgments
Pauls P. Argalis would like to express his gratitude to CEWOOD, Ltd. for supplying the materials used for the experiments.
Conflicts of Interest
The authors declare no conflict of interest.
References
- Statista Cement Production Worldwide from 1995 to 2021. Available online: https://www.statista.com/statistics/1087115/global-cement-production-volume/#:~:text= (accessed on 13 June 2022).
- 23 Construction Waste Statistics | BigRentz. Available online: https://www.bigrentz.com/blog/construction-waste-statistics (accessed on 14 June 2022).
- Preston, F.; Lehne, J. Making Concrete Change Innovation in Low-carbon Cement and Concrete; Chatham House, The Royal Institute of International Affairs: London, UK, 2018; ISBN 9781784132729. [Google Scholar]
- Ali, M.B.; Saidur, R.; Hossain, M.S. A review on emission analysis in cement industries. Renew. Sustain. Energy Rev. 2011, 15, 2252–2261. [Google Scholar] [CrossRef]
- Fayomi, G.U.; Mini, S.E.; Fayomi, O.S.I.; Ayoola, A.A. Perspectives on environmental CO2 emission and energy factor in Cement Industry. IOP Conf. Ser. Earth Environ. Sci. 2019, 331, 012035. [Google Scholar] [CrossRef]
- Imbabi, M.S.; Carrigan, C.; McKenna, S. Trends and developments in green cement and concrete technology. Int. J. Sustain. Built Environ. 2012, 1, 194–216. [Google Scholar] [CrossRef]
- Chen, C.; Habert, G.; Bouzidi, Y.; Jullien, A. Environmental impact of cement production: Detail of the different processes and cement plant variability evaluation. J. Clean. Prod. 2010, 18, 478–485. [Google Scholar] [CrossRef]
- Hasanbeigi, A.; Price, L.; Lin, E. Emerging energy-efficiency and CO 2 emission-reduction technologies for cement and concrete production: A technical review. Renew. Sustain. Energy Rev. 2012, 16, 6220–6238. [Google Scholar] [CrossRef]
- Ellis, L.D.; Badel, A.F.; Chiang, M.L.; Park, R.J.Y.; Chiang, Y.M. Toward electrochemical synthesis of cement—An electrolyzer-based process for decarbonating CaCO3 while producing useful gas streams. Proc. Natl. Acad. Sci. USA 2020, 117, 12584–12591. [Google Scholar] [CrossRef]
- Bajare, D.; Bumanis, G.; Šahmenko, G. High performance and conventional concrete properties affected by ashes obtained from different type of grasses. In Proceedings of the 12th International Conference on Recent Advances in Concrete Technology and Sustainability Issues 2012, Prague, Czech Republic, 30 October–2 November 2012; pp. 317–331. [Google Scholar]
- Bumanis, G.; Bajare, D. Compressive Strength of Cement Mortar Affected by Sand Microfiller Obtained with Collision Milling in Disintegrator. Procedia Eng. 2017, 172, 149–156. [Google Scholar] [CrossRef]
- Dembovska, L.; Bajare, D.; Pundiene, I.; Vitola, L. Effect of Pozzolanic Additives on the Strength Development of High Performance Concrete. Procedia Eng. 2017, 172, 202–210. [Google Scholar] [CrossRef]
- Małek, M.; Jackowski, M.; Łasica, W.; Dydek, K.; Boczkowska, A. An experimental study of possible post-war ferronickel slag waste disposal in szklary (Lower silesian, poland) as partial aggregate substitute in concrete: Characterization of physical, mechanical, and thermal properties. Materials 2021, 14, 2552. [Google Scholar] [CrossRef]
- Jackowski, M.; Małek, M.; Zyciñski, W.; Lasica, W.; Owczarek, M. Characterization of new recycled polymer shots addition for the mechanical strength of concrete. Mater. Tehnol. 2020, 54, 355–358. [Google Scholar] [CrossRef]
- Snellings, R. Assessing, Understanding and Unlocking Supplementary Cementitious Materials. RILEM Tech. Lett. 2016, 1, 50. [Google Scholar] [CrossRef]
- Carriço, A.; Bogas, J.A.; Hu, S.; Real, S.; Costa Pereira, M.F. Novel separation process for obtaining recycled cement and high-quality recycled sand from waste hardened concrete. J. Clean. Prod. 2021, 309, 127375. [Google Scholar] [CrossRef]
- Akbarnezhad, A.; Ong, K.C.G.; Zhang, M.H.; Tam, C.T.; Foo, T.W.J. Microwave-assisted beneficiation of recycled concrete aggregates. Constr. Build. Mater. 2011, 25, 3469–3479. [Google Scholar] [CrossRef]
- Bru, K.; Touzé, S.; Bourgeois, F.; Lippiatt, N.; Ménard, Y. Assessment of a microwave-assisted recycling process for the recovery of high-quality aggregates from concrete waste. Int. J. Miner. Process. 2014, 126, 90–98. [Google Scholar] [CrossRef]
- Bumanis, G.; Vitola, L.; Stipniece, L.; Locs, J.; Korjakins, A.; Bajare, D. Evaluation of Industrial by-products as pozzolans: A road map for use in concrete production. Case Stud. Constr. Mater. 2020, 13, e00424. [Google Scholar] [CrossRef]
- Wei, Y.M.; Zhou, Y.G.; Tomita, B. Study of hydration behavior of wood cement-based composite II: Effect of chemical additives on the hydration characteristics and strengths of wood-cement composites. J. Wood Sci. 2000, 46, 444–451. [Google Scholar] [CrossRef]
- Ramirez-Coretti, A.; Eckelman, C.A.; Wolfe, R.W. Inorganic-bonded composite wood panel systems for low-cost housing: A central American perspective. For. Prod. J. 1998, 48, 62–68. [Google Scholar]
- Simatupang, M.H.; Geimer, R.L. Inorganic binder for wood composites: Feasibility and limitations. Proceeding Wood Adhes. Symp. 1990, 169, 176. [Google Scholar]
- Jorge, F.C.; Pereira, C.; Ferreira, J.M.F. Wood-cement composites: A review. Holz Als Roh—Werkst. 2004, 62, 370–377. [Google Scholar] [CrossRef]
- Rahman, R.; Mei, C.; Muhammad, Y.; Bin, K.; Editors, B. Engineering Materials Waste Materials in Advanced Sustainable Concrete Reuse, Recovery and Recycle; Springer Nature: Cham, Switzerland, 2022. [Google Scholar]
- Letelier, V.; Tarela, E.; Muñoz, P.; Moriconi, G. Combined effects of recycled hydrated cement and recycled aggregates on the mechanical properties of concrete. Constr. Build. Mater. 2017, 132, 365–375. [Google Scholar] [CrossRef]
- Shui, Z.; Xuan, D.; Wan, H.; Cao, B. Rehydration reactivity of recycled mortar from concrete waste experienced to thermal treatment. Constr. Build. Mater. 2008, 22, 1723–1729. [Google Scholar] [CrossRef]
- Gailitis, R.; Figiela, B.; Abelkalns, K.; Sprince, A.; Sahmenko, G.; Choinska, M.; Guigou, M.D. Creep and shrinkage behaviour of disintegrated and non-disintegrated cement mortar. Materials 2021, 14, 7510. [Google Scholar] [CrossRef] [PubMed]
- Korkmaz, A.V. Mechanical activation of diabase and its effect on the properties and microstructure of Portland cement. Case Stud. Constr. Mater. 2022, 16, e00868. [Google Scholar] [CrossRef]
- Sekulic, Z.; Petrov, M.; Zivanovic, D. Mechanical activation of various cements. Int. J. Miner. Process. 2004, 74, S355–S363. [Google Scholar] [CrossRef]
- Gebler, S.H.; Jones, C.L.; Brogna, D.; Cabrera, J.; Cornell, J.N., II; Dilly, R.L.; Dongell, J.E.; Edwards, B.E.; Firth, D.; Ford, J.H.; et al. Guide to Concrete Curing. Am. Concr. Inst. 2008, 308R9–308R11. [Google Scholar]
- Tsoumis, G.T. Wood—Hygroscopicity. Available online: https://www.britannica.com/science/wood-plant-tissue/Hygroscopicity (accessed on 27 July 2022).
- Mahzabin, S.; Hamid, R.; Badaruzzaman, W.H.W. Evaluation of chemicals incorporated wood fibre cement matrix properties. J. Eng. Sci. Technol. 2013, 8, 385–398. [Google Scholar] [CrossRef]
- Fediuk, R.S. Mechanical Activation of Construction Binder Materials by Various Mills. IOP Conf. Ser. Mater. Sci. Eng. 2016, 125, 012019. [Google Scholar] [CrossRef]
- Xu, X.; Jin, Z.; Yu, Y.; Li, N. Impact properties of Ultra High Performance Concrete (UHPC) cured by steam curing and standard curing. Case Stud. Constr. Mater. 2022, 17, e01321. [Google Scholar] [CrossRef]
- Wang, Y.; Li, Y.; Su, Y.; He, X.; Strnadel, B. Preparation of waste glass powder by different grinding methods and its utilization in cement-based materials. Adv. Powder Technol. 2022, 33, 103690. [Google Scholar] [CrossRef]
- Hiremath, P.N.; Yaragal, S.C. Effect of different curing regimes and durations on early strength development of reactive powder concrete. Constr. Build. Mater. 2017, 154, 72–87. [Google Scholar] [CrossRef]
- Chung, S.Y.; Kim, J.S.; Lehmann, C.; Stephan, D.; Han, T.S.; Elrahman, M.A. Investigation of phase composition and microstructure of foamed cement paste with different supplementary cementing materials. Cem. Concr. Compos. 2020, 109, 103560. [Google Scholar] [CrossRef]
- Mindess, S. (Ed.) Developments in the Formulation and Reinforcment of Concrete; Woodhead Publishing Limited: Cambridge, UK, 2019; ISBN 9780081026168. [Google Scholar]
- Xiaobing, Y.; Zepeng, Y.; Weiguang, L.; Leiming, W.; Shenghua, Y. Effect of Slag Gypsum Binder as a Substitute to Cement on the Stability of Backfill Mining. Front. Mater. 2022, 9, 139. [Google Scholar] [CrossRef]
- Sousa, C.; Souza, N.L.; Rosse, V.; da Silveira, P.H.; Barbosa, M.T. Utilisation of dairy waste as a release agent and plastisizer for civil construction. Int. J. Sustain. Eng. 2021, 14, 2074–2081. [Google Scholar] [CrossRef]
- Peter, J.A.; Gopalakrishnan, S.; Lakshmanan, N.; Rajamane, N.P.; Manoharan, P.D. Studies on proportioning of Self-compacting Concrete and evaluation of its strength and durability related characteristics. In Proceedings of the Role of Cement Science in Sustainable Development—Proceedings of the International Symposium—Celebrating Concrete: People and Practice, Scotland, UK, 3–4 September 2003; ICE Publishing: London, UK, 2003; pp. 463–476. [Google Scholar]
- Berger, F.; Gauvin, F.; Brouwers, H.J.H. The recycling potential of wood waste into wood-wool/cement composite. Constr. Build. Mater. 2020, 260, 119786. [Google Scholar] [CrossRef]
- Shahidul, M.I.; Malcolm, M.L.; Hashmi, M.S.J.; Alhaji, M.H. Waste Resources Recycling in Achieving Economic and Environmental Sustainability: Review on Wood Waste Industry. In Encyclopedia of Renewable and Sustainable Materials; Elsevier: Amsterdam, The Netherlands, 2020; pp. 965–974. [Google Scholar]
- Yang, Y.; Li, X. Study on compatibility of poplar wood and Portland cement. Constr. Build. Mater. 2022, 314, 125586. [Google Scholar] [CrossRef]
- Li, B.; Hang, M.Y.; Dong, S.F. Experimental study of slag powder fineness effect on concrete performance. Appl. Mech. Mater. 2013, 405–408, 2631–2634. [Google Scholar] [CrossRef]
- Lagerblad, B.; Vogt, C. Ultrafine Particles to Save Cement and Improve Concrete Properties; Cement och Betong Institutet: Stockholm, Sweden, 2004. [Google Scholar]
- ASTM D2202-00(2012); Standard Test Method for Slump of Sealants. ASTM International: West Conshohocken, PA, USA, 2012; pp. 1–4.
- Lu, X.; Hu, Y. Layer-by-layer deposition of TiO2 nanoparticles in the wood surface and its superhydrophobic performance. BioResources 2016, 11, 4605–4620. [Google Scholar] [CrossRef]
- Zimmermann, T.; Richter, K.; Bordeanu, N.; Sell, J. Arrangement of cell-wall constituents in chemically treated Norway spruce tracheids. Wood Fiber Sci. 2007, 39, 221–231. [Google Scholar]
- Goodell, B.; Zhu, Y.; Kim, S.; Kafle, K.; Eastwood, D.; Daniel, G.; Jellison, J.; Yoshida, M.; Groom, L.; Pingali, S.V.; et al. Modification of the nanostructure of lignocellulose cell walls via a non-enzymatic lignocellulose deconstruction system in brown rot wood-decay fungi. Biotechnol. Biofuels 2017, 10, 1–15. [Google Scholar] [CrossRef]
- Doudart de la Grée, G.C.H.; Yu, Q.L.; Brouwers, H.J.H. Assessing the effect of CaSO4 content on the hydration kinetics, microstructure and mechanical properties of cements containing sugars. Constr. Build. Mater. 2017, 143, 48–60. [Google Scholar] [CrossRef]
- Santos, T.A.; De Oliveira Silva, G.A.E.; Ribeiro, D.V. Mineralogical analysis of portland cement pastes rehydrated. J. Solid Waste Technol. Manag. 2020, 46, 15–23. [Google Scholar] [CrossRef]
- Zhang, Q.; Ye, G. Dehydration kinetics of Portland cement paste at high temperature. J. Therm. Anal. Calorim. 2012, 110, 153–158. [Google Scholar] [CrossRef]
- Alonso, C.; Fernandez, L. Dehydration and rehydration processes of cement paste exposed to high temperature environments. J. Mater. Sci. 2004, 39, 3015–3024. [Google Scholar] [CrossRef]
- Ermilova, E.; Kamalova, Z. The influence of complex additives based on calcined clays and carbonate fillers on hydration products composition of blended cement stone. E3S Web Conf. 2021, 274, 1–8. [Google Scholar] [CrossRef]
- Mohsen, A.; Aiad, I.; El-Hossiny, F.I.; Habib, A.O. Evaluating the Mechanical Properties of Admixed Blended Cement Pastes and Estimating its Kinetics of Hydration by Different Techniques. Egypt. J. Pet. 2020, 29, 171–186. [Google Scholar] [CrossRef]
- Ermilova, E.; Kamalova, Z.; Ravil, R. Influence of clay mineral composition on properties of blended portland cement with complex additives of clays and carbonates. IOP Conf. Ser. Mater. Sci. Eng. 2020, 890, 012087. [Google Scholar] [CrossRef]
- Angelescu, N.; Stanciu, D.; Barroso de Aguiar, J.; Abdelgader, H.S.; Bratu, V. Role of Superplasticizer Additives Upon Hydration Process of Cement Pastes. Sci. Bull. Valahia Univ.—Mater. Mech. 2016, 14, 23–26. [Google Scholar] [CrossRef][Green Version]
- Lazǎu, I.; Pǎcurariu, C.; Ciobanu, C. The use of thermal analysis to investigate the effects of cellulose ethers on the Portland cement hydration. J. Therm. Anal. Calorim. 2012, 110, 103–110. [Google Scholar] [CrossRef]
- Fraga, L.G.; Teixeira, S.; Soares, D. Behavior and Kinetics of Pine Wood Particles Using. Energies 2020, 13, 1–22. [Google Scholar]
- Bhaumik, M.L.; Sircar, A.K.; Banerjee, D. Application of differential thermal analysis in hard rubber reactions. J. Appl. Polym. Sci. 1960, 4, 366–367. [Google Scholar] [CrossRef]
- Ye, G.; Liu, X.; De Schutter, G.; Poppe, A.M.; Taerwe, L. Influence of limestone powder used as filler in SCC on hydration and microstructure of cement pastes. Cem. Concr. Compos. 2007, 29, 94–102. [Google Scholar] [CrossRef]
- BS EN 196-3:1995; Methods of Testing Cement. Part 3: Determination of Setting Time and Soundness. British Standards Institution: London, UK, 1995; p. 10.
- ASTM C136-06; Standard Test Method for Sieve Analysis of Fine and Coarse Aggregates. ASTM International: West Conshohocken, PA, USA, 2011; pp. 5–9.
Publisher’s Note: MDPI stays neutral with regard to jurisdictional claims in published maps and institutional affiliations. |
© 2022 by the authors. Licensee MDPI, Basel, Switzerland. This article is an open access article distributed under the terms and conditions of the Creative Commons Attribution (CC BY) license (https://creativecommons.org/licenses/by/4.0/).

