Article

Use of a Design of Experiments (DOE) for Studying the Substitution of Natural River Sand (NRS) by Gold Mine Tailings (GMT) in Concrete Manufacturing

by
Clarisse Njovu Balegamire
1,2,3,*,
Pierre Jean-Marie Dable
1,
Kouwelton Kone
4 and
Bossissi Nkuba
3
1
Institut National Polytechnique Félix Houphouët-Boigny (INP-HB), Centre d’Excellence Africain en Mines et Environnement Minier (CEA-MEM), Laboratoire 2-TSIPM, Yamoussoukro 1093, Côte d’Ivoire
2
Centre de Recherche en Sciences Naturelles—Lwiro (CRSN-Lwiro), Lwiro D.S Bukavu, Bukavu, Congo
3
Centre d’Expertise en Gestion Minière (CEGEMI), Université Catholique de Bukavu, Bukavu, Congo
4
Institut National Polytechnique Félix Houphouët-Boigny (INP-HB), Laboratoire LAPISEEN, Yamoussoukro 1093, Côte d’Ivoire
*
Author to whom correspondence should be addressed.
Recycling 2022, 7(4), 50; https://doi.org/10.3390/recycling7040050
Submission received: 25 October 2021 / Revised: 18 December 2021 / Accepted: 24 December 2021 / Published: 26 July 2022

Abstract

:
The extraction of precious minerals leaves behind an important amount of tailings. When stored in nature, these tailings contribute to environmental degradation. To reduce this degradation, tailings are incorporated in construction as substitute to natural materials. The objective of this study was to use a design of experiments (DOE) to reveal how the substitution of natural river sand (NRS) by gold mine tailings (GMT) in concrete manufacturing can be optimally achieved. This DOE considered three constituents: the amounts of NRS/GMT, that of gravel and of cement. The experimental domain was defined within the concrete standards dosage of 350 kg/m3 and 400 kg/m3 as the lower and upper levels, respectively. The smallest compressive strength on standard cubic specimens on the 28th day varied between 11 N/mm2 and 37 N/mm2 following to the experimental domain. The values of the compressive strength of the experiments carried out allowed to acquire the model of the strength with the coefficients of each factor: S t r e n g t h = 23.25 5.86 * A + 4.56 * B 1.96 * C 0.56 * A * B + 1.41 * A * C + 1.08 * B * C + 0.71 * A * B * C (with A: GMT+NRS; B: cement; C: gravel). The values of the cumulative weight of the coefficients of each factor were 36.7% (A), 64.5% (B) and 76.6% (C). The study also found that a larger dosage of gravel (40 kg) improves the concrete compressive strength when GMT substitutes NRS between 70% and 100% and when 15 kg of cement is used. For a sustainable and better reuse of GMT as construction materials, an economic and environmental study (the leaching of metals) of the concrete based on GMT would be ideal to consider a large scale production.

1. Introduction

The extraction of minerals leaves behind an important number of tailings. When stored in nature, these tailings represent an environmental and health risk [1,2]. Indeed, piles of tailings, when stored in nature, end up contaminating soils with high concentrations of trace metals [2]. Agricultural and pastoral activities in the vicinity of these piles constitute a pathway for these toxic metals to enter the food chain and become a health risk for plants, livestock and human populations. Acid mine drainage leaks from tailings impoundments are also observed in nature as a result of tailings impoundment failures [1]. In extreme cases, the failure of tailings facilities causes not only environmental pollution but also loss of human lives [3] The environmental degradation is even more pronounced in the artisanal mining sector, since tailings management is almost non-existent [4].
Tools and techniques for optimal management of tailings have been developed to limit storage related accidents. For example, improving mechanical and hydraulic properties to maintain tailings chemical stability in the facilities [5]. However, the economics do not always favor these tools and techniques. Indeed, beyond the performance and safety a tailing facility may reach, its management and maintenance are very expensive [6].
The valorization of tailings is defined either as recycling (i.e., using tailings as secondary mines by extracting residual minerals and/or other types of minerals), as reuse (using tailings in a different way than its first use), or as recycling followed by reuse [7,8]. Either of these processes has the benefit of reducing the total amount of tailings by incorporating them into other products as substitutes to natural materials. Recently, more and more interest from the scientific community is granted both to recycling and to giving value to tailings as a construction material [9]. The substitution of tailings for construction materials minimizes their environmental impacts. Indeed, Mabroum et al. (2020) [10] showed that the use of tailings in geopolymers stabilizes them in the geopolymer matrix. Ince (2019) [11] proved in his study that cement substitution by GMT allows a reduction of CO2 emission up to 22%. On an economic front, Taha (2017) [12] showed that the use tailings as construction materials decreases the costs of storing the tailings on the surface and produces cheaper construction materials with an opportunity for job creation.
A few studies have shown the possibility of a partial substitution of natural river sand (NRS) by GMT in concrete manufacturing [11,12,13,14,15,16]. In general, partial substitution varies between 5 and 30% of natural sand, since beyond 30% of substitution, the concrete compressive strength was decreasing. In the study of Ramalinga Reddy et al. (2016) [14], the substitution of natural sand at 10, 20 and 30% with GMT even showed that beyond 20% the strength decreased while for Parthasarathi et al. (2016) [17], the results of substitution at 10% were moderately satisfactory and very poor at 30% substitution. Widojoko et al. (2014) [16] experimented substituting fine aggregate materials by GMT beyond 25% (at 25, 50, 75, and 100%) and also found that beyond 25% the strength decreased. This study also showed that additives may improve the concrete strength but at more than 50% of substitution they had no effect on the concrete strength. It was noticed that when unsatisfactory results were obtained in these studies, the experiments were stopped though by considering smaller substitution intervals, more and more precise conclusions were obtained. This was the case of the study of Preethi et al. (2017) [13] in which the substitution at 5, 10, 15, 20 and 25 showed that the best results of concrete strength for the replacement of natural sand by GMT are between 5 and 15% of substitution. The use of strength prediction models can help to overcome this limit and to have specific values of coefficients weights of the factors of the model.
The appropriate level of substitution of natural materials by GMT also depends on the nature of these substituted materials [18] but also on the purpose of substitution [19]. Ahmed et al. (2021) [18] studied ultra-high performance concrete using GMT in place of quartz sand. It was shown that substituting up to 80% of the quartz sand with GMT maintained or even increased compressive strength compared using 100% quartz sand. Kunt et al. (2015) [19] found satisfactory results at 5% substitution using GMT as an additive in the mortar.
One of the solutions to find the best level substitution while taking into account the variation in other factors such as the amount of cement or that of gravel used is a design of experiment (DOE). According to the history, the use of DOE in large industrial companies contributed to their development around the 1950s in Japan, 1970s in the USA and 1980s in Europe. DOE is defined by ISO 3534-3 standard as an ordered sequence of tests in an experiment. It allows to know the degree of contribution of each component (cement, gravel, GMT and NRS) with their possible interactions on the concrete compressive strength and to deduce an ideal dosage model of desired resistance. It thus has the advantage of having a maximum of information with a minimum of experiments [20]. The DOE makes possible to have all the values of the compressive strength of the experimental domain from some experiments carried out from the model of the strength. It allows to determine the optimal values of the concrete dosage in which the GMT substitute the NRS.
The objective of this study was to use a design of experiments (DOE) to reveal how the substitution of natural river sand (NRS) by gold mine tailings (GMT) in concrete manufacturing can be optimally achieved.
In this study, it was attempted to investigate the substitution of NRS for GMT in concrete with a planned experimentation which consists of a DOE for a specific experimental domain.

2. Materials and Method

2.1. Materials

To mix the concrete, GMT, NRS, cement, gravel and water were used. The GMT used comes from one of the artisanal gold mining sites in the East of the DR Congo with more than half of silica followed by chlorite (21.6%) and whose granulometry was composed of 75% sand and 25% silt and clay [21]. The GMT came from one of the artisanal mining sites where gold is exploited in a semi-industrial manner and tailings are dumped in nature without respecting environmental standards. The NRS was a washed sand consisting of more than 95% of sand itself. The cement used was a pozzolanic Portland cement of class CEM II/B-P 32.5N. This cement was chosen for its wide use and availability on the market in our study area as well as its lower cost. The gravel used had a diameter between 4 and 12 mm and more than 65% of particles have 8 and 10 mm of diameter.
The standard cubic metal molds used was 150 × 150 (mm).

2.2. Method

A planned experimentation organized in a DOE was used in this study with a full factorial design to investigate the influences of all experimental variables, factors, and interaction effects on the response or responses [20]. The number of experiments was 8 based the formula: N = nk with n, the number of levels (it was mainly used maximum and minimum values of each factor) and k, the number of factors in the experiment (three factors: GMT/NRS, gravel and cement). In addition to the 8 experiments, 3 replicates of average values (of GMT/NRS, gravel and cement) were used to calculate the experimental error of the results from the 8 main experiments.
The DOE followed several steps, the most important of which were: the identification of the factors and responses, the definition of the experimental domain, the establishment of the coded matrix followed by the experimentation matrix, the carrying out of the tests, the analysis of the results and the acquisition of the model.

2.2.1. Identification of Factors and Responses

The factors selected to study the phenomenon were three:
  • The quantity (mass) of cement;
  • The quantity (mass) of gravel;
  • The quantity (mass) of the GMT + NRS mixture.
The response that was observed was the concrete compressive strength.

2.2.2. Definition of the Experimental Domain

Practically, we used the concrete standard dosages of 350 kg/m3 and 400 kg/m3 as a guide for setting the experimental domain (Table 1). The quantity of gravel was fixed based on the experiments of de Larrard (1999) [22] assessing the level to which gravel has an influence on the concrete compressive strength when the sand is fine. The maximum and minimum values of the experimental domain were defined in order to have for each experiment (dosage) at least 9 specimens. This was to allow at least 3 specimens for each crushing age (at 7, 14 and 28 days) for the compression test. Table 1 summarizes the experimental domain chosen for each factor in the DOE.
From the definition of the experimental domain, the following steps were followed.

2.2.3. Coded Matrix and Matrix of Experiments

In the coded matrix are the experiments at the center level (Table 2) and the experiments of the DOE. The coded matrix (Table 3) was derived from the mathematical basis of the DOE. It was based on the fact that each factor having two levels and having three factors, refers to 23 (8) experiments with the center levels, repeated three times. The center level is the average of each maximum and minimum value of the component and were experimented three times. The center levels are used to calculate the experimental error [20]. The coded matrices and experiments the DOE are showed in Table 3 and Table 4, where the tests 9, 10 and 11 are the center levels (Table 2).
The test 07 for example corresponds to the following dosage: 100% of the GMT (20 kg), the minimum value of the experimental domain of cement (10 kg) and the maximum value of the experimental domain of gravel (40 kg). For test (dosage) 03 as well, 100% of the NRS and the same quantities of cement and gravel as in dosage 07 are taken into account.
The constituent “water” was added to the three others mentioned above (GMT + NRS, cement and gravel) in order to have a firm concrete according to the Abram cone referring to the NF EN 206-1 [23]. Under these conditions, the maximum value of water added was 11 L and the minimum value was 5.2 L.
For the center levels, water was also added in the same conditions of the eight experiments or dosages. Water was added until the concrete was firm according to the Abram cone of the NF EN 206-1 [23]. In these conditions we used 8 L of water. Following the logic of the center level which requires to take into account for each factor the average of its maximum and minimum values; the ideal value for the center level in the DOE according to the defined experimental domain was (11 L + 5.2 L)/2 which is 8.1 L.

2.2.4. Mixing and Manufacture of Specimens

The mixing in the mortar was carried out in the open air at an ambient temperature between 23 °C and 25 °C. A common procedure was used for mixing for all experiments (tests or dosages). After weighing all the constituents according to whether the maximum or minimum values of the experimental domain was used, the GMT and/or the NRS with the cement were mixed. Once this mixture was homogeneous, gravel was added and then the mixture was homogenized again. After that, water was added progressively until to acquire a firm concrete according to the norm NF EN 206-1 [23].
Once the concrete was ready, the specimens preparation of began according to the standard NBN EN 12390-2 [23]. Standard metal molds were used to have cubic specimens with length, width and height measuring 150 mm with the surface to be compressed of 225 cm2. The concrete was filled into the molds manually in three layers. After the addition of each layer of concrete, using a metal rod 25 blows were made in the concrete before adding the next layer (NBN EN 12390-2, 2009). A total of 99 specimens were made for the 11 experiments (dosages).
Twenty-four hours after filling the metal molds, the specimens were removed from the molds to be placed in a water tank for 7, 14 or 28 days depending on the desired age for crushing (compression test).

2.2.5. Compression Tests

The compression test was performed by the day 7, 14 and 28 for all dosages and tests at the center level (NBN EN 12390-3, 2011) [23]. For each experiment (dosage) at least 3 specimens were crushed to calculate the compressive strength at different ages of the hardened concrete (7, 14 and 28). Before crushing, the specimens were removed from the water tanks, drained and dried. The values of the concrete compressive strength at 28 days were considered in the analysis of the results in this document [24].

2.2.6. Experimental Design Response Modeling

The modeling was carried out according to the principle of DOE, following the defined experimental domain as described by Torbjorn et al. (1998) [20]. The responses or results (the different compressive strengths at day 28 according to this study for each of the dosages) are described as a function y = f(x) in Equation (1). This function was obtained by a linear regression which is a matrix product between the transpose of the affiliated coded matrix of interaction terms and the vector of responses. The Equation (1) obtained is in the form below:
Y = a 0 + a 1 X 1 + a 2 X 2 + a 3 X 3 + a 12 X 1 X 2 + a 13 X 1 X 3 + a 23 X 2 X 3 + a 123 X 1 X 2 X 3
With: a = factor coefficient; x = factor
The experimental error was then determined from the tests at the center level, which allowed us to determine the significant coefficients of the model. The coefficient is significant if its absolute value is greater than two times the experimental error.
To have the Equation (1), the coefficient a0 was calculated by averaging the matrix of response Y. For the other coefficients of the model’s Equation (1), it’s a matrix multiplication between the transpose of factor’s matrix with the response matrix which is divided by the number of experiments. For example, for the coefficient of factor Gravel a3 in Equation (2):
a 3 = 1 8 * C t * Y = 1 8 * ( [ 1 1 ] * [ y 1 y 8 ] )
With: a3 the coefficient of the third factor X3 (gravel); Ct the transpose of factor’s matrix and Y the response matrix.
The Equation (1) was analyzed using the Parito method and the horizontal bar graph. The Pareto method suggests that 20% of the factors explain 80% of the response. The horizontal bar graph shows the influence of each factor in the model.

3. Results and Discussion

3.1. Responses of the DOE

The compressive strength of each of the experiments of the DOE is shown in Table 5. The compressive strength on day 28 varied between 11 and 37 N/mm2. The compressive strength of 11 N/mm2 occurred when there was total substitution of NRS by GMT with: 20 kg of GMT (0 kg of NRS), 10 kg of cement and 40 kg of gravel. The strength of 37 N/mm2 corresponded to the dosage of 20 kg of NRS (0 kg of GMT), 15 kg of cement and 25 kg of gravel.
The calculated coefficients of the model of the Equation (1) as a function of the responses (compressive strength at 28 days) are in the Equation (3) below:
S t r e n g t h = 23.25 5.86 * A + 4.56 * B 1.96 * C 0.56 * A * B + 1.41 * A * C + 1.08 * B * C + 0.71 * A * B * C
With: A = (NRS + GMT); B = cement; C = gravel
From the Equation (3) above, in the constitution of the concrete, the constituents retained in the DOE showed the degree of the influence of each one on the concrete compressive strength. The “weight” of a factor indicates the degree of its influence on the compressive strength (Table 6). This calculated parameter (weight) is the double of the absolute value of the coefficient of the model term (Table 6). It quantifies the degree of influence of each factor on the observed response. It is clear that the NRS + GMT factor has the greatest weight and therefore the greatest influence on the concrete strength.
In accordance with the Pareto method that suggests that 20% of the factors explain 80% of the response and knowing the weights of the influence of each factor on the response, factors which contribute to 80% of the concrete compressive strength were estimated in Table 7. In this table it is noticed in order of importance that the factors “NRS + GMT”, “cement” and “gravel” influenced together more than 76% of the concrete compressive strength. The Figure 1 illustrates the numbers in Table 7 by highlighting in green the significant factors (the most influential on the concrete).
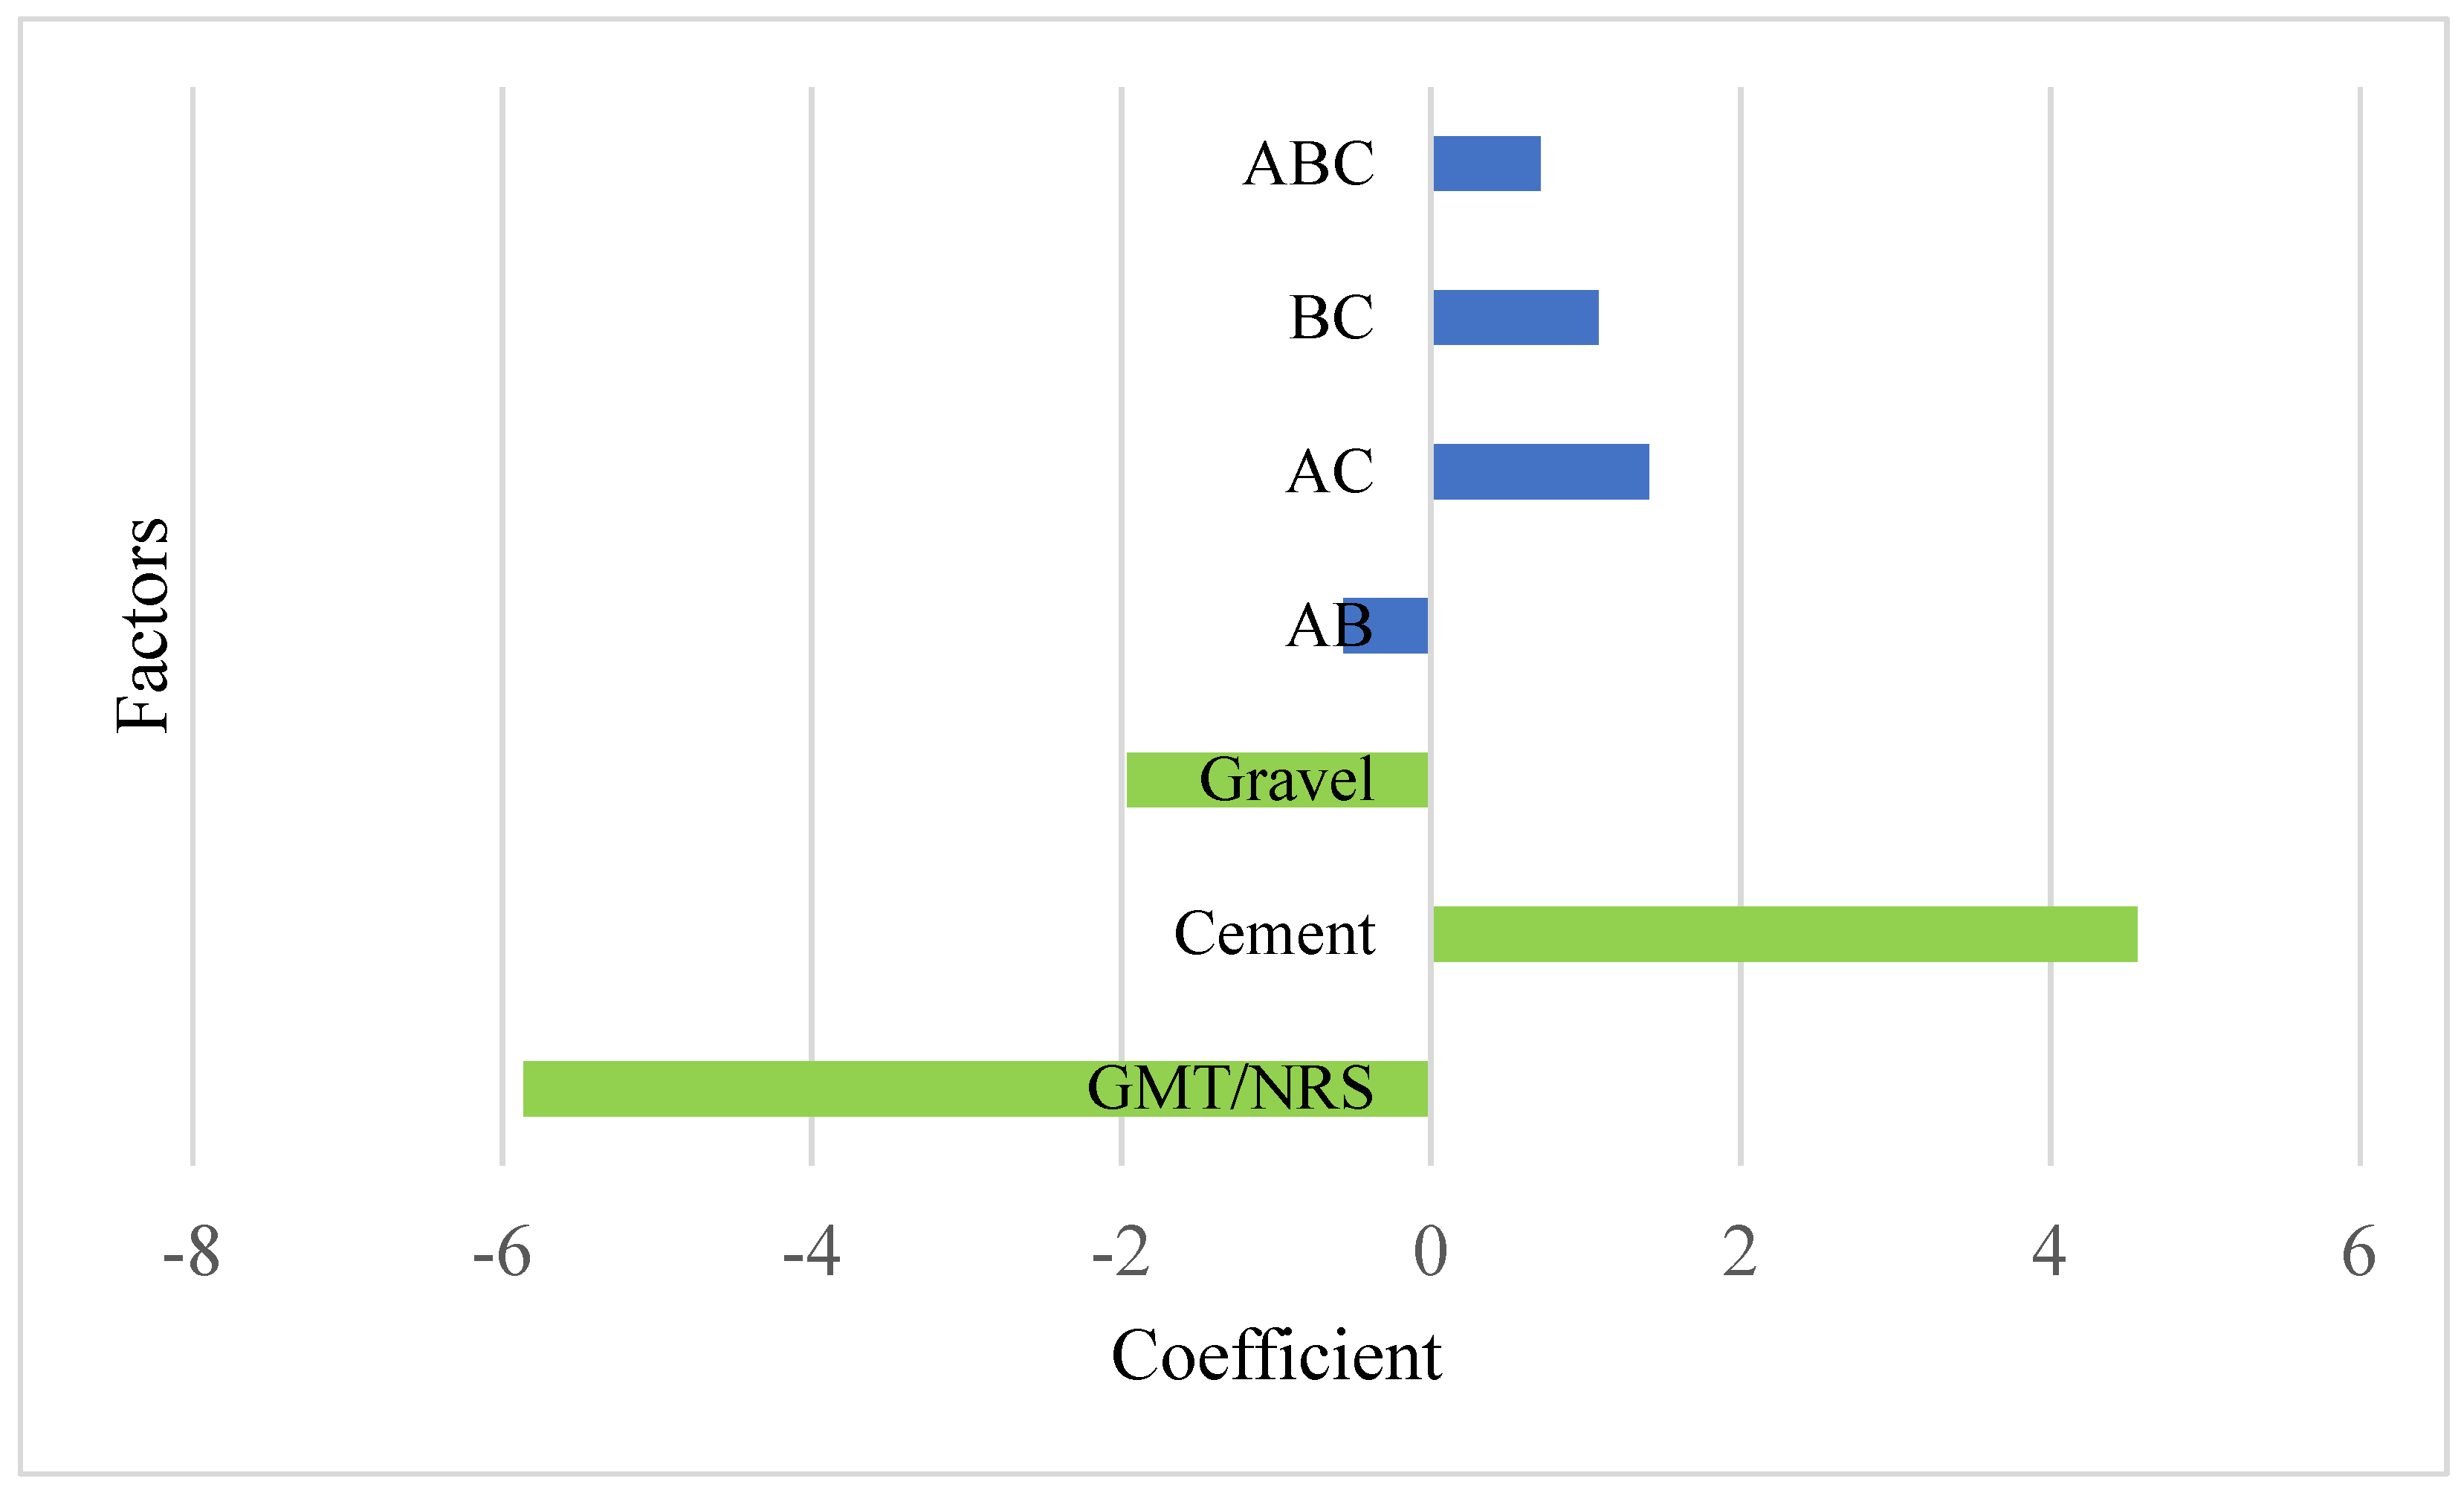
Similarly, the horizontal bar graph (Figure 2) representing the coefficients and factors, shows that cement has a positive influence on the concrete compressive strength. In other words, the concrete compressive strength increases with the mass of cement, while gravel and NRS + GMT have a negative influence on the concrete compressive strength. The concrete compressive strength increases if the amount of cement is continuously increased. Therefore, if gravel and NRS + GMT are continuously added, the concrete compressive strength decreases.

3.2. Analysis of the Individual Contribution of Each Concrete Constituent

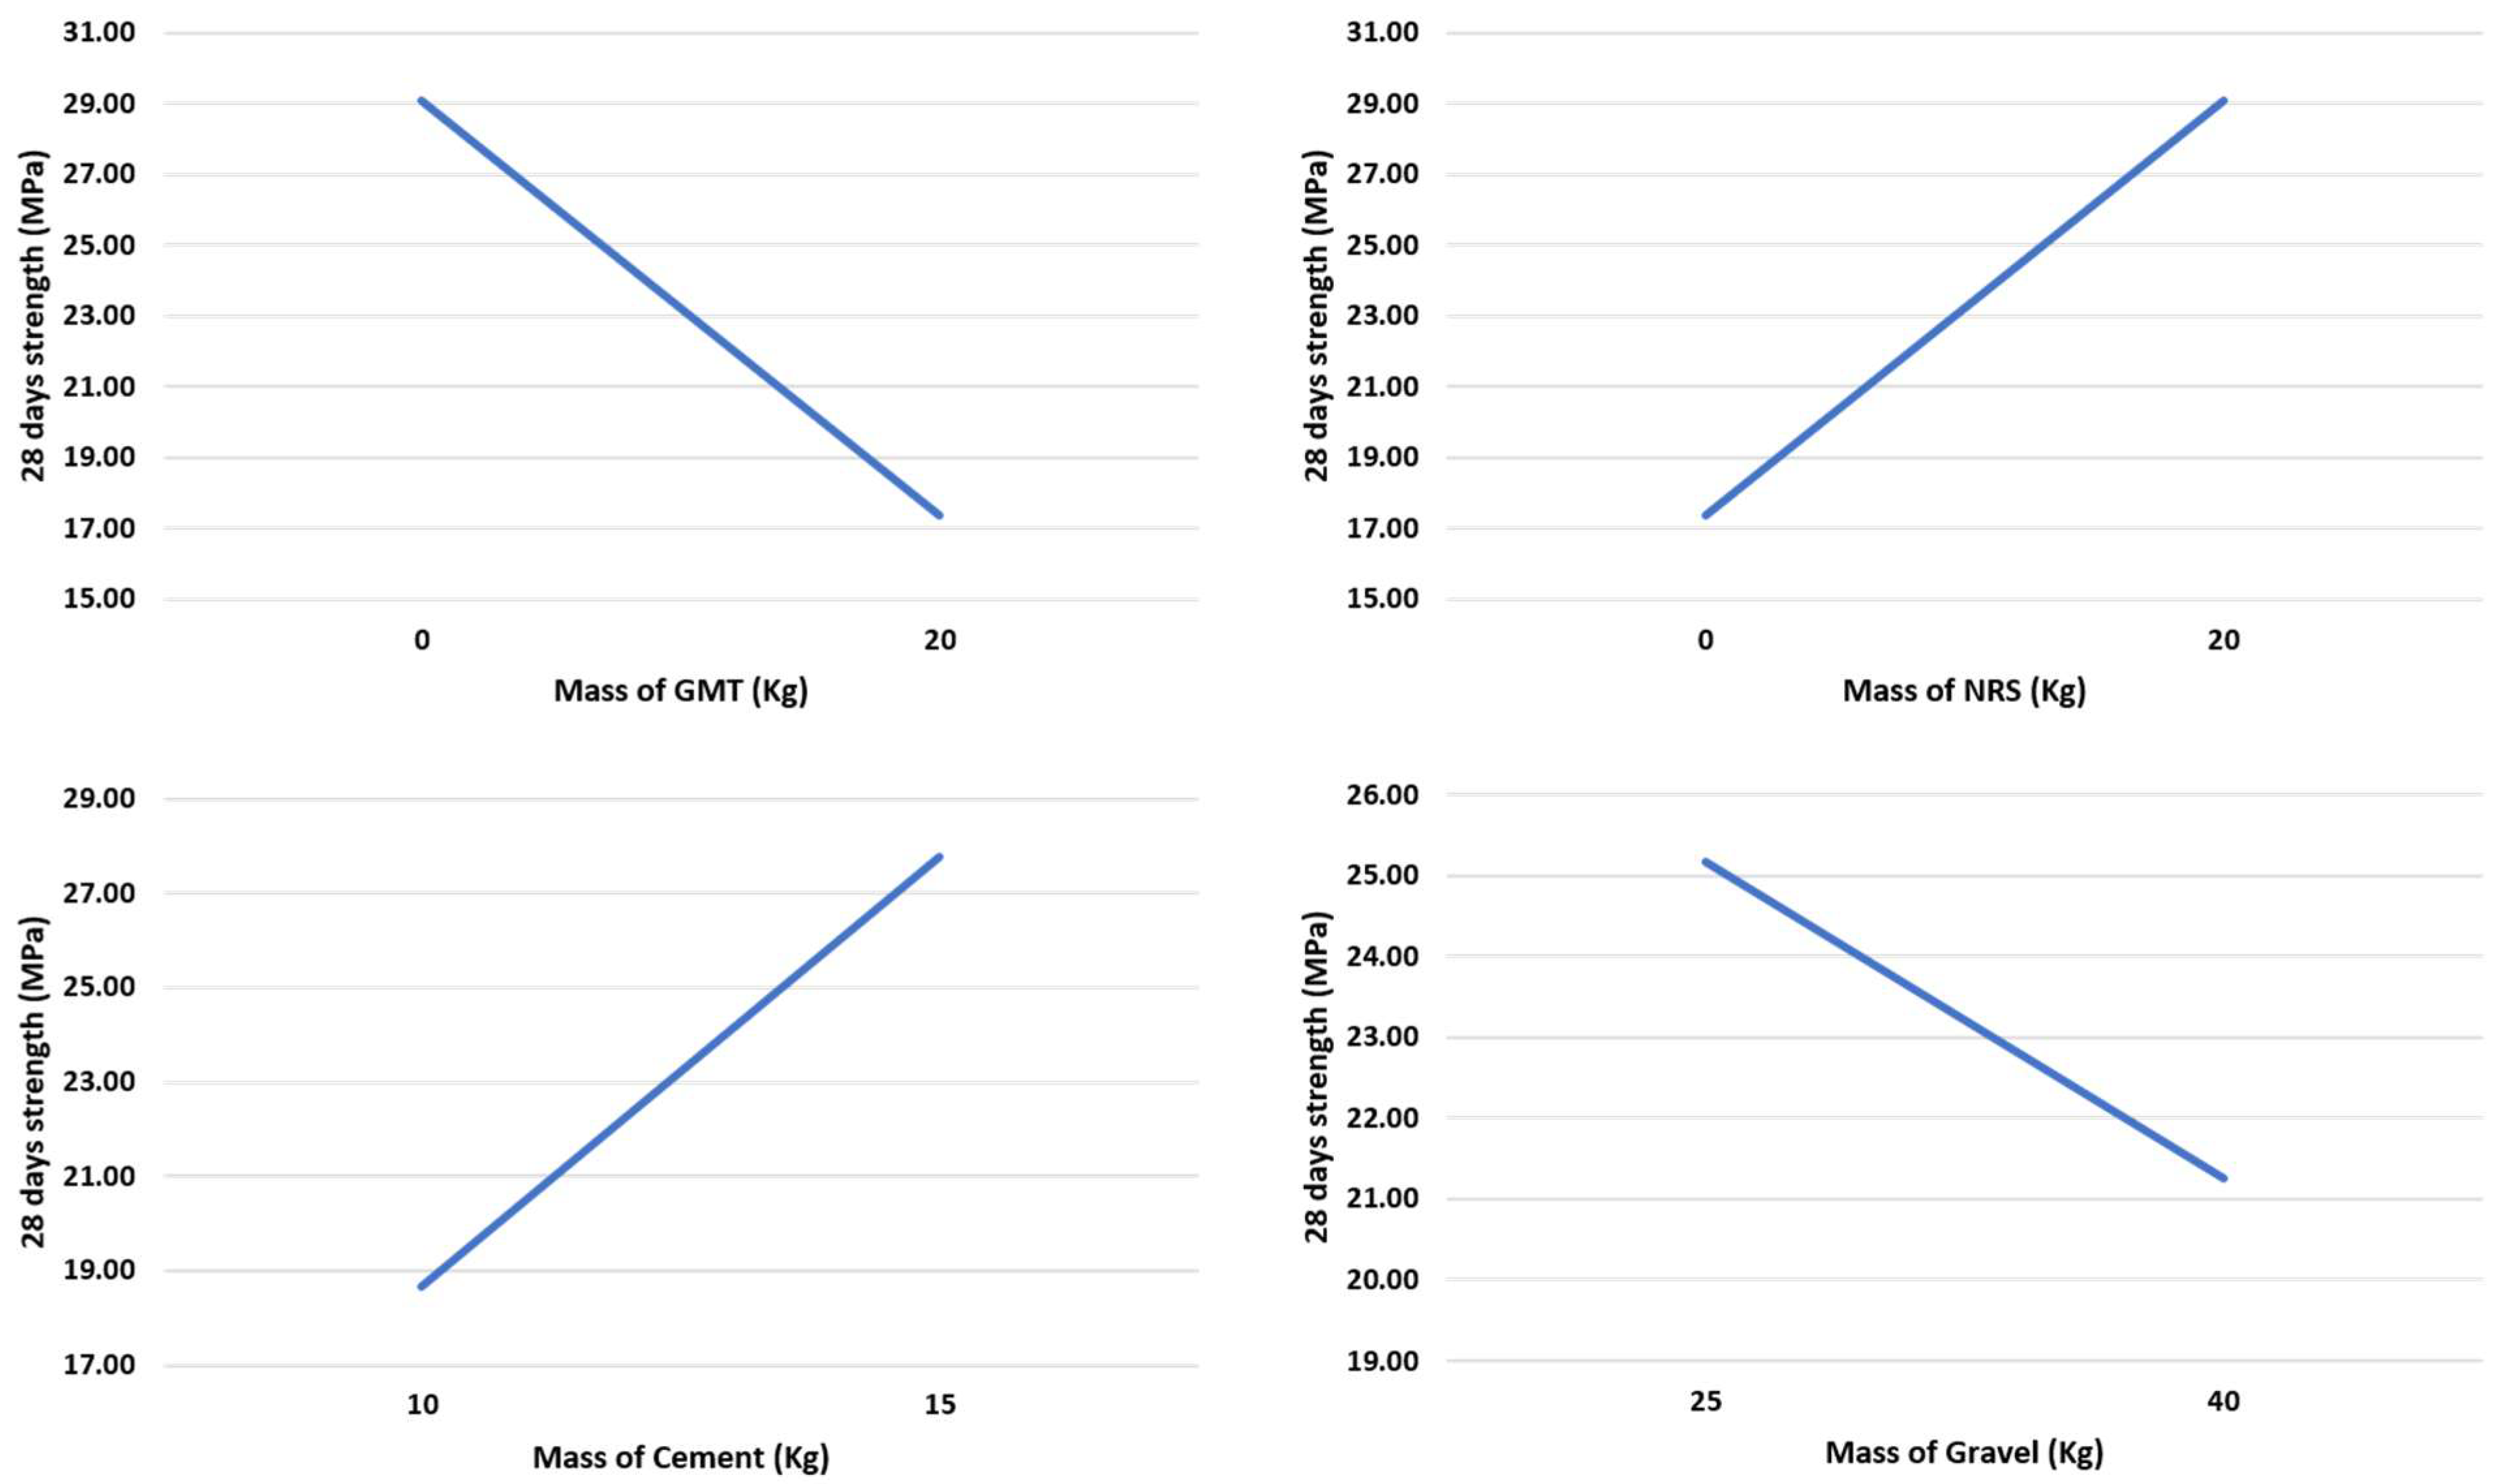
Analyzing each constituent individually, Figure 3 shows that the GMT has a negative influence on the concrete resistance. When the amount of GMT is continuously added to the concrete, the compressive strength decreases. There are several possible reasons, including the GMT grain size, its chemical characteristics, and the water/cement ratio [11,13,14,15,16]. The fine grading promotes higher water use. In the different dosages of the GMT-based concrete in the DOE, the water/cement ratio is lower than in those where NRS is used. These above authors also found that as the proportion of GMT increases in the mix, more water is added to have the desired concrete.
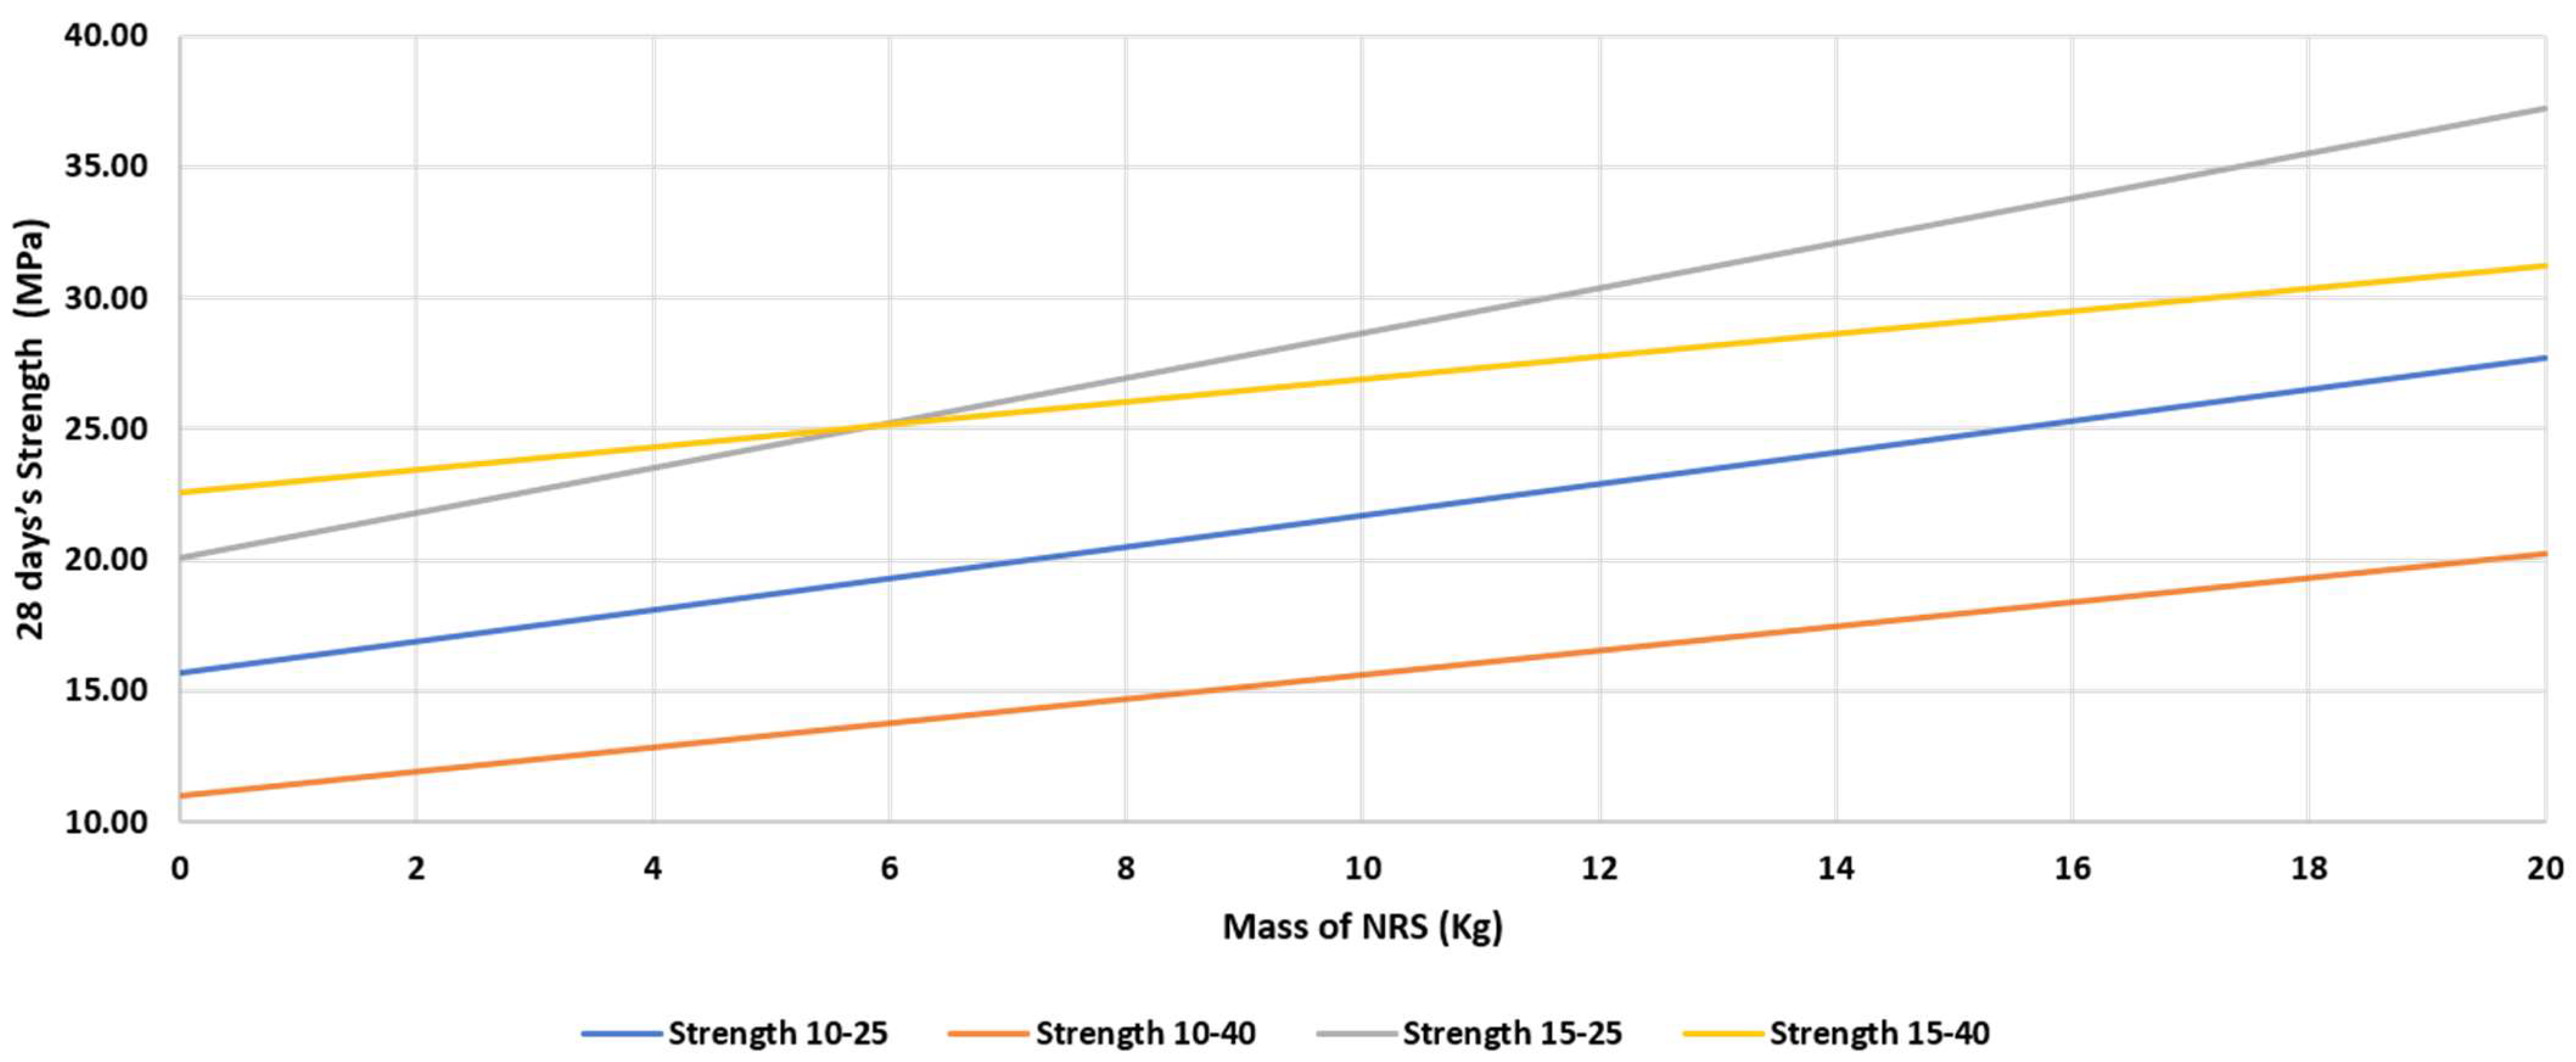
The same is true for gravel, its increased quantity in the concrete, decreases the compressive strength; whereas for NRS and cement; the compressive strength evolves positively with their quantity (Figure 4). Furthermore, Figure 5 shows that for a mixture of NRS + GMT with the same amount of cement, the compressive strength will be higher when less gravel is used. Indeed, for 15 kg of cement, the strength reaches up to 37.2 N/mm2 with 25 kg of gravel; whereas it stops at 31.2 N/mm2 with 40 kg of gravel. Similarly, for 10 kg of cement, the maximum compressive strength is 27.3 N/mm2 with 25 kg of gravels against 20.2 N/mm2 with 40 kg of gravel.
Combining the different graphs of Figure 4 (see Figure 5), we noticed that for the same quantity of cement, the strength can be high even when the quantity of gravel is 40 kg contrary to what we mentioned above. The Figure 5 illustrates that when the sand is fine (e.g., GMT), a larger quantity of gravel is necessary to reach high strength. This is in line with the experiments of De Larrard on Granular Structures and Concrete Formulation [22] according to which the use of fine sand aggregates favors a better concrete compressive strength.
According to the experimental domain of the DOE, as it can be seen at the Figure 5, with proportions of 20–14 kg of GMT (respectively, 0–6 kg of NRS) in concrete, the compressive strength of 15–40 (yellow) is greater than that of 15–25 (red). In other words, with a substitution of 70 to 100% of NRS by GMT (0 to 6 kg of NRS, respectively, with 20 to 14 kg of GMT) for 15 kg of cement, the concrete compressive strength with 40 kg of gravel is great compared to concrete compressive strength with 25 kg of gravel. We can retain that the amount of gravel has improved the concrete resistance.
By varying all the constituents at the same time, the Figure 6 which illustrates the compressive strength that can be obtained at any desired value between the maximum and minimum values of each constituent. This allows each user to set the values of the constituents of his concrete according to his needs and the application of the concrete.

4. Conclusions and Perspective

This study analyzes the substitution of NRS by GMT from an artisanal mine site with a DOE for a defined experimental domain. The experimental domain for the components included was between 0 and 20 kg for the NRS and GMT, 25 and 40 kg for gravel as well as 10 and 15 kg for the cement. The study allowed to see the evolution of the concrete compressive strength of the substitution of NRS by GMT from 0 up to 100% of the experimental domain defined above. The compressive strength was found to vary between 11 and 37 N/mm2 with 11 N/mm2 for the total substitution of NRS by GMT with a dosage of 20 kg of GMT (0 kg of NRS), 10 kg of cement, and 40 kg of gravel and 37 N/mm2 for the dosage of 20 kg of NRS (0 kg of GMT), 15 kg of cement and 25 kg of gravel. The values of the compressive strength of the experiments carried out allowed to acquire the model of the strength with the coefficients of each factor: S t r e n g t h = 23.25 5.86 * A + 4.56 * B 1.96 * C 0.56 * A * B + 1.41 * A * C + 1.08 * B * C + 0.71 * A * B * C (with A: GMT+NRS; B: cement; C: gravel). The values of the cumulative weight of the coefficients of each factor were 36.7% (A), 64.5% (B) and 76.6% (C).
It was also found that larger quantity of gravel (40 kg) improved the concrete compressive strength from 70% up to 100% of GMT as substitute to NRS when 15 kg of cement was used.
For a practical use of this concrete studied according to the experimental domain, an environmental study including the test of leaching of heavy metals is necessary to safeguard the environment and guarantee a clean and sustainable reuse of GMT as substitute to NRS.

Author Contributions

Conceptualization, C.N.B.; methodology, C.N.B. and K.K.; software, K.K.; validation, P.J.-M.D., B.N. and C.N.B.; formal analysis, K.K.; investigation, P.J.-M.D.; data curation, K.K.; writing—original draft preparation, C.N.B.; writing—review and editing, B.N.; supervision, P.J.-M.D. and B.N.; project administration, P.J.-M.D.; funding acquisition, C.N.B. All authors have read and agreed to the published version of the manuscript.

Funding

This research was funded by Sultani Makutano and Investing In People ASBL (IIP) via Bourses d’Excellence Bringmann aux Universités Congolaises (BEBUC) under project number SST7/Bourses 2020.

Institutional Review Board Statement

Not applicable.

Informed Consent Statement

Informed consent was obtained from all subjects involved in the study.

Data Availability Statement

The data presented in this study are available on request from the corresponding author.

Acknowledgments

We are grateful to Olela, Director of the Public Works Laboratory of the Office des Routes de Bukavu where the experiments and tests of this study took place, as well as the technicians of the laboratory for their support.

Conflicts of Interest

The authors declare no conflict of interest. The funders had no role in the design of the study; in the collection, analyses, or interpretation of data; in the writing of the manuscript, or in the decision to publish the results.

References

  1. Aubertin, M.; Bussière, B. Meeting Environmental Challenges for Mine Waste Management. Geotech. News 2001, 19, 21–26. [Google Scholar]
  2. Smouni, A.; Ater, M.; Auguy, F.; Laplaze, L.; Mzibri, M.E.; Berhada, F.; Filali-Maltouf, A.; Doumas, P. Évaluation de La Contamination Par Les Éléments-Traces Métalliques Dans Une Zone Minière Du Maroc Oriental. Cah. Agric. 2010, 19, 273–279. [Google Scholar] [CrossRef]
  3. Andrade, S.; Moffett, J.; Correa, J.A. Distribution of dissolved species and suspended particulate copper in an intertidal ecosystem affected by copper mine tailings in Northern Chile. Mar. Chem. 2006, 10, 203–212. [Google Scholar] [CrossRef]
  4. Goh, D. L’exploitation Artisanale De L’or En Côte D’ivoire: La Persistance D’une Activite Illegale. Eur. Sci. J. ESJ 2016, 12, 18. [Google Scholar] [CrossRef] [Green Version]
  5. Aubertin, M.; Bussière, B.; Bernier, L.; Chapuis, R.; Julien, M.; Belem, T.; Simon, R.; Mbonimpa, M.; Benzaazoua, M.; Li, L. La Gestion Des Rejets Miniers Dans Un Contexte de Développement Durable et de Protection de l’environnement. In Proceedings of the Annual Conference of the Canadian Society for Civil Engineering, Montréal, QC, Canada, 5–8 June 2002. [Google Scholar]
  6. Gratton, P. Guide de Gestion Des Parcs à Résidus Miniers. Assoc. Minière Du Can. Version 2019, 3, 104. [Google Scholar]
  7. Charbonneau, P. Analyses Des Pratiques de Valorisation Des Rejets Miniers. Master’s Thesis, Université de Sherbrooke, Sherbrooke, QC, Canada, 2014. [Google Scholar]
  8. Khellal, S.; Messara, C.; Bouzidi, N. Caractérisations et Valorisation Du Rejet de Marne Issu d’exploitation de Fer d’El-Ouenza. Master’s Thesis, Université de Béjaïa, Béjaïa, Algeria, 2014. [Google Scholar]
  9. Almeida, J.; Ribeiro, A.; Silva, A.S.; Faria, P. Overview of mining residues incorporation in construction materials and bar-riers for full-scale application. J. Build. Eng. 2020, 29, 101215. [Google Scholar] [CrossRef]
  10. Mabroum, S.S.; Moukannaa, A.; El Machi, Y.; Taha, M.B.; Hakkou, R. Mine Wastes Based Geopolymers: A Critical Review. Clean. Eng. Technol. 2020, 1, 100014. [Google Scholar] [CrossRef]
  11. Ince, C. Reusing gold-mine tailings in cement mortars: Mechanical properties and socio-economic developments for the Lefke-Xeros area of Cyprus. J. Clean. Prod. 2019, 238, 117871. [Google Scholar] [CrossRef]
  12. Taha, Y. Valorisation des Rejets Miniers dans la Fabrication de Briques Cuites: Evaluations Technique et Environnementale. Ph.D. Thesis, Université du Québec en Abitibi-Témiscamingue, Rouyn-Noranda, QC, Canada, 2017. [Google Scholar]
  13. Preethi, A.V.; Rajendra, S.; Navneeth, P.K.L. Studies on Gold Ore Tailings as Partial Replacement of Fine Aggregates in Concrete. Int. J. Latest. Technol. Eng. Manag. Appl. Sci. 2017, 6, 30–32. [Google Scholar]
  14. Reddy, B.R.; Satyanarayanan, K.S.; Jagannatha, H. Use of Gold Mine Tailings in Production of Concrete-A Feasibility Study. BDL 2016, 9, 197–202. [Google Scholar]
  15. Vignesh, S.; Reddy, B.R.; Nachiar, S.S. Effect of Partial Replacement of Natural Sand with Gold Mine Tailings on Some Properties of Masonry Mortars. Int. J. Eng. Res. Technol. 2015, 4, 583–586. [Google Scholar] [CrossRef]
  16. Widojoko, L.; Hardjasaputra, H.; Susilowati, S. Study of Gold Mine Tailings Utilization as Fine Aggregate Material for Producing Shotcrete Based on Concept of Green Technology. In International Conference on Engineering and Technology Development (ICETD); Mustofa Usman: Jakarta, Indonesia, 2014; pp. 124–133. [Google Scholar]
  17. Parthasarathi, N.; Ramalinga Reddy, B.M.; Satyanarayanan, K.S. Effect on Workability of Concrete due to Partial Replacement of Natural Sand with Gold Mine Tailings. Indian J. Sci. Technol. 2016, 9. [Google Scholar] [CrossRef]
  18. Ahmed, T.; Elchalakani, M.; Basarir, H.; Karrech, A.; Sadrossadat, E.; Yang, B. Development of ECO-UHPC utilizing gold mine tailings as quartz sand alternative. Clean. Eng. Technol. 2021, 4, 100176. [Google Scholar] [CrossRef]
  19. Kunt, K.; Yıldırım, M.; Dur, F.; Derun, E.M.; Pişkin, S. Utilization of Bergama Gold Tailings as an Additive in the Mortar. Celal Bayar Üniversitesi Fen Bilim. Derg. 2015, 11, 365–371. [Google Scholar] [CrossRef]
  20. Lundstedt, T.; Seifert, E.; Abramo, L.; Thelin, B.; Nystrom, A.; Pettersen, J.; Bergman, R. Experimental Design and Optimization. Chemom. Intell. Lab. Syst. 1998, 42, 3–40. [Google Scholar] [CrossRef]
  21. Balegamire, C.N.; Dable, P.J.-M.; Nkuba, B. Toward the Total Substitution of Natural River Sand (NRS) by Gold Mine Tailings (GMT) in the Manufacturing of Concrete Pavers: Case Study of the Gold Mine Tailings (GMT) of the Artisanal Sector of Misisi (East of the DR Congo). Clean. Eng. Technol. 2022, 7, 100427. [Google Scholar]
  22. De Larrard, F. Concrete Mixture-Proportioning: A Scientific Approach, Modern Concrete Technoloy Series 9; E & FN SPON: London, UK, 1999. [Google Scholar]
  23. CSTC/WTCB.be. Fiches Normes Beton—Mortier-Granulats. In SPF Economie, P.M.E.; Classes Moyennes et Energie. 2018, 272. Available online: https://www.cstc.be/media/dbdhbsg0/an_fiches_aide_a_la_specification_des_betons-1.pdf (accessed on 17 December 2021).
  24. Néville, A. Propriétés Des Betons; Eyrolles: Paris, France, 2000. [Google Scholar]
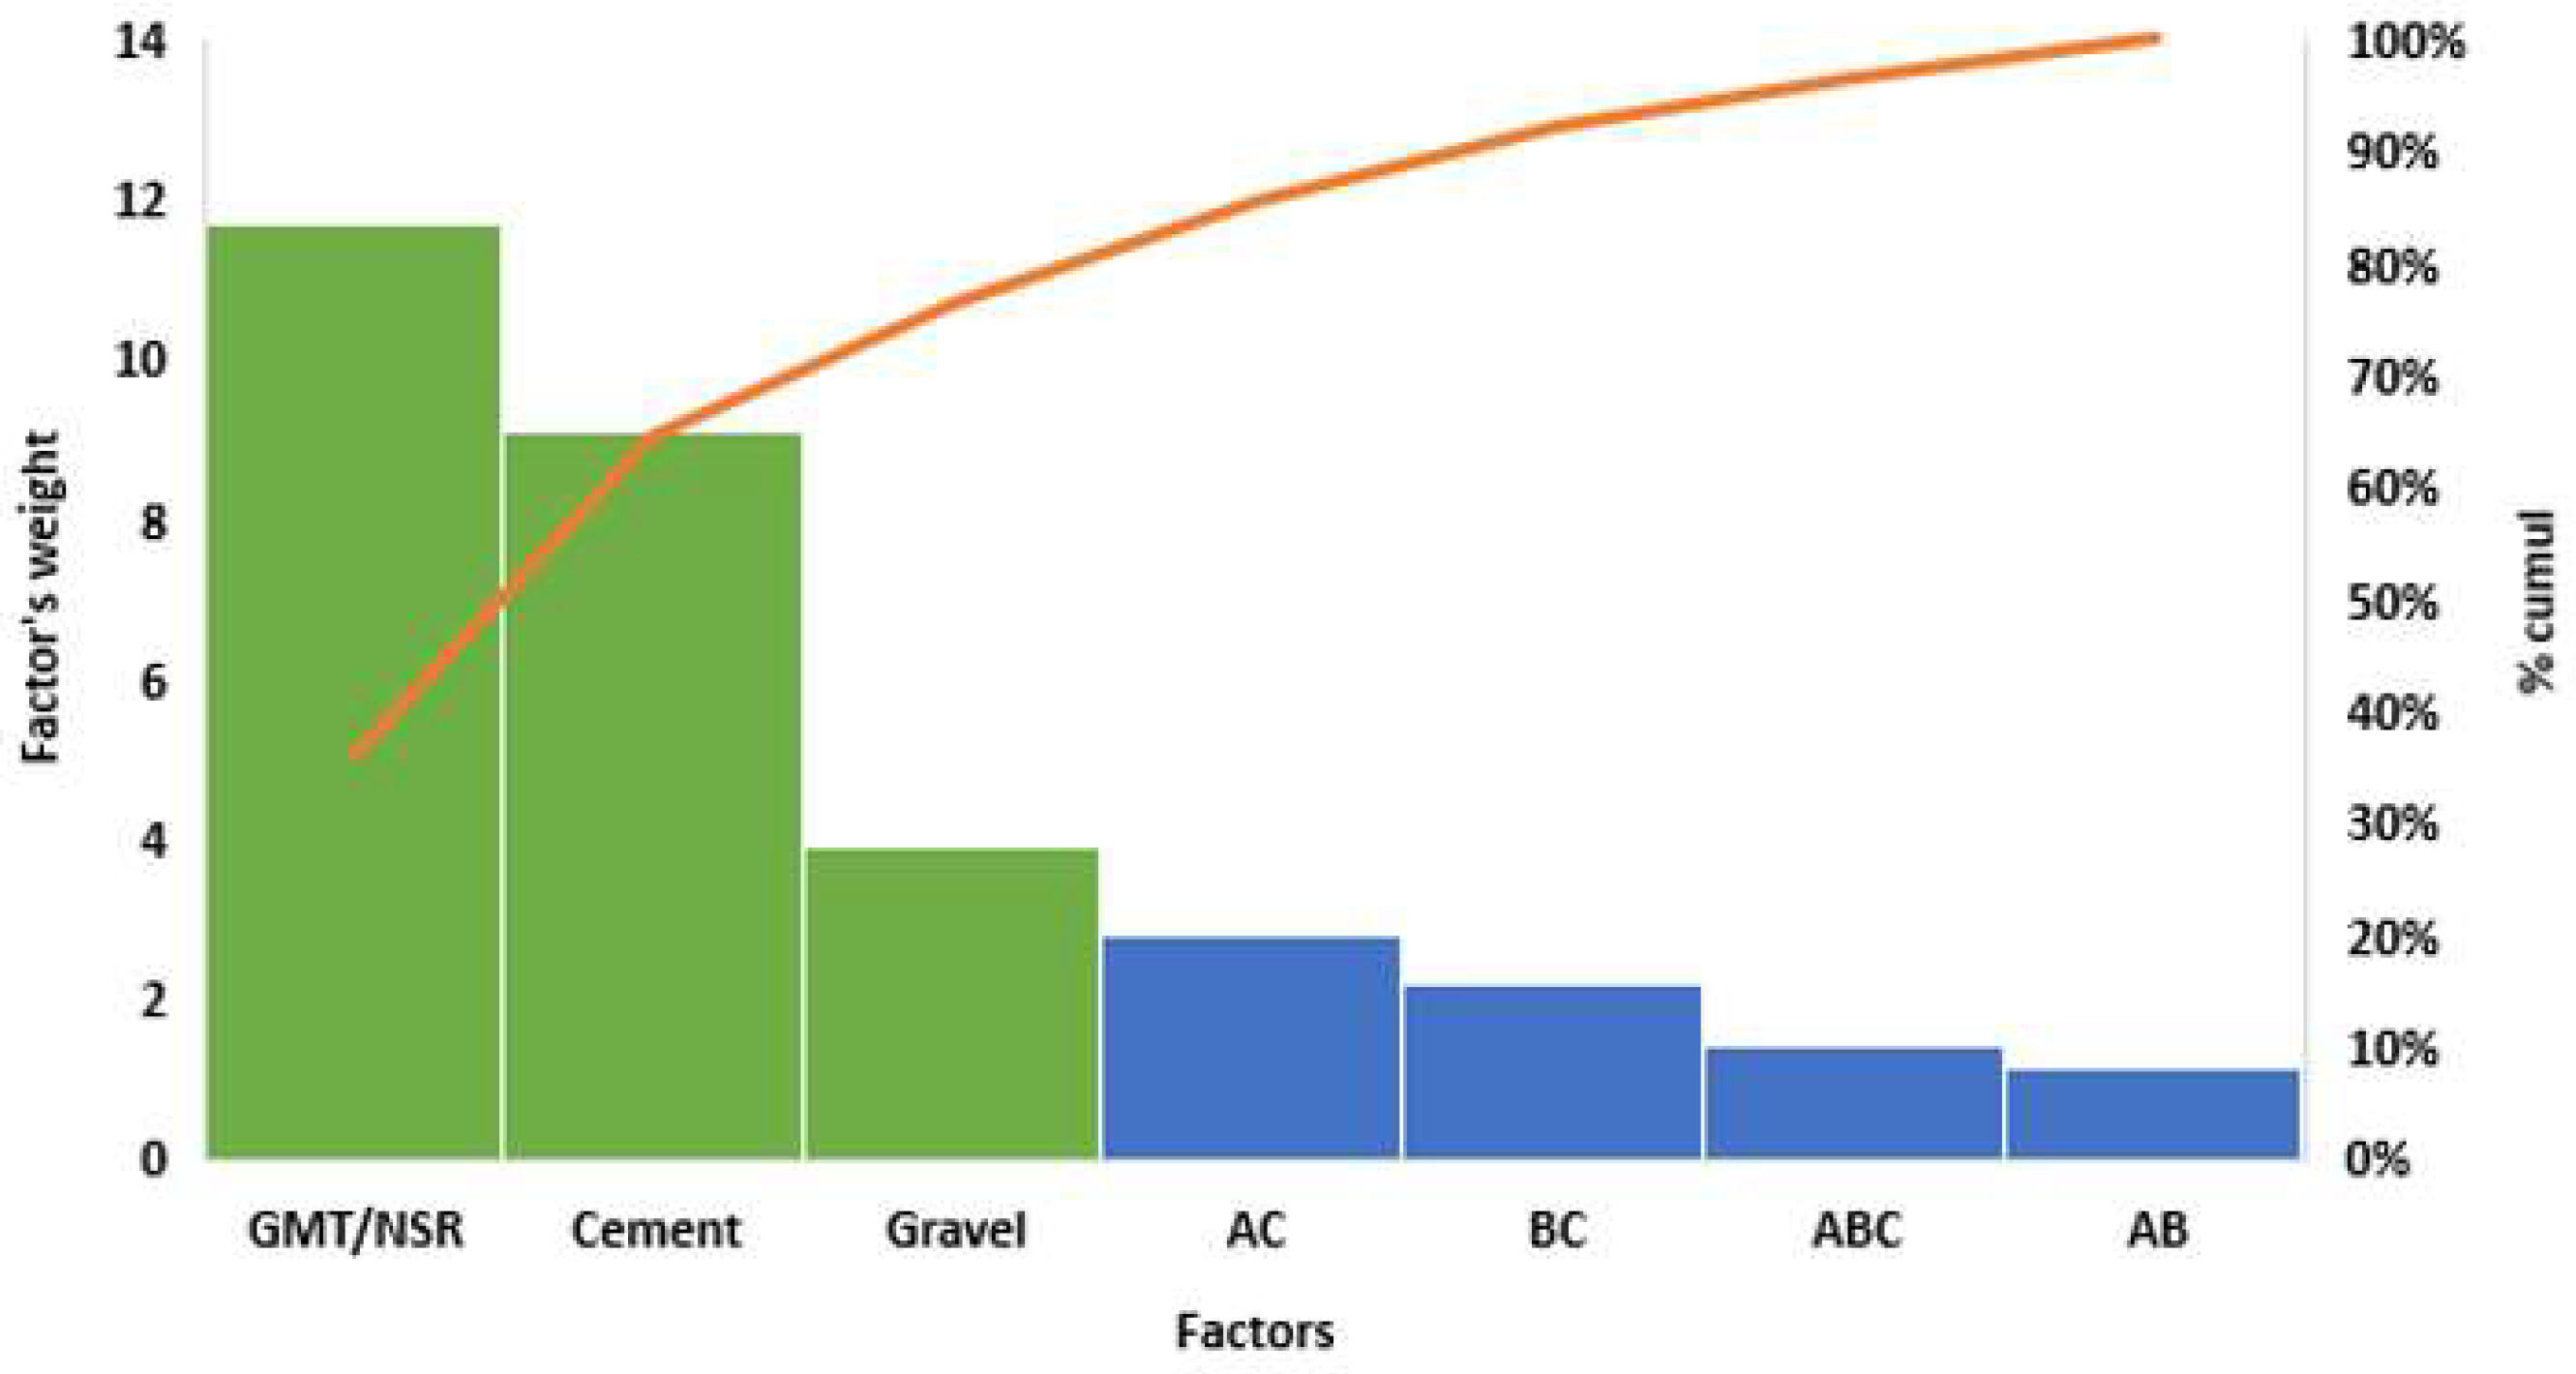
Figure 1. Pareto diagram of the study.
Recycling 07 00050 g001
Figure 2. Horizontal bar diagram of the influence of each factor on the response.
Recycling 07 00050 g002
Figure 3. Influence of each concrete component individually on its compressive strength according to the DOE.
Recycling 07 00050 g003
Figure 4. Influence of gravel in concrete on its compressive strength.
Recycling 07 00050 g004
Figure 5. Evolution of the compressive strength of concrete according to the quantities of gravel and cement. Resistances 10–25 (in blue) and 10–40 (in grey), apply for the same quantity of cement of 10 kg using 25 kg and 40 kg of gravel, respectively. Resistances 15–25 (in red) and 15–40 (in yellow) mean the same quantity of cement of 15 kg with 25 kg and 40 kg of gravel, respectively.
Recycling 07 00050 g005
Figure 6. Compressive strength of concrete according to the variation of quantity of each component.
Recycling 07 00050 g006
Table 1. Experimental domain of the DOE.
Factors/LevelsCement (kg)Gravel (kg)NRS + GMT (kg)
High level (+1)154020 of GMT
0 of NRS
Low level (−1)10250 of GMT
20 of NRS
Table 2. Tests at the center level.
FactorsCodingDosage of Tests at the Center Level
GMT + NRS(1 + (−1))/250% GMT and 50% NRS (20 kg)
Cement(1 + (−1))/2(Maximum value + minimum value)/2 (12.5 kg)
Gravel(1 + (−1))/2(Maximum value + minimum value)/2 (32.5 kg)
Table 3. Coded matrix of the full factorial design.
CementGravelNRS + GMT
01−1−1−1
021−1−1
03−11−1
0411−1
05−1−11
061−11
07−111
08111
09000
10000
11000
Table 4. Matrix of experiences.
Factors/TestsCement (kg)Gravel (kg)NRS + GMT (kg)
01102520 of NRS
02152520 of NRS
03104020 of NRS
04154020 of NRS
05102520 of GMT
06152520 of GMT
07104020 of GMT
08154020 of GMT
0912.532.510 of NRS + 10 of GMT
1012.532.510 of NRS + 10 of GMT
1112.532.510 of NRS + 10 of GMT
Table 5. Concrete compressive strength of different dosages by the day 7, 14 and 28.
GMT + NRS (kg)Cement (kg)Gravel (kg)Water (L)Breaking Stress (N/mm2) at 7 DaysBreaking Stress (N/mm2) at 14 Days Breaking Stress (N/mm2) at 28 Days
20 + 015401115.419.622.6
20 + 0152510.517.218.320.1
20 + 01040108.710.411
20 + 010258.81114.515.7
0 + 2015407.4516.722.331.2
0 + 2015255.221.933.437.2
0 + 201040613.115.720.2
0 + 2010255.315.42327.7
10 + 1012.532.5814.41822.3
10 + 1012.532.5816.22223.7
10 + 1012.532.5816.62324
Table 6. Degree of influence of the concrete constituents of the DOE.
Bias 23.21GMT+NRS (A)Cement (B)Gravel (C)ABACBCABC
−5.864.56−1.96−0.561.411.080.71
Weight11.739.123.922.822.171.421.12
Table 7. Calculation table of the significance of the factors according to the Pareto method.
FactorsCoefficientWeightCumulative Weight %Cumulative %Significant?
NRS/GMT (A)−5.8611.711.736.336.3YES
Cement (B)4.569.1320.8528.264.5YES
Gravel (C)−1.963.9324.7812.176.6YES
AC1.412.8327.608.7485.4NO
BC1.092.1829.786.7392.1NO
ABC0.711.4331.204.4196.5NO
AB−0.561.1332.333.48100NO
Publisher’s Note: MDPI stays neutral with regard to jurisdictional claims in published maps and institutional affiliations.