Article

Recycling Potential for Non-Valorized Plastic Fractions from Electrical and Electronic Waste

1
Fraunhofer Institute for Process Engineering and Packaging IVV, Process Development for Polymer Recycling, 85354 Freising, Germany
2
TUM School of Life Sciences Weihenstephan, Technical University of Munich, 85354 Freising, Germany
*
Authors to whom correspondence should be addressed.
Recycling 2021, 6(2), 33; https://doi.org/10.3390/recycling6020033
Submission received: 2 April 2021 / Revised: 14 May 2021 / Accepted: 14 May 2021 / Published: 19 May 2021
(This article belongs to the Special Issue Polymer Recycling)

Abstract

:
This paper describes a study for waste of electrical and electronic equipment (WEEE) to characterise the plastic composition of different mixed plastic fractions. Most of the samples studied are currently excluded from material recycling and arise as side streams in state-of-the-art plastics recycling plants. These samples contain brominated flame retardants (BFR) or other substances of concern listed as persistent organic pollutants or in the RoHS directive. Seventeen samples, including cathode ray tube (CRT) monitors, CRT televisions, flat screens such as liquid crystal displays, small domestic appliances, and information and communication technology, were investigated using density- and dissolution-based separation processes. The total bromine and chlorine contents of the samples were determined by X-ray fluorescence spectroscopy, indicating a substantial concentration of both elements in density fractions above 1.1 g/cm3, most significantly in specific solubility classes referring to ABS and PS. This was further supported by specific flame retardant analysis. It was shown that BFR levels of both polymers can be reduced to levels below 1000 ppm by dissolution and precipitation processes enabling material recycling in compliance with current legislation. As additional target polymers PC and PC-ABS were also recycled by dissolution but did not require an elimination of BFR. Finally, physicochemical investigations of recycled materials as gel permeation chromatography, melt flow rate, and differential scanning calorimetry suggest a high purity and indicate no degradation of the technical properties of the recycled polymers.

1. Introduction

Besides design for recycling and design from recycling, collection, sorting, and recycling of plastics are major pillars to move our current value chains towards a circular economy of WEEE plastics [1,2]. Otherwise, polymers are incinerated, landfilled, or dumped into the environment after improper treatment. As a result they may pollute the ecosystem and negatively impact human living conditions [3,4].
Polymers that find their application in electric and electronic equipment, information and communication technology (ICT), and small domestic appliances (SDA) often contain a large number of different additives and impurities that prevent recycled polymers to re-enter the market [5,6]. A significant percentage of these plastics contain additives such as brominated flame retardants (BFR) including polybrominated diphenyl ester (PBDE) and tetrabromobisphenol A (TBBPA) [7,8]. Congeners of these substances have been shown to be persistent and toxic [9,10] and during the processing of plastics containing PBDEs polybrominated dioxins and furans can be formed and remain in the recycled polymer [11].
Some BFRs, including PBDEs, are listed as persistent organic pollutants (POP) or substances of very high concern (SVHC) and are subject to current legislation, prohibiting their use in new products [6]. As long as recycling is unfavourable, incineration is currently the treatment of choice, but due to cost issues and export, improper treatment co-exists [3]. The uncontrolled loss of plastics into the environment, as well as the use of primitive recycling techniques such as open burnings and acid baths, has far-reaching consequences because brominated flame retardants (BFR) may leach out and enter the environment [4]. These substances may finally end up in our food chain. Improper recycling, that involves remelting BFR containing plastics, may end up in sensitive products like toys or food contact materials and affect the safety of consumers [12].
As an alternative route sorting and cleaning of plastics with hazardous additives has been discussed earlier [6,13,14,15,16]. Polymers containing BFR can be sorted and treated separately from plastics without BFR. This can be performed by manual inspection of the bromine content via hand-held XRF instruments, however, this is time and man-power-consuming and therefore not performed on a large scale [14]. For cost reasons, automated processes like sink and float or spectroscopic XRT separation are often preferred, although the latter has not yet been widely implemented [13,17,18]. The density approach is based on the effect that BFR additives are usually used in concentrations that increase the polymer’s density substantially and allow their separation by sink and float in liquids with a density of approximately 1.1 g/cm3 [16]. Recycling of thermoplastics containing potentially hazardous compounds has been demonstrated by dissolution-based recycling including an extractive unit (e.g., CreaSolv® Process [16])
Besides the separation of BFRs, WEEE plastics recyclers also face the challenge of sorting a growing number of polymer types. Due to blends and other modifications, plastics from WEEE may include >15 different types [19]. This is also due to the lifespan of polymers, which range from a couple of months to multiple decades. Density-based technologies, however, have great potential in separating BFR containing plastics but show limitations when dealing with different polymers with similar densities, such as ABS and HIPS. In this particular case, electrostatic separation may help to further refine this well-defined mixture [20]. The density-based separation route is well established in European WEEE plastics treatment, producing ABS, PS, and PP free of elevated BFR levels.
A great share of WEEE plastics ends up in the high-density rejects of such separation plants. They contain multiple polymer types and BFRs, including PBDE and TBBPA, making this material a hazardous waste and suggesting thermal destruction. However, previous analyses of the composition of WEEE plastics reveal that rejects contain other valuable polymers like PC or PC/ABS blends in addition to plastics containing BFRs [3,21]. However, these require an advanced purification if considered for secondary use [22].
This study, on the one hand, analyses density fractions from WEEE plastics for their halogen and BFR content. On the other hand it investigates the specific polymer composition. Density fractions containing both, mixed polymer types and increased BFR levels, were selected for further treatment. Up to date, there is no known single process technology that tackles both challenges. In our study, these fractions were subjected to the dissolution-based CreaSolv® Process to extract target polymers like PS, ABS and PC/ABS and to separate BFRs. The study is part of the European NONTOX project (www.nontox.eu [accessed on 2 May 2021]) and has been supported by industrial project partners operating WEEE plastics plants. They provided us with a large number of 17 different samples from WEEE, ICT, SDA, CRT, and flat screens.

2. Materials and Methods

2.1. Materials

Fraunhofer IVV received 17 different plastic fractions from the WEEE sector. These were provided by five European recycling facilities, including fractions that are currently not used for material recycling. Sampling was initiated by the recyclers themselves who provided samples of their inputs, products, and side streams. Fridges and large appliances were not included in this study. The mixed plastic fractions used are shown in Table 1.
In preparation for the analyses, the particle size of every batch was reduced by a cutting mill operating with a 10 mm screen (Wanner Technik GmbH, Wertheim-Reicholzheim, Germany).

2.2. Material Separation and Purification

2.2.1. Dissolution Based Polymer Separation and Purification

Density separation of plastics is an important step for the production of high-quality granulats from mixed plastic fractions. Details on the densities of typical polymers are described elsewhere [19]. Table 2 suggests density classes of plastics typically used in electric and electronic equipment. Two density solutions (1.1 g/cm3; 1.25 g/cm3) were prepared with deionized water and dipotassium phosphate for the density separation. The desired density was calibrated with a density spindle. A representative subsample (1 kg) of the provided material was placed into the solution with a density of 1.25 g/cm3 and sink and float fractions were obtained. The float fraction was then introduced to the liquid with a density of 1.1 g/cm3 for another separation step. A final separation was performed in pure water (1.0 g/cm3), again yielding a sink and a float fraction.
Afterwards, the separated fractions were placed in a hot air oven for drying for 3 h at 105 °C. Since salt solutions were used for the other density fractions (DF2–DF4) they were washed with water to remove any remaining salt before drying.

2.2.2. Dissolution-Based Polymer Separation

The CreaSolv® Process was applied to the polymers within the mixed plastic fraction 1.1–1.25 g/cm3 (DF 3). Details of the CreaSolv® Process are described elsewhere [6]. In brief, the input was dissolved at elevated temperatures with a solvent mixture that selectively dissolves only PS. The dissolved PS was then separated from undissolved polymers and materials by gross sieving, followed by fine filtration in order to remove all smaller particles. After this step, the filter residue from step 1 was dissolved in another solvent using an ABS selective solvent mixture. Subsequently, the above-mentioned 2-stage cleaning steps were carried out again with the ABS solution, and the insoluble residue was used for the next dissolving steps: first extracting a group of non-target plastics and finally PC/ABS blends for the 2-stage cleaning. This procedure was continued until the plastic mix was dissolved into its individual fractions. All solvents were supplied by CreaCycle GmbH (Grevenbroich, Germany) and the solvent composition is undisclosed proprietary information of Creacycle.
To purify the polymer solution and remove legacy additives like brominated flame retardants, the solution was precipitated and then purified by solvent extraction. In the final step, the extract is separated from the polymer and the polymer undergoes a drying and a granulation step. The extracts are submitted to a solvent recovery step, leaving a concentrate of BFRs for safe disposal.

2.3. Material Characterization

2.3.1. XRF Analysis

With a focus on bromine and chlorine, the samples were analysed for different elements using energy dispersive X-ray fluorescence analysis (Spectrolab 2000, SPECTRO Analytical Instruments GmbH, Kleve, Germany). For the analysis, representative samples of the shredded mixed plastic fractions were crushed to a powder (<1 mm) in a hand mill using under nitrogen-cooling. This plastic powder was placed in cuvettes lined on the bottom with a thin PP film (4 µm). Every plastic fraction was analysed fivefold due to the expected material inhomogeneity. Arithmetic means of these multiple determinations are given.

2.3.2. BFR Analysis

Flame retardants were determined by gas chromatography (GC) combined with electron capture detection (ECD), which combines high sensitivity to halogenated compounds (comparable to GC-MS) and high stability to co-extracted oligomers that may affect the performance of GC-MS systems. Powders (<1 mm) of mixed plastic fractions were extracted by dissolution in tetrahydrofuran (p.a., Merck, Kenilworth, NJ, USA) and precipitation of the polymers in ethanol (p.a., Merck). The filtered extracts were analysed by gas chromatography coupled to an electron capture detector (GC-2010, Shimadzu, Kyoto, Japan). Samples were injected at 290 °C in splitless mode and separated on a DB-5HT (5 m × 0.25 mm, 0.1 µm, Agilent J&W) using a short oven program (170 °C, 2 min, 20 K/min to 230 °C, 20 K/min to 340 °C (4 min). Measurements were calibrated using certified standards of hexa- through deca-BDEs, TBBPA, and BTBPE from Wellington Laboratories Inc. (Guelph, Ontario, Canada).

2.3.3. FTIR

Polymers were characterised using an FT-IR (Spectrum One, PerkinElmer LAS Germany GmbH, Rodgau, Germany). Samples of the dissolved polymers and their residues were analysed with the instrument using Golden Gate ATR (attenuated total reflectance). Polymer types were determined by comparing the measured FT-IR spectra with entries of a spectra library (references Fraunhofer IVV, Perkin Elmer).

2.3.4. Melt Flow Rate

Rheological properties of the recycled polymers were obtained using MFR analysis. Melt flow rate (MFR) and melt volume rate (MVR) were determined according to ISO 1133.

2.3.5. Differential Scanning Calorimetry (DSC)

The glass transition temperature of the polymers was determined by DSC (Mettler-Toledo GmbH, Gießen, Germany). Dynamic differential calorimetry was performed according to ISO 11357.

3. Results

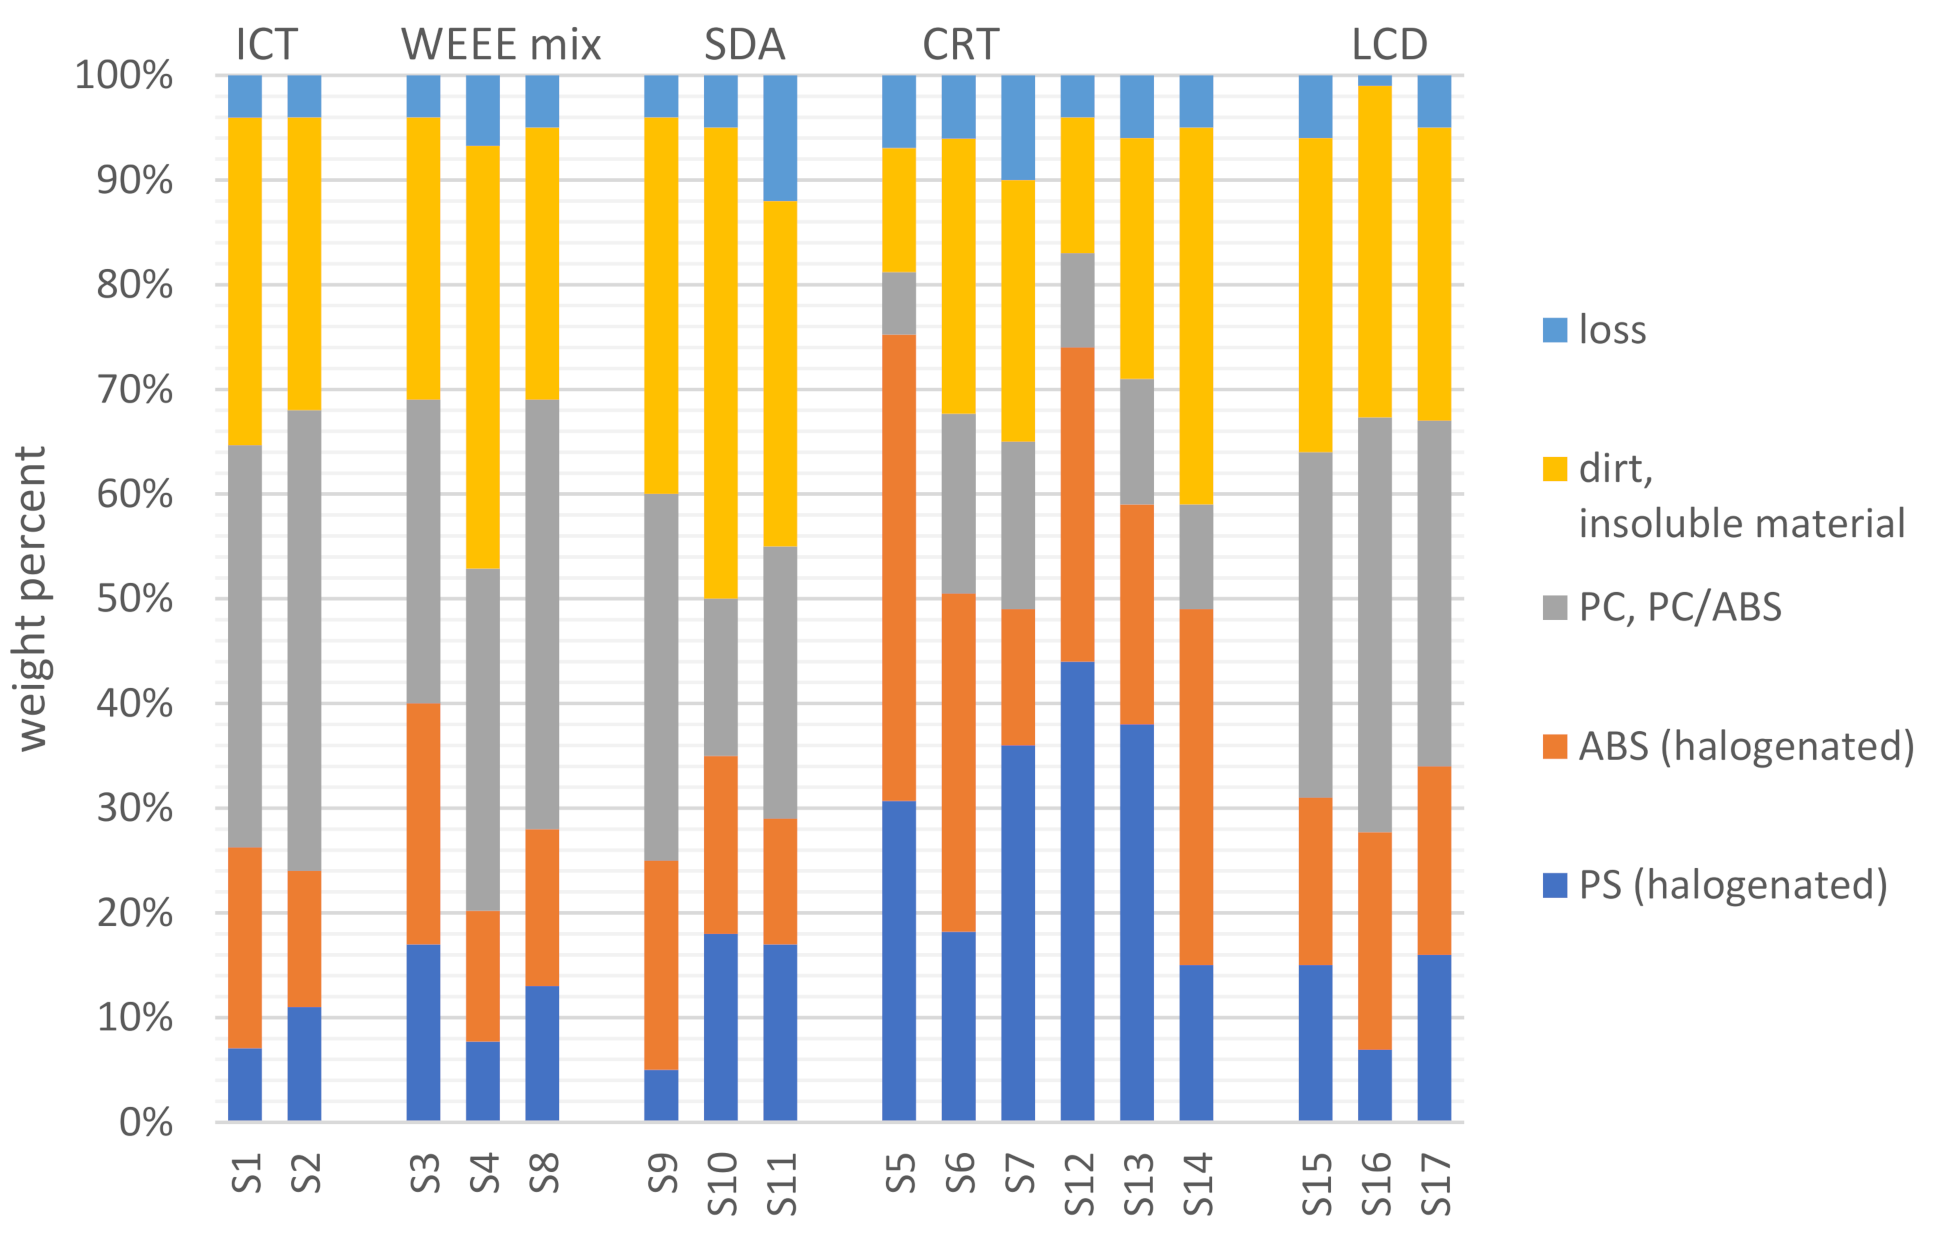
3.1. Composition of Mixed Plastic Fractions

The breakdown of the 17 mixed plastic samples into density classes is shown in Figure 1. The results are expressed as percentages related to the input of each four-stage density separation. For better understanding, these fractions were divided into their sources. Fractions that were already density separated at the recycling facilities, do not show shares in density fractions 1 and 2. Furthermore, it should be noted that for better understanding, three CRT fractions (S6–8) were assigned to the WEEE >1.1 g/cm3 fraction, which are then assigned to the CRT fraction in Chapter 3.2. The proportion of plastics in the density fraction DF3 (1.1–1.25 g/cm3) is on average 83%, while the share of DF4 (>1.25 g/cm3) accounts for 15% on average. Samples, not pre-treated at recycling sites, show different shares. SDA samples exhibit 15–30% shares of each density fraction. However, the proportion of fractions free of halogens (DF 1 and 2) vary from 42–68%.
For equipment containing cathode-ray tubes, the share of PP/PE is below 6%, however, the proportion of non-halogenated ABS/PS (DF 1 + 2) accounts for 70%. The halogen-containing density fraction (DF3) accounts for 19–39%. In comparison, liquid crystal displays (LCD) show significantly higher shares of DF 3 and DF 4 with 47–72%.

3.2. Material Separation Achieved by Dissolution

The dissolution-based separation applied in this study, further segments the density fraction DF3. Applied to a 100 g sample, a four-stage dissolution of each input material, followed by coarse and fine filtration, achieved an average material yield of 66%, comprising ABS, PS, PC, and PC/ABS. Thus, 30–35% of input was discarded due to insolubility in the polymer-selective solvents. Types and shares of the three target plastics are displayed in Figure 2. In general, the most common types of polymers were found to be PS, ABS, PC, and PC/ABS.
FT-IR analysis of these materials revealed that the polymer solutions refer to the polymers expected, indicating that the solvent-based separation of the polymers from the bulk mixture worked sufficiently well. Plastic yields of the five WEEE categories investigated, i.e., ICT, WEEE, SDA, CRT, and LCD, show different results. In CRT fractions, more PS and ABS (approx. 30%) are found than PC and PC/ABS (~15%). In the other fractions, the average yield is 15% for PS and for ABS, while PC and PC/ABS make up a great proportion with 15–44%.

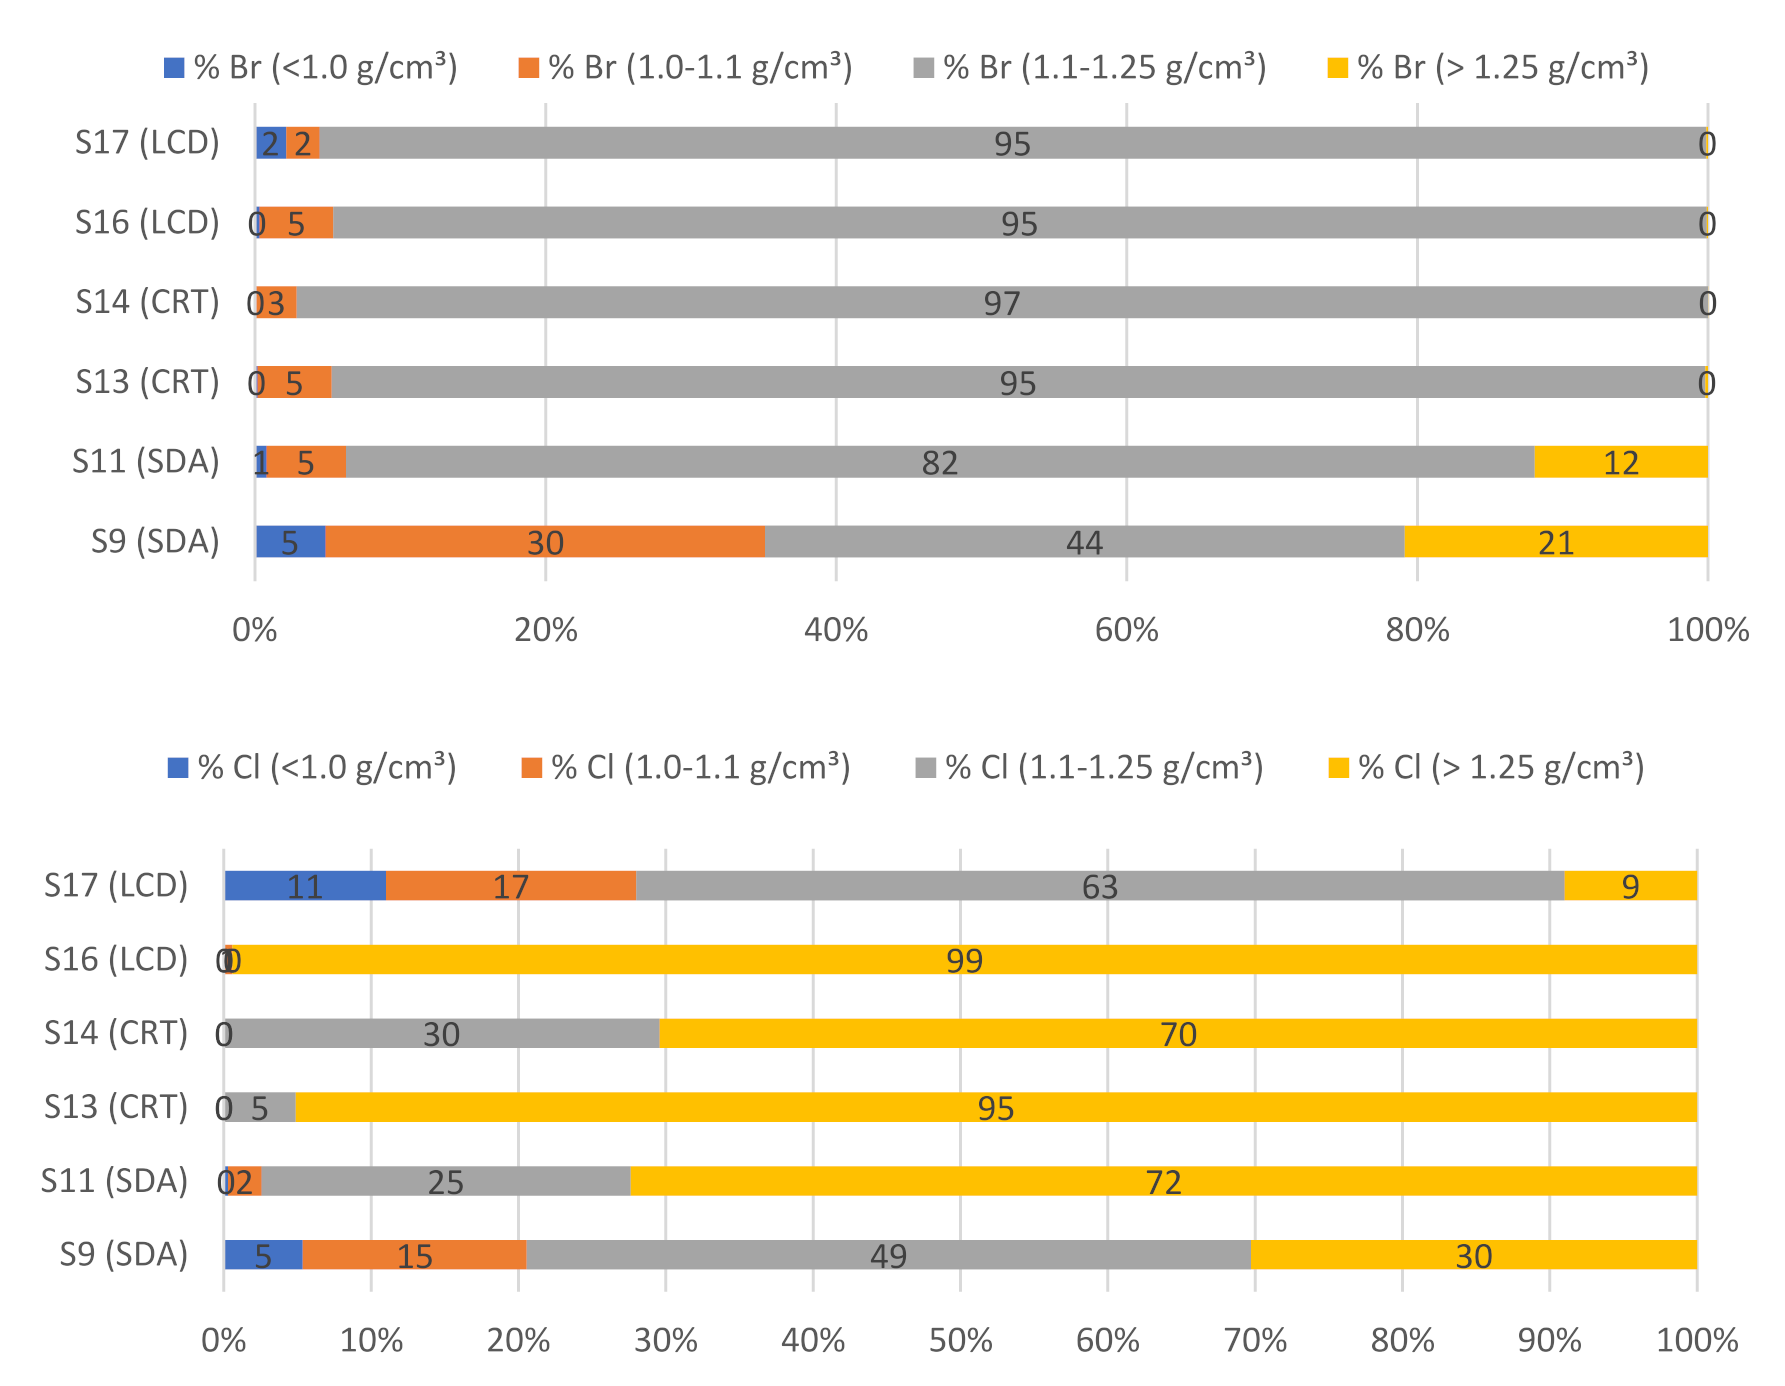
3.3. Distribution of Elements and Related Materials

All samples of the density fractions were analysed for their bromine and chlorine content by XRF. The results are presented in Table 3. In general, it can be stated that the fractions with densities above 1.1 g/cm3 have the highest bromine and chlorine content. In more detail, the highest bromine content is found in density fraction 3 (1.1–1.25 g/cm3) and the highest chlorine content in density fraction 4 (>1.25 g/cm3). Fraction 4 has an average bromine content of about 10,000 ppm and a mean chlorine content of > 50,000 ppm, mainly due to the presence of PVC. In contrast, the fraction <1.0 g/cm3 contains the fewest halogens. For density fraction 2 (1.0–1.1 g/cm3) it is noticeable that bromine and chlorine contents are higher than assumed with levels up to 5000 ppm. According to the WEEELabex standard a bromine content of <2000 ppm is required, which is exceeded in six out of nine laboratory-scale samples. Industrially recycled materials were additionally analysed by XRF and showed values below 2000 ppm in all cases. These materials are already sold on the market today. Table 4 clearly demonstrates that the bromine and chlorine content of these recycled samples is below 2000 ppm.
Nevertheless, Table 3 demonstrates an effective separation of halogenated and non-halogenated plastics via density separation, which has been performed with the mixed plastic fractions.
To better understand the relevance of the above-reported halogen levels present in specific density fractions, the bromine and chlorine percentages were calculated from the measured XRF concentrations, as well as the percentages by weight of the respective density fractions.
Results for two SDA, two CRT, and two flat-panel samples are displayed in Figure 3.
Five out of six samples indicate an almost complete shift of bromine into density fractions 3 and 4, with a combined share exceeding 94% of the total bromine. Only sample 9 exhibits a 30% bromine load in density fraction 2, mainly due to a high weight share of this faction and a bromine level of >3000 ppm, which is untypical for this density class and may indicate an accidentally incomplete separation between density fraction 2 and 3. For chlorine loads, more than 72% end up in density fractions 3 and 4.
Nevertheless, this demonstrates that an effective separation of halogenated and non-halogenated plastics is possible via density separation. Based on our XRF results, the light fraction (<1.1 g/cm3) can be further processed without contaminant removal whereas the heavy fraction (>1.1 g/cm3) is a valuable input material for sophisticated extractive processes, such as the CreaSolv® Process.
Density fraction 3 had the highest halogen levels, which does not necessarily contradict recycling, however, such levels are indicative of the presence of BFRs including those prohibited in new products. Thus, specific types of BFRs were analysed by GC-ECD. Table 5 shows the different BFRs compared to the bromine value measured by XRF spectroscopy.
TBBPA showed the highest levels, ranging from 4147 to almost 23,000 ppm, followed by decaBDE (176–10,686 ppm) and BTBPE (<10–6766 ppm). Levels of hexa- through nona-BDE are lower but exceeded 1000 ppm in samples 6 and 11. However, a waste stream with TBBPA levels higher than 2500 ppm is classified as hazardous and leads to implications for waste treatment options. This level is exceeded in all six samples. Also, levels of hexa- through deca-BDE total for more than 1000 ppm in samples 4, 6, and 11, whereas a level of 500 ppm is exceeded in all samples but sample 15.

3.4. Dissolution Based Separation of BFR from ABS and PS

ABS and PS dissolved from DF 3 were subjected to the extractive cleaning step of the CreaSolv® Process. This issue will be described in much greater detail in a separate publication and is only briefly reported here. As indicated by XRF measurements of bromine and chlorine levels in samples of non-extracted and extracted ABS and PS, respectively, a significant reduction of halogenated additives was observed, e.g., for the PS sample from 61,740 ppm to 950 ppm bromine and from 18,080 ppm to 70 ppm chlorine. This corresponds to a bromine reduction of 98.5% and a chlorine reduction of 99.6%.

3.5. Material Properties

Three target polymers were recovered in our study from different WEEE sources by a combination of density separation and subsequent dissolution (including extractive cleaning from BFRs). ABS and PS were recovered from SDA, while PC was recycled from a mixture of SDA and ICT. Finally, samples of these recycled polymers were drawn and subjected to an analysis of material properties and specific levels of brominated flame retardants. Results are depicted in Table 6.
The measured MFR, Mw, and Tg of recycled polymers correspond well with the properties of virgin material, even though different grades of one plastic type are present in the mixed plastic fractions used as a feedstock for the recycling process. Furthermore, the recyclates also showed a nice glossy surface.
GC-ECD results show significantly lower BFR levels compared to concentrations reported in Table 5 for DF 3, used as a feedstock. These BFR levels comply with threshold values defined by the European directive on the restriction of hazardous substances (RoHS) and with the European POP regulation.

4. Discussion

4.1. Identification of Target Polymers

This study intends to provide relevant information on the plastic composition of WEEE materials for recycling. Due to density-based separation, a rough pre-sorting was established. According to Maris et al. [19], this classification separates polyolefins into DF 1, ABS and PS mainly into DF 2, and halogen-containing ABS, PS, as well as PC/ABS, PC and others into DF 3 and 4, as already indicated in Table 2. The authors report shares of ABS, PS, PP, PC/ABS, and PC in a 10 t batch of small WEEE appliances with 29%, 26%, 22%, 5%, and 3%. In quantitative terms, these five polymers represent the most promising target polymers for WEEE plastic recycling and dominate DF 1–3. The density cut at 1.25 g/cm3 was selected because fractions above this cut contain no relevant quantities of target polymers, however polymers like hard PVC and POM are separated from the stream of target polymers. Even low PVC shares may initiate a deliberation of HCl during re-compounding and cause degradation of other polymers. Furthermore, small amounts of POM may have a negative influence on the extrusion, as it may degrade and form and release formaldehyde, a chemical compound that is considered carcinogenic [25].
As summarised in Figure 2, density fractions 1 and 2 make up a share of approximately 50% of the input material. The differences between individual samples in the same sources can be attributed to different WEEE providers of the recyclers, different use patterns in different European regions but also to chance, taking the high temporal variability of WEEE composition into account. The sources of the investigated mixed plastic fractions vary greatly. The polymer composition in the light fraction breaks down as follows, for CRT and LCD the share of PP/PE is about 5%, whereas the non-halogenated ABS/PS share is around 70% in CRT and around 30% in LCD. On the other hand, polymers from DF 3 dominate in flat panel (LCD) samples (~60%). However, in the small domestic appliance fraction, the distribution of polymers is relatively similar. There, the different density fractions are almost equally distributed at approximately 30 (+/− 5)%. These figures are consistent with the data presented in the study by Martinho et al. [21] on the plastic composition for WEEE appliances. The technologically robust and cost-effective processing step using density separation transforms the mixed WEEE plastic fractions into valuable input materials for plastics recyclers. Therefore, DF 1 and 2 are currently used for polymer recycling from WEEE plastics on an industrial scale. Otherwise, the fraction >1.1 g/cm3 is currently not further used due to expected high bromine and chlorine contents, which will be further discussed in Section 4.2.
The results of selective dissolution of specific polymers from pre-sorted heavy fractions (claimed as >1.1 g/cm3) provided from three different European WEEE plastics recyclers (samples 1–8, Figure 2) show that the proportion of the four target polymers ABS, PS, PC, and PC/ABS is very high, on average about 83%.
The proportions of these target plastics in fractions >1.1 g/cm3 were further elaborated in this study and are shown in Figure 2. With the help of selective dissolution, it was possible to split the plastic mix into individual polymer streams. In total, 66 w% were recovered as target polymers and around 30% of the >1.1 g/cm3 mixed plastic fraction was discarded due to insolubility or dirt. FT-IR analyses of the recycled materials revealed that the polymer solutions refer to the expected target polymers and indicate a reasonable purity.
Considering the high share of DF 3 in WEEE plastic mixes (Figure 1), the high share of target polymers in DF 3 as well as the obtained purities, the inclusion of this density fraction into WEEE plastics recycling strategies is highly recommended.

4.2. Characterization and Management of Halogen and BFR Content

Measurement of halogen concentrations (Table 3 and Figure 3) indicate that a density separation at around 1.1 g/cm3 not only presorts groups of polymers, it additionally concentrates halogens, including brominated flame retardants in the higher density fractions. Even if the bromine levels in the two lighter fractions are not zero, our data indicate a removal of more than 94% of bromine when using DF 1 and DF 2 for mechanical recycling directly.
It must be stated that density separations reported for samples 9 to 17 were performed in batch vessels at the laboratory level and do not reflect industrial-scale separation performance. In this setup, a small share of particles with densities >1.1 g/cm3 may float if they lie on a bed of lighter particles. Thus, bromine levels measured in DF 1 and 2 of samples 9–17 may overestimate typical bromine levels of density fractions produced at industrial scale. Commercial operations of that technology have established an industry standard that requests a maximum bromine level of 2000 ppm in fractions below 1.1 g/cm3 [6].
Concentrations and profiles of brominated flame retardants reported in our study reflect the use pattern of 2001 when the global demand for decaBDE accounted for 83% of the BFR market [26] and the use of TBBPA reached up to 200,000 tons [27]. It is therefore not surprising that these were the flame retardants with the highest proportion in the samples investigated in this study. A decline of decaBDE is expected in the upcoming years due to the phase-out of its use after being listed as a POP. Elevated levels of TBBPA have been found in the blood plasma of recycling plant employees, confirming human exposure and indicating the need for proper and safe handling of such materials in recycling facilities [28].
Keeping in mind the above-mentioned thesis that polymers from DF 3 may contribute to future polymer recycling, measured halogen and BFR levels are critical. As mentioned above, recycled polymers have to comply with European thresholds for brominated flame retardants (e.g., 1000 ppm of PBDEs according to the RoHS directive).
Furthermore, the reported TBBPA levels above 2500 ppm classify such density fractions as hazardous waste due to the H14 clause in EU regulation 2017/997. Waste streams are indicated as hazardous if total PBDE levels exceed 0.1%. In such a case they require a treatment process that is listed in Annex IV A of the Basel Convention. Here the solvent-based CreaSolv® Process is recognized as a D9 process (physicochemical treatment) as it allows separating POP compounds from the polymer, enabling downstream recovery of POP-free polymers, while the POPs are subjected to a destruction process [20,29].
In this study we achieved a bromine reduction of 98.5 (+/− 1.8)% and a chlorine reduction of 99.6 (+/− 2.8)% in a PS sample recovered from the mixed plastic fraction by application of the dissolution based CreaSolv® Process, which is in accordance with prior studies [20,29]. Therefore, the BFRs are almost completely extracted from the polymers and after substantial enrichment during solvent recovery, they may be further treated by pyrolysis and high temperature gasification for recovery of oil, inorganic bromine (HBr, NBr), and chlorine (HCl) for further use [30,31].
Levels of decaBDE were between 10 ppm and 108 ppm after the CreaSolv® Process and thus safely below the European threshold of 1000 ppm. The concentrations of other BFRs (e.g., TBBPA) were below 100 ppm and do not negatively affect their market value. These findings show that the recycled polymers from the mixed WEEE plastic fraction have a valuable place in the recycling market.
The technical feasibility of this approach is currently demonstrated at an industrial scale in a project called LIFE-PSLoop Polystyrene Loop, which treats PS foams from demolition waste containing HBCD, which is according to the European Union identified as a Substance of Very High Concern (SVHC) due to its persistant bioaccumulative toxic (PBT) properties. The elimination of this flame retardant is mandatory for a circular economy. By the CreaSolv® Process, a purification of 99.7% is reached [29]. Through this project, an industrial recycling plant called PolyStyreneLoop was built in Terneuzen, Netherlands. The plant can recycle 3300 tons per year of PS-foam from demolition waste containing HBCD.

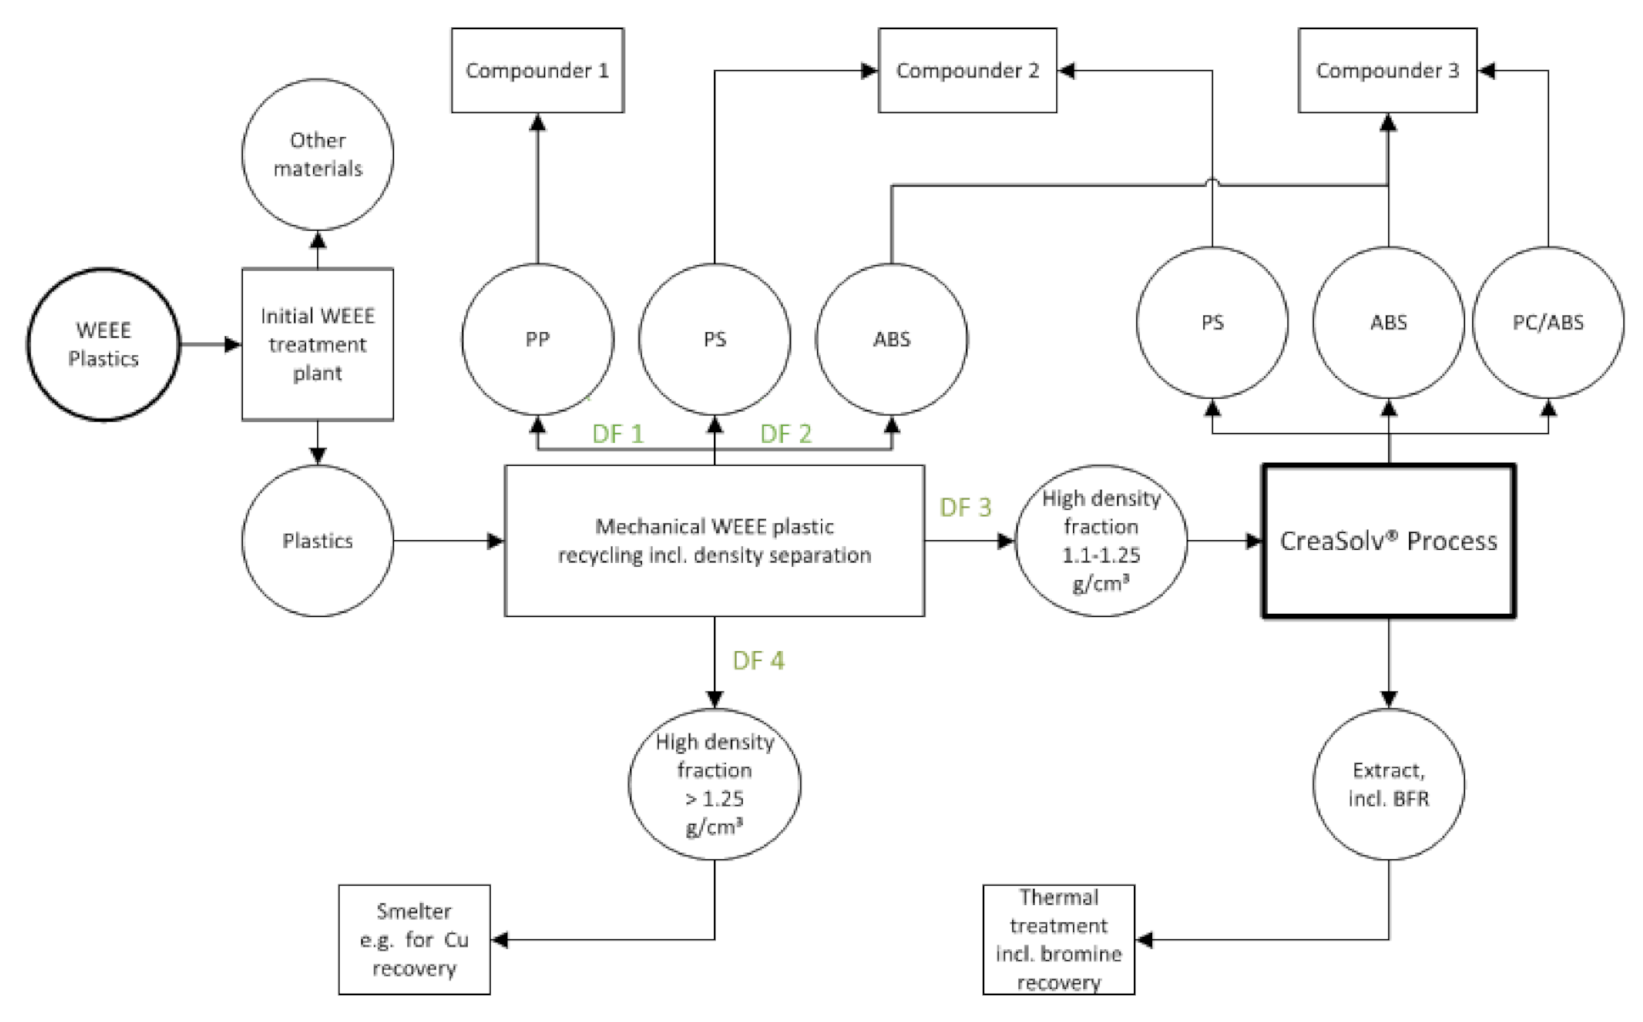
4.3. Recycling Concept Derived from Laboratory Scale Trials and Effect of BFR Management

A recycling concept can now be drawn up from the laboratory trials carried out, which is considered useful in the context of the above-mentioned NONTOX project. Using density separation, a rough classification of the fractions into high-halogenated (DF 3 + 4) and low-halogenated plastics (DF 1 + 2) is possible. Due to the dissolution process, however, a high purification of the halogenated plastics can be performed. The concept is outlined in Figure 4.
The concept can easily be implemented in current European WEEE treatment schemes that produce a plastic fraction in initial WEEE treatment plants. These are transferred to mechanical recycling plants that apply density based separation and subsequent purification to produce ABS, PS and PP with acceptable low bromine levels. Instead of state-of-the-art treatment in incineration plants, high density fractions with increased halogen levels may in future be subjected to a CreaSolv® Process (DF3) whereas materials with densities higher than 1.25 may be used in smelters if they contain sufficient copper levels. Dissolution-based processing will provide purified polymers like PS, ABS, and PC, PC/ABS as well as a halogen rich extraction residue, which may be used for bromine recovery in thermal destruction units [31]. The concept is based on a network of large, medium, and even small enterprises as it includes a large scale smelter, an initial treatment plant, medium scale recycling operators of mechanical and dissolution based plastics separation and purification as well as small and medium scale compounders.
The concept addresses in the first place developed countries with existing established state-of-the art WEEE recycling schemes (e.g., according to the WEEELabex standard). If implemented, a higher degree of valorization is expected, that may result in a financially beneficial situation and prevent the current practice of export [3]. The economic efficiency depends on different parameters like throughput of waste, size of plant, purity, and value of target polymers.
The effectiveness of the dissolution process may be improved by implementing a sensor-based sorting system after density separation, which increases the purity of the fractions (PS, ABS, and PC) for the dissolution process and saves unnecessary pre-extraction steps. Due to the high incidence of black colours in WEEE plastics laser spectroscopy may be most beneficial here [20]. These will be investigated in future studies.
Most bromine was found in PS and ABS, whereas almost no bromine was found in PC and PC/ABS as earlier reported by Arends et al. [32]. The measured bromine and chlorine contents of PC, PC/ABS were below 2000 ppm for each sample. As TBBPA is the major BFR used in these polymers they could be recycled without any further treatment. However, due to the density separation, these polymers end up in the density fraction >1.1 g/cm3. This can be avoided, for example, by the above suggested laser-induced sorting, separating ABS and PS from the PC, PC/ABS.
Another advantage of the density-based sorting is, that BFRs are enriched in the density fraction above 1.1 g/cm3. Due to this fact the recovery rate of non-halogenated plastics is around 50–60%, meaning that the rest (~30%) is still landfilled or incinerated nowadays.
A combination of density separation and dissolution, as proposed in this study, allows recovery of ABS and PS from sources with a higher concentration of BFRs plastics, nevertheless, safe treatment of BFRs is guaranteed. Furthermore, the yield of target polymers is significantly increased since ABS + BFR, PS + BFR, and PC, PC/ABS can be recovered. Our trials have shown that over 60% of target plastics can be recovered due to this combination of technologies. The BFR levels in residual plastics are substantially reduced, the chlorine content of the residue, however, is still high, mainly due to PVC. If pyrolysis is chosen for the further valorization of such residues, such processes must prove their ability to comply with high chlorine loads.

Author Contributions

Conceptualization, M.S., and S.W., L.S.; methodology, T.L., L.S. and S.W.; writing—original draft preparation, L.S. and T.D.; writing—review and editing, M.S. and S.W.; All authors have read and agreed to the published version of the manuscript.

Funding

This research was part of the European NONTOX project and supported by European Union’s Horizon 2020 research and innovation program under grant agreement No. 820895.

Conflicts of Interest

The authors declare no conflict of interest.

Abbreviations

ABSacrylonitrile butadiene styrene copolymer
BFRbrominated flame retardants
Brbromine
Clchlorine
CRTcathode ray tube
DFdensity fraction
FT-IRFourier transform infrared
ggramm
g/10 mingrams per ten minutes
g/molGrams per mol
g/cm3grams per cubic centimeter
mmMillimeter
µmMikrometer
minminute
HIPShigh impact polystyrene
ICTInformation and Communication Technology
kgkilograms
K/minKelvin per minute
LCDliquid-crystal-display
MFRmelt flow rate
RoHSrestriction of hazardous substances directive
SDAsmall domestic appliances
PApolyamide
PSpolystyrene
PCpolycarbonate
PPpolypropylene
PEpolyethylene
PBTpersistant bioaccumulative toxic
POMpolyocymethylene
POPpersistent organic pollutants
PVCpolyvinyl chloride
ppmparts per million
WEEEwaste of electrical and electronic equipment
XRFX-ray fluorescence
°Cdegree celsius

References

  1. Wagner, F.; Peeters, J.R.; de Keyzer, J.; Janssens, K.; Duflou, J.R.; Dewulf, W. Towards a more circular economy for WEEE plastics—Part A: Development of innovative recycling strategies. Waste Manag. 2019, 100, 269–277. [Google Scholar] [CrossRef] [PubMed]
  2. Bressanelli, G.; Saccani, N.; Pigosso, D.C.A.; Perona, M. Circular Economy in the WEEE industry: A systematic literature review and a research agenda. Sustain. Prod. Consum. 2020, 23, 174–188. [Google Scholar] [CrossRef]
  3. Cardamone, G.F.; Ardolino, F.; Arena, U. About the environmental sustainability of the European management of WEEE plastics. Waste Manag. 2021, 126, 119–132. [Google Scholar] [CrossRef] [PubMed]
  4. Harrad, S.; Drage, D.S.; Sharkey, M.; Berresheim, H. Brominated flame retardants and perfluoroalkyl substances in landfill leachate from Ireland. Sci. Total Environ. 2019, 695, 133810. [Google Scholar] [CrossRef]
  5. Leslie, H.A.; Leonards, P.E.G.; Brandsma, S.H.; de Boer, J.; Jonkers, N. Propelling plastics into the circular economy—weeding out the toxics first. Environ. Int. 2016, 94, 230–234. [Google Scholar] [CrossRef]
  6. Wagner, S.; Schlummer, M. Legacy additives in a circular economy of plastics: Current dilemma, policy analysis, and emerging countermeasures. Resour. Conserv. Recycl. 2020, 158, 104800. [Google Scholar] [CrossRef]
  7. Schlummer, M.; Gruber, L.; Mäurer, A.; Wolz, G.; van Eldik, R. Characterisation of polymer fractions from waste electrical and electronic equipment (WEEE) and implications for waste management. Chemosphere 2007, 67, 1866–1876. [Google Scholar] [CrossRef]
  8. Stubbings, W.A.; Abdallah, M.A.-E.; Misiuta, K.; Onwuamaegbu, U.; Holland, J.; Smith, L.; Parkinson, C.; McKinlay, R.; Harrad, S. Assessment of brominated flame retardants in a small mixed waste electronic and electrical equipment (WEEE) plastic recycling stream in the UK. Sci. Total Environ. 2021, 780, 146543. [Google Scholar] [CrossRef]
  9. Hale, R. Polybrominated diphenyl ether flame retardants in the North American environment. Environ. Int. 2003, 29, 771–779. [Google Scholar] [CrossRef]
  10. Darnerud, P. Toxic effects of brominated flame retardants in man and in wildlife. Environ. Int. 2003, 29, 841–853. [Google Scholar] [CrossRef]
  11. Sindiku, O.; Babayemi, J.O.; Tysklind, M.; Osibanjo, O.; Weber, R.; Watson, A.; Schlummer, M.; Lundstedt, S. Polybrominated dibenzo-p-dioxins and dibenzofurans (PBDD/Fs) in e-waste plastic in Nigeria. Environ. Sci. Pollut. Res. Int. 2015, 22, 14515–14529. [Google Scholar] [CrossRef]
  12. Hahladakis, J.N.; Velis, C.A.; Weber, R.; Iacovidou, E.; Purnell, P. An overview of chemical additives present in plastics: Migration, release, fate and environmental impact during their use, disposal and recycling. J. Hazard. Mater. 2018, 344, 179–199. [Google Scholar] [CrossRef]
  13. Schlummer, M. Polymer Green Flame Retardants. In Polymer Green Flame Retardants; Elsevier: Amsterdam, The Netherlands, 2014; Volume 25, pp. 869–889. [Google Scholar]
  14. Aldrian, A.; Ledersteger, A.; Pomberger, R. Monitoring of WEEE plastics in regards to brominated flame retardants using handheld XRF. Waste Manag. 2015, 36, 297–304. [Google Scholar] [CrossRef]
  15. Jandric, A.; Part, F.; Fink, N.; Huber-Humer, M.; Salhofer, S.; Zafiu, C. Bromierte Flammschutzmittel in Elektroaltgeräten: Untersuchung der Brom-Konzentration nach Kunststofftypen und Gerätekategorien mittels Röntgenfluoreszenzanalyse. Österr Wasser Abfallw 2020, 72, 68–76. [Google Scholar] [CrossRef] [Green Version]
  16. Schlummer, M.; Mäurer, A.; Leitner, T.; Spruzina, W. Recycling of flame-retarded plastics from waste electric and electronic equipment (WEEE)//Report: Recycling of flame-retarded plastics from waste electric and electronic equipment (WEEE). Waste Manag. Res. 2006, 24, 573–583. [Google Scholar] [CrossRef]
  17. Maisel, F.; Chancerel, P.; Dimitrova, G.; Emmerich, J.; Nissen, N.F.; Schneider-Ramelow, M. Preparing WEEE plastics for recycling—How optimal particle sizes in pre-processing can improve the separation efficiency of high quality plastics. Resour. Conserv. Recycl. 2020, 154, 104619. [Google Scholar] [CrossRef]
  18. Araujo-Andrade, C.; Bugnicourt, E.; Philippet, L.; Rodriguez-Turienzo, L.; Nettleton, D.; Hoffmann, L.; Schlummer, M. Review on the photonic techniques suitable for automatic monitoring of the composition of multi-materials wastes in view of their posterior recycling. Waste Manag. Res. J. Int. Solid Wastes Public Clean. Assoc. ISWA 2021, 734242X21997908. [Google Scholar]
  19. Maris, E.; Botané, P.; Wavrer, P.; Froelich, D. Characterizing plastics originating from WEEE: A case study in France. Miner. Eng. 2015, 76, 28–37. [Google Scholar] [CrossRef] [Green Version]
  20. Dodbiba, G.; Shibayama, A.; Sadaki, J.; Fujita, T. Combination of Triboelectrostatic Separation and Air Tabling for Sorting Plastics from a Multi-Component Plastic Mixture. Mater. Trans. 2003, 44, 2427–2435. [Google Scholar] [CrossRef] [Green Version]
  21. Martinho, G.; Pires, A.; Saraiva, L.; Ribeiro, R. Composition of plastics from waste electrical and electronic equipment (WEEE) by direct sampling. Waste Manag. 2012, 32, 1213–1217. [Google Scholar] [CrossRef]
  22. Balart, R.; López, J.; García, D.; Dolores Salvador, M. Recycling of ABS and PC from electrical and electronic waste. Effect of miscibility and previous degradation on final performance of industrial blends. Eur. Polym. J. 2005, 41, 2150–2160. [Google Scholar] [CrossRef]
  23. Dong Hwang, Y.; Woon Cha, S. The relationship between gas absorption and the glass transition temperature in a batch microcellular foaming process. Polym. Test. 2002, 21, 269–275. [Google Scholar] [CrossRef]
  24. Arabeche, K.; Delbreilh, L.; Adhikari, R.; Michler, G.H.; Hiltner, A.; Baer, E.; Saiter, J.-M. Study of the cooperativity at the glass transition temperature in PC/PMMA multilayered films: Influence of thickness reduction from macro- to nanoscale. Polymer 2012, 53, 1355–1361. [Google Scholar] [CrossRef]
  25. Swenberg, J.A.; Moeller, B.C.; Lu, K.; Rager, J.E.; Fry, R.C.; Starr, T.B. Formaldehyde carcinogenicity research: 30 years and counting for mode of action, epidemiology, and cancer risk assessment. Toxicol. Pathol. 2013, 41, 181–189. [Google Scholar] [CrossRef] [Green Version]
  26. LaA Guardia, M.J.; Hale, R.C.; Harvey, E. Detailed polybrominated diphenyl ether (PBDE) congener composition of the widely used penta-, octa-, and deca-PBDE technical flame-retardant mixtures. Environ. Sci. Technol. 2006, 40, 6247–6254. [Google Scholar] [CrossRef]
  27. Morose, G. An Overview of Alternatives to Tetrabromobisphenol A (TBBPA) and Hexabromocyclododecane (HBCD). Available online: https://webcache.googleusercontent.com/search?q=cache:90hSjjf1xd0J:https://www.chemicalspolicy.org/downloads/AternativestoTBBPAandHBCD.pdf+&cd=2&hl=de&ct=clnk&gl=de&client=firefox-b-e (accessed on 30 March 2021).
  28. Scientific Opinion on Emerging and Novel Brominated Flame Retardants (BFRs) in Food. EFSA J. 2012, 10, 2908. [CrossRef]
  29. Schlummer, M.; Maurer, A.; Wagner, S.; Berrang, A.; Fell, T.; Knappich, F. Recycling of flame retarded waste polystyrene foams (EPS and XPS) to PS granules free of hexabromocyclododecane (HBCDD). Adv. Recycl. Waste Manag. 2017, 2. [Google Scholar] [CrossRef]
  30. Tange, T.; Drohmann, D. Closing the Bromine Cycle for Plastics from Electrical and Electronic Waste Using Staged Gasification. Available online: https://www.researchgate.net/publication/242198374_WASTE_MANAGEMENT_CONCEPT_FOR_WEEE_PLASTICS_CONTAINING_BROMINATED_FLAME_RETARDANTS_INCLUDING_BROMINE_RECYCLING_AND_ENERGY_RECOVERY (accessed on 26 April 2021).
  31. Hense, P. Development and Optimization of a Thermo-Chemical Process for Recycling Waste Electrical and Electronic Equipment, Amsdottorato. 2019. Available online: http://amsdottorato.unibo.it/id/eprint/7900 (accessed on 14 May 2021).
  32. Arends, D.; Schlummer, M.; Mäurer, A.; Markowski, J.; Wagenknecht, U. Characterisation and materials flow management for waste electrical and electronic equipment plastics from German dismantling centres. Waste Manag. Res. J. Int. Solid Wastes Public Clean. Assoc. ISWA 2015, 33, 775–784. [Google Scholar] [CrossRef]
Figure 1. Overview of the density distributions from the different fractions (S = sample).
Recycling 06 00033 g001
Figure 2. Overview of the composition of the different WEEE plastic fraction >1.1 g/cm3 (S = sample).
Recycling 06 00033 g002
Figure 3. Bromine (above) and chlorine (below) freights continued in the 4 density fractions of untreated WEEE samples from SDA, ICT, CRT and flat screens.
Recycling 06 00033 g003
Figure 4. Recycling concept for WEEE plastics combining density separation with CreaSolv® Process.
Recycling 06 00033 g004
Table 1. Overview of the investigated materials, with respect to source and sampling date and country of origin.
Sample NameSourceDescriptionSampling YearCountryMass [kg]
Sample 1ICTPlastic mix > 1.1 g/cm311/2019Netherlands5
Sample 2ICTPlastic mix > 1.1 g/cm305/2020Netherlands20
Sample 3WEEE mix (SDA/ICT/Screens)Plastic mix > 1.1 g/cm309/2019Sweden5
Sample 4WEEE mix (SDA/ICT)Plastic mix > 1.1 g/cm311/2019Spain5
Sample 5WEEE (TV’s)Plastic mix > 1.1 g/cm311/2019Spain5
Sample 6CRTPlastic mix > 1.1 g/cm309/2019Netherlands25
Sample 7WEEE mix (Monitors)Plastic mix > 1.1 g/cm311/2019Spain5
Sample 8SDAPlastic mix > 1.1 g/cm309/2019Netherlands25
Sample 9SDAPlastic mix09/2019Italy5
Sample 10SDAPlastic mix09/2019Italy5
Sample 11SDAPlastic mix08/2019Italy20
Sample 12CRTPlastic mix08/2019Italy20
Sample 13CRTPlastic mix04/2020Italy20
Sample 14CRTPlastic mix05/2020Italy20
Sample 15Flat screen (LCD)Plastic mix10/2019Italy20
Sample 16Flat screen (LCD)Plastic mix05/2020Italy20
Sample 17Flat screen (LCD)Plastic mix12/2020Italy20
ICT = information and communication technology, WEEE = waste of electric and electronic equipment, CRT = cathode ray tube, SDA = small domestic appliances, LCD = liquid crystal display.
Table 2. Density fractions and plastic groups.
Density Fraction (DF)DensityPolymers
DF 1<1.0 g/cm3PE, PP
DF 21.0–1.1 g/cm3ABS (non-halogenated)
PS (non-halogenated)
DF 31.1–1.25 g/cm3ABS (halogenated),
PS (halogenated)
PC, Soft PVC, PMMA
DF 4>1.25 g/cm3POM, Hard PVC, PA
Table 3. Overview of the bromine and chlorine content in mg/kg (ppm) of the different samples.
Sample NameSource<1.0 g/cm³1.0–1.1 g/cm³1.1–1.25 g/cm³>1.25 g/cm³
[ppm]BrClBrClBrClBrCl
Sample 1ICT----10,62110,940648047,443
Sample 2ICT----4335380606913,410
Sample 3WEEE----10,4022875791622,733
Sample 4WEEE----14,29616,190421428,917
Sample 5WEEE----45,85613,65313,76029,363
Sample 6CRT----27,61816,100357016,100
Sample 7WEEE----70,19310,2101335266,566
Sample 8SDA----9434544210,49815,800
Sample 9SDA69620843346454211,16733,700900035,300
Sample 10SDA228326553138447110,93353,367966752,033
Sample 11SDA1027268259877133,3277303850636,917
Sample 12CRT596168265619758,30010,933n.a.n.a.
Sample 13CRT75072591<1048,3402837328188,500
Sample 14CRT430<10358<1020,200.180024158,600
Sample 15LCD22222295048<1016,3331063187283
Sample 16LCD34969389303451<105644,510
Sample 17LCD2546<101757<1019,785<10196<10
- Not considered, since the sample consists only of the fraction >1.1 g/cm³. n.a not availaible.
Table 4. Bromine and chlorine values of the recycled materials, which is produced on industrial scale by means of density separation.
NameDescriptionSourceBr [ppm]Cl [ppm]
Recycler 1ABSSDA/ICT11971125
PP/PESDA/ICT380705
PSSDA/ICT173406
HIPSfridge76386
Recycler 2ABSWEEE1269641
PPWEEE145605
HIPSWEEE931570
Recycler 3ABSWEEE141148
PP/PEWEEE94284
PSWEEE613705
Table 5. Overview of GC-ECD results of selected samples from density fraction 1.1–1.25 g/cm³.
Polymer 1.1–1.25 g/cm³SourceTotal Bromine a [ppm]TBBPA [ppm]BTBPE [ppm]Hexa-Nona-BDE [ppm]Deca-BDE [ppm]
Sample 1ICT10,6214147341288279
Sample 4WEEE14,296948714813321453
Sample 6CRT27,61713,6166766123110,686
Sample 9SDA11,16741729993784
Sample 11SDA33,32722,698453825182038
Sample 15LCD16,3336966-237176
a Total bromine content measured by X-ray fluorescence analysis—no measured value available.
Table 6. Material properties of the recyclate.
PolymerUnitR-PSR-ABSR-PCPS, VirginABS, VirginPC, Vigin
Melt flow rate * (MFR)g/10 min4.2 +19.2 ++12.2 +++9.5 a,+22 b,++6.0 c,++++
Weight average of molecular weight (Mw) **g/mol163,498106,20544,379194,224105,81237,879
Tg (DSC)°C103.7107.7141.0100120148
GC-ECDTBBPA [ppm]<10<1047---
TBPE [ppm]<1022<10---
DecaBDE [ppm]108<1016---
a Numbers indicate properties of Styrolution PS 495N (INEOS Styrolution), a typical material for TV equipment component b Numbers indicate properties of Novodur® P2M-AT (INEOS Styrolution), a typical material for household appliances c Numbers indicate properties of Novodur® P2M-AT (INEOS Styrolution), a typical material for household appliances + 200 °C, 5 kg ++ 220 °C, 10 kg +++ 240 °C, 5 kg ++++ 300 °C, 1.2 kg * MFR virgin ranges obtained from online material database of Prospector available at www.materials.ulprospector.com (accessed on 12 February 2021) ** Moleculare weight from virgin material obtained from literature PS, ABS [23] and PC [24] * R-PS and R-ABS values obtained from sorting and purification of sample 11. R-PC values obtained from sorting and purification of a mixture of the sample 1 and 8.
Publisher’s Note: MDPI stays neutral with regard to jurisdictional claims in published maps and institutional affiliations.

