Article

Improving Fly Ash Brightness with Carbon and Iron Oxide Removal

State Key Laboratory of Pulp and Paper Engineering, South China University of Technology, 381 Wushan Road, Guangzhou 510641, China
*
Author to whom correspondence should be addressed.
Recycling 2020, 5(1), 5; https://doi.org/10.3390/recycling5010005
Submission received: 6 January 2020 / Revised: 20 February 2020 / Accepted: 27 February 2020 / Published: 3 March 2020

Abstract

:
In this paper, the brightness of fly ash is improved by carbon removal by heating and iron-containing oxides removal by acid treatment using a two-step method to realize the application of fly ash as filler or coating in the future, which not only increases the range of resource utilization of fly ash, but also reduces dust pollution. The modification results show that the brightness of fly ash reaches the maximum value of 38.27% ISO (Brightness unit) after decarburization by heating at 600 °C. On this basis, the Box–Benhnken design scheme is adopted to optimize the brightening process for removing iron-containing oxides in fly ash. Finally, when the concentration of hydrochloric acid is 15%, the acid leaching time is 0.75 h, the reaction temperature is 74 °C, and the brightness of fly ash can eventually increase to 43.92% ISO.

Graphical Abstract

1. Introduction

Fly ash (FA) is a finely dispersed solid waste mainly composed of glass phase, which is produced by high-temperature combustion of pulverized coal through a series of physical and chemical changes in a coal-fired boiler [1]. However, the FA from coal combustion processes is not hazardous from the radiological point of view [2]. With the development of the power industry, the output of fly ash from coal-fired power plants has increased year by year [3,4]. Today, there are about 800 million tones of fly ash generated each year over the world [5], and it is expected to increase up to 2100 million tones in 2031 or 2032 [6]. However, the global average utilization rate of fly ash is estimated to be nearly 25% [7,8]. Although fly ash is used as an abundant commodity in some countries, only a low percentage is used in others, especially in China. For China, Greenpeace has reported that the practical utilization rate is only 30% [9]. It is clear that a significant proportion of coal fly ash is left untreated. Once it is discharged into the environment, it will cause different degrees of pollution such as significant damage to water, air and soil, but also cause great harm to living beings. Therefore, the improvement of the utilization of fly ash and the development of its applications are extremely urgent [10].
Over the years, many scholars have studied the resource utilization of fly ash through various methods, and made breakthroughs in many aspects such as road construction [11,12,13], sewage treatment [14,15,16], mineral extraction [17,18] and catalysts [19,20]. However, there are still various problems in the utilization of fly ash in these fields, such as a generally low product yield, low usage and high processing cost. Hence, it is imperative to find a new way for the utilization of fly ash. It was found that the chemical components and physical structure of fly ash are very similar to some coatings and fillers like kaolin, and that it has great application potential in these fields. However, the low brightness of fly ash is the main reason to hinder its application as a filler and in coating in the future [21,22].
The color of fly ash mostly depends on carbon particles and the characteristics of crystalline minerals, especially iron-containing minerals. The carbon particles in the fly ash are residual unburned carbon due to insufficient combustion of coal powder, which is the chief culprit behind the gray or black color of the fly ash. At the same time, the depth of the color mainly lies on the content of the carbon in fly ash. Other important low-temperature mineral components, especially those iron-containing oxide components, also show different colors. For example, iron in the oxidized state 3+ is brown, red or yellow, while iron in the oxidized state 2+ is gray or gray with a blue hue. The magnetite particles containing divalent and trivalent irons are black, and some of them, especially those finely divided particles, may also be brown [23]. Therefore, removing these chromogenic components from fly ash is a necessary step to increase its brightness.
In view of improving the brightness of fly ash by removing carbon, many scholars have made use of the characteristics that the surface of black carbon particles is not easily wetted by water, and it is easy to attach to the air bubbles; the unburned free carbon is removed by flotation [24,25], but this method has some disadvantages. For example, the carbon removal efficiency is low, the increase in brightness of fly ash is not obvious, and the process operation conditions are complicated. For the removal of iron-containing minerals in fly ash, it is common to remove those magnetic minerals by magnetic adsorption, but there are still a large number of non-magnetic and low-magnetic iron-containing oxides, resulting in only a slight improvement in brightness after magnetic adsorption. Therefore, after removing carbon and iron-containing oxides from fly ash by using high-temperature heating and acid leaching treatment, the brightness of the fly ash can be greatly improved, which can increase the possibility of fly ash to be used as a filler or coating in the future.

2. Materials and Methods

2.1. Pretreatment of Fly Ash

A certain amount of fly ash was weighed and placed in an oven dried at 105 °C for 6 h. In the next step, it was sieved for 40 min using the slap standard vibration machine (BSJ-200, Xinxiang, China). Finally, fly ash intercepted on different mesh screens was bagged and prepared for further treatment.

2.2. High Temperature Carbon Removal

Seven sets of the same batch of fly ash were weighed. In detail, one set included five parallel samples and each parallel sample weighed 3 g. In the second step, these fly ashes were place in the muffle furnace (LU-960M, Beske Electronic Materials Co., Ltd., Luoyang, China) and calcined at 300 °C, 400 °C, 500 °C, 600 °C, 700 °C, 800 °C, 850° C and 900 °C, respectively. Its heating rate was 8 °C/min and the holding time was 2 h. In the final step, these samples were put into the dryer to prepare brightness testing and follow-up experiments.

2.3. Iron-Containing Oxides Removal by Acid Leaching

2.3.1. Process Method

A certain concentration of hydrochloric acid solution and fly ash were mixed in the container. The mass ratio of fly ash to liquid was 1:5. The reaction system was stirred at 300 r/min in a three-necked flask connecting to a reflux condenser. After this, the product was centrifuged five times in a centrifuge (TDZ5-WS, Changsha, China), and then washed several times via a circulating water vacuum pump until the pH value of the filter cake was very close to 7. Finally, the washed fly ash was placed in a vacuum drying oven for testing of brightness in the next step.

2.3.2. Box–Behnken Design and Response Surface Methodology

We consider the concentration of hydrochloric acid (A), acid leaching time (B) and reaction temperature (C), three factors affecting the brightness of fly ash after removing iron-containing oxide. At the same time, solid–liquid ratio and stirring speed are kept constant. To be more specific, the solid–liquid ratio was 1:5 and the stirring speed remained at 300 r/min. According to the Box–Behnken design, the brightness of fly ash is the response value, and the classic three-factor three-level response surface test table was chosen to optimize and determine the best process for removing iron-containing oxides and brightness by the fly ash acid treatment. The levels of Box–Behnken test design factors are shown in Table 1.

2.4. Characterizations of Samples

2.4.1. Testing of Chemical Composition

The concentrations of major and minor elements in the original fly ash were determined by X-ray spectroscopy (Axios Pw 4400, Almedo, The Netherlands), and the sample was sampled at 0.5 g, and the measurement was carried out on a wavelength dispersive X-ray fluorescence spectrometer. The radiation source is an X-ray tube with a Co target, a high voltage of 30 kV, a current of 20 mA, and a measurement time of 300 s.

2.4.2. Testing of Phase and Crystal

An X-ray diffractometer (Bruker D8 ADVANCE, Karlsruhe, Germany) was used to test the material components of the original fly ash. The main technical indicators are: X-ray source output power 3 kW; 2θ measurement range −100°~150°; angular accuracy ≤0.01°; repeatability ≤0.001°; reproducibility ≤0.002°; LynxEye array detector; dynamic range: 1 × 10⁸ cps; energy resolution ≤20% (Cu).

2.4.3. Testing of Powder Brightness

The L&W brightness meter (Elrepho 070, Kista, Sweden) is used to measure the brightness of the fly ash particles treated in different stages, according to the national standard (GB/T 23774-2009) test method. Firstly, the instrument is calibrated using a standard whiteboard, and then the brightness of the powder particles is tested. First, the powder sampler is used for filling, and under the same test condition, the angle of the sample is rotated, and the results of three consecutive measurements are only less than 0.3, and the average value of three determination results is taken as the brightness value of the sample.

3. Results and Discussion

3.1. Analysis of Phase Composition of Original Fly Ash

The broad characteristic diffraction peak appearing from 2θ at 22°–35° in Figure 1 indicates the presence of vitreous materials [26]. In addition to glass, the other major phase compositions of fly ash are also shown in Figure 1. The important phases are mullite, lime, quartz and silicate. In addition to unburned carbon (dark black), the color of fly ash is mainly affected by hematite (reddish brown) and its iron-containing oxides. It is difficult to find the presence of magnetite in fly ash, probably due to the fact that such fly ash does not contain magnetite or a small amount.

3.2. Analysis of Chemical Composition of Original Fly Ash

The chemical composition of the original fly ash is shown in Table 2, SiO2 > Al2O3 > CaO > Fe2O3. According to the McCarthy classification, the CaO content of the original fly ash is less than 10%, which belongs to the low calcium fly ash series [27]. The content of each element was determined by XRF analysis. In combination with Figure 1, the content of SiO2 and Al2O3 is high, which also indicates that mullite and quartz are important phases. It can be seen from Table 1 that the content of iron-containing oxides in the original fly ash is relatively high, which has a severe impact on the color of fly ash.

3.3. Screening Analysis of the Original Fly Ash

As shown in Table 3 below, the brightness exhibited by the original fly ash under different mesh numbers is also quite different, which is related to the average particle size of different substances in the fly ash. For example, unburned carbon particles tend to show a relatively large particle size [28], so they are mostly trapped on a sieve mesh of 400 mesh or more. In consideration of the brightness of the powder, the required particle size and the amount of the filler, the pulverized coal retained by the 600 mesh screen is more suitable for the subsequent modification.

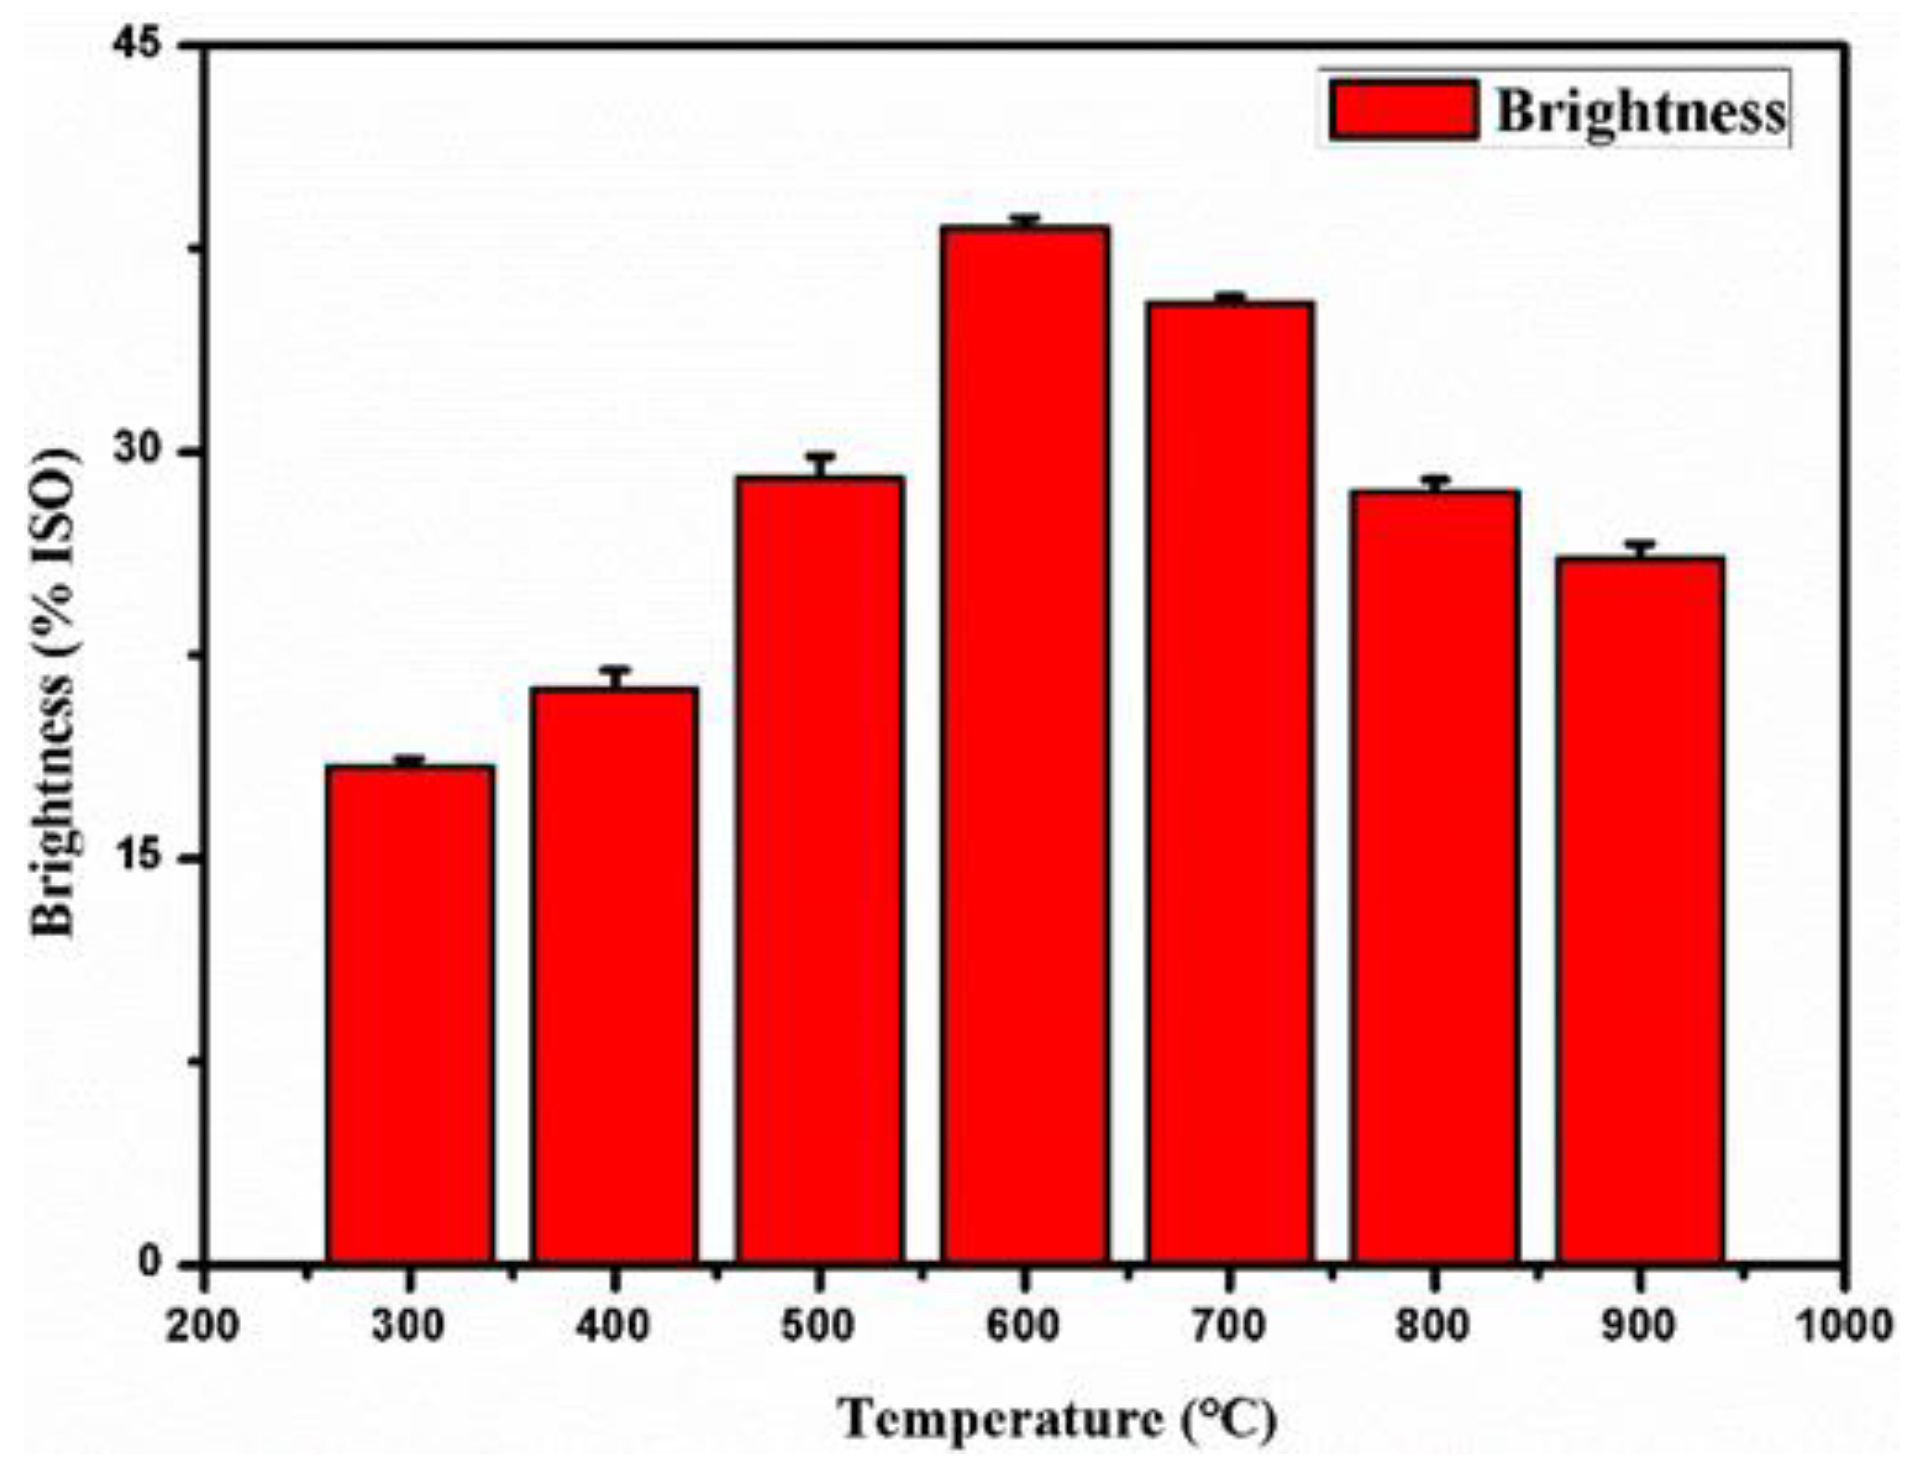
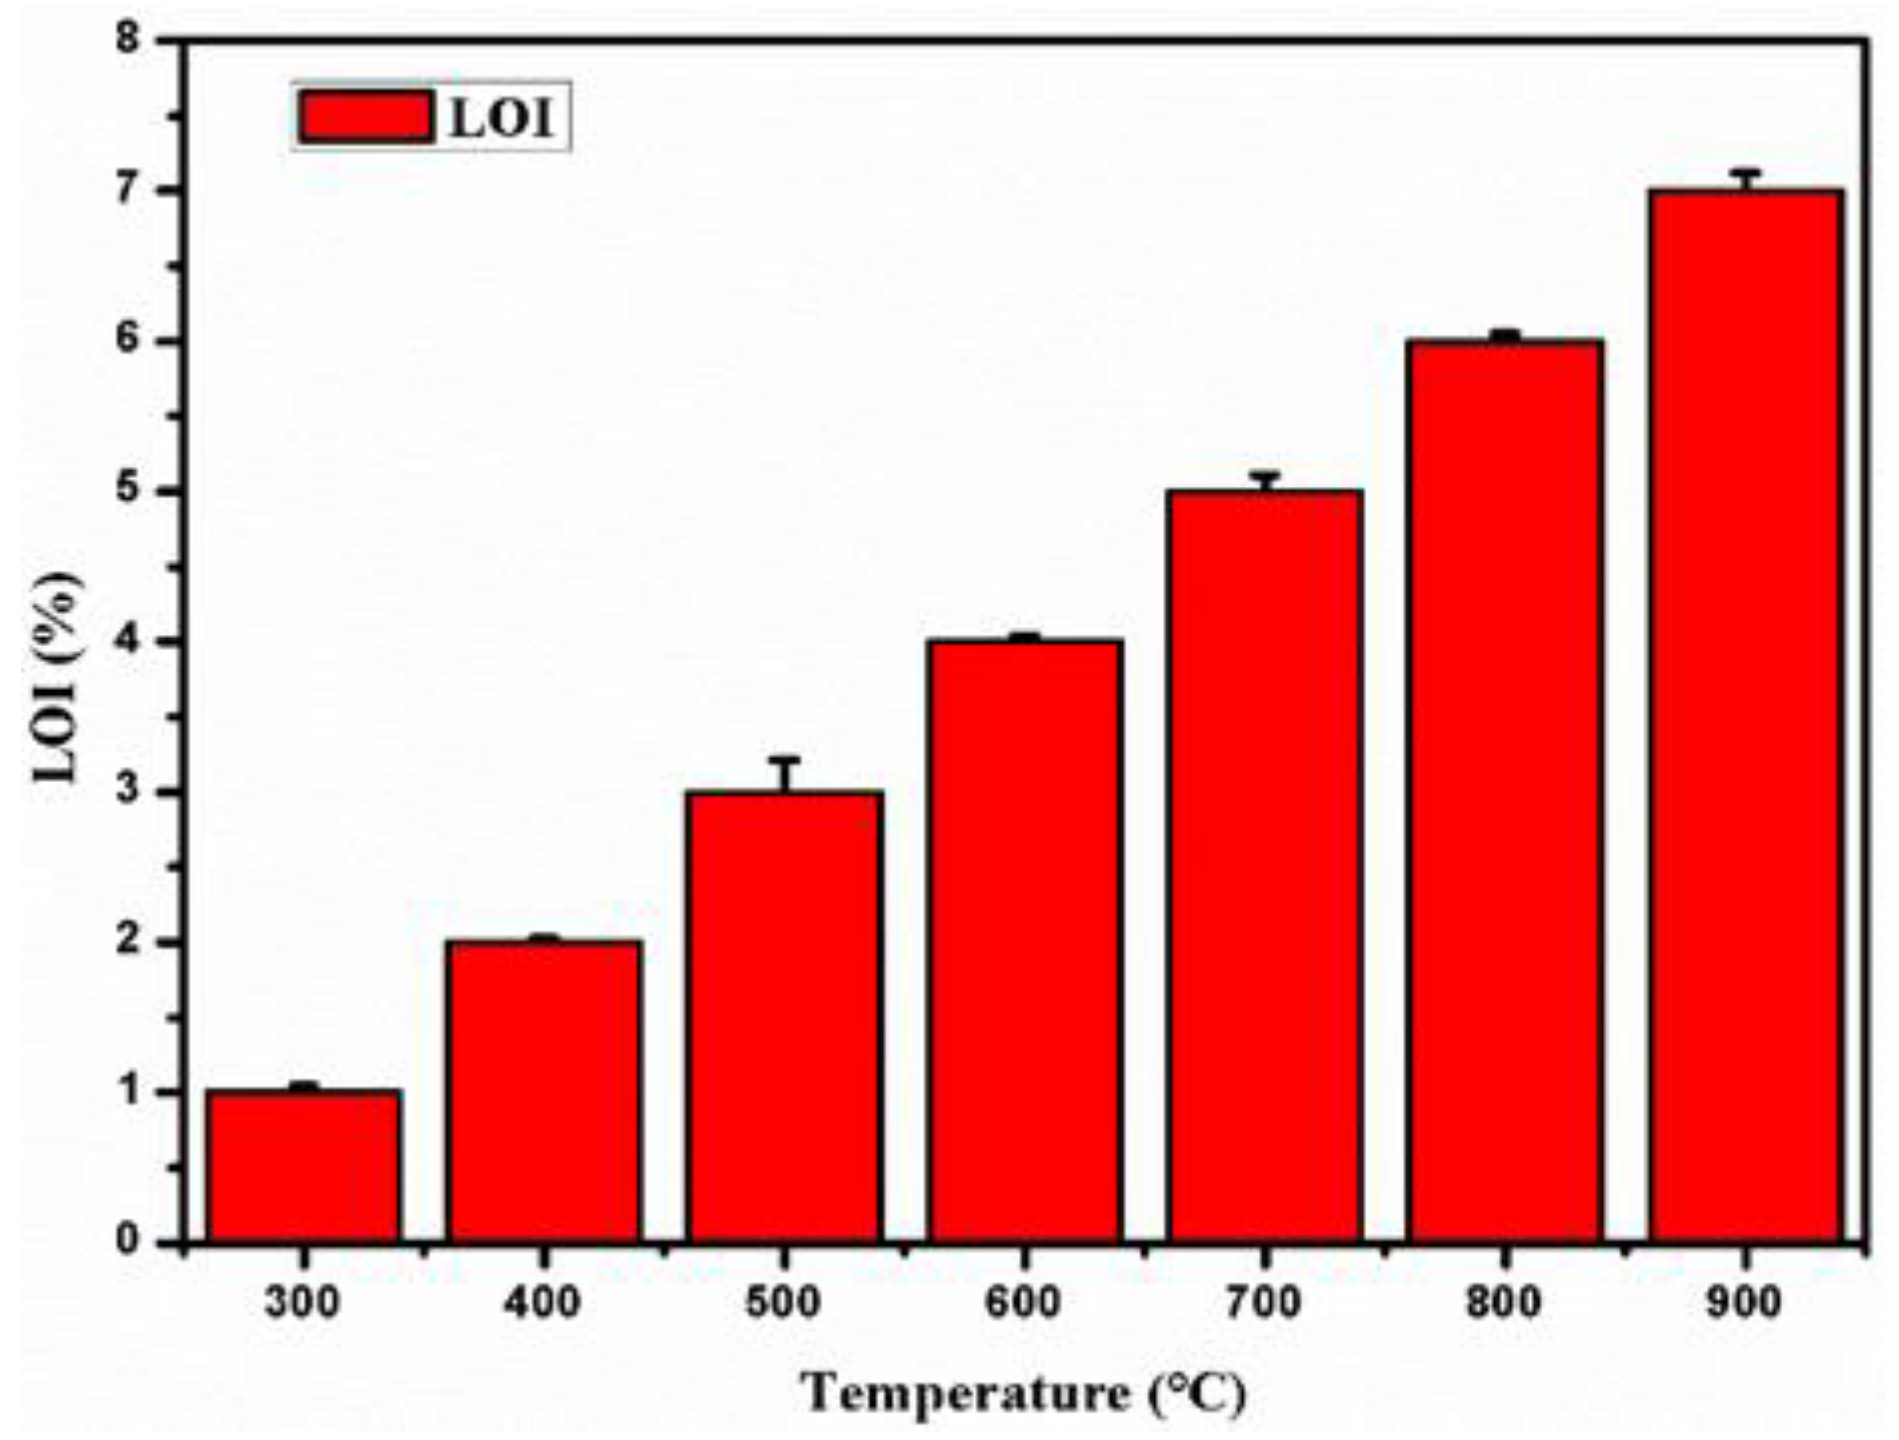
3.4. Analysis of High Temperature Carbon Removal

Figure 2 and Figure 3 illustrate that before 600 °C, the brightness value of fly ash improves with the increase of heating temperature, which involves oxidation of some organic carbon in the early stage due to the environment of high temperature. Above 500 °C, a large number of free carbon particles have been removed, which made the brightness of fly ash improve rapidly. The brightness of fly ash reached a maximum of 38.27% ISO at 600 °C. However, as the heating temperature continued to increase, the brightness of fly ash began to decrease. This is related to the decomposition of some minerals in fly ash and the oxidation of low-valent iron-containing oxides.
The loss on ignition includes destruction of the unburned carbon present and breakdown of mineral phases (e.g., decomposition of carbonates, oxidation of sulfides, release of structure water from clay minerals, and dehydration of lime) [29]. In combination with Figure 4, the general reaction of fly ash heated at different temperatures can be roughly as follows:
300–500 °C, MgCO3 MgO + CO2
FeS + O2 Fe3O4 + Fe2O3 + SO2 (a little amount)
C (a little amount) + O2 CO2
500–700 °C, C + O2 CO2
CaCO3 CaO + CO2 (a little amount)
700–900 °C, FeS + O2 Fe2O3 + SO2 (a little amount)
FeO + O2 Fe2O3
Fe3O4 + O2 Fe2O3
In conclusion, 600 °C is the ideal temperature for removing carbon by high-temperature heating, which cannot only achieve maximum improvement of brightness, but also avoid oxidation of a large number of iron-containing minerals to reduce the acid consumption in the next step.

3.5. Analysis of Iron-Containing Oxides by Acid Treatment

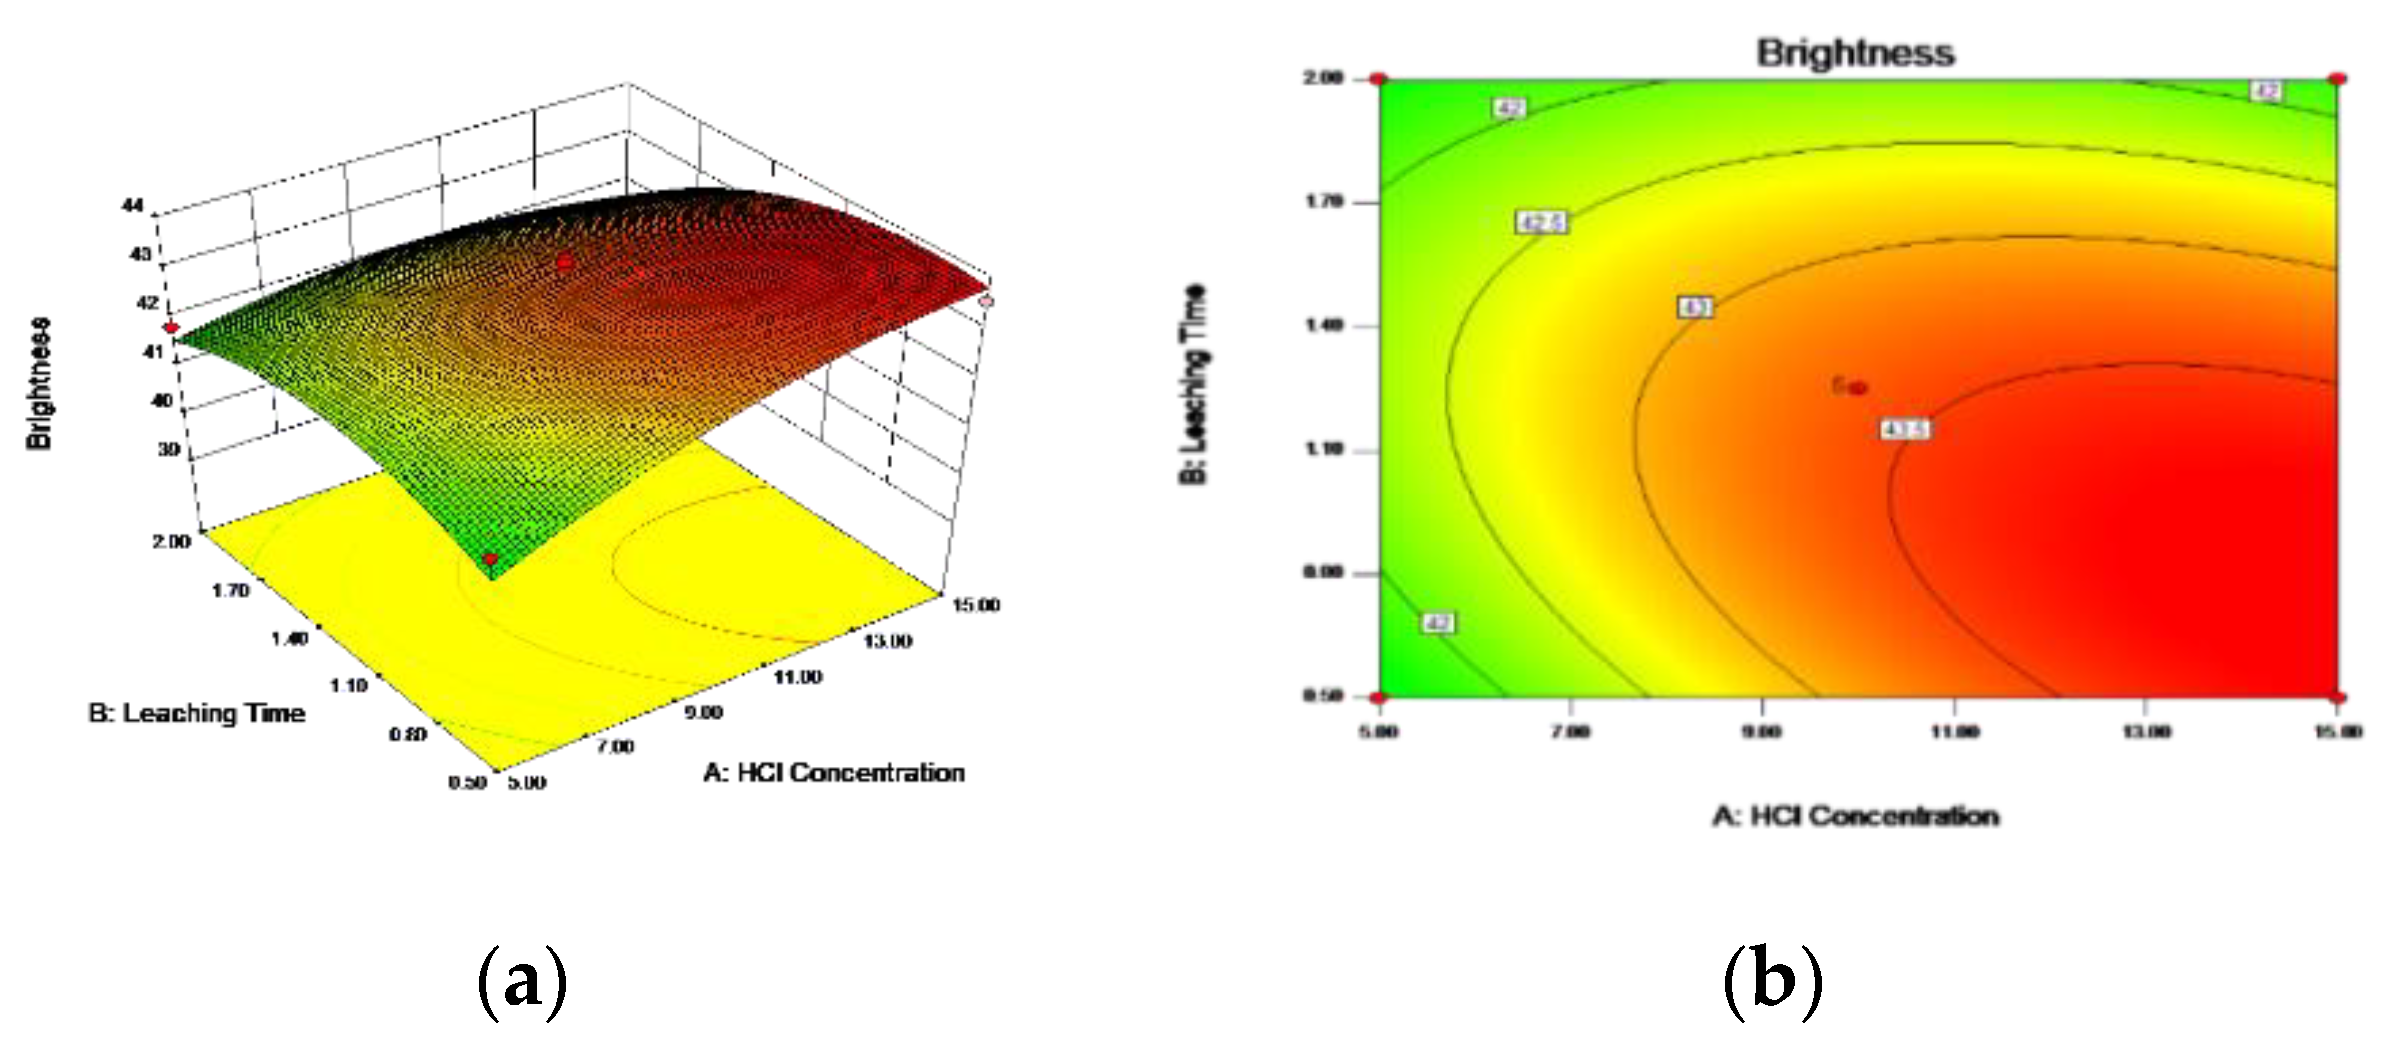
3.5.1. Box–Behnken Design and Response Surface Methodology

Design Expert 8.0.6.1 software was used to perform multiple fit regression on the test results in Table 4. The quadratic multiple regression model equation about the modified ash brightness value (y) to hydrochloric acid concentration (A), leaching time (B) and reaction temperature (C) is obtained: y = 43.37 + 0.62 × A − 0.50 × B + 0.71 × C − 0.55 × A × B + 0.090 × A × C + 0.14 × B × C − 0.47 × A2 − 0.78 × B2 − 1.93 × C2.

3.5.2. Analysis of Variance of Response Surface Regression Model

In order to test the validity of the regression equation, the variance for regression model was further analyzed. The results are shown in Table 5.
It can be seen from Table 5 that the model has f = 9.88, p = 0.0032 < 0.05, the difference is significant, p = 0.4788 of the missing term, is not significant, the coefficient of determination R2 = 0.9270, and the change of response value is 92.70% from the selected factor. That is to say, this change of response value derived from the HCl concentration, acid leaching time, and reaction temperature indicates that the model has good fitting degree, and the regression equation can well describe the relationship between each factor and the response value, which proves that the obtaining results from this test method are reliable.
The steeper the gradient of the response surface, the more sensitive the response value is to the change of the operating conditions; on the contrary, the smoother the slope of the surface, the smaller the effect of the change in operating conditions on the response value. Figure 5, Figure 6 and Figure 7 visually reflect the influence of the interaction of various factors on the response value. The interaction between the concentration of hydrochloric acid and the acid leaching time is steep, indicating that the interaction of brightness of fly ash is obvious. The effect relationship of each factor is: A (HCl concentration) > B (leaching time) > C (reaction temperature).

3.5.3. Optimal Process Conditions

The quadratic polynomial regression equation was calculated by Design-Expert 8.0.6.1 software, and the best brightening conditions of iron-containing oxides removal were as follows: the concentration of hydrochloric acid was 15%, the acid leaching time was 0.76 h, the reaction temperature was 73.65 °C, and the predicted extraction rate was 43.93% ISO. However, the limitation of the actual operation was to correct the acid leaching time to 0.75 h and the reaction temperature to 74 °C. According to this condition, three parallel verification tests were carried out under the condition that the ratio of fly ash to hydrochloric acid solution was 1:5 and the stirring speed was 300 r/min. The average brightness value of fly ash after iron-containing oxides removal was 43.92% ISO, which is close to the theoretical prediction value of 43.93% ISO. This indicates that the established mathematical model has practical value for brightening processes of fly ash by removing iron-containing oxides.

4. Conclusions

In the process of high-temperature carbon removal, when the temperature was heated to 600 °C, the brightness of the fly ash retained on the 600 mesh screen reached a maximum value, with 38.27% ISO. During this process, it mainly involved the oxidation of carbon particles and the degradation of some minerals. More importantly, this heating method can not only remove free carbon particles, but also remove those carbon particles sticking to other minerals.
Using the response surface method to optimize the process of iron-containing oxides removal, the best process conditions are: HCl concentration of 15%, acid leaching time of 0.75 h, and reaction temperature of 74 °C. At the same time, the effect of HCl concentration on acid treatment is more obvious than leaching time and reaction temperature. Eventually, the brightness value of fly ash increased to 43.92% ISO.

Author Contributions

Conceptualization, H.F. and J.-a.L.; Methodology, H.S.; Software, H.S.; Validation, H.F., H.-t.G. and J.-a.L.; Formal analysis, H.S. and H.-t.G.; Investigation, H.M. and J.-a.L.; Resources, H.F.; Data Curation, H.S.; Writing-Original Draft Preparation, H.S.; Writing-Review & Editing, H.S., H.F. and H.M.; Visualization, H.S.; Supervision, H.F. and J.-a.L.; Project Administration, H.F.; Funding Acquisition, H.F. All authors have read and agree to the published version of the manuscript.

Funding

This work was supported by Natural Science Foundation of Guangdong Province, China (No. 2019A1515012188); Science and Technology Plan Projects of Guangdong Province, China (No. 2016A020221040); and State Key Laboratory of Pulp and Paper Engineering, China (No. 2016C04).

Conflicts of Interest

The authors declare no conflict of interest.

References

  1. Wang, L.; Peng, S.; Luo, L. Optimization of carbon removal technology for fly ash flotation. Coal Sci. Technol. 2001, 8, 21–23. [Google Scholar]
  2. Golewski, G.L. Studies of natural radioactivity of concrete with siliceous fly ash addition. Cem. Wapno Beton 2015, 20, 106. [Google Scholar]
  3. Yao, Z.T.; Ji, X.S.; Sarker, P.K.; Tang, J.H.; Ge, L.Q.; Xia, M.S.; Xi, Y.Q. A comprehensive review on the applications of coal fly ash. Earth Sci. Rev. 2015, 141, 105–121. [Google Scholar] [CrossRef] [Green Version]
  4. Lanzerstorfer, C. Fly ash from coal combustion: Dependence of the concentration of various elements on the particle size. Fuel 2018, 228, 263–271. [Google Scholar] [CrossRef]
  5. Belviso, C. State-of-the-art applications of fly ash from coal and biomass: A focus on zeolite synthesis processes and issues. Prog. Energy Combust. Sci. 2018, 65, 109–135. [Google Scholar] [CrossRef]
  6. Hemalatha, T.; Ramaswamy, A. A review on fly ash characteristics–Towards promoting high volume utilization in developing sustainable concrete. J. Clean. Prod. 2017, 147, 559. [Google Scholar] [CrossRef]
  7. Bhattacharjee, U.; Kandpal, T.C. Potential of fly ash utilisation in India. Energy 2002, 27, 151–166. [Google Scholar] [CrossRef]
  8. Wang, S. Application of solid ash based catalysts in heterogeneous catalysis. Environ. Sci. Technol. 2008, 42, 7055–7063. [Google Scholar] [CrossRef]
  9. Yang, A.L.; Jiang, Y.N.; Zhao, X.M.; Rashid, K.; Zhao, X.; Huang, X.; Zhou, H.; Su, M.; Tang, H.; Li, F. The True Cost Coal: An Investigation into Coal ash in China. Available online: www.greenpeace.org.cn coal-ash2010-rpt/ (accessed on 15 September 2010).
  10. Wu, Y.; Yi, G.; Liu, Q.; Li, F.; Zhao, L.; Ma, M. Status of Comprehensive Utilization of Fly Ash. Clean Coal Technol. 2013, 19, 100–104. [Google Scholar] [CrossRef]
  11. Joshaghani, A.; Balapour, M.; Ramezanianpour, A.A. Effect of controlled environmental conditions on mechanical, microstructural and durability properties of cement mortar. Constr. Build. Mater. 2018, 164, 134–149. [Google Scholar] [CrossRef]
  12. Phoungthong, K.; Shao, L.M.; He, P.J.; Zhang, H. Phytotoxicity and groundwater impacts of leaching from thermal treatment residues in roadways. J. Environ. Sci. 2018, 63, 58–67. [Google Scholar] [CrossRef] [PubMed]
  13. He, X.; Wang, R.; Fu, T.W. Tenghuan.Experimental Study on Frost Resistance Durability of Low Volume Fly Ash Recycled Concrete. Bull. Chin. Ceram. Soc. 2018, 37, 3522–3527. [Google Scholar]
  14. Ahmed, M.J.K.; Ahmaruzzaman, M. A review on potential usage of industrial waste materials for binding heavy metal ions from aqueous solutions. J. Water Process Eng. 2016, 10, 39–47. [Google Scholar] [CrossRef]
  15. Yang, L. Treatment of calcium-containing wastewater from alumina extraction by fly ash acid method. Ind. Water Treat. 2018, 38, 45–47. [Google Scholar]
  16. Zhang, Y.N.; Yu, Y.X. Adsorptive removal of Cr3+, Cu2+, and Ni2+ ions by magnetic Fe3O4@ alkali-treated coal fly ash. Desalin. Water Treat. 2018, 123, 277–287. [Google Scholar] [CrossRef]
  17. Zhang, X.; Zhao, F. Study on Extraction and Purification Technology of Gallium in Fly Ash. Coal Technol. 2018, 37, 336–339. [Google Scholar]
  18. Dai, S.; Finkelman, R.B. Coal as a promising source of critical elements: Progress and future prospects. Int. J. Coal Geol. 2018, 186, 155–164. [Google Scholar] [CrossRef]
  19. Khatri, C.; Mishra, M.K.; Rani, A. Synthesis and characterization of fly ash supported sulfated zirconia catalyst for benzylation reactions. Fuel Process. Technol. 2010, 91, 1288–1295. [Google Scholar] [CrossRef]
  20. Saputra, E.; Muhammad, S.; Sun, H.; Ang, H.M.; Tadé, M.O.; Wang, S. Red mud and fly ash supported Co catalysts for phenol oxidation. Catal. Today 2012, 190, 68–72. [Google Scholar] [CrossRef]
  21. Sinha, A.S.K. Effects of pulverized coal fly-ash addition as a wet-end filler in papermaking. Tappi J. 2008, 7, 3–7. [Google Scholar]
  22. Fan, H.; Wang, S.; Liu, J.; Long, J. Improving fly ash whiteness and the influence of modified fly ash on the physical strength of paper. BioResources 2015, 10, 7434–7441. [Google Scholar]
  23. Metzger, M. Determination of carbon in fly ashes from incineration processes. Fresenius J. Anal. Chem. 1987, 327, 726–727. [Google Scholar] [CrossRef]
  24. He, X.; Chang, Z.; Zhang, C. Experimental Study on Charcoal Selection for Fly Ash. Fly Ash 1999, 3, 5–8. [Google Scholar]
  25. Zhang, L.; Yang, F.; Tao, Y. Removal of unburned carbon from fly ash using enhanced gravity separation and the comparison with froth flotation. Fuel 2020, 259, 116282. [Google Scholar] [CrossRef]
  26. Qian, J.; Wang, Z.; Zhang, Y. Mineral Composition of Fly Ash (Part II). Compr. Util. Fly Ash 2001, 2, 37–41. [Google Scholar]
  27. Wang, F.; Wu, Z. Fly Ash Utilization Manual; China Electric Power Press: Beijing, China, 1997. [Google Scholar]
  28. Pan, C. Determination of Carbon Content in Fly Ash. Compr. Util. Fly Ash 1998, 3, 59–60. [Google Scholar]
  29. Hower, J.C.; Groppo, J.G.; Graham, U.M.; Ward, C.R.; Kostova, I.J.; Maroto-Valer, M.M.; Dai, S. Coal-derived unburned carbons in fly ash: A review. Int. J. Coal Geol. 2017, 179, 11–27. [Google Scholar] [CrossRef]
Figure 1. Analysis of different mineral phase composition of original fly ash.
Recycling 05 00005 g001
Figure 2. Color change of fly ash heated under different temperatures.
Recycling 05 00005 g002
Figure 3. Relationship between brightness and heating temperature of fly ash.
Recycling 05 00005 g003
Figure 4. Relationship between loss of fly ash and heating temperature.
Recycling 05 00005 g004
Figure 5. (a) The response surface plot and (b) the corresponding contour plot showing the effects of HCl Concentration and leaching Time on the brightness of fly ash by removing iron-containing oxides.
Recycling 05 00005 g005
Figure 6. (a) The response surface plot and (b) the corresponding contour plot showing the effects of HCl Concentration and leaching Time on the brightness of fly ash by removing iron-containing oxides.
Recycling 05 00005 g006
Figure 7. (a) The response surface plot and (b) the corresponding contour plot showing the effects of leaching Time and Reaction Temperature on the brightness of fly ash by removing iron-containing oxides.
Recycling 05 00005 g007
Table 1. Response surface test factor level table.
FactorVariable Levels
−101
A HCl concentration/%5%10%15%
B Leaching time/h0.512
C Reaction temperature/°C507090
Table 2. Analysis of different chemical compositions of original fly ash.
SiO2Al2O3CO3CaOFe2O3TiO2K2ONa2OSO3MgOP2O5CeO2SrOZrO2ClMnOZnO
46.32%31.60%8.54%4.74%4.47%1.29%0.63%0.60%0.48%0.42%0.37%0.20%0.15%0.06%0.05%0.03%0.02%
Table 3. Screening analysis of original fly ash.
400 Mesh500 Mesh600 Mesh700 Mesh
Mass Percentage/%15%7%50%28%
Brightness/%ISO9.0213.4618.0119.61
Table 4. Response surface analysis test design and results.
RunCoded Variable LevelBrightness (%ISO)
HCl Concentration (/%)Time (/h)Temperature (/°C)PredictedExperimental
11−1043.7943.52
200043.3743.55
300043.3742.33
411041.6941.26
501141.0141.11
60−1141.7341.65
7−10140.9740.62
800043.3743.55
90−1−140.5940.50
1000043.3743.76
11−1−1041.4541.90
1210142.3942.73
1300043.3743.67
14−10−139.7339.40
1501−139.3139.40
16−11041.5541.82
1710−140.7941.15
Table 5. ANOVA for the brightness of fly ash according to the response surface quadratic model.
VariableStatistical Analysis
Sum of SquareDfMean Squaref-Valuep-Value
Model30.8693.439.880.0032a
A3.0313.038.720.0213
B1.9811.985.700.0483
C4.0014.0011.530.0115
AB1.1911.193.420.1068
AC0.03210.0320.0930.7689
BC0.07810.0780.230.6491
A20.9210.922.660.1468
B22.5512.557.350.0301
C215.66115.6645.110.0003
Cor Total33.2916
R2 = 0.9270, R2(Adj) = 0.8331; a Significant at 95% confidence degree (p < 0.05).

