1. Introduction
Municipal solid waste management has emerged as one of the greatest challenges facing many developing countries. Daily human activities lead to the generation of various classes of waste, which is seen as a major environmental threat for many cities in developing nations worldwide [
1,
2]. The factors affecting such a high rate of change in solid waste generation includes things such as population growth, changing lifestyles, income growth, increasing use of disposable materials, excessive packaging of items, and consumer habits [
3,
4]. Despite the several investment opportunities that waste management offers with a very high return on investment for public and private sectors, most developing countries, including Nigeria, have solid waste management issues which are different from those found in industrialized countries in regard to composition, density, political and economic frameworks, quantity of waste, access to waste for collection, awareness, and attitude [
4,
5,
6]. In developing countries, local authorities spend 77–95% of their revenue on collection and the balance on disposal [
7], but are only able to collect around 50–70% of municipal solid waste [
8]. In Nigeria, municipal waste densities generally range from 250–370 kg/m
3 [
7,
9]. Unfortunately, people in many developing countries (including Nigeria) have, until recently, regarded the issue of proper solid waste management as trivial, which may have diverted attention away from the most urgent and serious problem of achieving a fast rate of economic growth. This attitude stems from the belief that solid waste generation is an inevitable price of development [
10].
According to [
8], there are several factors influencing solid waste collection in Nigeria, some of which are the lack of advanced technology facilities for separation at its source, the strength of solid waste management policies and enforcement procedures, environmental education and awareness, and the economic status of individuals, among others. Mahees et al. [
11] stated that better solid waste management processes should start from the solid waste generation stage. Olukanni et al. [
12] and Ogwueleka [
7] stated that the volume of solid waste being generated increases at a faster rate than the ability of waste management agencies to improve resources required to meet financial and technical resources needed to parallel this growth. According to Bowan and Tieroba [
13], solid waste needs to be characterized by sources, generation rates, type of waste produced, and composition in order to monitor and control prevailing waste management systems while improving the existing system. A complete understanding of the composition of a waste stream as well as the activities that determine its generation is essential for effective solid waste management [
14].
However, the concept of recycling is still being explored. This is the extraction and recovery of valuable materials from scraps or other discarded materials employed to supplement the production of new materials. It is essentially adding value to waste, making it economically useful [
15,
16,
17]. Waste recycling has enormous economic opportunities, including job creation, poverty alleviation, and sustainable development [
5]. Recyclable materials in low-, middle-, and high-income countries comprise about 17%, 43%, and 62% of the total waste stream, respectively [
16]. Recyclable solid waste include textiles, construction waste, paper, plastic, ferrous and nonferrous metals, and glass. Plastic recycling industries shred plastics into pellets to manufacture other plastics and allied products. Some recycling factories process waste paper and cardboard to make tissue paper, newsprint, or bulk packaging materials. Waste glass is processed by glass or terrazzo companies, nonferrous metals are processed by aluminum smelters, and tin is recovered from aerosol cans [
18]. Agunwamba [
19] observed that a well-planned recycling program in Nigeria could result in savings of up to 78% in waste management costs and 79.5% in landfill avoidance costs. Aside from the economic gains of recycling, environmental benefits, such as the reduction of greenhouse gas emissions, air, and water pollution associated with production from virgin raw materials, are likely to accrue from waste recycling [
16].
Literature generally reports that enormous quantities of solid waste are generated daily in the major cities of Nigeria, but exact figures are difficult to determine due to the fact that proper records of collection and disposal are not kept by the authorities responsible [
20]. The project at hand used Covenant University as a case study to present an overview of the amount of municipal solid waste which is generated and studied its characterization to ascertain its economic significance. Specific areas chosen were the academic and residential areas for use by staff and students, and the two cafeterias. The aim of this study was to determine the quantity, composition, and generation rate of solid waste in the institution, with specific objectives of gathering statistical data of waste generated, presenting the current state of waste management, characterizing the solid waste generated, and quantifying waste for recycling, recovery, and reuse.
1.1. Study Area
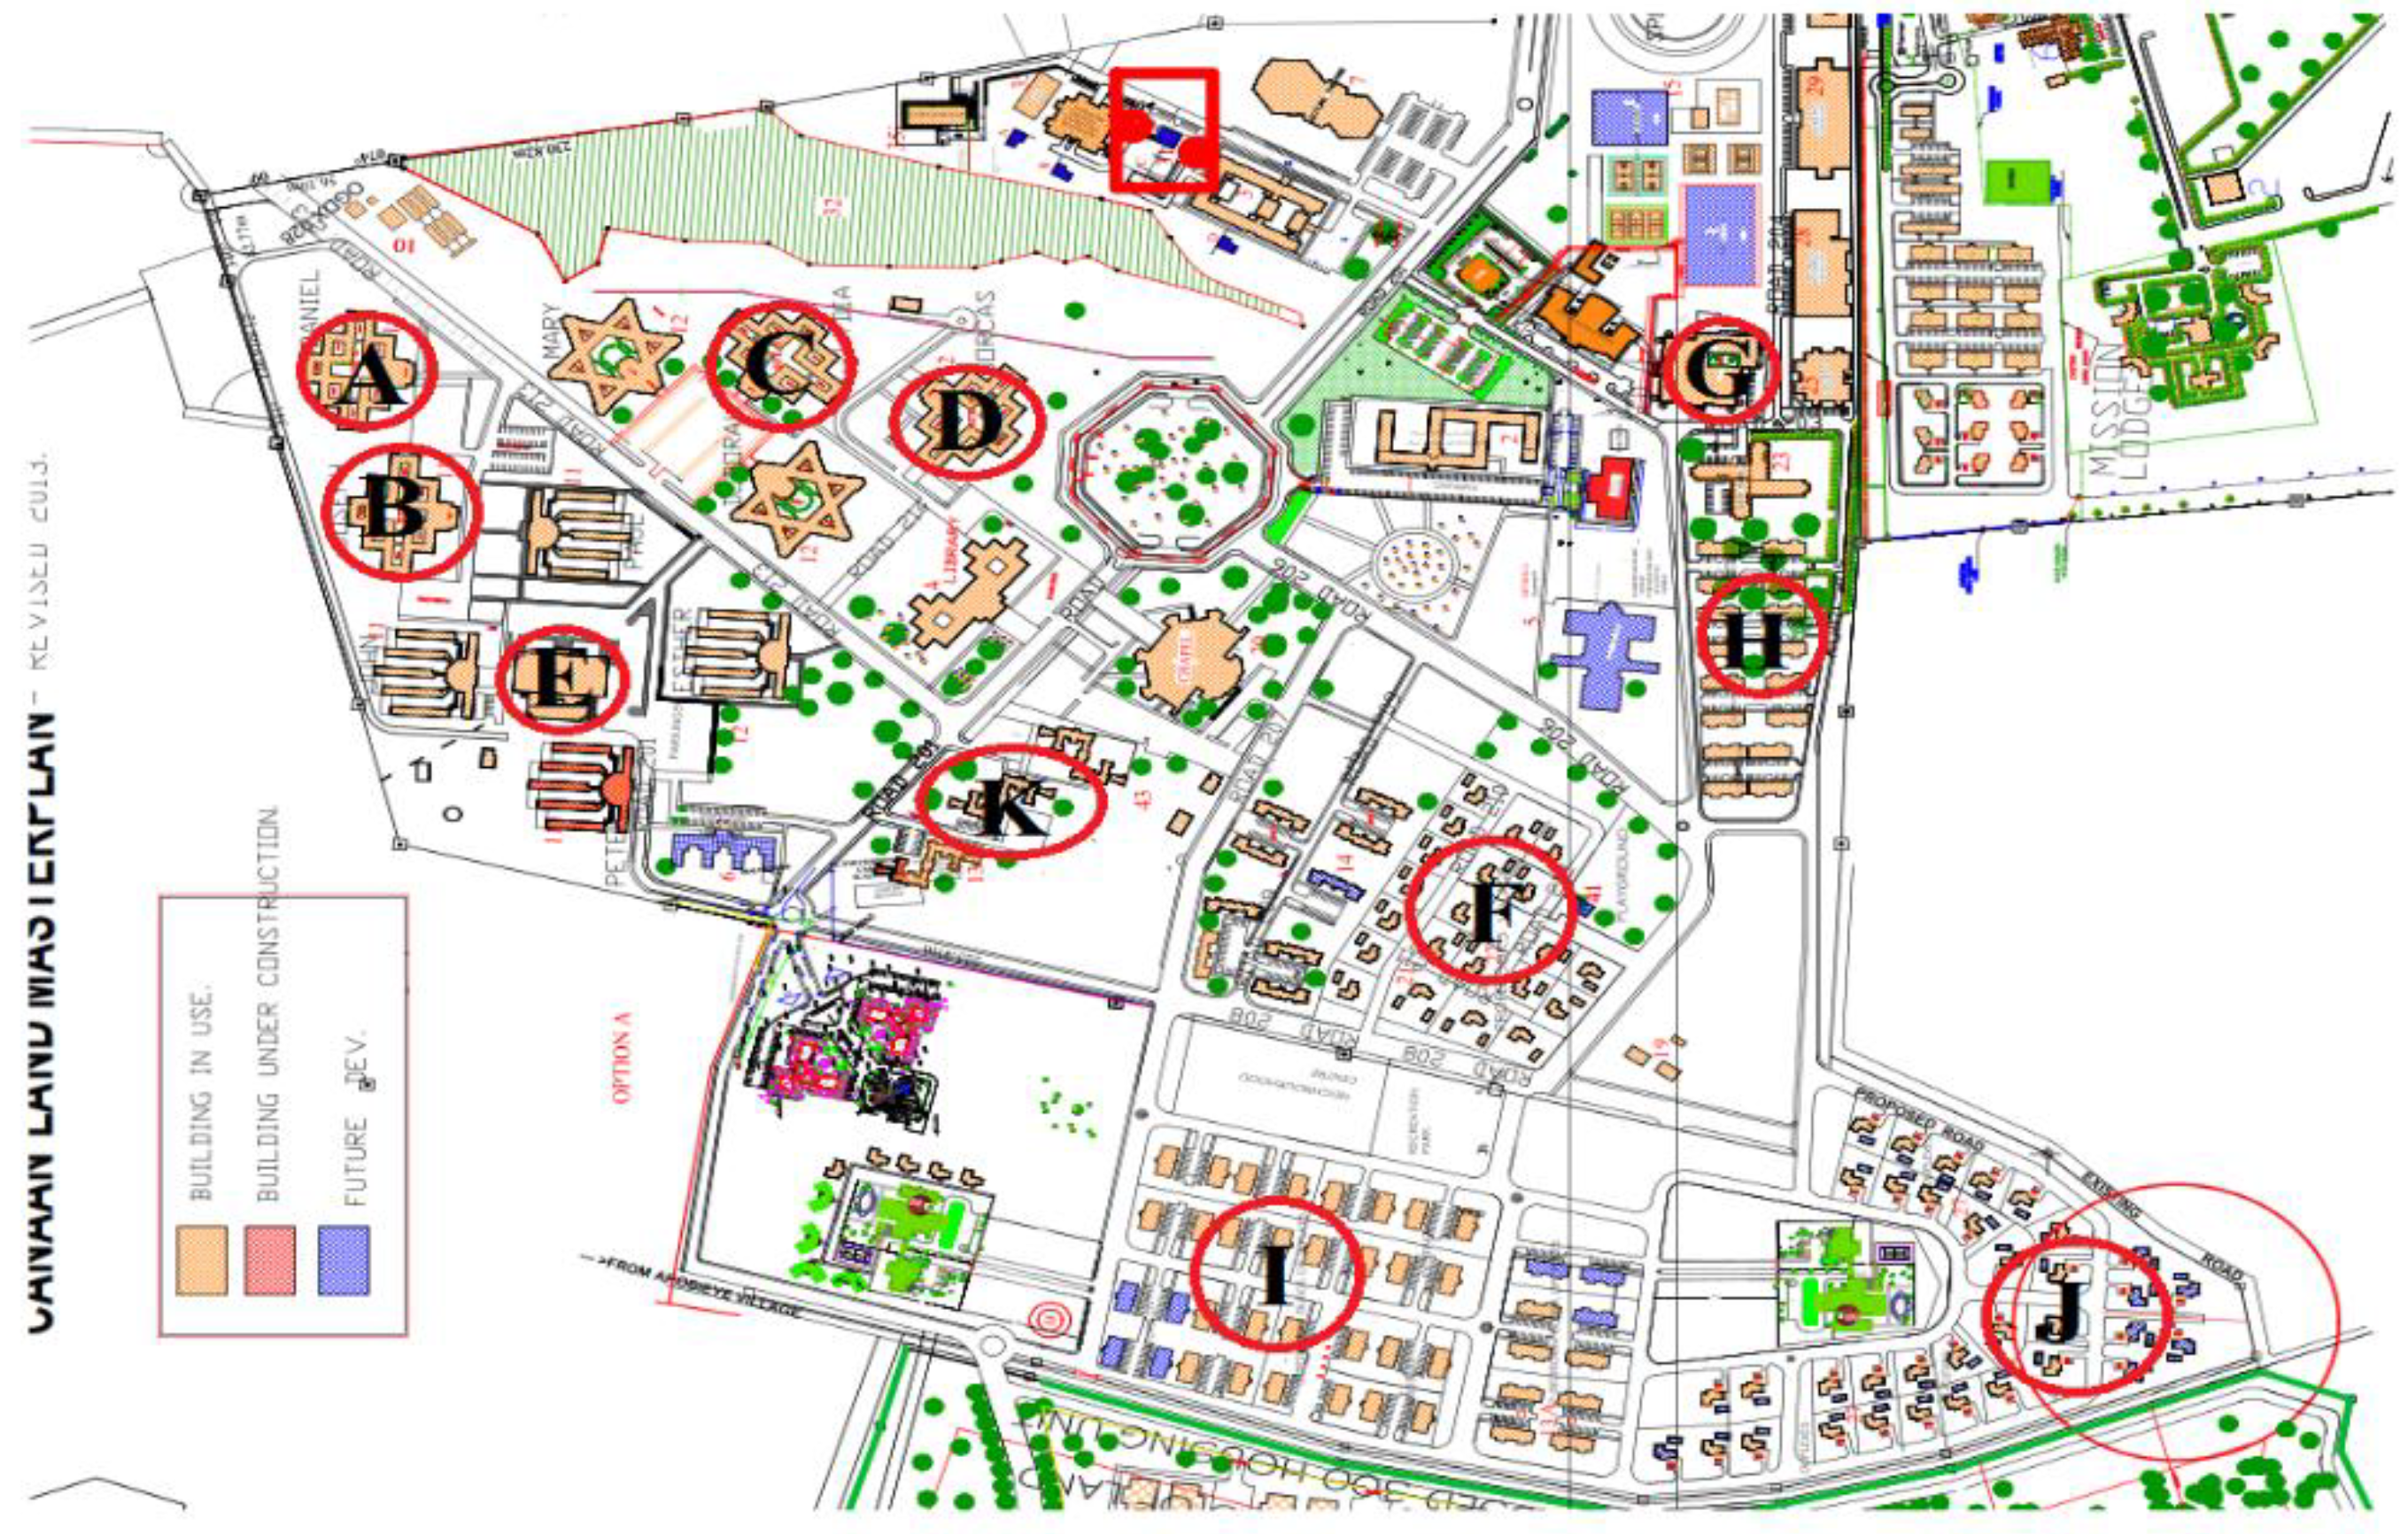
The study site represents a typical modern community of Nigeria. The Covenant University community, within Canaan Land in Ota town, is in close proximity to the city of Lagos, Nigeria. The community hosts the world’s single largest church auditorium with a capacity of 50,000, and runs five (5) worship services every Sunday. Temperatures are high throughout the year, averaging from 25 °C to 28 °C (77 °F to 82 °F). The institution has witnessed an increase in population since its inception in 2002, with a current population of above 9000 people and a daily water requirement that is estimated at 136 L/c/day. On average, one person consumes 4 bottles of water per day. Canaan Land has an expanse of 524 acres of land with an array of architectural masterpieces, which consist of the Centre for Learning Resources (university library), college buildings, a 3000-seat student chapel, 22 duplexes with 48 chalets in the Professors’ Village, 64 suites at the senior staff guest house, 64 three-bedroom flats in the senior staff quarters, 100 rooms in the university guest house, two cafeterias, 96 two-bedroom apartments, and 24 one-bedroom apartments in the postgraduate halls of residence. In addition to these, there are 10 blocks of student hostels, administrative offices, lecture halls, a gymnasium, and four new engineering workshops.
Figure 1 shows the master plan of the institution with selected points of interest presented in
Table 1 as marked on the map.
1.2. Site-Specific Study
This study involved sampling, sorting, and weighing the individual components of the waste stream. The site-specific study required a large number of samples to be taken, ensuring that the results were not skewed or misleading. The procedures involved in municipal solid waste characterization for this project using a site-specific study were as follows.
1.3. Selection of a Representative Sample
It was very important that the samples collected were representative of the waste generation units being studied, and involved things like specifying the target population. The staff population as at 2018 was about 500 persons for academic staff and 600 persons for non-academic staff.
Table 2 and
Table 3 show the staff and students residence populations, respectively.
1.4. Sample Size
The sample size depended on the number of solid waste generation units in the sampling area. In the senior staff quarters which consisted of 72 flats (i.e., 9 blocks of 8 flats), 14 flats were sampled. In the professor’s village which consisted of 22 duplexes and 48 chalets, 14 units were sampled. In the post-graduate quarters, consisting of 120 flats (i.e., 6 blocks of 20 flats, 96 two-bedroom flats and 24 one-bedroom flats), 24 flats were sampled. In the halls of residence, consisting of 10 blocks (with each block consisting of at least 8 wings), 2 blocks with 2 wings each were sampled. 13 units were sampled among the 64 suites. In the new estate, which consisted of 32 duplexes, 129 three-bedroom flats and 80 two-bedroom flats, 48 units were sampled (i.e., 6 duplexes, 26 three-bedroom flats and 16 two-bedroom flats). Both cafeterias 1 and 2 were sampled.
1.5. Sample Collection
In Covenant University, solid waste collection is carried out by the use of trucks. The trucks are usually parkers, tippers, and trucks that carry hydraulic rams to compact the waste to reduce its volume and thus be able to carry larger quantities, and this method is also known as the stationary haul collection system. The weight of the total sample was obtained before sorting, and the number of sampling units (households) included in the survey were recorded so that the average weight of waste per household per week could be determined. The solid waste in the institution was also sorted in terms of organic and inorganic materials—“organic” referring to food waste, and “inorganic” referring to PET bottles, tin cans, metal scraps, and the like. The first phase of this project dealt with the collection of waste in different bins—green bins for food waste, red for paper and disposable waste, and blue for PET bottles.
1.6. Sample Analysis
The samples were sorted into types and classes of solid waste, and the weight of each type and class was recorded. For this survey, the waste was categorized into the following classes—paper, PET bottles, nylons, tetra packs, plastic food packs, tin cans, food waste, and others. Waste was classified because we needed to get an idea of the amount of recyclable waste from the Covenant University waste stream.
3. Results
Table 4 shows the material percentage comparisons in the students’ hall of residence, where waste generated from the male and female halls of residence are compared. It can be seen that the female halls of residence have a higher solid waste generation rate per day than that of the male halls of residence.
Total waste generated in the female halls of residence is 423.63 kg/day, while that of the male halls of residence is 417.5 kg/day.
Table 5 and
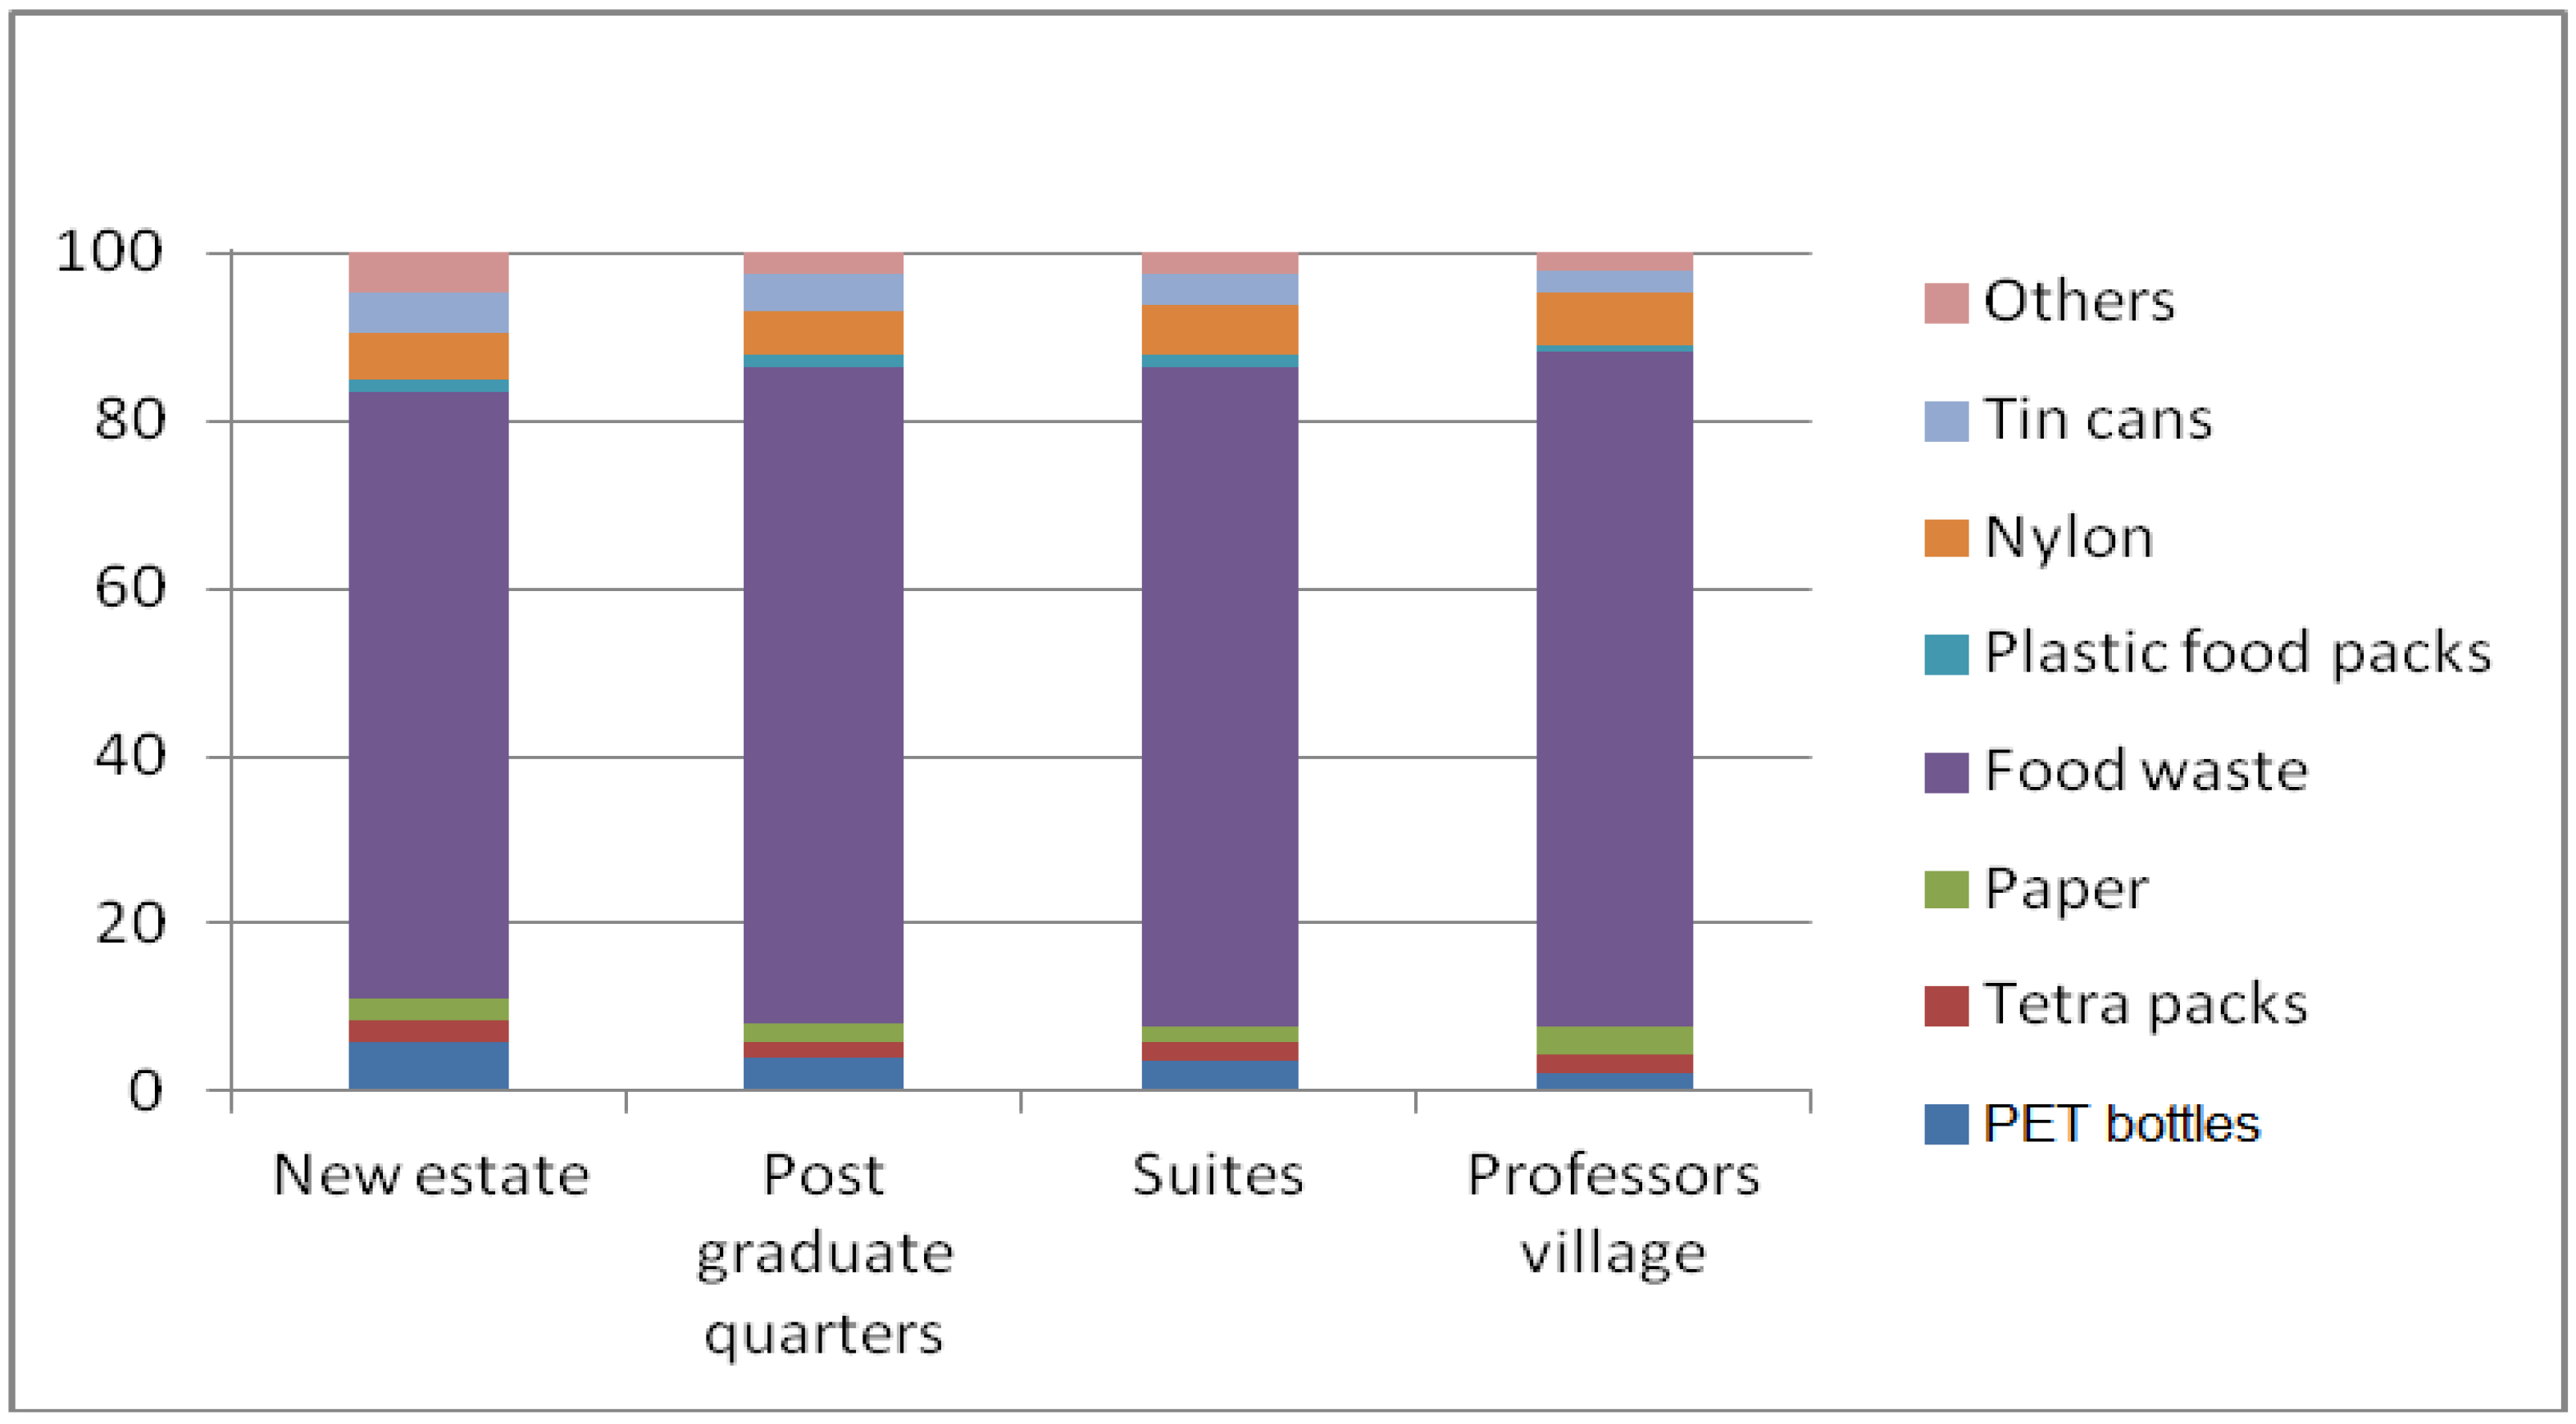
Table 6 show a comparison between the wastes generated in the staff’s residential areas of the University, while
Figure 2 shows a comparison of the percentage of waste generated from the staff’s residential areas.
Comparing the weight of waste generated in the various areas, it can be observed that the staff’s residential areas have a larger composition of food waste. This can be attributed to the fact that staff members cook their food, unlike students who buy food which come in plastic food packs. Students’ residential areas have a higher composition of plastic food packs, PET bottles, and nylons due to the frequent buying of food and drinks. It can be said that the number of housing units (i.e., the population) is a major factor affecting the rate of waste generation in the various staff residential areas. The new estate, which has the highest waste generation rate, also has the largest population. Taking an average of four (4) people per household, various estimates for each residential area can be expressed as follows:
The new estate, with 141 housing units and an average population of 964 people, generates 696.71 kg/day of solid waste.
The post-graduate quarters, with 120 housing units and an average population of 480 people, generates 391 kg/day of solid waste.
The suites, with 64 housing units and an average population of 256 people, generates 212.64 kg/day of solid waste.
The professor’s village, with 70 housing units and an average population of 280 people, generates 236.99 kg/day of solid waste.
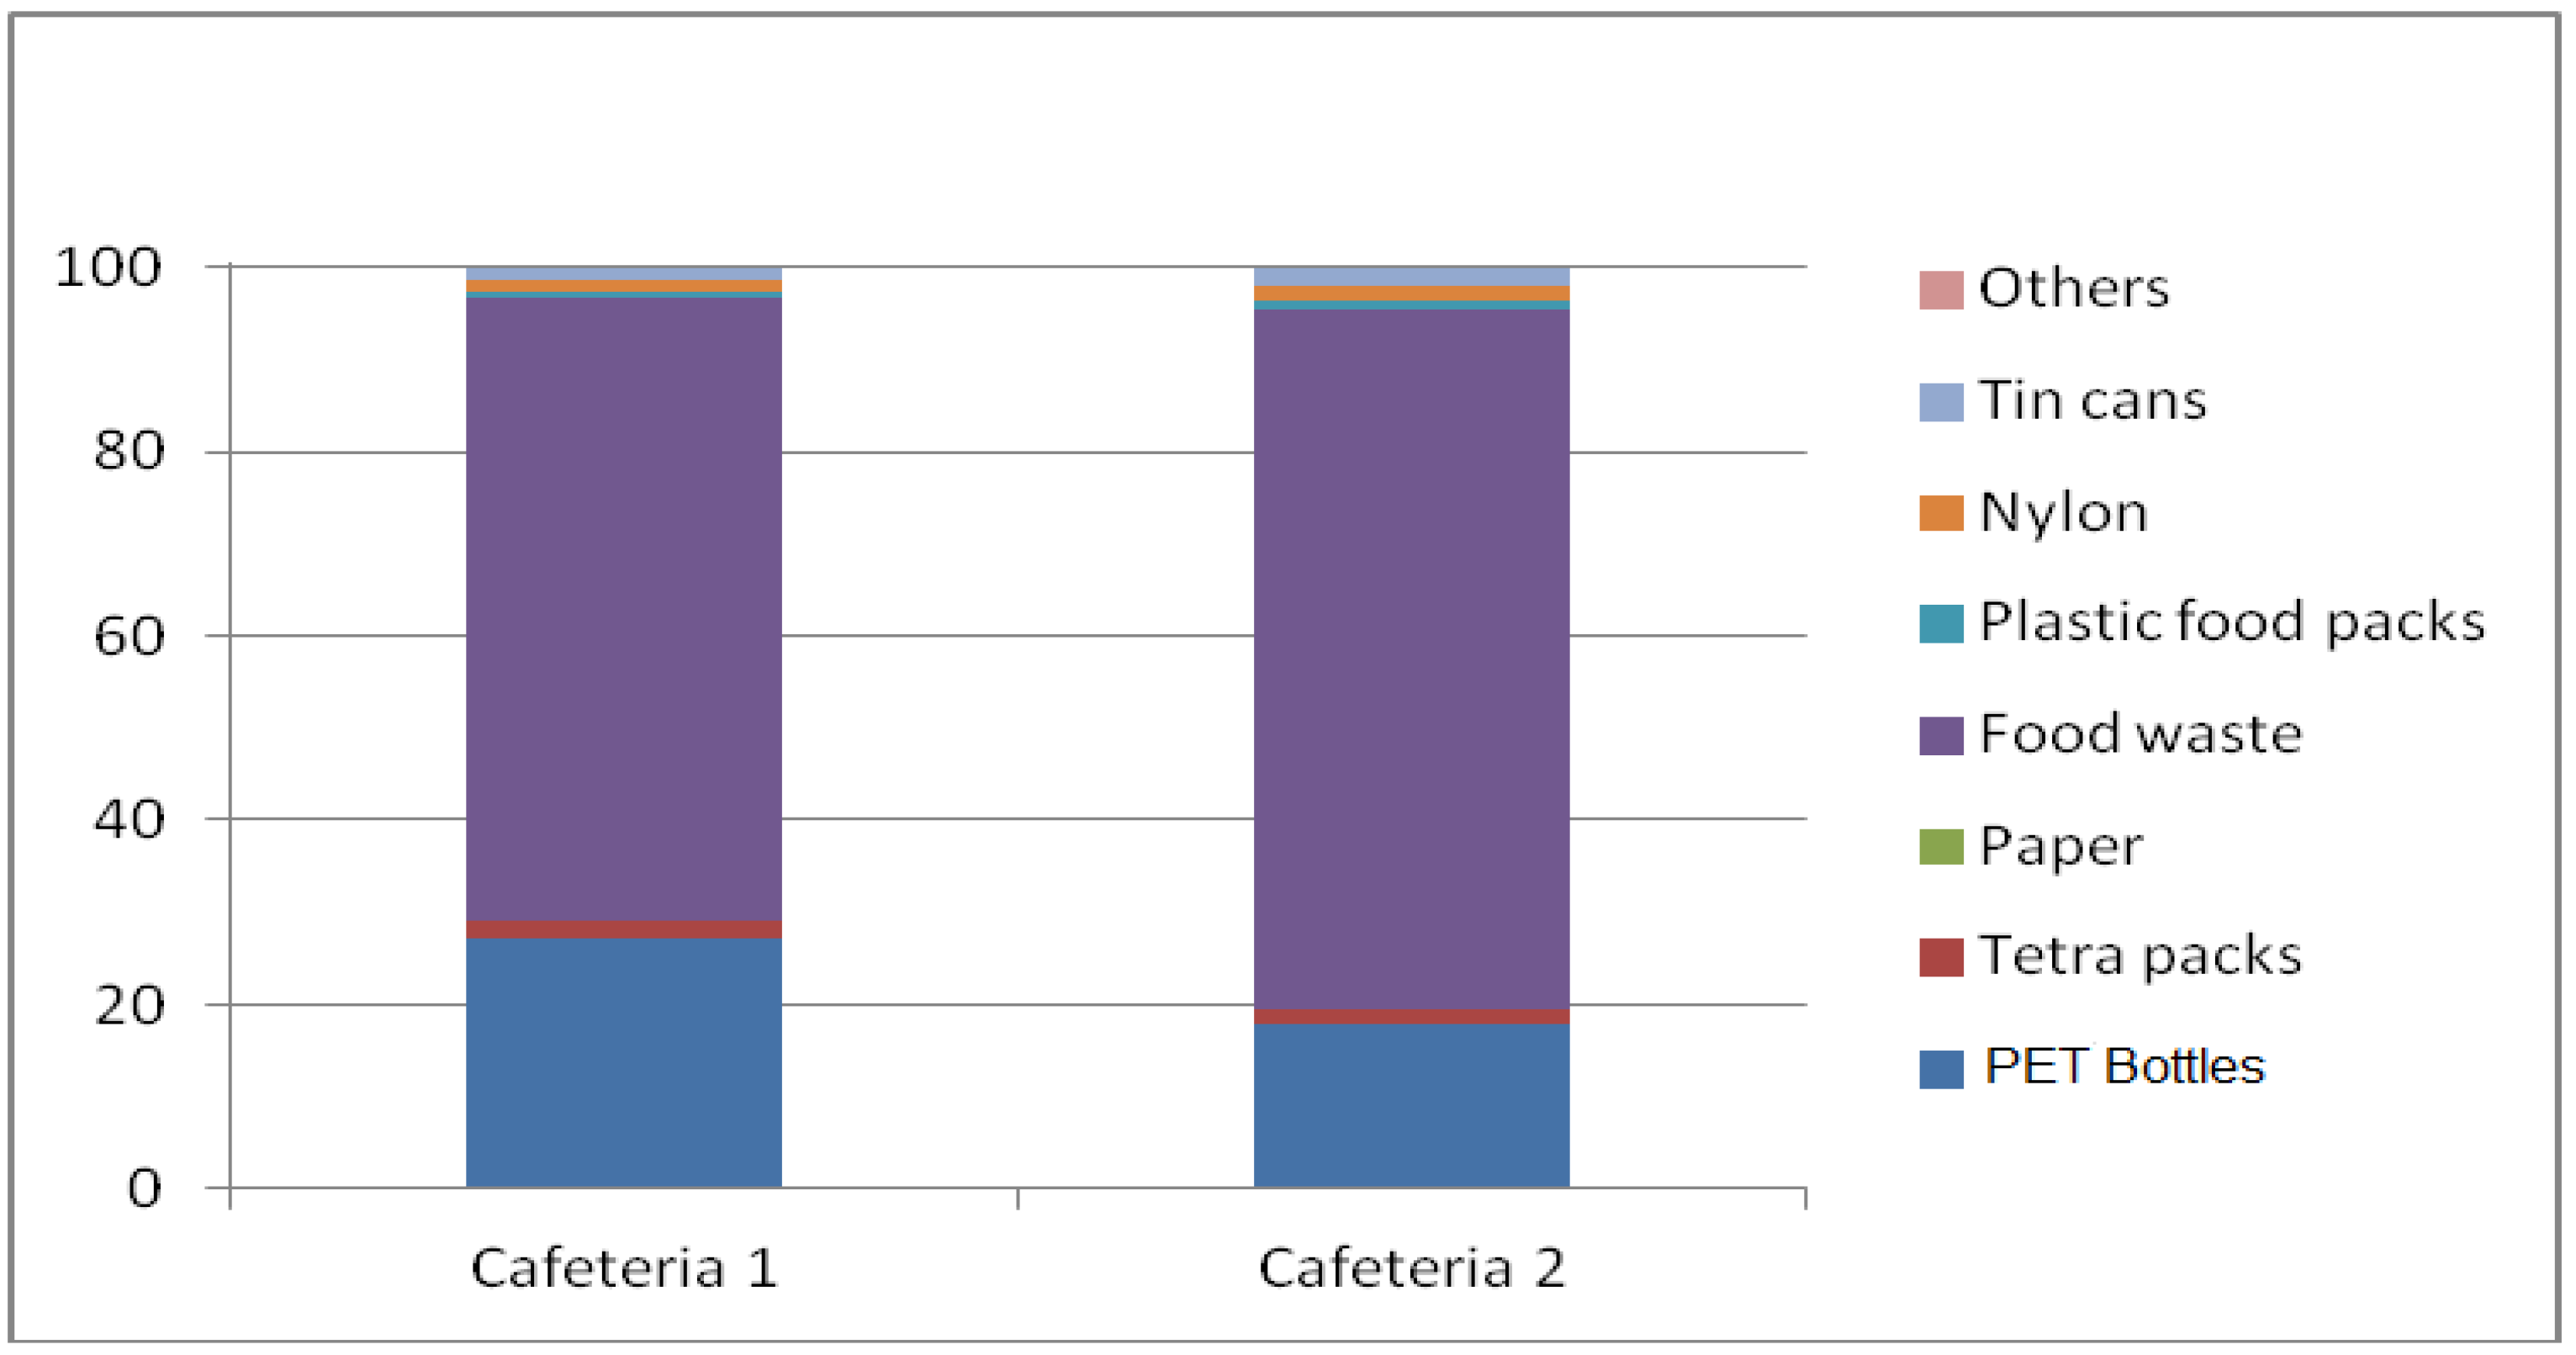
Table 7 and
Figure 3 compare the percentage of waste generated in the two cafeterias. It can be observed that Cafeteria 1 generated a larger amount of solid waste.
The disparity in results can be attributed to the difference in the number of students that visit both cafeterias—Cafeteria 1 generally has more customers, due to factors such as its proximity to the halls of residence. From
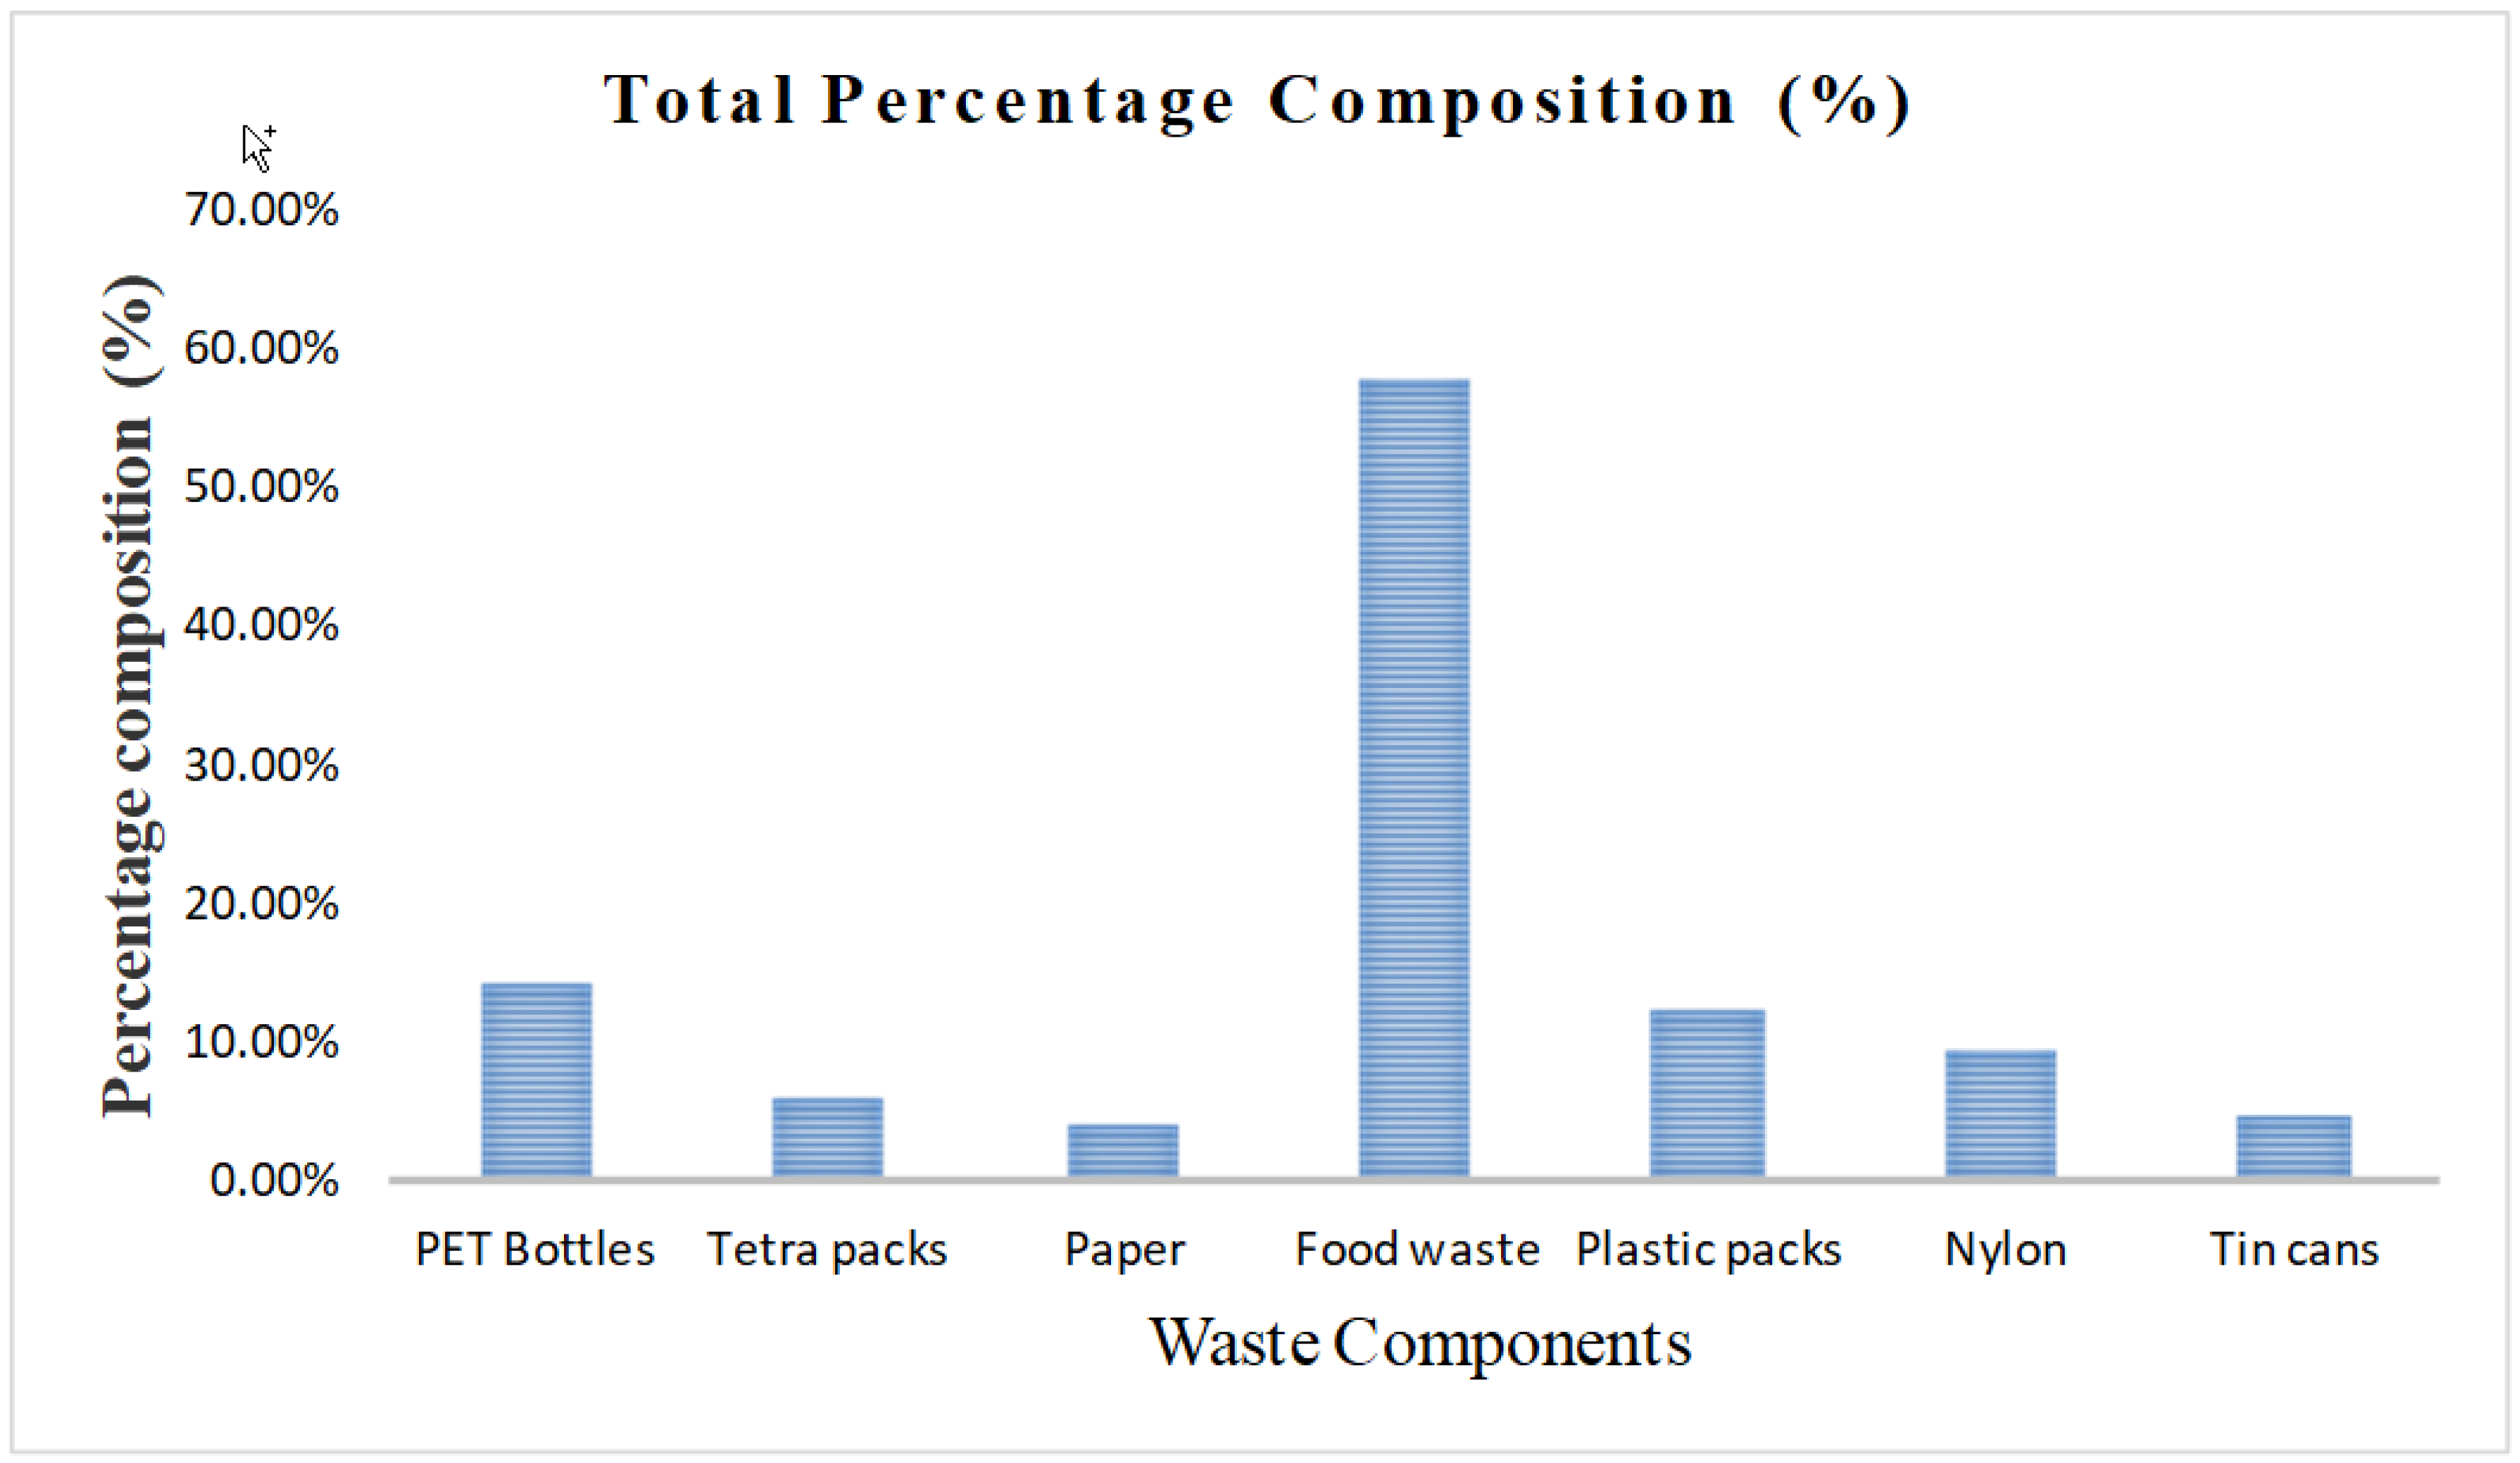
Table 7 and
Figure 3, it can be seen that the composition with the highest percentage in the total waste stream from the selected sites is food waste, followed by PET bottles and plastic food packs, respectively. The high composition of food waste mostly came from the staff’s residential areas as they prepared their own food, thus increasing the amount of food waste generated. This corroborates with the assertions of Sridhar [
21] and Ogwueleka [
7], where they expressed that in Nigeria, 60 to 80 percent of waste is organic in nature. The high percentage of PET bottles and food packs is from the student residential areas, as they purchase food which comes in plastic food packs and drinks in PET bottles. Tin cans and paper were in the lowest percentile in the waste stream, and this may be attributed to the fact that people at the University rarely bought products in tin cans, and paper is also rarely used in the residential areas and cafeterias.
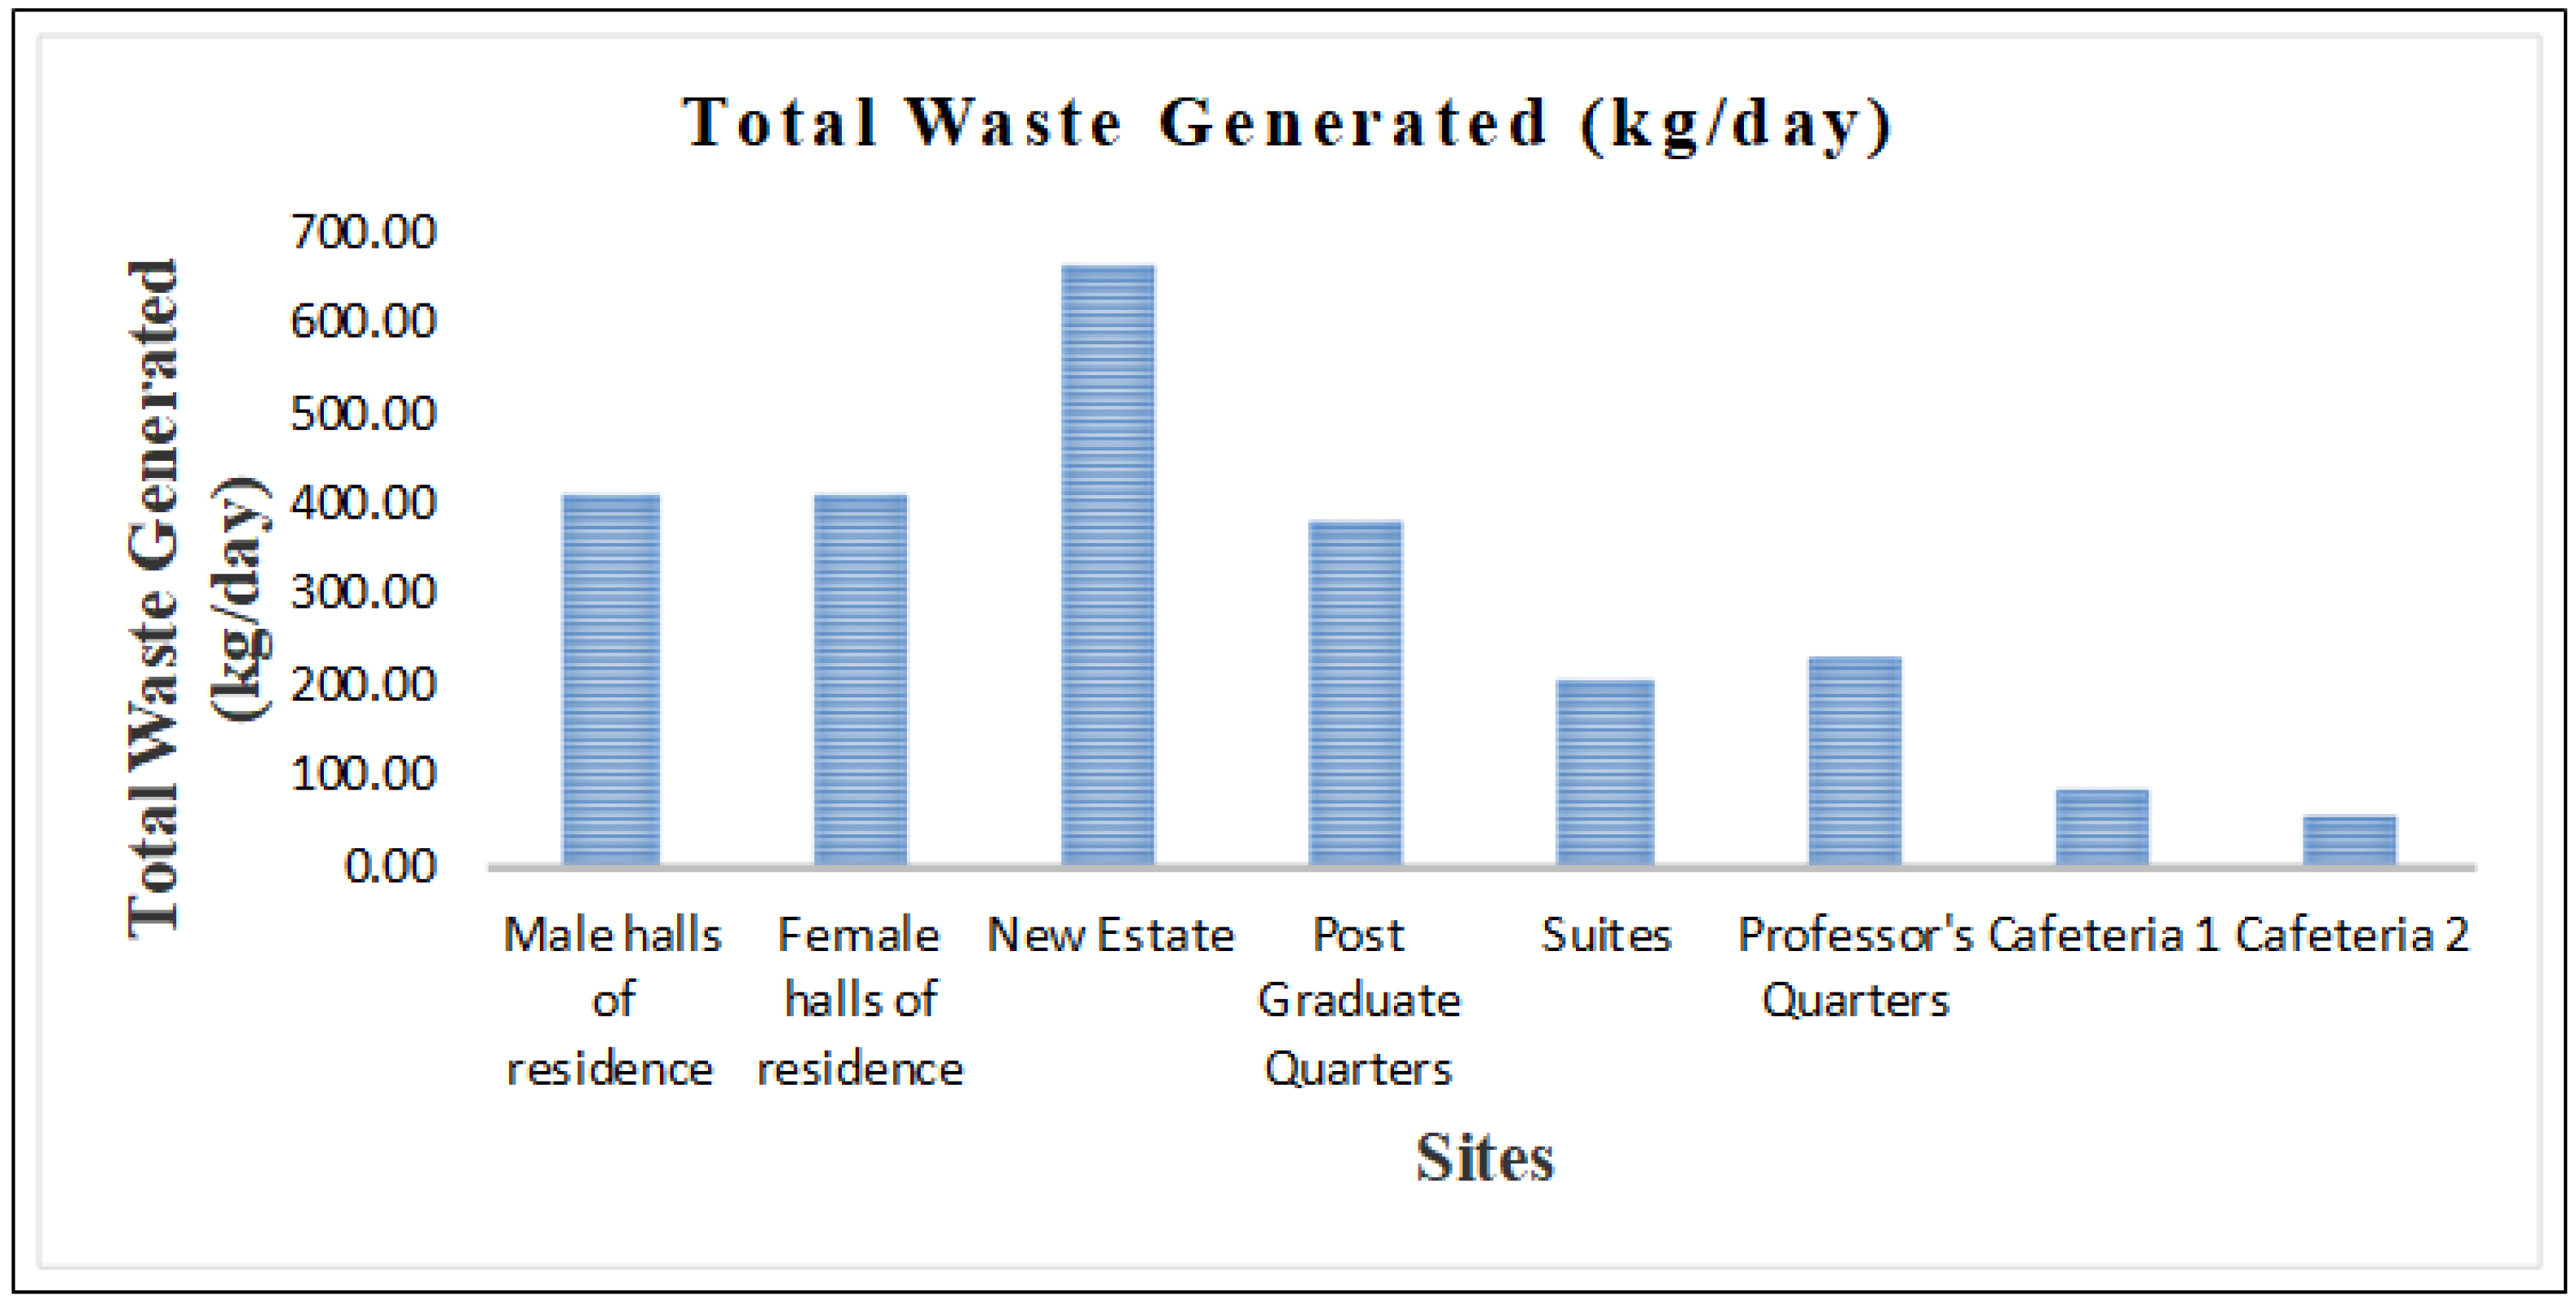
Table 8 and
Figure 4 show that the new estate generated the largest weight of 664.68 kg/day, followed by the female halls of residence with 423.63 kg, and male halls of residence with 417.50 kg. This could be due to factors such as consumer habits, population, and others. Although the student residential areas have a higher population than that of the new estate, the heavier weight of waste in the new estate compared to that of the female and male halls of residence could be attributed to the variety of waste generated from the new estate, compared to that of the student residential areas. Because items purchased by students are limited, it reduces the weight of waste generated. Waste which comes from food preparation in the staff’s residential areas weighs more than the other components in the waste stream.
Table 9 shows that a significant amount of revenue could be generated from recyclable materials, and also presents the real economic values of the recyclable materials, exclusive of any processing. This is based on the sale of any of the materials in the waste stream (market price). The cost value is calculated per day, of which extrapolating to a year can be easily done. However, during the holidays, these values drop since the institution is basically residential as all students would have vacated the campus.
I. Food Waste: Compost/organic fertilizers can be obtained from food waste by composting, which is an aerobic process where micro-organisms decompose biodegradable waste to produce organic fertilizers in the presence of oxygen. In Covenant University, the main sources of food waste that can be used for composting come from the cafeterias and staff residential areas.
II. Plastic: This includes PET bottles and plastic food packs. Plastic can be recycled or reused, depending on its quality. The recycling process of plastic involves sorting, washing, drying, wet grinding, as well as extrusion, and palletizing. The final product is then packaged and sold to consumers [
3]. Some of the products created from recycled plastic include office accessories, fiber for sleeping bags and duvets, polyethylene bin liners and carrier bags, and many others. The major types of recyclable plastics are polyethylene terephthalate (PET), high-density polyethylene (HDPE), low-density polyethylene (LDPE), polypropylene (PP), and so on. In Covenant University, the main sources of plastic which include PET bottles and plastic food packs are the student halls of residence and the cafeterias.
III. Nylons: Nylons can be reused and also recycled into other forms of nylon, like sachets for water and black bags used for waste disposal.
IV. Tetra Packs: Tetra Pack cartons are primarily made from paper. 75% of the Tetra Pack carton is made from paperboard, 20% from polyethylene, and 5% from aluminum. These three materials are layered together using heat and pressure to form a six-layered armor which protects the contents from light, oxygen, air, dirt, and moisture. Furthermore, Tetra Pack cartons are lightweight, easy to transport, and fully recyclable. The aseptic technology allows the product inside to stay fresh, without the need of any preservatives.
V. Tin Cans: These include drink cans, food cans, and beverage tins. They are smelted in high-temperature furnaces, and the resulting molten metal can be used to manufacture foil that is reintegrated into the manufacturing process, hence saving natural resources, energy, time, and money.
Figure 5 shows the comparison of the total weight generated in the selected areas.
Covenant University currently has some forms of recycling activities, like selling PET bottles which have been turned into pellets, and waste paper being traded in exchange for tissue use. Target marketers are companies in the states of Lagos and Ogun dealing with PET-bottle recycled products, and Chinese companies that use the materials to produce fabrics. This initiative generates income from the project for the university, and the resulting environmental sanitation and sustainability will be at its peak.
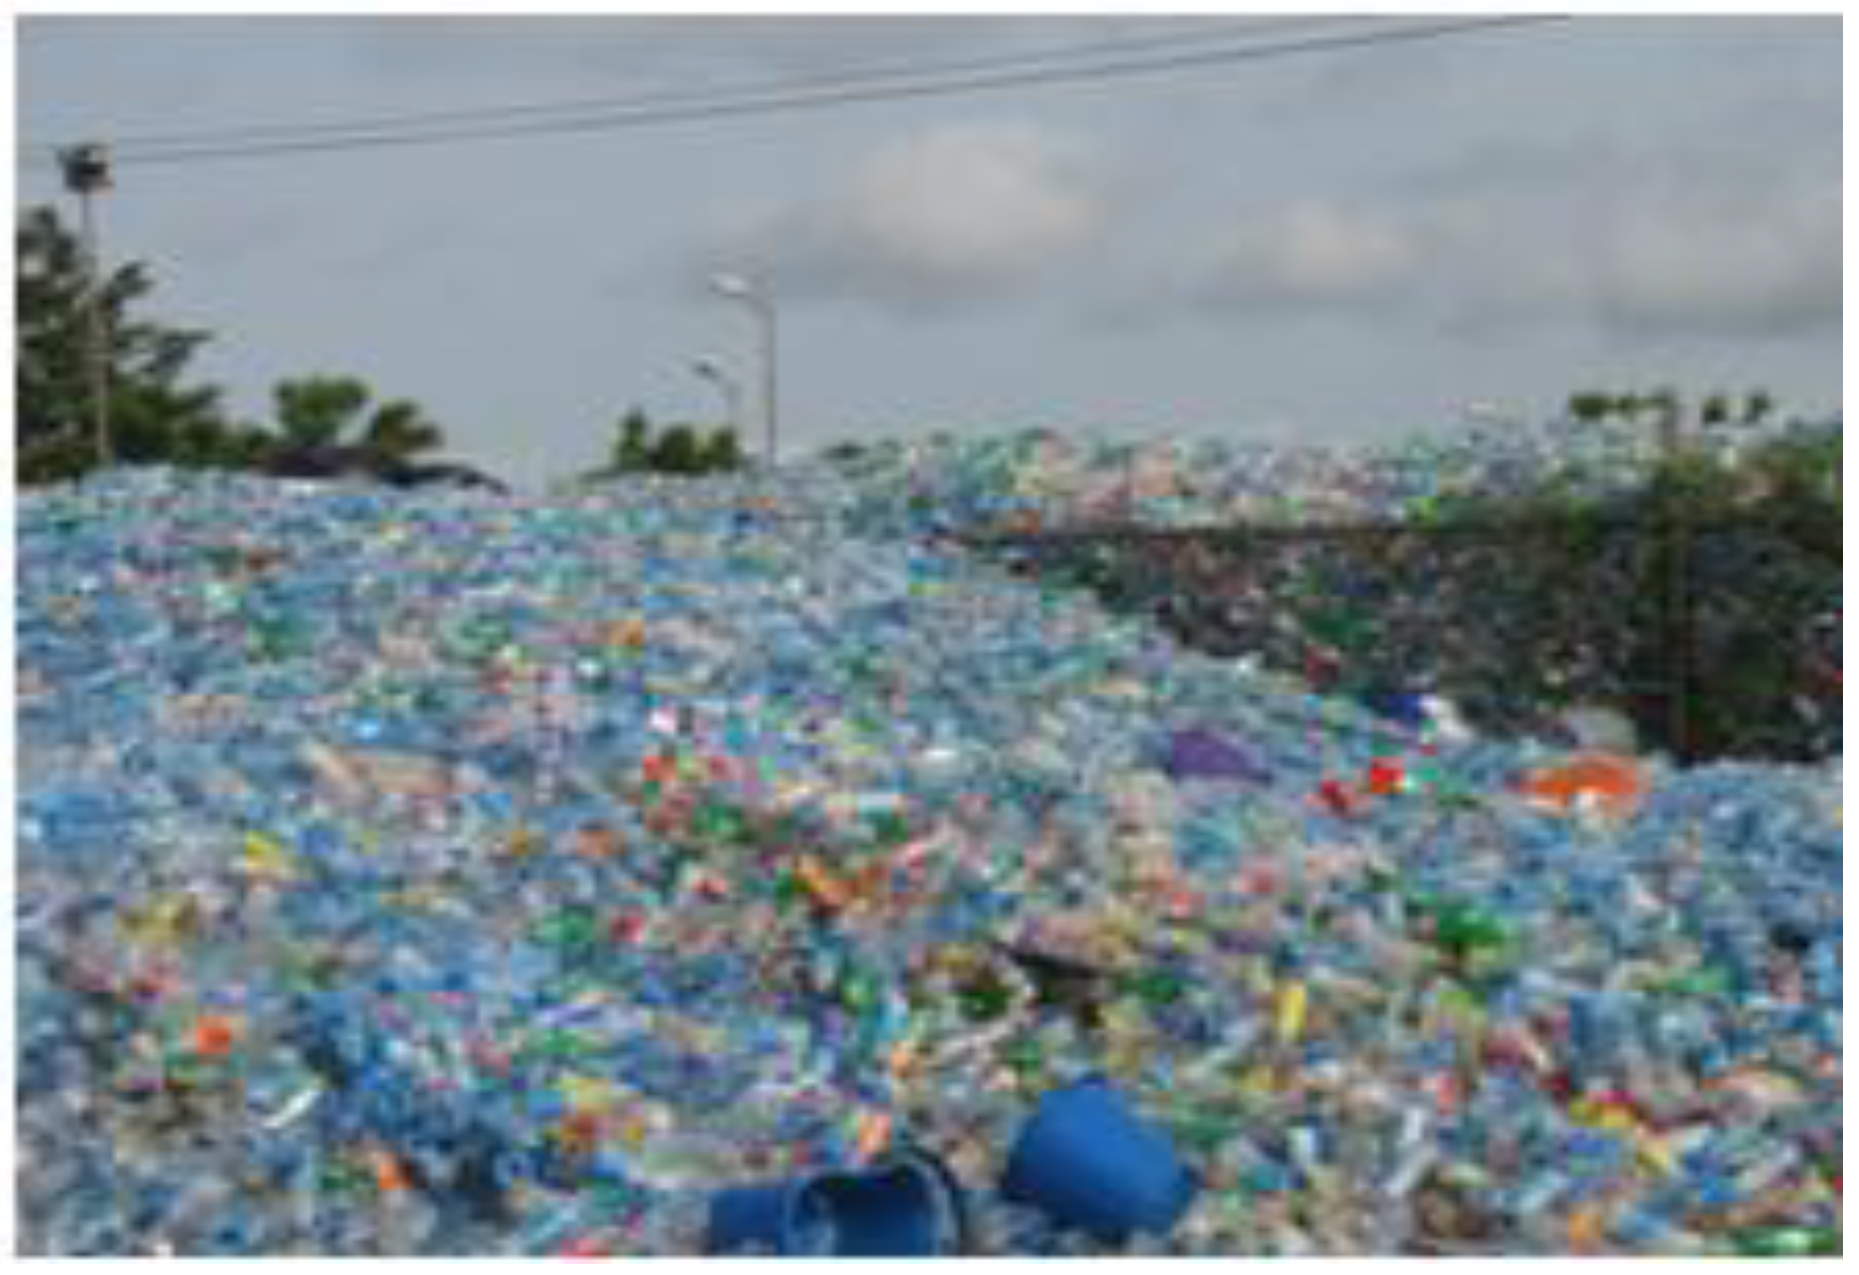
Figure 6 below shows the storage site of the collected PET bottles.
4. Conclusions
Although the waste collection system at Covenant University is very efficient and is evidenced by the clean environment, however, improvements are needed in terms of its waste collection times, component separation at points of collection, and final disposal systems. Waste generated by the university are representative of municipal wastes, and the proposed methodology from this study may apply at the local, state, and federal levels in an attempt to implement and drive government policy on sustainable waste management.
Information on the characteristics of solid waste is important in evaluating systems, management programs, and plans for reuse, reduction, recycling, and final disposal activities for solid waste management. From the survey carried out in this project, a total amount of N39, 834 ($120 USD) per day can be obtained from the proper recycling of waste generated in residential areas. The highest amount can be obtained by plastic food packs with N16, 696.30 ($50 USD), and the lowest by paper is N437.50 ($1.5 USD).
From the survey carried out, it was observed that waste generation and characterization are dependent mostly on the products being supplied and sold in various areas of the University, such as the shopping mall, cafeteria, and others. In the students’ halls of residence, it was observed that a sufficient amount of recyclable plastic packs and PET bottles were generated. Plastic packs from the halls of residence account for about 91.46% of the total PET bottles generated in the residential area, which is approximately 12.6% of the total waste generated in the residential areas. Food waste is the largest composition of the waste generated in the residential areas, accounting for about 52.40% of the total waste stream, with the staff residential areas contributing hugely to this at 96.48%.
The overall goal of solid waste management is to collect, treat, and dispose waste. Conclusively, it can be said that more can be done to improve solid waste management in Covenant University. Considering the amount of revenue that could be made from proper recycling, the University should make more investments in the purchase of recycling equipment for nylons, plastics, paper, and metals. The University can also partner with government agencies and private organizations and take this functional system to the wider society, starting from the immediate local government down to the state level.


