
Article

Implementing the LCCE5.0 Framework (Lean Construction, Circular Economy, and Construction 5.0) in the Moroccan Construction Sector


by
Abderrazzak El Hafiane
*,
Abdelali En-nadi
and
Mohamed Ramadany
Laboratory of Industrial Techniques, Faculty of Sciences and Techniques, Sidi Mohamed Ben Abdellah University, Fez 30050, Morocco
*
Author to whom correspondence should be addressed.
Recycling 2026, 11(3), 63; https://doi.org/10.3390/recycling11030063
Submission received: 7 February 2026 / Revised: 27 February 2026 / Accepted: 9 March 2026 / Published: 19 March 2026

Abstract

Integrating Lean Construction (LC), the Circular Economy (CE), and Construction 5.0 (C5.0) remains challenging in emerging delivery contexts. This difficulty increases when procurement routines determine which practices become enforceable across tendering, contracting, and site execution. This study prioritized barriers to LCCE5.0 implementation in Morocco and translated expert judgments into actionable recommendations. A structured literature review informed the barrier inventory and conceptual framing. The study proposed a three-layer, life-cycle LCCE5.0 framework that links governance, operational routines, and digital enablers. It operationalized 40 critical barrier factors across six dimensions and five life-cycle macro-phases. A two-round Delphi study was conducted with 22 Moroccan experts using a 7-point Likert scale. Barriers were ranked using Round 2 (T2) medians with ties resolved using the interquartile range. Top-box agreement (ratings of 6–7) and consensus tiers were reported. The ranking showed strong stability across rounds, with 92.5% of barrier factors remaining stable. Kendall’s W at T2 equaled 0.817 (p < 0.001), indicating high panel consensus. Results indicated that constraints clustered in upstream governance. Three procurement-centered regulatory and contractual barriers topped the ranking (Mdn_T2 = 7). These barriers reflected missing CE procurement guidelines, limited weighting of environmental criteria, and the absence of circularity and digital requirements in tenders. Six additional barriers reinforced this procurement bottleneck. They included limited owner commitment, weak enforcement authority, limited top-management commitment, and regulatory instability. They also included low interorganizational trust, limited risk-sharing contracts, and tool-centered deployment of LCCE5.0 practices. These findings support procurement-focused recommendations to institutionalize auditable circular requirements and data-enabled verification in tendering and contracting routines. The proposed LCCE5.0 mechanism and the resulting recommendations require empirical validation beyond this Delphi-based prioritization.

1. Introduction

The building and construction sector supports economic growth but maintains a structurally high environmental footprint. In 2023, buildings accounted for an estimated 32% of global final energy demand and 34% of energy-related CO2 emissions [1,2]. These estimates vary with life-cycle assessment boundaries and the inclusion of upstream, material-related emissions. At the global scale, the sector consumes roughly 40–50% of extracted raw materials and generates about 25–35% of total solid waste [3,4,5,6]. However, reuse and recycling rates remain low in many contexts, suggesting that substantial recovery potential remains untapped [3,4,5,6].
In Morocco, the construction sector contributes about 6% of national GDP and 11–12% of total employment, indicating a major economic and social role [7]. National assessments estimated total waste generation at approximately 26.8 Mt·year−1, with about 14 Mt attributed to construction and demolition waste (CDW). Less than 5% of CDW is sorted on site. In contrast, approximately 95% is managed through informal and weakly controlled practices. These practices include unregulated dumping and quarry backfilling. This pattern constrains high-value recovery and limits the feasibility of closed material loops [8,9].
Lean Construction (LC) is a value- and flow-centered paradigm that stabilizes production systems and reduces process waste [10,11]. However, environmental gains depend on delivery systems, contracting routines, organizational maturity, and work standardization. LC provides production discipline that can support circular objectives when projects institutionalize standard work across actors [12].
Within the built environment, the Circular Economy (CE) prioritizes upstream design choices and closed-loop strategies that preserve material and energy value over time [13,14,15]. Ex ante criteria and operational indicators enable empirical validation at the project level. Sector roadmaps increasingly call for monitoring embodied emissions alongside in-use performance indicators, requiring project-level reporting that is auditable, traceable, and comparable [1,12,13,16]. Therefore, integration requires orchestration capability. This capability converts criteria into coordinated decisions, shared data, and verifiable routines across actors and phases.
Construction 5.0 (C5.0) links digital interoperability with a human-centered purpose through enabling technologies, including Building Information Modeling (BIM), digital twins, IoT, blockchain, and additive manufacturing [12,17,18,19,20,21]. In this study, C5.0 is defined as an orchestration layer that coordinates data, decisions, and actors to integrate LC and CE across the project life cycle [12,17,18,19,20,21]. This definition distinguishes orchestration from standalone Construction 4.0 digitalization focused on technology deployment. Conceptually, this study positions C5.0 at the intersection of Lean Construction 4.0 and Society 5.0, which makes human-centered governance an antecedent condition for sustained performance gains [22,23]. In procurement-based delivery settings, orchestration matters only when tenders and contracts specify auditable requirements.
In practice, procurement is the upstream lock-in point where information governance, measurement rules, and verification responsibilities are formalized. As a result, procurement conditions downstream executability across design, construction, operation, and end-of-life [24,25].
An emerging body of literature has reported synergies between LC and CE. Some studies also mobilized digital technologies and extended analysis to stages such as deconstruction [26,27,28,29]. However, the structured review identified only one study that jointly addressed LC, CE, and C5.0-related digital topics. Moreover, the literature did not provide a consolidated barrier taxonomy spanning the full project life cycle in a developing-country context [27]. This fragmentation limits comparative interpretation and weakens the translation of integration intent into verifiable requirements.
This study pursued a dual objective grounded in a life-cycle review of LC, CE, and C5.0. The primary empirical contribution is a two-round Delphi study in Morocco that prioritizes LCCE5.0 barriers and assesses inter-round stability. To frame this elicitation, the study proposes the LCCE5.0 model as an analytical lens. It is defined as a three-layer framework operating across five life-cycle phases. Using this lens, it developed a barrier taxonomy spanning design, procurement and supply chain, construction, operation and maintenance, and end-of-life. The taxonomy includes 40 barriers distributed across six dimensions and five macro-phases. Importantly, the Delphi results rank barrier salience and do not validate the model’s hypothesized causal pathway. Accordingly, the study reports transparent prioritization and consensus assessment to support subsequent empirical validation and model testing [30,31].
  • RQ1: What are the main barriers that hinder the joint implementation of LC, CE, and C5.0 (LCCE5.0)?
  • RQ2: What is the relative importance of these barriers, and what level of consensus does the expert panel achieve after two rounds (T1 and T2)?
This article makes three contributions. First, it clarifies the socio-technical mechanism by which C5.0 acts as an orchestration layer that translates LC–CE intent into auditable routines across life-cycle phases. Second, it operationalizes this mechanism through an integrated barrier taxonomy that supports consistent diagnosis and cross-study comparability. Third, it reports a transparent and reproducible Delphi-based prioritization with explicit consensus metrics and stopping criteria to support subsequent empirical validation and model testing.
According to the research design illustrated in Figure 1, the remainder of this article is organized as follows: Section 2 reviews LC, CE, and C5.0 and introduces the LCCE5.0 model and reported barriers; Section 3 details the Delphi protocol; Section 4 reports the taxonomy and prioritization results; Section 5 discusses implications; and Section 6 concludes with limitations and next steps.

2. Literature Review

2.1. Lean Construction: Adoption and Barriers

The dominant linear “take–make–dispose” model fragments decision-making across the project life cycle. It reinforces siloed organizational learning and affects cost, schedule, and quality. The traditional Design–Bid–Build (DBB) scheme separates design from execution and multiplies contractual interfaces. This separation constrains feedback and hampers continuous improvement.
In Morocco, sequential planning and fragmented coordination still constrain delivery performance. Moreover, collaborative practices and digital technologies have diffused slowly, reinforcing material losses, inefficiencies, and delays.
LC adapted the Toyota Production System to construction projects by prioritizing flow reliability and value creation while reducing variability and waste. Building on Transformation–Flow–Value (TFV) theory, LC conceptualized production as the joint management of transformations, flow, and explicit value generation [10]. Recent publications co-authored by Koskela reaffirm TFV as a contemporary production-theory lens for integrating Lean with digital construction and sustainability agendas [32,33]. This framing supports alignment with CE logics at end of life, where recovery outcomes depend on reliable workflows and stable process conditions [29].
Empirical studies reported a positive association between LC implementation and project outcomes. They documented improvements in cost, schedule, quality, and safety. However, evidence remained mixed across contexts and maturity levels. Performance gains depended on consistent deployment and alignment with governance structures. They also depended on embedding LC principles into contracts, decision routines, and organizational learning. These findings suggested that LC operates as a management system, not an episodic toolbox at the workface [34,35].
LC tools extend across design, procurement, execution, operations, and end of life. Accordingly, LC supports coordination of information and material flows across the life cycle. It also provides a platform for life cycle management and cross-phase learning. In this sense, LC functions as managerial infrastructure onto which CE strategies and C5.0 capabilities could be integrated. To avoid redundancy and excessive length, the manuscript consolidates phase-by-phase LC–CE–C5.0 bundles in Table 1 (Section 2.4) and reports detailed KPI and deliverable specifications in Appendix A, Table A1 [36,37,38].
Despite a growing evidence base, LC adoption remains incomplete and uneven across countries, project types, and firms. Empirical and review studies converge toward three main categories of performance gains: economic (shorter schedules, reduced costs, higher productivity), environmental (lower material consumption, waste, and emissions), and social (improved safety, ergonomics, and working conditions). However, tensions persist between short-term efficiency objectives and longer-term resilience, adaptability, and decarbonization goals. These tensions are particularly salient when LC is implemented mainly as a cost-reduction program [39,40,41,42].
From a governance perspective, weak strategic commitment, uncertainty about benefits, and limited integration of LC into decision structures and contracts hinder its institutionalization. LC often remains confined to pilot projects or local champions and is poorly connected to corporate performance systems and incentive schemes. This disconnection blurs the direct association between LC initiatives and project-level time and cost performance [40,41,43,44,45,46].
Cultural barriers include resistance to change, misaligned objectives between clients, designers, and contractors, and limited trust and transparency in interorganizational relationships. These factors weaken collaborative planning, reduce the reliability of commitments, and undermine continuous improvement routines [40,44,45].
Resource constraints such as limited time for training, shortages of skilled facilitators, and high perceived upfront effort reduce the capacity of organizations to test and sustain LC practices. Technical and market barriers—including limited access to enabling digital tools and fragmented supply chains—further slow diffusion, especially among small and medium-sized enterprises [40,41,47,48].
Weak public incentives, rigid procurement rules, and misaligned regulations compound these difficulties by rewarding lowest-first-cost strategies and discouraging collaborative arrangements. In this context, integrated frameworks such as LCCE5.0 support cross-pillar synthesis (Section 2.5) and clarify how LC routines operate as antecedent conditions across the life cycle. Such frameworks can also make explicit the association between LC practices and multi-dimensional performance outcomes, including cost, schedule, quality, safety, environmental footprint, and circularity indicators [40,45,49].

2.2. Circular Economy: Principles, Tools, Implementation, and Barriers

In the construction industry, the CE aims to create a regenerative system of value creation and retention across material and component life cycles, where materials remain in productive use for as long as possible before cascading into lower-value loops, recycling, or energy recovery [13,50]. CE strategies are commonly organized along a 10R hierarchy that prioritizes upstream avoidance and value retention over end-of-life recovery alone [51].
Recent studies reported that the largest environmental gains arise from upstream actions such as design for adaptability, long service life, and high-value reuse [15,52,53]. However, a substantial share of the literature still concentrates on downstream CDW management and end-of-life treatment options [4,15]. For a resource-intensive sector like construction, this downstream emphasis reinforces the need to interpret CE performance through a life-cycle, cross-phase lens, rather than through end-of-life diversion rates alone [4,13,15]. Within such a view, CE tools operate as antecedent conditions that shape key performance outcomes, including resource productivity, embodied carbon, and waste prevention [13,15].
Consistent with this cross-phase logic, CE practices span design, procurement, execution, operation, and end of life. In design, DfMA/DfD and BIM-enabled upstream product data support future reuse and embodied carbon control [54,55]. In procurement, EPD/LCA-informed purchasing and reverse logistics enhance environmental screening and loop closure [56,57,58]. During execution, on-site waste prevention and source-separation routines improve fraction quality [59,60]. In operation, circular facilities management and predictive maintenance extend service life [61]. At end of life, selective deconstruction and reuse marketplaces support high-value recovery [29,62]. Appendix A (Table A1) details these phase-specific bundles.
The literature identifies a set of cross-cutting barriers to CE implementation that weaken the association between CE tools and targeted performance outcomes, and reduce the ability to close resource loops and maintain material value over time. At the level of public policy, regulation, and public procurement, the absence of clear frameworks for the legal status of secondary materials, fragmented standards, and uncertainty surrounding warranties and liability for reused components hinder the adoption of CE practices, especially in renovation and end-of-life phases [51,63,64,65,66,67]. Public procurement rules that prioritize lowest upfront cost over life-cycle value further discourage innovative circular solutions.
At organizational and cultural levels, barriers include limited awareness of CE among clients and project teams, weak leadership on circular strategies, risk aversion, and the persistence of linear business models [4,66,67,68,69,70]. Many organizations lack explicit circularity routines in their governance systems, and CE responsibilities are rarely embedded in roles, processes, and performance indicators at project and corporate scales.
Economic barriers concern perceived high upfront costs, lack of appropriate financial instruments, and business cases that do not fully capture long-term benefits, externalities, and the residual value of reusable components [66,68,71,72,73,74,75]. These perceptions are reinforced by volatile secondary markets and uncertain demand for reused products, which make investments in CE infrastructure and skills appear risky.
Technological and data-related barriers include difficulties in generating, updating, and sharing reliable information. This information concerns material composition, performance, and history across the life cycle [66,69,71,76,77]. Several authors highlighted the lack of interoperable platforms linking BIM models, material passports, LCAs, and building logbooks. This limitation reduces the practical usability of CE-related information at renovation and deconstruction stages [69,78].
Finally, logistical and market barriers include underdeveloped collection systems and limited storage and sorting capacity. Markets for secondary materials and reused components also remain immature in many contexts [69,79,80]. CDW management systems remain unevenly developed. Long transport distances and inconsistent quality further reduce competitiveness. Lack of standardized specifications also disadvantages secondary materials compared with virgin alternatives [64,71,78]. Together, these barriers explain why CE implementation in construction remains uneven. They also explain why the relationship with multi-dimensional performance gains remains fragmented.

2.3. Construction 5.0 Technologies: Enablers and Constraints

C5.0 extends Construction 4.0 by shifting the focus from efficiency and automation toward techno-human orchestration with a human-centric, resilient, and sustainable orientation [19,20,81,82,83]. Building on the paradigms of Industry 5.0 and Operator 5.0, C5.0 seeks to align economic, environmental, and social performance outcomes, such that digital technologies support rather than replace human decision-makers. Within this frame, human–cyber–physical systems (HCPSs) and collaborative robots assist with hazardous, repetitive, or ergonomically demanding tasks [18,81].
Lean Construction 4.0 combines Lean principles with Construction 4.0 technologies while keeping the people–process–technology triad central [22]. Society 5.0 similarly frames digital transformation as a people-centric integration of cyberspace and physical space to address societal needs [22]. This human-centered proximity implies that Lean-oriented digitalization should be assessed against human and societal outcomes, not efficiency alone, because techno-human orchestration depends on how teams govern routines, technology choices, and social acceptance [22,23]. Therefore, Society 5.0 acts as a boundary condition that shapes the direct and indirect effects of Lean 4.0 digitalization on sustainability-oriented performance outcomes [22,23].
Empirically, this boundary condition can be proxied by information-governance maturity, including ISO 19650-aligned CDE practices and data stewardship, which condition whether DT-enabled interventions scale reliably through the BIM–CDE backbone [24,25,84]. Digital twins (DTs) provide decision infrastructure for testing what-if scenarios and quantifying trade-offs along cost–time–carbon–risk axes [85,86]. They create an antecedent relationship between data quality, model fidelity, and intervention effectiveness, suggesting that digitalization remains a socio-technical transformation that requires governance arrangements, skills, and organizational capabilities beyond tools and platforms [19,81].
BIM can be framed through both model-centric and process-centric scopes [87,88]. This study defines BIM (narrow) as an object-oriented, information-rich digital model used to coordinate geometry, attributes, and semantics across disciplines [87]. In contrast, it defines BIM (broad) as a socio-technical system for life-cycle information management, where governance rules and shared data environments structure information exchange, recording, and versioning [24,88]. In the C5.0 context, this information backbone relies on BIM and ISO 19650–aligned CDE workflows, supported by OpenBIM interoperability principles, to function as a “single source of truth” [25,89,90]. It enables 4D/5D modeling, rule-based QA/QC, and the creation of design- and operations-oriented digital twins [25,89,90]. Extended reality (XR) further acts as an interaction layer between human cognition and complex digital models, enabling immersive visualization, early problem detection, and collaborative value analysis and design critiques [91,92].
Across the life cycle, studies associated combined use of BIM, CDEs, DTs, and analytics with improved planning reliability, reduced rework, and better-informed trade-offs between carbon, cost, and time [93,94]. However, these associations remained contingent on interoperability maturity and information governance, suggesting that performance gains are not technology-determined. Accordingly, authors described complementary technology “bricks” spanning connectivity, analytics, and augmented production, yet these enablers strengthen LCCE5.0 only when oriented toward sustainability, safety, and worker well-being rather than productivity alone [18,19,81,86,95,96].
Consistent with this cross-phase logic, C5.0 capabilities support early verification and multi-criteria testing in design, sourcing transparency and reverse-flow visibility in procurement, closed-loop control of production and safety in execution, predictive interventions in operation, and selective recovery and market routing at end of life [18,29,85,90,91,94,97,98,99,100]. Appendix A (Table A1) details these phase-by-phase C5.0 bundles.
Barriers to C5.0 adoption arose at regulatory, technical, economic, organizational, and cultural levels and interacted across the life cycle. Standards and approval procedures often lagged behind innovation, while uncertainty remained around testing and certification protocols, insurance requirements, and the legal status of reused materials in digitally enabled circular processes [19,81,96]. Interoperability issues, fragmented data infrastructures, limited laboratory and testing capacities, and cybersecurity risks reduce confidence in integrated HCPSs [96,101,102]. These constraints intersect with economic uncertainties around business-model viability, secondary markets, and the distribution of benefits and costs among stakeholders [12,20,103]. Organizational and cultural barriers include limited digital skills, resistance to changing established procedures, and concerns about loss of autonomy or increased surveillance, which weakened trust in algorithm-informed decisions and shared data spaces [12,18,20,104].
Edge–cloud architectures can reduce latency and condition feasibility of predictive alerts at project and portfolio scales, yet they require robust interoperability within CDEs and sustained compliance with ISO 19650 and OpenBIM formats [12,86,97,102]. Governance arrangements must also allocate responsibilities and benefits for data creation, maintenance, and reuse [12,97,102]. Several authors recommended progressive scale-up across technology and design-readiness levels. They also recommended focusing on high-impact decision points to secure returns and mitigate adoption risks [12,96].
Finally, human-centric C5.0 depends on ethical and organizational safeguards. These safeguards address algorithmic transparency, accountability, and worker involvement in design and deployment. Project teams also require hybrid skill sets spanning engineering, data science, LCA, and ethical considerations [12,104,105]. Where these conditions are absent, C5.0 deployments may reinforce inequalities and create new dependencies. They may also destabilize Lean routines and CE loops rather than strengthening them. Section 3 empirically explores how experts prioritize these barriers and enabling conditions within the proposed LCCE5.0 taxonomy.

2.4. LCCE5.0: Integrating LC, CE, and C5.0 Across the Project Life-Cycle

This section presents the LCCE5.0 pathway as a hypothesized mechanism that structures constructs and expected associations across the project life cycle. The Delphi study does not test causality; validation requires longitudinal case studies, multi-project comparisons, or model testing using project-level data.
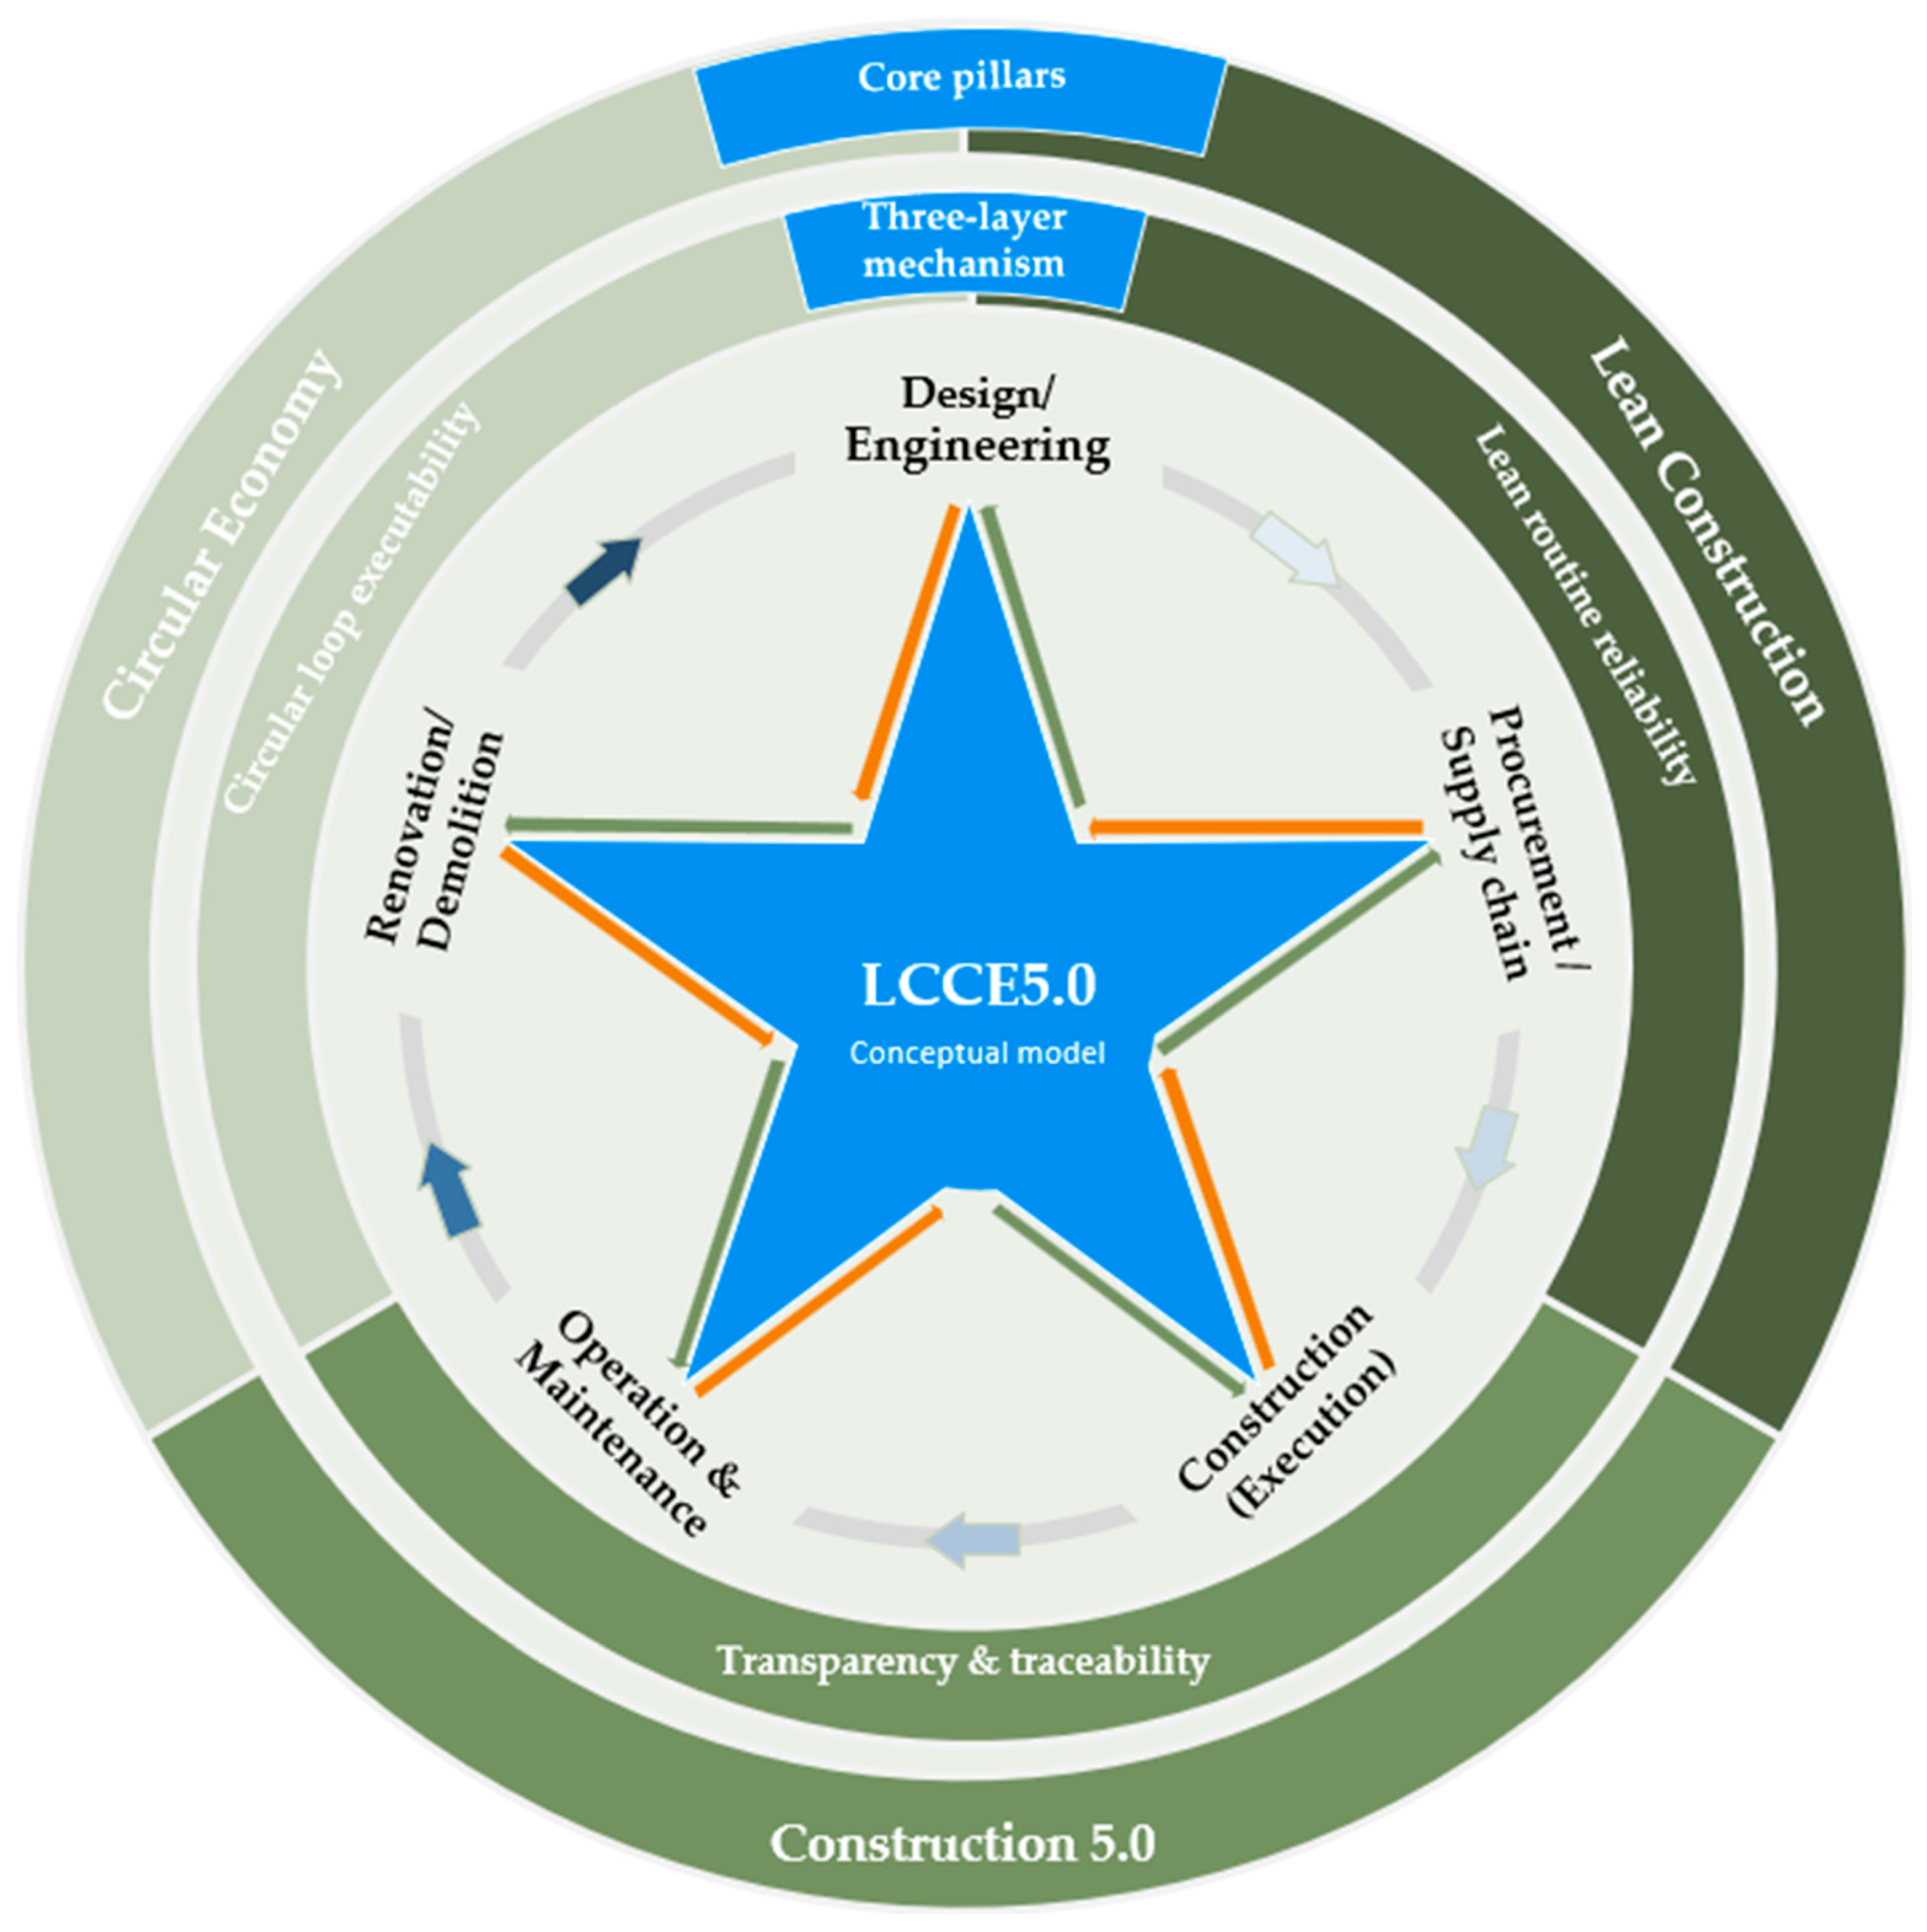
This study proposes the LCCE5.0 model as a socio-technical, life-cycle governance framework that advances hypothesized mechanism explanation linking digital transparency and traceability to Lean routine reliability and, in turn, to circular loop executability (Figure 2). Building on Section 2.1, Section 2.2 and Section 2.3, the framework specifies how LC, CE, and C5.0 interact across project phases rather than operating as parallel pillars. This logic aligns with the human-centric orientation of C5.0 [26,27,105] and with CE scholarship highlighting the role of digital infrastructures in closing and intensifying loops across the life cycle [106].
Table 1 maps representative concepts and exemplar tools underpinning the three pillars of LCCE5.0 (LC, CE, and C5.0) across life-cycle phases. Appendix A (Table A1) operationalizes this architecture through macro-phase bundles, indicator families, and deliverable specifications. Rather than enumerating tools exhaustively, LCCE5.0 structures cross-pillar integration around indicator families that translate routines and technologies into measurable performance outcomes.
Table 1. Cross-pillar concept map of the LCCE5.0 framework: representative C5.0 enablers, CE practices, and Lean routines across project life-cycle phases.
Emerging Technology 5.0 ToolsCE Tools (Examples)Lean Tools (Examples)
Design/Engineering
  • BIM “single source of truth”; ISO 19650/OpenBIM CDE; WIP/Shared/Published/Archive; APIs—4D/5D; rule-based QA/QC; design/operations DT [25,90].
  • XR layer—immersive visualization; early problem detection; collaborative value/design critique [91,92].
  • Edge–cloud; 5G/6G; IoT; AI/ML—alternative generation; schedule/logistics optimization; predictive risk management [107].
  • DfMA; modular product–process architectures—standard interfaces; reduced part variety; disassembly readiness [55,108].
  • DfD/Design for Disassembly—separable layers; reversible connections; accessible fixings—selective dismantling; residual value preservation [54,108].
  • Adaptability + Level(s) 2.3; upstream LCA/EPD; BIM product data—future reuse potential; passports/logbooks infrastructure [109,110].
  • IPD-type; co-location; Big Room—early stakeholder integration; interfaces/constructability definition [111,112].
  • TVD; set-based exploration; LPS-for-design—approval bottlenecks↓; rework loops↓; multi-performance targets [112].
  • VDC bundle: BIM; 4D/5D simulation; clash detection; constructability reviews; visual mock-ups—early constraints visibility; coordination errors↓; disassembly/maintainability visibility [113].
Procurement/Supply chain
  • Interoperable CDE—POs; performance declarations; product metadata; model-based bidding; 4D/5D—packages aligned with sequences/logistics [97].
  • RFID/QR; IoT sensors—batch traceability (supplier–site); logistics dashboards; QC/recall management [98,114].
  • BIM-coupled e-procurement; passports/databases; predictive analytics; control-tower dashboards; second-life marketplaces—CE/ESG screening; disruption visibility; reclaimed components [100].
  • EPDs; LCA evidence—embodied carbon; recycled content; EoL scenarios—procurement screening of environmental performance outcomes [55,56].
  • Standardization; modular families; off-site prefabrication—off-cuts/packaging/damage↓; recovery/reuse matching↑ [55,57].
  • Reverse-logistics consolidation and take-back planning—loop closure at scale; environmental + logistical performance stabilization [115].
  • JIT; framework agreements; supplier development—lead-time variability↓; buffers↓; stock-outs avoidance [116].
  • Upstream VSM—cumulative lead times/inventories/rehandling visibility; ordering/delivery redesign (CLCs; milk-runs; standardized packaging) [117]
  • Call-off planning and delivery-confirmation loops—release reliability and return-flow synchronization [115].
Construction/Execution
  • Robotics/autonomy; wearables/IoT (geofencing; biometrics; ergonomic monitoring); HRC safety—schedule reliability; defect rates; safety; material efficiency [18].
  • Additive manufacturing (on/off-site)—rapid repair; customized components [114,118].
  • Waste prevention; on-site reuse; CE logistics zoning; source separation; direct/reverse logistics—fraction quality↑; high-value recycling routes; disposal↓ [59,60].
  • Redeployment of reusable elements (formwork; scaffolding; temporary structures)—discard↓; closed-loop routines↑ [59,60].
  • Service-based models; circular contracts—ownership–performance shift; longevity/resource-efficiency incentives [119].
  • LPS bundle: master/phase/look-ahead/weekly planning; non-completion causes—variability↓; buffers↓; time/cost/quality↑ [120].
  • Work structuring + Takt planning/control; visual management; standardized work—waiting/congestion↓; rapid problem-solving↑ [40,121].
  • 5S; Kaizen; SMED; visual controls—quality/safety support; rework↓; more stable flows [40].
Operation & Maintenance
  • Cognitive/operational DT—diagnostics; prognostics; predictive maintenance; continuous performance optimization [122].
  • Smart meters; IEQ sensors; BEMS; MPC—performance drift↓; unresolved alarms↓ [99].
  • OpenBIM/IFC; COBie; ontologies; XR “smart manuals”; EPC + IPMVP M&V—scenario testing; intervention planning; contractual embedding [123].
  • Preventive/predictive maintenance; IoT sensors; condition-based monitoring—lifetime extension; reduced embodied impacts; reliability↑ [61].
  • Modular fit-out; demountable partitions; leasing models; asset-management integration—renovation/deconstruction scenario readiness [124].
  • Standardized plans; condition-based interventions; SMED-inspired changeovers—downtime↓; availability↑ [125].
  • 5S; visual management—inspection efficiency↑; safer interventions [125].
  • BIM-based asset information—performance management; continuous optimization; retrofit decision support [123].
Renovation/Deconstruction
  • As-built BIM; Scan-to-BIM—selective inventory; reuse-first dismantling sequences; DT scenarios/risks/logistics; reuse hubs—reversibility + CE criteria [29,123].
  • Robotic dismantling; automated sorting; AI characterization; IoT/RFID tracking—recovered-stream purity↑; real-time geolocation/status [98,126].
  • Material passports/DPP; blockchain/DLT; Digital Deconstruction-type matching platforms; quality protocols; planned reverse logistics—trusted reuse/recycling events; outlet predictability↑ [100,104].
  • Selective deconstruction; pre-demolition audits; hazardous ID; inventories—salvage/upgrade/remanufacture vs. waste routing [29,106].
  • CDW management plans—reuse/recycling/diversion targets; routing options [127].
  • Digital marketplaces + quality protocols—predictable outlets; reuse rates↑; circularity↑; avoided embodied emissions↑ [62,76].
  • Lean pull/make-to-order dismantling—alignment with downstream outlets; value recovery↑; landfill diversion↑ [29].
  • Work structuring; dismantling Takt; heijunka; end-of-life VSM—stabilized operations/logistics; predictability↑ [28].
  • Selective routing under resource constraints—reuse/high-quality recycling↑; residual waste↓ [29].
Note: The symbol ↑ indicates an increase, improvement, or favorable effect, whereas ↓ indicates a decrease, reduction, or unfavorable effect.
In this configuration, the integration of BIM, LCA, and material passports forms the information core of LCCE5.0. This integration enables a compact and traceable set of indicators, including material- and site-level global warming potential (GWP), the Material Circularity Indicator (MCI), the share of demountable components, reuse and recycling rates, and Lean reliability metrics such as Percent Plan Complete (PPC) and rework rates [128,129]. By embedding these metrics within interoperable information environments, digital models become governance instruments that support cross-phase accountability.
Material passports are positioned as a life-cycle data infrastructure rather than a standalone tool. They support semantic standardization, auditability of circular indicators, and continuity of asset information across procurement, construction, and end-of-life [100,130]. Digital twins reinforce this continuity by enabling simulation, 4D/5D planning, and as-built/as-is feedback loops [86]. Semantic interoperability between BIM models, LCA modules, and passports conditions measurement of circular loops and establishes a shared control language across stakeholders [106].
The hypothesized logic of LCCE5.0 unfolds in three steps. First, human-centered digital capabilities increase transparency by making material and process flows visible, measurable, and traceable, thereby reducing decision uncertainty [86,131]. Second, enhanced transparency stabilizes planning and execution routines across interfaces, reflected in higher PPC, lower rework rates, and reduced variability [42,128,132]. Third, once routines are stabilized and data are auditable, circular loops become executable and measurable through shared indicator dictionaries and life-cycle comparable evidence [58,120]. Reviews of LC–CE interactions reported predominantly positive complementarities between Lean principles and 10R strategies, particularly when prefabrication and disassembly-oriented design support reuse [26,27]. LCCE5.0 systematizes these complementarities and renders them operationally explicit.
The model holds under three boundary conditions:
(i)
Interoperable information management is institutionalized (e.g., ISO 19650-aligned CDE workflows) [133].
(ii)
Collaborative governance aligns incentives and responsibilities across actors [134,135].
Hybrid capabilities enable sustained cross-disciplinary adoption [104,105,132]. When these conditions are not met, digital transparency does not consistently translate into stable Lean routines, and circular targets remain difficult to operationalize.
Empirical studies on Lean, BIM, and emerging technologies provided partial prefiguration for LCCE5.0-type configurations. Performance improvements were most robust when leadership commitment, visual management practices (e.g., Obeya, A3), LPS routines, PDCA cycles, and pull-based flows were coupled with BIM/VDC, IPD-type governance, CDEs, DTs, and material passports [29,107,131]. At end of life, Lean–BIM–DT combinations supported selective deconstruction, traceable outgoing flows, and improved logistics and safety [29,86]. These studies illustrate integrated patterns rather than isolated interventions.
However, prior LC–CE frameworks often remained descriptive and under-specified the digital governance mechanisms required for auditable circular loops [26,27,120]. Lean–BIM–IPD and BIM/DT studies reported performance gains but rarely operationalized circular loop executability through traceable, life-cycle comparable indicators [29,107,131]. Construction 4.0/5.0 narratives described technological architectures yet provided limited guidance on when digital transparency becomes enforceable through Lean routines and executable circular targets under procurement and contracting constraints [26,27,97,105]. LCCE5.0 addresses these gaps by linking its hypothesized chain (Figure 2) to macro-phase indicator families and deliverables (Table A1) [128,129].
From a methodological standpoint, the current LCCE5.0 corpus relies primarily on case studies, before–after analyses, and perception surveys. While these designs provide convergent signals, they limit causal inference and cross-study comparability [18,27,44,131]. Environmental metrics remain heterogeneous and often secondary [120]. Moreover, MENA contexts, including Morocco, remain underrepresented despite emerging contributions [40,49]. These limitations motivate the empirical prioritization of barriers and enabling conditions developed in Section 3.

2.5. Synthesis of Barriers and Obstacles

Section 2.1, Section 2.2 and Section 2.3 identify pillar-specific barriers affecting LC, CE implementation, and C5.0 digitalization. Section 2.4 shows that integrating these pillars within the LCCE5.0 architecture does not produce a simple aggregation of obstacles. Instead, barriers recombine into systemic lock-in configurations that propagate across life-cycle phases and reinforce one another. A cross-cutting synthesis is therefore required to move from a “barriers-by-concept” perspective toward an integrated taxonomy of obstacles to joint LC–CE–C5.0 adoption (Table 2).
Table 2 consolidates a universe of 40 LCCE5.0 barriers structured across six analytical dimensions (cultural/socio-technical, economic/financial, environmental, organizational, regulatory/contractual, and technical/digital) and five life-cycle macro-phases. This structuring does not replicate isolated categorizations found in the literature. Rather, it enables joint assessment of Lean, circular, and digital constraints within a systemic governance perspective.
Analysis of this barrier universe reveals Critical Barrier Factors (CBFs) that act as recurring lock-ins. A first configuration relates to capability and cultural lock-ins, including limited experience in delivering Lean–circular–digital projects, weak leadership commitment, resistance to change, and insufficient trust and data sharing (e.g., CS1–CS9, OR1–OR4). A second configuration reflects economic and market lock-ins, characterized by high perceived upfront costs, limited access to green finance, immature secondary-material markets, and uncertain business models (e.g., EC1–EC6). A third configuration captures governance and regulatory lock-ins, including limited use of collaborative contracts, insufficient circularity targets in procurement, regulatory instability, and lack of standardized digital and circular indicator frameworks (e.g., RC1–RC8, TD1–TD8). These configurations interact across design, procurement, execution, operation, and end-of-life phases, thereby constraining the hypothesized chain described in Section 2.4.
In systemic terms, interoperability breakdowns, unstable Lean routines, incomplete traceability, and weak institutional alignment limit the transition from digital transparency to routine reliability and circular loop executability. The barrier universe therefore provides an operational matrix for identifying where the proposed LCCE5.0 mechanism is most vulnerable.
To contextualize this taxonomy, the study operationalized the 40 barriers for the Moroccan construction sector. While each item remains grounded in the international literature, wording was adapted to reflect public procurement practices, supply-chain configurations, and prevailing levels of digital maturity. This contextualization enabled construction of the Delphi instrument presented in Section 3.
The two-round Delphi design (T1 and T2) aims to rank and prioritize these obstacles, assess perceived importance, and measure consensus among experts. By identifying a prioritized subset of Critical Barrier Factors, the analysis highlights the most constraining lock-ins that are likely to require priority attention to make LCCE5.0 integration operational in practice.

3. Materials and Methods

3.1. Overall Research Design

The study adopted a two-stage sequential design combining conceptual development and expert-based prioritization. In the first stage, a structured literature review was conducted. The review followed a traceable protocol for conceptual synthesis and evidence mapping. This review supported the development of the LCCE5.0 conceptual model integrating LC, CE, and C5.0 technologies. It also enabled identification and structuring of barriers reported in prior studies. These barriers were consolidated into 40 potential critical barrier factors (CBFs). They were organized across six analytical dimensions and the full project life cycle. This set formed the analytical basis for Research Question 1 (RQ1).
In the second stage, the study assessed the 40 CBFs through a two-round Delphi study. The panel involved experts from the Moroccan construction sector. The Delphi process followed principles of iteration, anonymity, and controlled feedback with aggregated group responses. These principles limited interpersonal influence and made convergence observable [137,138]. The Delphi outputs included prioritization of barriers based on perceived importance for LCCE5.0 implementation (RQ1). The process also produced a documented assessment of convergence and stability across rounds (RQ2) [138,139]. Accordingly, the study did not intend the Delphi to test causal relationships or estimate performance effects. Instead, it provided a traceable expert-based prioritization and a consensus and stability assessment for the retained barriers [138,139].

3.2. Review of the State of the Art: Search Strategy, Selection Criteria, and Traceability

The review protocol comprised the following search, screening, and traceability steps. Searches were performed in Scopus, Web of Science Core Collection, ScienceDirect, and SpringerLink, combining bibliographic databases and publisher platforms. The review focused on publications from 2010 to 2025. Peer-reviewed journal articles and review papers were prioritized. Search strings combined Boolean operators, quotation marks, and truncations. They were applied to Title, Abstract, and Keyword fields. An iterative protocol was used, structured around three semantic groups (LC, CE, and C5.0). Accordingly, the review applied an evidence-mapping logic rather than effect-size synthesis to consolidate concepts, mechanisms, and barriers across LC, CE, and C5.0. Appendix B (Table A2) details the search strings.
The study executed the main searches on 20 August 2025 (UTC+01, Africa/Casablanca). It updated the searches on 27 September 2025. Duplicates were removed using Zotero (v7.0.30) and one retracted article was manually excluded. Records were then screened against predefined inclusion and exclusion criteria in Appendix B (Table A3).
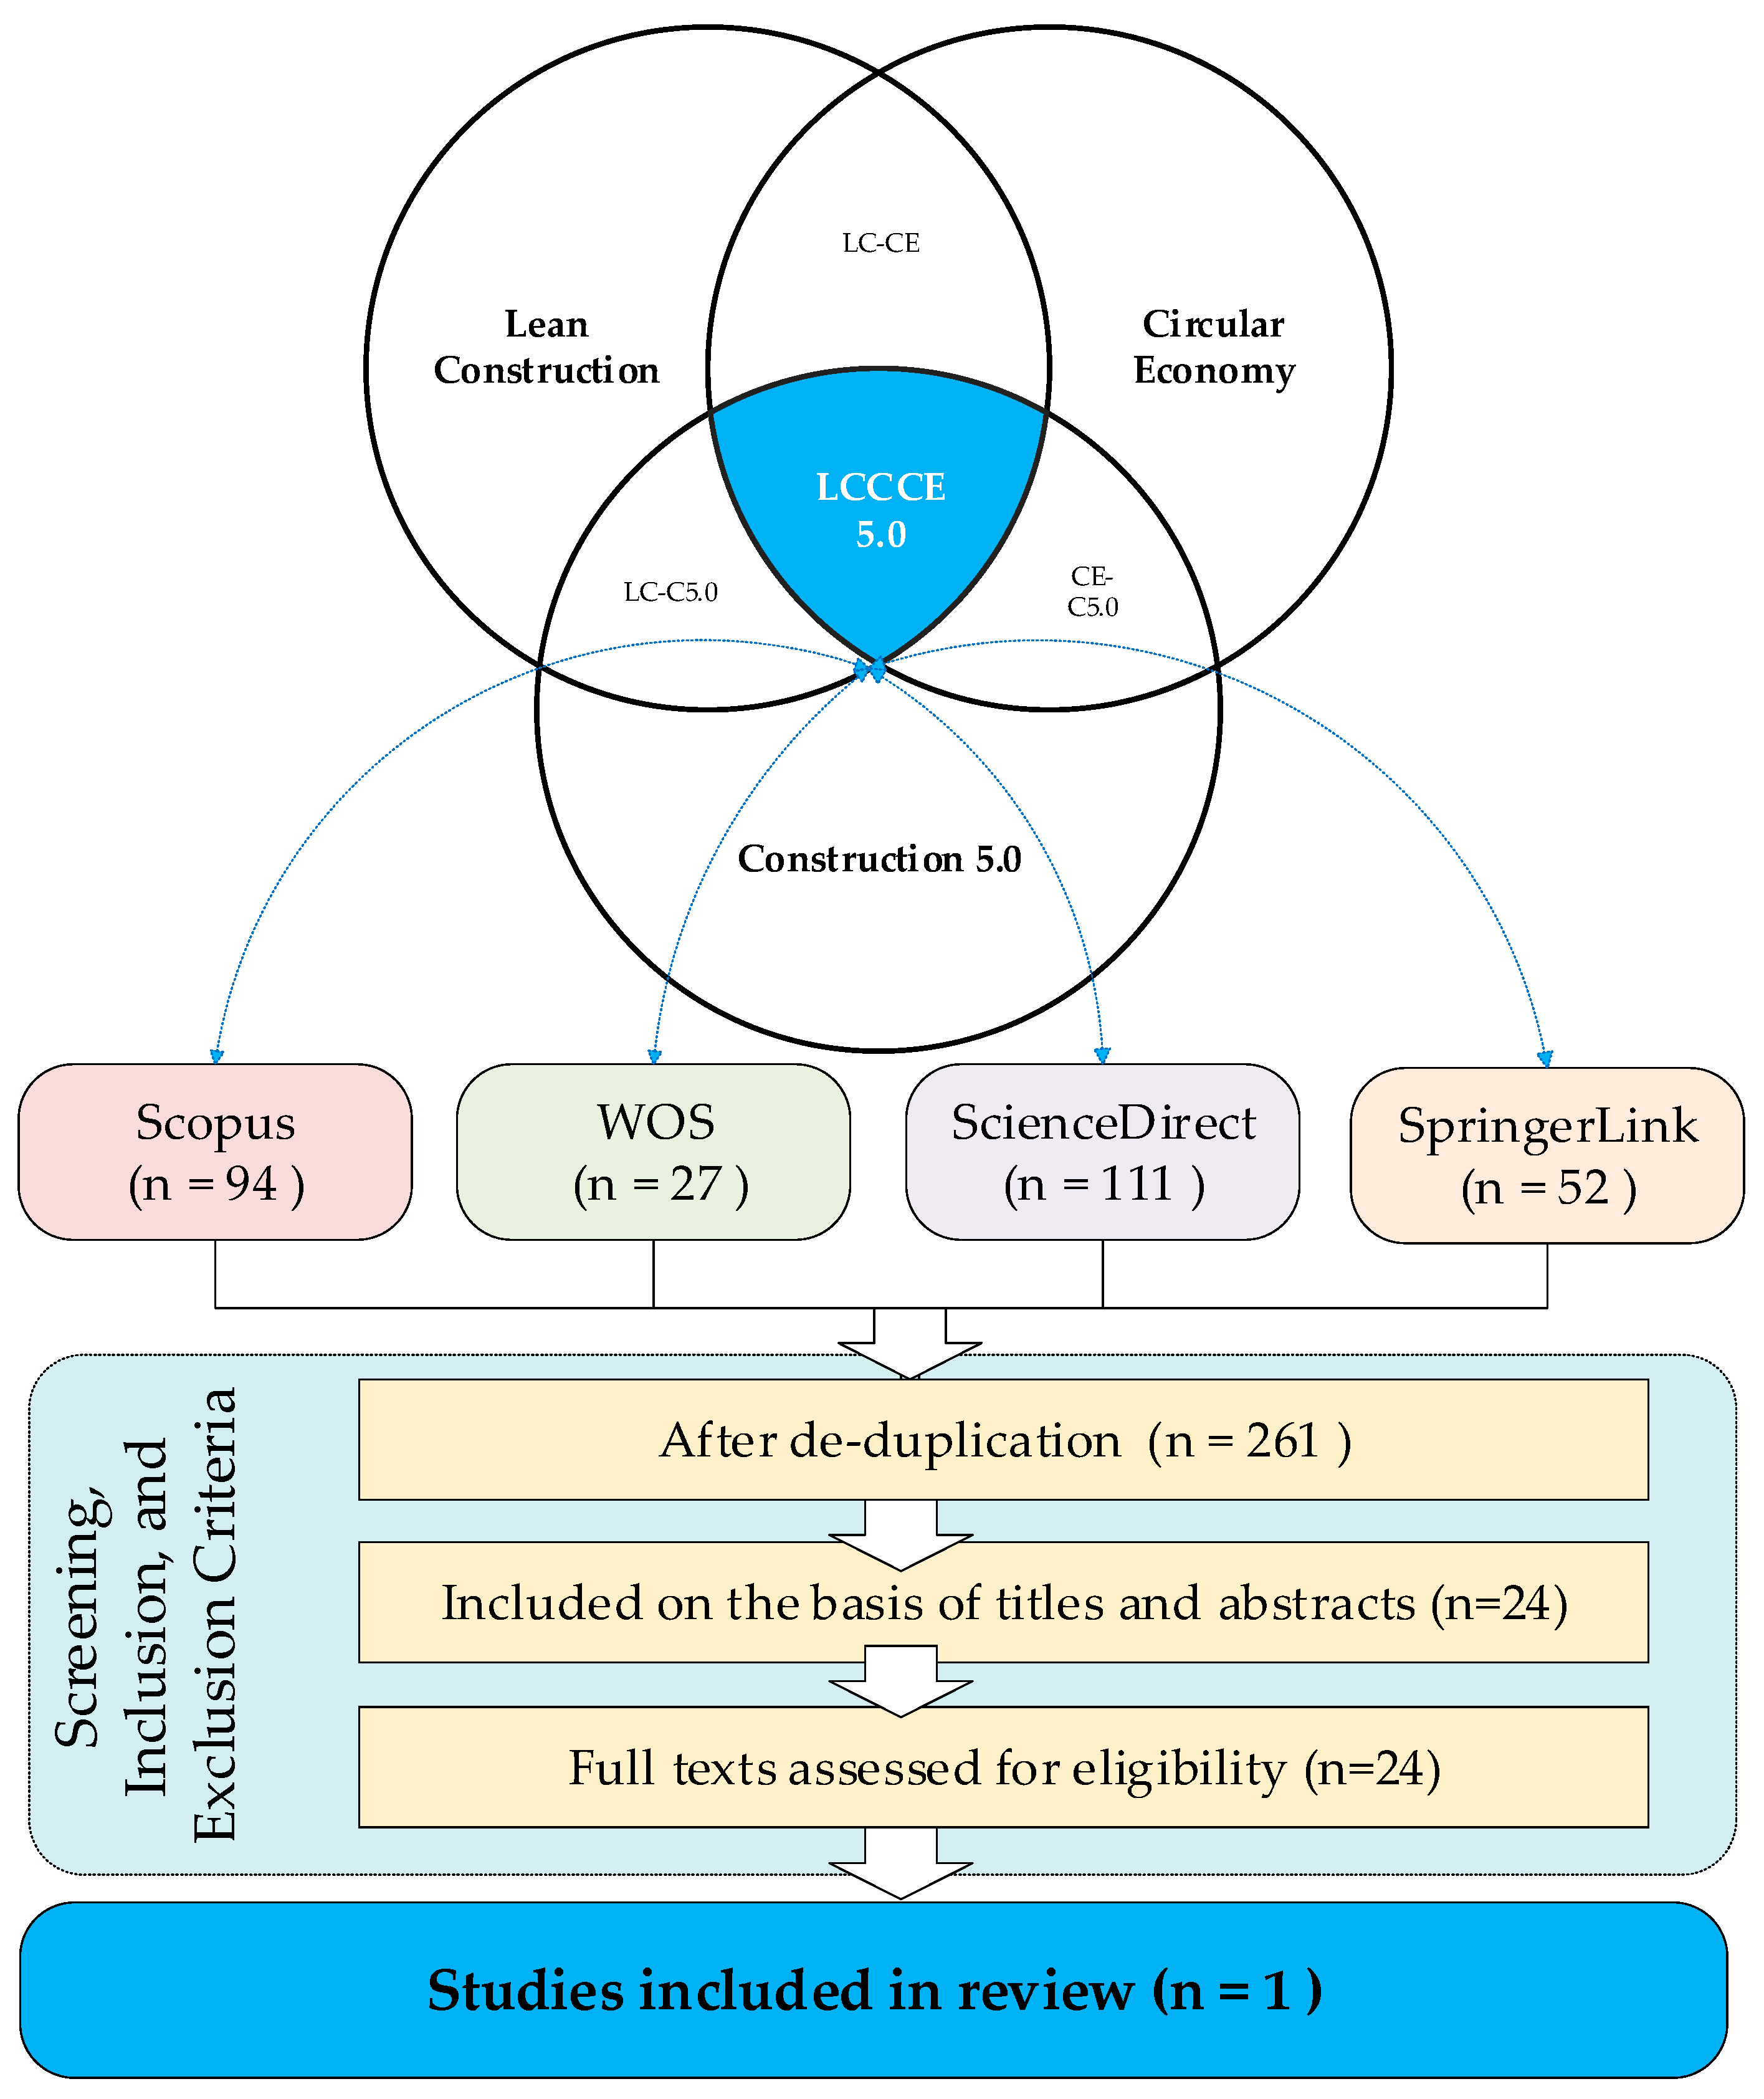
Study selection followed four sequential stages: deduplication and type/domain filtering, title–abstract screening, full-text eligibility assessment, and consolidation of the final analysis corpus (Figure 3). Figure 3 reports the stage-wise record counts and exclusion points to ensure selection traceability. Three reviewers independently assessed each stage. Disagreements were resolved through discussion until consensus was reached. Inter-rater reliability at the title–abstract stage reached κ = 0.81. This value was the mean pairwise unweighted Cohen’s kappa across three fixed reviewer pairs. The range was 0.76–0.84, indicating strong chance-corrected agreement for include/exclude decisions. At full-text eligibility, decisions were unanimous after discussion: 24 articles were assessed and 23 were excluded because they did not meet the integrative scope required, i.e., LC–CE–C5.0-–related digital mechanisms across the full project life cycle, resulting in one study retained for the evidence-mapping corpus.
To reduce retrieval and terminology bias during scoping, targeted gray literature was screened. Conference proceedings were also screened to refine terminology and support concept mapping. However, these sources were excluded from the main synthesis.
Traceability relied on three documentation layers. These layers included a research log capturing queries, filters, and exports. They also included a standardized extraction sheet. In addition, a selection table was used to document reasons for exclusion at each stage. Consolidated evidence was mapped against the three pillars of the LCCE5.0 framework. This mapping identified convergences, gaps, and inconsistencies.
Within the eligibility criteria, three structural findings motivated the development of the LCCE5.0 model. First, only one study in the corpus jointly addressed LC, CE, and C 5.0-–related digital topics across the full project life cycle. It did not provide an operationalizable framework with clearly defined performance indicators [128]. Second, evidence on barriers remained fragmented. Concepts were addressed separately or in pairs, without an integrative synthesis linking dimensions to life cycle phases. Third, when studies discussed digital enablers, they showed weak functional alignment with Lean and circular practices. They were also rarely articulated as explicit mechanisms supporting LC–CE integration [27].

3.3. From the 40 Barriers to the LCCE5.0 Taxonomy and Delphi Questionnaire Design

The study converted the universe of 40 barriers reported in Table 2 (Section 2.5) into an operational taxonomy. This taxonomy structured the Delphi questionnaire and supported consistent interpretation of results. Each CBF code (CS1–TD8) was preserved, and each barrier was assigned to two attributes. These attributes included (i) one analytical dimension and (ii) one life-cycle macro-phase.
“Design/Procurement” was treated as a transitional mapping category in specific cases. It was used when a barrier concerned both upstream specification and its translation into tender documents. Upstream specification covered targets, requirements, and deliverables. This rule affected phase visualization only. It did not alter T2 statistics or the final ranking. When more than one assignment was plausible, an explicit decision rule was applied. The dimension associated with the dominant mechanism described in the literature was selected. The macro-phase was assigned to the stage where the barrier most directly triggers implementation difficulties.
This taxonomy served two purposes. First, it provided the reference structure used to formulate and organize questionnaire items. Second, it served as the analytical lens for interpreting prioritization results. It also supported derivation of managerial and policy implications.
Each CBF was reformulated as a concise evaluative statement. Each statement described its potential to hinder LCCE5.0 implementation. Wording was kept operational and context-aware. This choice minimized interpretation ambiguity across heterogeneous expert profiles.
Experts rated each barrier using a seven-point Likert scale (1 = “not important”; 7 = “critical barrier”). A 7-point format was selected to improve discriminating power across 40 barrier factors and to reduce ceiling effects, while keeping respondent burden manageable across Delphi rounds. Evidence on rating-scale design suggests that seven response categories provide a robust balance between reliability, validity, and discrimination [140]. The complete Delphi questionnaire (items Q1–Q40, scale anchors, and item wording) is provided in the Supplementary Materials (Supplementary File S1). Higher scores indicated a stronger perceived negative influence on LCCE5.0 implementation. Each questionnaire section included open comment fields. These fields enabled experts to justify ratings and suggest clarifications. They also allowed experts to highlight contextual nuances.
Before dissemination to the Delphi panel, a pre-test was conducted with practitioners and academics. Participants were familiar with LC, CE, and digital construction topics (n = 8). Feedback informed targeted refinements and clarification of ambiguous wording. It also supported terminology harmonization with Section 2.1, Section 2.2, Section 2.3, Section 2.4 and Section 2.5. Minor editorial adjustments were made to reduce redundancy while preserving the 40 CBF set. The survey instrument was delivered in French and included an introduction summarizing the LCCE5.0 framework. The introduction also described the 40 CBF structure and the scoring procedure. Items were presented in a fixed order consistent with the taxonomy. A dimension-by-macro-phase structure was followed to maintain the life-cycle logic and reduce omission risk. The pre-test indicated a mean completion time of about 20 min. This result supported feasibility of the instrument.
Instrument validation relied on a two-step approach: an independent content validity assessment (Section 3.4) and a pilot pre-test to support face validity, clarity, and feasibility. Reliability evidence is reported through inter-round stability and consensus metrics (Section 3.6.5). Because the questionnaire operationalizes a formative inventory of distinct barrier factors rather than a reflective latent construct, construct validation procedures and internal consistency coefficients were not treated as primary evidence of instrument quality. No criterion-based (external) validation was conducted because the instrument operationalizes context-specific barrier factors and no accepted gold-standard measure exists for LCCE5.0 barrier severity in Morocco.

3.4. Expert Panel Composition and Content Validity Assessment (CVI)

The study constituted the Delphi panel using purposive sampling. The sampling strategy aimed to recruit information-rich experts rather than achieve statistical representativeness. Experts were identified based on experience and position within the Moroccan construction ecosystem. Inclusion criteria required three conditions. Experts needed (i) substantial experience in building and/or infrastructure projects. They also needed (ii) direct involvement in Lean, circular, and/or digital practices. Finally, they needed (iii) decision-making or supervisory responsibilities. These responsibilities covered client, contractor, consultant, regulatory, and technology-provider roles. Academic specialists in LC, sustainability, and digital transformation were also included.
Purposive sampling may introduce visibility and network biases in expert selection. This risk was mitigated through predefined stakeholder strata and role balance across the value chain. Anonymized profiles and eligibility evidence were reported in Appendix C (Table A4).
To reflect sector diversity, balance was sought across major roles in the construction value chain. Panel size was consistent with Delphi methodological recommendations. Prior studies commonly reported ranges of about 10–30 participants [31]. To preserve independence of judgments, only aggregated feedback was provided between rounds. This approach limited interpersonal influence.
Appendix C (Table A4, Table A5 and Table A6) reports anonymized profiles and panel characteristics. This reporting supports transparency and traceability.
Each invitation included an information sheet outlining study objectives and procedures. The sheet described the LCCE5.0 framework, Delphi steps, and expected time commitment. Participants provided informed consent before completing the questionnaire. Participation was voluntary and non-remunerated. In return, experts were informed that they would receive an anonymized synthesis of results.
Before Round 1, a distinct content validity assessment was conducted. Eight subject-matter experts completed this assessment. They were not part of the Delphi panel and were separate from the questionnaire pre-test. Following Lynn’s recommendations, experts rated each of the 40 CBFs for relevance. A four-point scale was used (1 = not relevant; 4 = highly relevant) [141]. Ratings were dichotomized to compute content validity indices. Ratings of 3–4 indicated “relevant”. Item-level content validity (I-CVI) was computed. Scale-level indices were also computed using S-CVI/Ave and S-CVI/UA, as clarified by Polit and Beck [142]. With eight experts, I-CVI ≥ 0.78 corresponded to at least 7/8 experts rating an item as relevant.
To adjust for chance agreement, the modified kappa coefficient (k*) was computed for each item, as shown in Equation (1). In this equation, Pc denotes the probability of chance agreement [143]. For N = 8 experts and dichotomized relevance (3–4 = relevant), Pc was calculated using Equation (2). In Equation (2), A is the number of experts rating the item as relevant. k* was interpreted using common benchmarks. These benchmarks were poor (<0.40), fair (0.40–0.59), good (0.60–0.74), and excellent (≥0.75).
k * = ( I - C V I P c ) ( 1 P c )
P c = ( N ! ( A ! ( N A ) ! ) × 0.5 N )
The scale demonstrated excellent content validity (S-CVI/Ave = 0.953), while universal agreement was moderate (S-CVI/UA = 0.625). Item-level results (A (3–4), I-CVI, Pc, and k*) and item decisions are reported in Appendix D (Table A7).
This CVI/k* procedure provided the main evidence of content validity for the Delphi questionnaire prior to Round 1.

3.5. Data Collection: Rounds T1 and T2

Round 1 (T1) captured experts’ initial ratings of the 40 CBFs. It also captured qualitative comments. Consistent with core Delphi principles, iteration, anonymity, and controlled aggregated feedback were maintained. T1 responses were summarized using descriptive statistics appropriate for ordinal scales. The median and interquartile range (IQR) were used as primary summaries [137,138].
Data collection was conducted from 1 to 26 November 2025. Within this timeframe, T1 was administered first. T2 was then administered after controlled feedback was delivered. The interval between T1 closure and T2 launch was about two weeks. This interval was selected to allow time for reflection on controlled feedback while maintaining engagement and minimizing attrition, consistent with Delphi good-practice guidance [137].
Before Round 2 (T2), experts received a feedback report for each CBF. The report presented the panel’s T1 median and IQR. Experts were invited to maintain or revise ratings in light of aggregated results. Open comment fields allowed experts to justify revisions or persistent disagreement. The response scale (1–7) and item wording were kept identical across rounds. This approach ensured inter-round comparability. Anonymity was maintained throughout the process, and only aggregated statistics were disclosed. Consensus and stability criteria were defined a priori.

3.6. Data Analysis and Consensus Assessment

Given the ordinal and bounded nature of 7-point Likert ratings, items were summarized using the median and IQR. Rank-based, non-parametric procedures were used to document convergence, agreement, and inter-round stability.

3.6.1. Barrier Ranking

For each CBF and for both Delphi rounds, the median and the IQR were computed. The median was retained as the primary indicator of perceived importance for ordinal ratings. The IQR was used as the primary indicator of dispersion and a pragmatic proxy for convergence [137,138,139]. Barriers were ranked in descending order of the median.
Ties were handled using an explicit rule. When barriers shared the same median, the barrier with the lower IQR was ranked higher. This rule reflected greater convergence [138,139]. If ties persisted, with identical median and IQR, barriers were retained ex aequo. This choice avoided imposing an artificial hierarchy [138].

3.6.2. A Priori Consensus and Stability Criteria (Item-Level and Overall Agreement)

Consensus, inter-round stability, and stopping criteria were defined a priori, before data analysis. This approach avoided post hoc decisions. Item-level convergence was assessed using the IQR. High convergence was defined as IQR ≤ 1 [138]. Because convergence may occur around high or low ratings, the IQR was interpreted jointly with the median. A top-box agreement criterion was also used [139].
Strong consensus was defined as IQR ≤ 1 and at least 75% of ratings within 6–7 [139]. Moderate consensus was defined as IQR ≤ 1 and at least 75% of ratings within 5–7. This tier did not meet the strong-consensus criterion [138,139]. Strong consensus was used to identify central barriers. Moderate consensus was used to interpret important but less intensely endorsed barriers.
These thresholds follow common Delphi reporting practices that combine dispersion and agreement. They reduce the risk of overstating consensus. Robustness was tested by re-running rankings and tier assignments under plausible alternative cut-offs. Alternative criteria included IQR ≤ 1.5 and/or agreement ≥ 70%. The resulting top-barrier set and tier assignments remained materially unchanged. This pattern suggests limited sensitivity to threshold choice.
Inter-round stability was assessed using criteria specified in the dedicated stability subsection. Overall panel agreement was documented using Kendall’s coefficient of concordance (W) (Section 3.6.3).

3.6.3. Overall Panel Agreement

Overall agreement on barrier rankings was assessed using Kendall’s W coefficient of concordance. Kendall’s W quantifies the degree of agreement among m experts who evaluate the same set of n barriers. Because Likert ratings produce ties, each expert’s ratings were transformed into within-expert ranks, and average ranks were assigned to tied values.
Let xij be the Likert rating given by expert j to barrier i. For each expert j, the ratings {x1j, …, xnj} were transformed into ranks {r1j, …, rnj} across the n barriers. For each barrier i , the summed rank across experts was computed as:
R i = j = 1 m r i j
The mean of summed ranks was then computed as:
R ¯ = 1 n i = 1 n R i
Next, the dispersion of summed ranks was quantified as:
S = i = 1 n ( R i R ¯ ) 2
To correct for ties, tied-ranks groups were identified for each expert j. Let tgj denote the size of the g-th tie group for expert j. The tie-correction term was computed as:
T = j = 1 m g = 1 G j ( t g j 3 t g j )
Kendall’s coefficient of concordance with tie correction was then computed as:
W = 12 S m 2 ( n 3 n ) m T
In Equations (3)–(7), n denotes the number of barriers and m denotes the number of experts. Kendall’s W ranges from 0 to 1. A value of 0 indicates no agreement, while 1 indicates complete agreement. W was reported together with its chi-square approximation and degrees of freedom [138,139,144]. Specifically, the following were computed:
χ 2 = m n 1 W  
With
d f = n 1
Between-round changes in W were interpreted descriptively rather than as formal hypothesis tests [138,139].

3.6.4. Comparison Between Rounds T1 and T2

Rounds T1 and T2 were compared using within-item changes in the median and IQR. Changes in agreement proportions were also examined (Section 3.6.2). The two rounds were separated by about 14 days. This interval supported reflection while limiting attrition [137,138,139].
Barriers were grouped using a priori rules combining importance and consensus. Central barriers were defined as median ≥ 6 with strong consensus. Secondary barriers were defined as those with moderate-to-high importance and/or partial agreement. This group included items meeting moderate consensus or showing improving convergence. Peripheral barriers were defined as those with low importance (median ≤ 3) and/or persistent dispersion (IQR > 1).
A predefined stopping rule was applied. The Delphi process was ended after two rounds, provided that response rates remained satisfactory. Stability was also required for at least 80% of items. Stability was defined as |Δmedian| < 1 and ΔIQR ≤ 1 between T1 and T2 [138,139]. Remaining changes were interpreted descriptively as revision dynamics after feedback [137,145].

3.6.5. Reliability of Judgments and Inter-Round Stability

Reliability was documented through inter-round stability and consensus metrics (rather than internal consistency), consistent with the instrument’s formative barrier inventory structure.
Because the 40 CBFs constitute a multidimensional inventory rather than a unidimensional scale, internal consistency coefficients were not treated as the primary evidence of reliability [146]. Stability was operationalized as |Δmedian| < 1 and ΔIQR ≤ 1 between T1 and T2, while overall agreement was assessed using Kendall’s W with tie correction.
Specifically, reliability we assessed through inter-round stability and rank-based associations across rounds [144]. Where reported, internal consistency estimates were treated as supplementary and interpreted cautiously. For ordinal ratings, ordinal reliability approaches based on polychoric correlations were preferred when feasible [147].
Statistical analyses were conducted using IBM® SPSS Statistics for Windows, version 27 (IBM Corp., Armonk, NY, USA). Microsoft® Excel and Microsoft® Word (Microsoft Corp., Redmond, WA, USA) were used for tabulations and for maintaining analytical logs, respectively.

3.7. Ethical Considerations, Confidentiality, and Reproducibility

An information sheet was provided to all invited experts, and informed consent was obtained from all participants before participation. Participation was voluntary. Participants were informed about the study purpose, data use, confidentiality measures, and their right to withdraw at any time. Expert characteristics were reported only in aggregated categories. Responses were anonymized prior to analysis to reduce re-identification risk.
Only limited professional identifiers and contact details were collected for recruitment and follow-up. Access to the data was restricted to the research team and organizational safeguards were implemented to prevent unauthorized access or disclosure.
To support reproducibility, raw exports were preserved unchanged and all processing decisions were documented in a structured decision log. A separate analysis dataset was created after documented checks and traceable corrections. Two authors independently recalculated medians, interquartile ranges, agreement proportions, ranking rules, Kendall’s W, and rank correlations. Discrepancies were resolved through joint review and recorded final computations in the analysis log.
The replication package includes the questionnaire, codebook, decision logs, and aggregated outputs. Individual-level data remain non-public to protect confidentiality; de-identified materials may be shared upon reasonable request.

4. Results

4.1. Data Integrity and Panel Retention Checks

Data integrity was verified for the Delphi dataset before computing medians, dispersion measures, and ranks. All quantitative ratings remained within the 1–7 Likert bounds across both rounds. No item-level data were missing because all 22 experts provided complete scores in T1 and T2. Open-ended comments were treated as optional and were analyzed separately from quantitative prioritization metrics. These checks followed Delphi good practice guidance for transparent consensus studies [137,138,139].
The panel achieved full retention across rounds. All 22 experts completed both T1 and T2 (attrition = 0%). Table A5 and Table A6 summarizes panel characteristics across stakeholder roles, sectors, experience, and decision responsibilities. The panel covered the main value-chain roles relevant to LCCE5.0 implementation in Morocco. Contractors and engineering consultants each represented 22.7% (n = 5). Clients/owners and public authorities/regulators each represented 18.2% (n = 4). Technology providers and academics/researchers each represented 9.1% (n = 2). This composition preserved both practice-oriented and analytical perspectives.
Sector coverage included building projects (22.7%, n = 5) and infrastructure projects (36.4%, n = 8). Mixed profiles represented 40.9% (n = 9). The panel showed high seniority. Half of participants reported more than 20 years of experience (50.0%, n = 11). In addition, 40.9% reported 11–20 years of experience (n = 9). Expertise aligned with the LCCE5.0 scope across LC, CE, and C5.0-related digital technologies.
Familiarity with Lean was high. A leading role was reported by 54.5% (n = 12). The remaining 45.5% reported direct implementation involvement (n = 10). Familiarity with CE also remained strong across the panel. A leading role was reported by 40.9% (n = 9), while 59.1% reported implementation involvement (n = 13). Exposure to C5.0-related technologies was balanced. Leading and implementation roles each represented 50.0% (n = 11). Most experts held tactical-level decision responsibilities (59.1%, n = 13). All participants operated in the Moroccan context (100%, n = 22). Together, these characteristics supported a robust and context-sensitive interpretation of prioritized barriers for Morocco’s construction sector.
After confirming data integrity and documenting full panel retention, the final prioritization of the 40 barriers was reported. T2 was used as the reference round.

4.2. RQ1 Results—Final Prioritization of the 40 Barriers (T2 as the Reference Round)

In response to RQ1, the final (T2) prioritization of the 40 barriers was reported. Priority distributions were also summarized across analytical dimensions and life-cycle phases. Items were ranked by descending Mdn_T2 and ties were resolved using IQR_T2, prioritizing lower dispersion. When ties persisted, items were retained ex aequo to preserve traceability.
Following the a priori scoring rules defined in Section 3.6.2, item-level medians and IQRs were computed. Top-box rates were also derived, and consensus tiers were assigned for each barrier in both rounds.
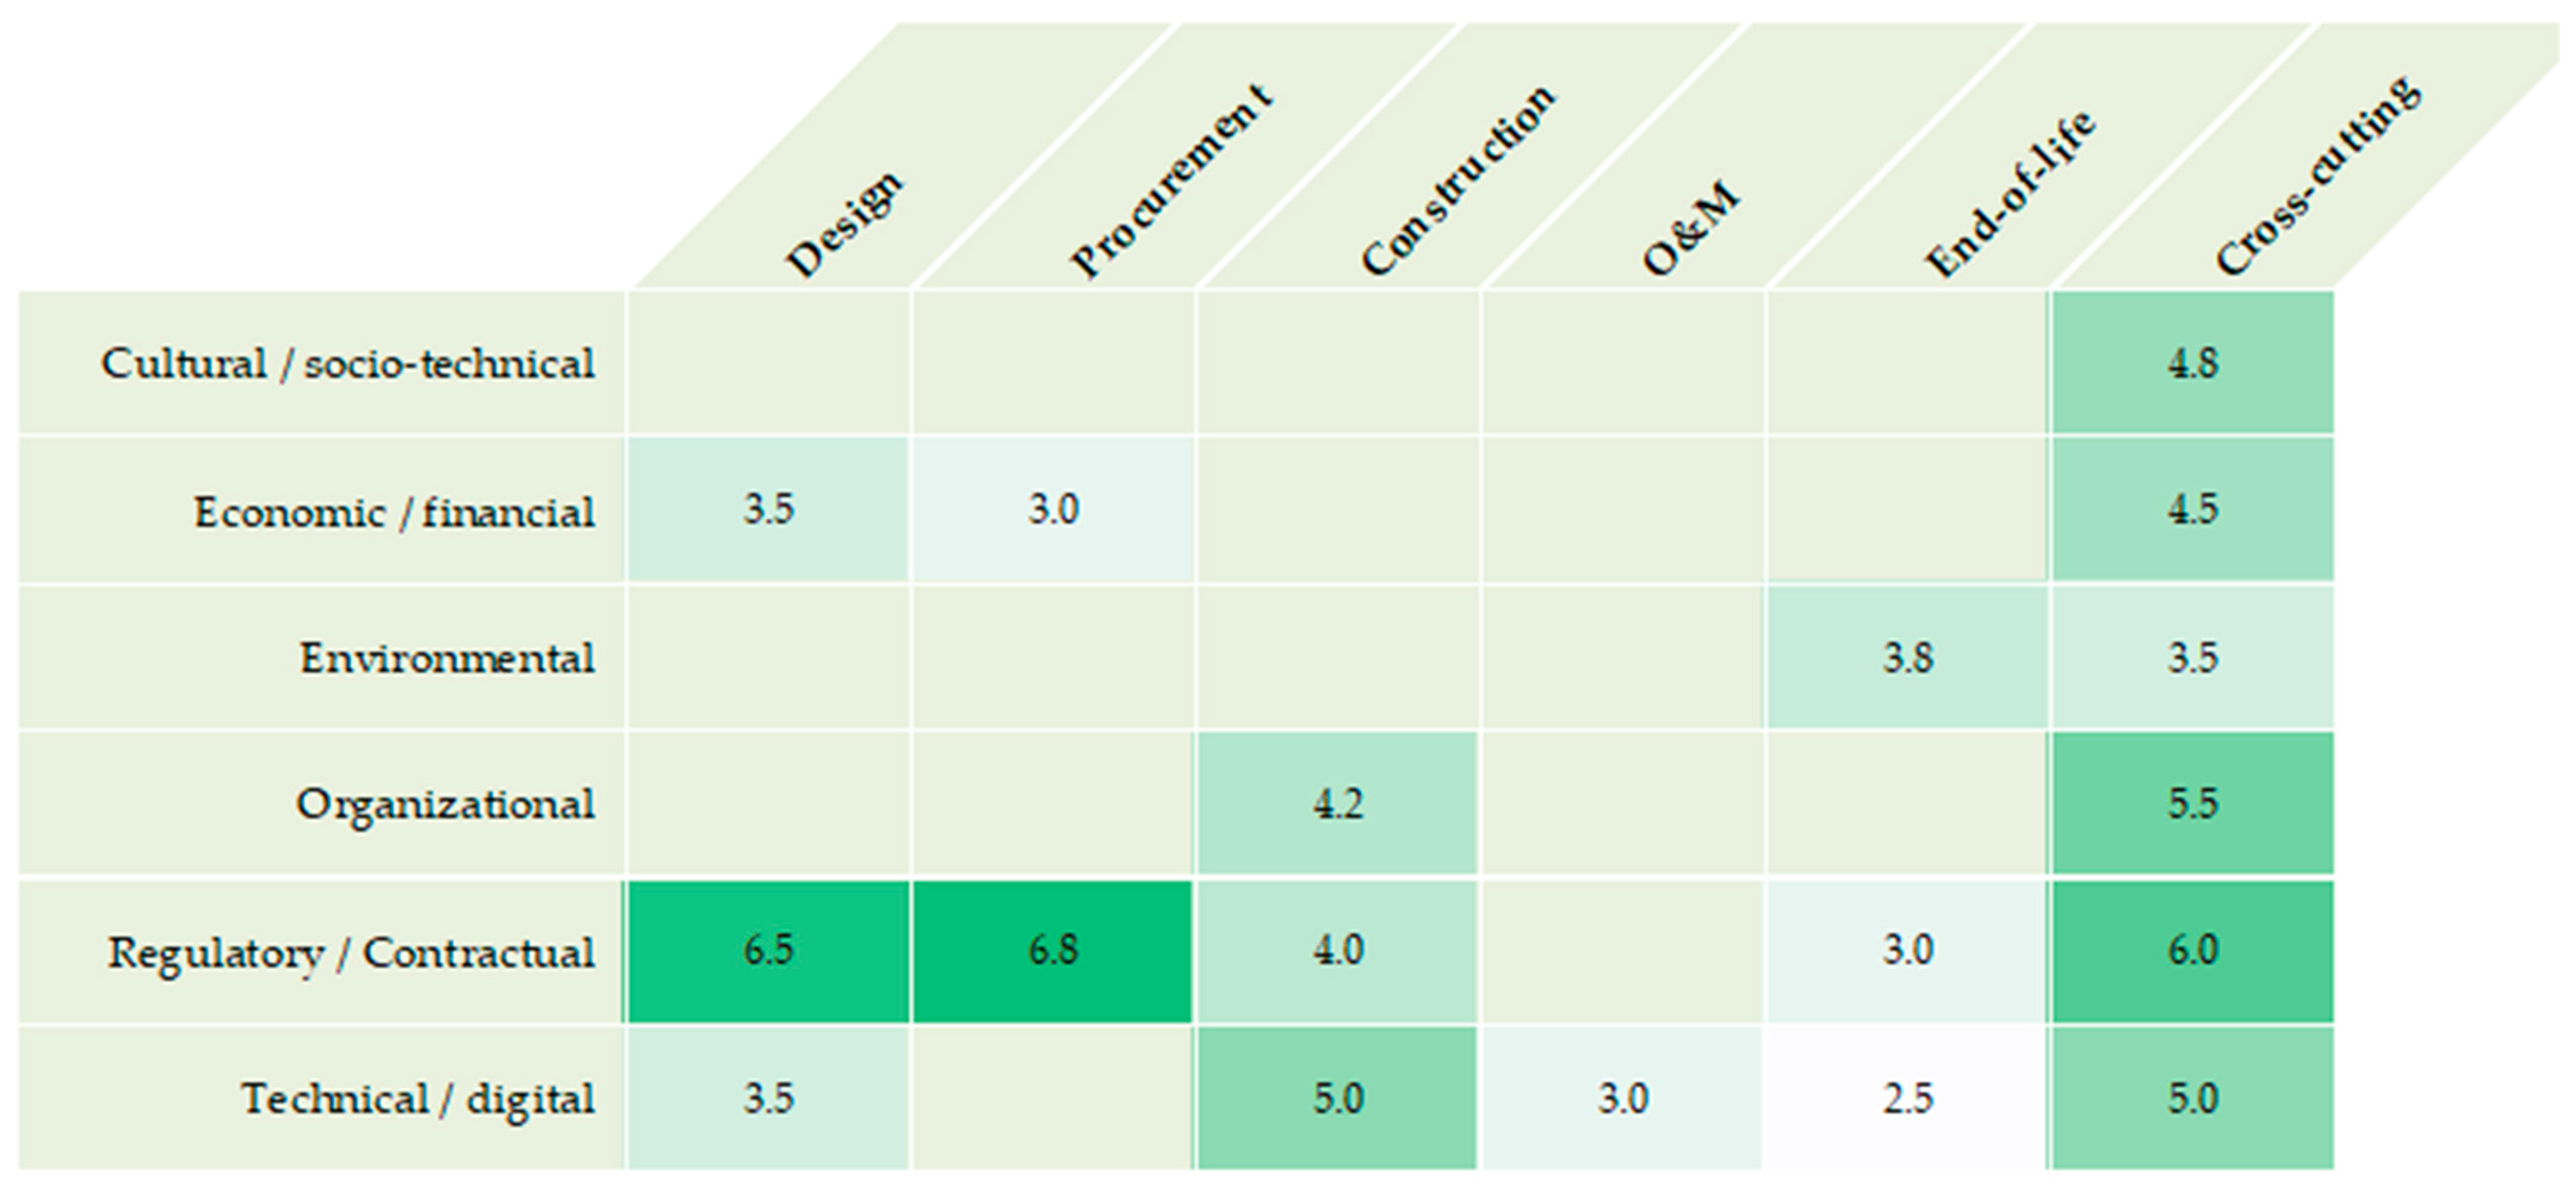
Table 3 shows that the top-ranked barriers concentrated in the Regulatory/Contractual dimension. Procurement-related mechanisms dominated the first positions. Barriers RC2, RC6, and RC8 jointly led the ranking (Mdn_T2 = 7.0). These items reflect procurement requirements and regulatory instruments ranked as most critical. Cross-cutting governance barriers also remained central. These included owners’ commitment to measurable targets (CS2; Mdn_T2 = 6.5) and high-level commitment of authorities and top management (CS8; Mdn_T2 = 6.0). Notably, several items increased from T1 to T2. Agreement profiles improved for CS8, RC3, CS1, RC1, and OR4, suggesting convergence under controlled feedback. In contrast, coordination of information and execution flows during construction (OR2) remained less consensual at T2 (Consensus_T2 = Moderate), despite a higher median (Mdn_T2 = 6.0). These concentration patterns were then summarized using the Dimension × life-cycle phase matrix (Figure 4) and the status typology (Table 4).
To complement the ranked list without repeating it, Figure 4 maps barrier intensity across the LCCE5.0 structure. It uses a Dimension × life-cycle phase matrix. Each cell reports the mean of item-level T2 medians for assigned barriers. Empty cells indicate that no barriers were assigned. Barriers coded as “Design/procurement” contributed to both the Design and Procurement columns.
The mean of medians was used only to visualize hotspot patterns. Inferential interpretation relied on item-level medians and IQR values, together with consensus metrics. Figure 4 shows the highest cell-level mean T2 medians in Regulatory/Contractual × Procurement (6.8) and Regulatory/Contractual × Design (6.5). The same dimension also remained high in Cross-cutting (6.0). Additional high values occurred in Organizational × Cross-cutting (5.5). Technical/Digital also reached 5.0 in both Construction and Cross-cutting. Other populated cells reported lower mean T2 medians and appeared in fewer dimension–phase combinations (Figure 4).
Using the predefined classification criteria described in Section 3.6.2, barriers were categorized as Central, Secondary, or Peripheral based on their T2 importance and agreement profiles to support managerial interpretation.
Table 4 summarizes the barrier status classification derived from the predefined criteria (Section 3.6.2). Central barriers represent the highest-priority items and show the strongest agreement profiles. Secondary and Peripheral barriers reflect progressively lower priority and/or weaker agreement. This typology provides an actionable lens for structuring the subsequent discussion of policy levers and implementation sequencing.

4.3. RQ2 Results—Convergence, Consensus, and Stopping Justification

This section assessed whether expert judgments converged between rounds. It also assessed whether two Delphi rounds were sufficient for stable prioritization. Following a priori criteria defined in Section 3.6.2, item-level convergence and stability were examined. Panel-level agreement was quantified using Kendall’s W. Robustness was also verified using sensitivity checks.

4.3.1. Item-Level Convergence and Stability

Item-level convergence was assessed by tracking changes in central tendency and dispersion between rounds. ΔMdn was computed as Mdn_T2 − Mdn_T1 and ΔIQR was computed as IQR_T2 − IQR_T1. These criteria followed Section 3.6.2. Table 5 shows that 37 of 40 items (92.5%) met the stability rule between T1 and T2. This result exceeded the predefined stopping threshold (≥80% stable items). Therefore, it supported termination after two Delphi rounds.
Median shifts were modest overall. Twenty-two items (55.0%) remained unchanged (ΔMdn = 0). Fourteen items (35.0%) increased by 0.5 points (ΔMdn = +0.5). Dispersion patterns also supported convergence. The IQR decreased or remained unchanged for 35 items (87.5%) (ΔIQR ≤ 0). Only five items showed a slight increase in dispersion (ΔIQR > 0). Three items did not meet the stability criterion (TD5, EC4, and TD8). These items showed larger shifts in median and/or dispersion relative to the study rule. Panel-level consensus on rankings was then quantified using Kendall’s W (Section 4.3.2).

4.3.2. Panel-Level Consensus on Rankings (Kendall’s W)

Panel-level concordance was assessed using Kendall’s coefficient of concordance (W). As shown in Table 6, agreement remained strong across rounds and increased slightly from T1 (W = 0.810) to T2 (W = 0.817). Using the chi-square approximation, χ2 = m (n − 1) W with df = n − 1, χ2 values were obtained of 694.786 (df = 39, p < 0.001) at T1 and 700.625 (df = 39, p < 0.001) at T2. These results indicate strong and consolidating rank agreement after controlled feedback. They also indicate high concordance in the ranking structure across experts.

4.3.3. Consensus Tiers and Agreement Shifts (T1 vs. T2)

Beyond rank concordance, agreement profiles improved from T1 to T2. This improvement was reflected by shifts toward higher consensus tiers and reduced dispersion for a subset of items. Table 7 summarizes tier distributions across rounds.
At T1, 4 items (10.0%) reached the Strong tier. Twenty-six items (65.0%) achieved Moderate consensus. Ten items (25.0%) remained in the None tier. At T2, the distribution shifted upward. Nine items (22.5%) were classified as Strong and 31 items (77.5%) as Moderate. No items remained in the None tier.
Consistent with convergence under controlled feedback, tier upgrades occurred for 14 items (35.0%). These upgrades included 4 Moderate-to-Strong, 9 None-to-Moderate, and 1 None-to-Strong. No downgrades were observed. Agreement tightening was also reflected in dispersion patterns. The IQR decreased or remained unchanged for 35 items (87.5%) (ΔIQR ≤ 0). Only five items showed a slight increase in dispersion (ΔIQR > 0).
Robustness of these agreement patterns was then tested under alternative threshold specifications (Section 4.3.4).

4.3.4. Robustness and Sensitivity Checks

To assess robustness, tier assignment was repeated under plausible alternative cut-offs for dispersion and agreement. This procedure followed the sensitivity logic defined a priori in Section 3.6.2. Specifically, the dispersion criterion was relaxed from an interquartile range of 1.0 to 1.5. The agreement threshold was also relaxed from 75% to 70%. The same agreement windows on the 7-point scale were kept.
Under these alternative specifications, the composition and ordering of the ten highest-ranked barriers remained unchanged. This result indicates that the prioritization was not driven by a single parameter choice. However, strength labeling of agreement was more sensitive to the agreement threshold. Nine of the ten top-ranked barriers shifted from Moderate to Strong consensus under relaxed thresholds. In contrast, the coordination barrier OR2 remained Moderate. Its top-box agreement at T2 stayed below 70%.
Together, these convergence, agreement, and sensitivity diagnostics support stability of the final T2 prioritization. They also provide the empirical basis for subsequent interpretation of implementation levers and sequencing.

5. Discussion

5.1. What the Hierarchy Reveals

This pattern suggests an institutional chain that helps explain what becomes actionable. Clients and authorities specify circular and digital requirements. These requirements are embedded and evaluated in tender documents through criteria and weighting. They then translate these requirements into contract clauses that can be verified. Verification relies on defined evidence and performance controls. In this sense, RC2, RC6, and RC8 appear to reflect the same upstream institutionalization mechanism. They move from specification to tender enforceability and contract verification. They are unlikely to represent isolated implementation obstacles.
The T2 ranking reveals a strong concentration of perceived implementation constraints in upstream governance. In this study, upstream governance constraints are defined as barriers that shape what owners can specify, contract, and verify before construction begins. These barriers operate through tender criteria, contractual clauses, accountability mechanisms, and data requirements. Therefore, they condition downstream execution capacity. These barriers cluster around procurement decision points. Procurement concentrates upstream leverage in public delivery settings [148]. The three highest-ranked barriers are Regulatory/Contractual. They map to Design/Procurement or Procurement phases: RC2 (Rank 1), RC6 (Rank 2), and RC8 (Rank 3) (Table 3). This hierarchy suggests that, in Morocco, LCCE5.0 adoption depends less on downstream capacity. It depends more on tendering and contracting routines that embed enforceable circularity and digital requirements.
Beyond the top three, the central tier remains dominated by socio-technical and governance constraints with cross-cutting influence. The panel ranks CS2 (Rank 4) and CS8 (Rank 5) as central barriers. These items reflect limited commitment to measurable LC–CE–C5.0 targets. Therefore, procurement reform alone appears insufficient. This pattern holds when owners and authorities do not translate intent into monitored targets with accountability. Regulatory stability emerges as a core enabling condition through RC3 (Rank 6) (Table 3). This pattern is consistent with a transactional interpretation. Perceived regulatory inconsistency discourages long-term investments in capabilities and partnerships. Predictable rules reduce transaction uncertainty across projects.
Contractual governance constraints also remain prominent in the central tier. The panel ranks RC1 (Rank 8) as central. It links this barrier to limited use of collaborative, risk-sharing contract models. This pattern suggests that experts associate feasibility with contracts that support early involvement, risk reallocation, and shared incentives. The hierarchy also emphasizes relational coordination through CS1 (Rank 7). This item captures lack of trust and transparency. Consequently, implementation appears fragile when parties cannot share information. It also appears fragile when they cannot synchronize decisions across organizational boundaries. The panel further ranks OR4 (Rank 9) as a central organizational barrier (Table 3). This result indicates that experts differentiate systemic deployment from tool-centered adoption.
Here, a distinction is made between system-setting barriers and system-operating barriers. System-setting barriers include rules, standards, decision rights, and evidence or verification routines. System-operating barriers include routines, skills, coordination, and on-the-ground execution capacity.
In the Moroccan national context examined here, public tender documents operate as the main market-entry gate for LCCE5.0 demand. The Delphi panel ranked RC2, RC6, and RC8 as the highest barriers, and all three sit at the tendering stage. This hierarchy suggests that CE standards and guidelines remain weakly operationalized for contracting, while environmental criteria receive limited weighting at award. It also suggests that tender documents seldom specify circularity targets and digital information requirements needed for auditable verification and traceable evidence. As a result, downstream LC–CE–C5.0 practices may remain optional and tool-centered, with limited capacity to demonstrate compliance across phases. Procurement routines therefore function as a lock-in mechanism that conditions accountability, data governance, and the feasibility of a governance-first adoption pathway.
Interpretive proposition 1: governance-first pathway. The central tier is consistent with a governance-first pathway in adoption logic. Procurement and contracting rules may act as antecedents to auditable circularity and digital compliance. This claim is expected to weaken when procurement is flexible. It is also expected to weaken when private frameworks already specify circular requirements.
Interpretive proposition 2: sequencing. The ranking is consistent with a sequencing logic in implementation constraints. System-setting barriers shape adoption feasibility. System-operating barriers shape maturity and performance outcomes after institutionalization. This claim is expected to shift when collaborative delivery models are mature. It is also expected to shift when decision rights are already aligned.
Three quantitative signals reinforce this interpretation (Table 3). First, Regulatory/Contractual mechanisms account for 5 of 9 central barriers. Cultural/socio-technical mechanisms account for 3 of 9. Second, cross-cutting barriers account for 5 of 9 central barriers. Design/Procurement and Procurement each account for 2 of 9. Third, central barriers cluster at Mdn_T2 = 6.0–7.0 (median = 6.0). Secondary barriers cluster at 4.0–5.0 (median = 4.0). Peripheral barriers cluster at 2.0–3.0 (median = 3.0). This tiering distinguishes system leverage points from capacity constraints. It does not imply that lower-tier barriers are irrelevant.
The ranking does not imply that secondary and peripheral barriers lack relevance. Instead, it differentiates perceived system triggers from perceived implementation capacity constraints. Several near-top secondary barriers rank immediately below the central tier. These include OR2 (Rank 10; Mdn_T2 = 6.0) and OR1 (Rank 11; Mdn_T2 = 5.5). Notably, some near-top items reach high Mdn_T2 values but remain secondary. This occurs because status assignment follows rule-based tiering. This tiering jointly considers central tendency, dispersion (IQR_T2), and complementary consensus indicators (Table 3).
Additional near-top items include TD5 (Rank 12; Mdn_T2 = 5.0), CS9 (Rank 13; Mdn_T2 = 5.0), TD7 (Rank 14; Mdn_T2 = 5.0), and TD6 (Rank 15; Mdn_T2 = 5.0) (Table 3). These barriers likely become decisive after procurement rules and targets clarify data demands. They also become decisive after coordination obligations become enforceable. In contrast, the lowest-ranked barriers reflect downstream and ecosystem constraints. This group includes TD2 (Rank 40; Mdn_T2 = 2.0). Several other bottom-tier items converge at Mdn_T2 = 3.0. This pattern reinforces their lower priority relative to governance barriers.
An alternative explanation is that experts prioritize institutional levers because procurement concentrates leverage in public delivery contexts. In such contexts, regulatory and contractual constraints become high-yield intervention points. However, this ordering may change when procurement is flexible. It may also change when collaboration is already contractually supported. In those environments, operational and technical barriers may rise in relative priority.

5.2. Comparison with the Literature

The dominance of procurement aligns with LC work that located major leverage in early governance and decision rights. Prior studies reported that weak strategic commitment and unclear decision authority constrained continuous improvement in emerging contexts [40,49]. This stream supports an antecedent relationship in which procurement rules condition later implementation feasibility. This pattern is consistent with the prominence of RC2, RC6, and RC8 (Table 3). Evidence from Morocco also reported that knowledge, skills, and organizational readiness shaped Lean diffusion. This evidence strengthens an interpretation that upstream governance is likely to be required to create stable demand and accountability [40].
Prior studies also reported that fragmented public procurement and supply chains intensified planning and coordination losses. Researchers showed that unstable interfaces reduced the reproducibility of flow-based methods, even when Lean tools were introduced [44,48,128]. Ballard and Howell framed performance reliability around promise management and pull-based production logic. This logic depends on stable commitments and transparent constraints [36,120]. These findings are consistent with the interpretation that upstream procurement governance shapes downstream constraints. It also shapes information quality (RC2, RC6, RC8; Table 3).
CE studies in construction similarly treated procurement as a scaling mechanism for circular outcomes. Reviews organized CE barriers across institutional, organizational, economic, technological, logistical, and market dimensions [4,73]. Multiple studies reported fragmented standards and weak integration of circular criteria in public procurement [4,63]. This convergence suggests that circular practices scale when procurement translates CE goals into auditable operational requirements. This interpretation aligns with RC2 and RC6 (Table 3). CE supply-chain evidence also emphasized traceability and governance as recurrent bottlenecks. These bottlenecks arise when circular verification remains weak.
Relational and contractual constraints also align with Lean adoption evidence emphasizing culture and collaboration. Prior studies reported resistance to change, misaligned values, and limited Lean awareness as persistent barriers [34,43,136]. Other evidence reported that low transparency and non-collaborative problem-solving weakened learning routines. It also weakened continuous improvement [35,45]. This stream aligns with the central positioning of trust and risk-sharing constraints in the hierarchy (CS1, RC1; Table 3). It suggests indirect effects of governance design on coordination reliability. It also suggests downstream effects on waste reduction outcomes.
The literature further warned that tool adoption without systemic alignment produced limited and unstable effects. Several studies reported that Lean was often treated as an add-on rather than an organizational value-creation system [43,46]. Evidence also reported tool-centered diffusion patterns that reduced the sustainability of performance gains [34,136]. This mechanism converges with the centrality of OR4 (Table 3). It supports the interpretation that LCCE5.0 may require an operating model rather than a toolbox.
The digital requirement signal also converges with CE and C5.0 work that positioned data infrastructure and interoperability as upstream conditions. Studies highlighted interoperability gaps, weak indicator systems, and insufficient traceability when platforms could not connect life-cycle data [71,78]. ISO 19650-oriented guidance also treated the CDE and well-specified exchange requirements as prerequisites. These prerequisites support accountable information flows across phases. Consequently, the results support a governance-first interpretation. In this interpretation, procurement defines enforceable digital and traceability requirements (RC8; Table 3).
A Morocco-specific signal lies in the joint centrality of three procurement levers (RC2, RC6, RC8; Table 3). This pattern is interpreted as a coupled market-entry bottleneck that blocks auditable demand; Section 5.1 details this lock-in logic and motivates the model implications discussed next.

5.3. Implications for the LCCE5.0 Model

Taken together, the central tier (T2) suggests a governance-to-routines implementation logic. Upstream procurement and contract rules can create enforceable requirements. These requirements may stabilize Lean routines and make circular loops auditable. This hierarchy specifies where to intervene first. It also clarifies ownership of interventions (Table 3).
  • Codifying circular procurement as a verifiable rule set (RC2, RC6—procurement levers).
The joint centrality of procurement barriers indicates that LCCE5.0 scaling is likely to require verifiable requirements. It does not rely on aspirational wording. Circular procurement research operationalized reuse, recycled content, dismantlability, durability, and take-back clauses. It did so through tender criteria and evidence rules [67,148]. Therefore, RC2 maps to standardizing CE requirements and verification rules across public procurement. RC6 maps to reweighting award criteria and specifying proof-of-compliance requirements [4,71].
  • Ownership (mini-RACI): Public regulators/procurement authorities are Accountable. Public clients are Responsible for tender application. Auditors are Responsible for verification rules. Suppliers are Responsible for evidence submission.
2.
Tendering the digital backbone of circularity (RC8—information requirements, CDE governance, traceability).
RC8 indicates that circularity and digital requirements need to be tendered as explicit information obligations. These obligations define deliverables and governance rules. Here, AIRs (Asset Information Requirements) and PIRs (Project Information Requirements) provide inputs to EIRs (Exchange Information Requirements). The CDE operationalizes controlled information states and exchange workflows across parties. ISO 19650-oriented guidance treats these elements as prerequisites for accountability and continuity across phases [97]. Consequently, RC8 maps to defining AIR/EIR-style tender requirements, CDE rules, and traceability expectations (Table 3). This lever anchors in Procurement. However, it enables execution tracking and end-of-life recovery.
  • Ownership (mini-RACI): The client is Accountable. Design–procurement teams are Responsible for requirement drafting. Lead appointed parties are Responsible for delivery. Technology providers and regulators are Supporting for interoperability and governance templates.
3.
Converting intent into measurable targets and stable rules (CS2, CS8, RC3—sponsorship, accountability, predictability).
The hierarchy indicates that procurement reform may remain insufficient unless intent becomes measurable and monitored. Lean adoption studies reported that weak commitment and unclear decision rights constrained continuous improvement in emerging settings [40]. Accordingly, CS2 and CS8 map to formalizing LC–CE–C5.0 targets. They also map to institutionalizing monitoring routines with explicit accountability [44,49]. RC3 maps to stabilizing and harmonizing rules over time through consistent guidance and enforcement. CE research also treated regulatory stability as necessary to reduce ambition–practice gaps [4].
  • Ownership (mini-RACI): Owners and authorities are Accountable. PMOs and project governance units are Responsible. Regulators are Responsible for stability and enforcement. Market actors are Consulted.
4.
Making collaboration structurally feasible (CS1, RC1—trust routines, transparency rules, risk-sharing contracts).
The central positioning of relational and contractual constraints indicates that LCCE5.0 may require governance for joint problem solving. Lean studies reported that low transparency and non-collaborative problem-solving weakened learning routines. It also weakened continuous improvement [35,45]. IPD-oriented work linked early involvement and aligned incentives to shared risk–reward structures [134]. Therefore, CS1 maps to relational governance routines and explicit transparency rules. RC1 maps to risk-sharing contract features that clarify responsibilities for digital and circular evidence.
  • Ownership (mini-RACI): The client remains Accountable. Contracting teams are Responsible. Core parties are Responsible for transparent routines. Independent facilitators are Supporting.
5.
Preventing tool diffusion and installing an operating system (OR4—routines, standards, operating model).
OR4 indicates that the main risk is isolated tool diffusion without an operating model. Prior studies reported toolbox implementations where Lean became an add-on rather than a value-creation system [43,46]. Evidence also reported that weak learning routines reduced the sustainability of performance gains [34,136]. Hence, OR4 maps to deploying an operating system with standard work and review rituals. It also maps to explicit integration accountability (Table 3).
  • Ownership (mini-RACI): Organizational leadership is Accountable. PMO-like units are Responsible. Project teams are Responsible for routine execution. External coaching is Supporting.
  • Direct and indirect effects and boundary condition.
Procurement levers may have more immediate effects on compliance audibility and verification. Trust and contract levers may produce indirect effects through coordination reliability and learning routines. This mapping is expected to shift when private procurement is flexible or IPD-like collaboration is mature. Under those boundary conditions, technical barriers can rise in relative priority.
The Delphi findings show that central barriers concentrate in public procurement rules, contractual governance, and life-cycle information requirements. This configuration indicates that circular outcomes remain constrained when decision rights and verification routines are fragmented. Fragmented information handovers across actors also weaken accountability.
This interpretation resonates with Lean production-control evidence. Performance improvements depend less on isolated tools than on stable, enforceable routines. These routines protect workflow reliability and make commitments auditable. In circular construction, procurement acts as a gatekeeping leverage point. It determines acceptable evidence, criteria weights, and compliance verification. Therefore, procurement shapes downstream design, supply, and execution behaviors. Circularity also requires traceability across the life cycle. Accordingly, the results align with ISO 19650–oriented guidance on information management. This guidance emphasizes EIR and CDE governance that stabilizes exchanges and accountability [97].

5.4. Suggested, Practice-Oriented Recommendations Directly Linked to Central Barriers

The recommendations below are practice-oriented suggestions derived from expert prioritization. They are not presented as proven interventions and are intended to be interpreted as testable propositions for future pilots and validation studies.
  • R1. Publish an operational CE procurement standard with enforceable clauses and role-based verification responsibilities (Targets RC2, RC3).
    A national CE procurement standard should define minimum circular clauses and acceptable evidence formats. It could also specify role-based verification responsibilities. This intervention may reduce interpretive ambiguity and stabilize compliance expectations over time.
    Deliverables: clause library, evidence templates, verification matrix, audit-trail protocol.
    KPIs: share of tenders using the standard, evidence completeness rate, frequency of CE-clause disputes.
  • R2. Recalibrate award models using explicit weights for circular and environmental criteria (Targets RC6, RC2).
    Award models could assign explicit weights to circular criteria and require auditable documentation as a scoring condition. This approach combines weighted scoring with performance-based circular clauses and post-award verification gates. This structure is intended to align award decisions with circular performance outcomes.
    Deliverables: weighted scoring rubric, mandatory evidence bundle (traceability declarations, diversion routes, disassembly plan).
    KPIs: circular criteria weight (%), post-award audit pass rate, alignment between bid scores and delivered results.
  • R3. Embed circularity targets in contracts as measurable obligations with acceptance gates (Targets RC8, CS2).
    Tender documents could formalize targets as contractual obligations linked to acceptance criteria and monitoring routines. This approach may reduce the intent–control gap by making targets auditable during delivery.
    Deliverables: KPI schedule (diversion %, reuse %, recycled content), acceptance protocol, monitoring plan.
    KPIs: target adoption rate, target–actual variance, corrective-action closure rate.
  • R4. Tender ISO 19650-aligned information requirements through EIR deliverables and CDE governance (Targets RC8).
    Owners could specify EIR deliverables and CDE governance rules aligned with ISO 19650. These requirements may improve traceability, accountability, and controlled data exchange [97].
    Deliverables: EIR package, CDE access rules, validation workflow, audit logs.
    KPIs: EIR inclusion rate, exchange compliance rate, rework attributed to information defects.
  • R5. Adopt risk-sharing contract features that protect early collaboration (Targets RC1, CS1).
    Contracts could include risk-sharing features, shared goals, and risk ownership allocation. Risk could be allocated to the party best able to manage it. This structure may strengthen trust antecedents and may reduce opportunistic behavior.
    Deliverables: shared risk register, gain/pain sharing, early-warning routine, dispute-avoidance mechanism.
    KPIs: claim frequency, dispute value, schedule reliability trends.
  • R6. Institutionalize relational governance via transparency rules and structured collaboration mechanisms (Targets CS1, OR4).
    Relational governance could be institutionalized through mandatory transparency routines and structured collaboration protocols. Prior Lean evidence suggests that stable coordination depends on routines and feedback loops, not ad hoc tool deployment.
    Deliverables: governance charter, decision rights, shared dashboards, constraint log, improvement cadence.
    KPIs: constraint removal lead time, plan reliability, rework rate, improvement action closure rate.
  • R7. Introduce a pre-procurement “target gate” that converts leadership intent into quantified targets (Targets CS2, CS8).
    Owners and authorities could set quantified targets before tender launch. This gate may reduce renegotiation and may strengthen alignment.
    Deliverables: owner circular brief, tender-launch approval gate.
    KPIs: percentage of projects passing the gate, target change frequency after tender, compliance with defined targets.
  • R8. Shift implementation from tool deployment to an operating system with standard work and accountability (Targets OR4, CS8).
    Implementation could shift from tool-centered logic to an operating system that defines standard work, accountability, and continuous improvement routines. Evidence on Lean–BIM integration suggests that benefits emerge when organizations codify routines and governance.
    Deliverables: standard work packages, RACI matrix, continuous improvement cadence.
    KPIs: standard work adherence, cycle time reduction, defect leakage rate.
  • R9. Stabilize regulatory expectations through a sequenced roadmap for standards and enforcement (Targets RC3).
    R1 specifies the content of circular clauses and evidence rules, while R9 specifies the rollout logic. The roadmap could define phasing, enforcement intensity, and market-readiness milestones. This approach may reduce uncertainty premiums and may enable capability building.
    Deliverables: phased roadmap, compliance architecture, public reporting routine.
    KPIs: compliance trend over time, exemption frequency, audit coverage rate.
  • R10. Align procurement with early-phase value mechanisms via target-driven design and design-stage collaboration (Targets RC2, RC6, CS2).
    Procurement could align with early-phase value mechanisms through target workshops and structured design collaboration. Design decisions shape the feasibility of slowing, narrowing, and closing loops across the life cycle.
    Deliverables: target workshops, documented trade-offs, design reviews requiring disassembly and end-of-life scenarios.
    KPIs: reduction in post-tender design changes, improvement in circular KPIs at delivery, verified reuse and recycling outcomes.

6. Conclusions

This study prioritized barriers that hinder the integrated adoption of LC, CE, and C5.0 (LCCE5.0) in Morocco. Expert judgment was translated into practice-oriented, suggested implementation recommendations. These recommendations are framed as testable propositions rather than proven interventions. Grounded in a structured review, a conceptual LCCE5.0 model was first proposed as a three-layer framework spanning the full project life cycle. This lens was then used to structure and prioritize barriers through a two-round Delphi study.
In response to RQ1, the panel converged on a compact core of high-impact upstream governance constraints. The panel also identified cross-cutting commitment and relational/organizational barriers. This pattern indicates that LCCE5.0 adoption is shaped primarily by upstream governance rather than downstream execution capacity alone. Implementation leverage was interpreted using the final T2 priority hierarchy. Dispersion-based convergence signals (IQR) and top-box agreement were also used as indicators. In addition, barriers were mapped to life-cycle phases to distinguish system-setting constraints from system-operating constraints. In response to RQ2, the process met the predefined stopping rule. Specifically, 92.5% of items were stable under the a priori criterion (|Δmedian| < 1; ΔIQR ≤ 1). Panel-level agreement remained strong at T2 (Kendall’s W = 0.817; χ2 approximation, df = 39, p < 0.001).
The main findings can be summarized as follows:
The three highest-ranked barriers were procurement-centered and Regulatory/Contractual. They were RC2 (Lack of operational CE guidelines and standards in public procurement; Mdn_T2 = 7, IQR_T2 = 0.75, TopBox_T2 = 100.0%), RC6 (Marginal consideration of environmental criteria in public procurement; Mdn_T2 = 7, IQR_T2 = 1.00, TopBox_T2 = 100.0%), and RC8 (Lack of circularity targets and digital requirements in tender documents; Mdn_T2 = 7, IQR_T2 = 1.00, TopBox_T2 = 90.9%). Collectively, these barriers indicate weak institutionalization of auditable circular and digital requirements at the tender stage.
Central cross-cutting commitment barriers remained decisive. They were CS2 (Limited commitment of project owners to measurable sustainability targets aligned with LC–CE–C5.0; Mdn_T2 = 6.5, IQR_T2 = 1.00, TopBox_T2 = 86.4%) and CS8 (Insufficient high-level commitment of public authorities and corporate top management to LC–CE–C5.0 approaches; Mdn_T2 = 6.0, IQR_T2 = 0.0, TopBox_T2 = 95.5%). This pattern suggests that procurement reform underperforms when intent is not translated into measurable targets, accountability, and monitoring routines.
RC3 (Instability and inconsistencies in the regulatory framework; Mdn_T2 = 6.0, IQR_T2 = 1.00, TopBox_T2 = 95.5%) acted as a conditioning constraint. It undermines long-horizon circular commitments. It also increases implementation uncertainty across phases.
Additional central constraints reinforced the same governance mechanism. They were CS1 (Lack of interorganizational trust and transparency; Mdn_T2 = 6.0, IQR_T2 = 1.00, TopBox_T2 = 90.9%), RC1 (Limited use of collaborative, risk-sharing contract models; Mdn_T2 = 6, IQR_T2 = 1.00, TopBox_T2 = 86.4%), and OR4 (Non-strategic, tool-centered deployment of LC–CE–C5.0 practices and related digital tools; Mdn_T2 = 6, IQR_T2 = 1.00, TopBox_T2 = 77.3%).
Overall, the hierarchy is consistent with an upstream–downstream governance logic. In this logic, procurement clauses, evaluation weights, and contractual enforceability condition later socio-technical uptake. They do so by shaping verification capacity, coordination reliability, and sustainability performance outcomes. However, procurement reform is necessary but not sufficient. It can produce symbolic compliance when verification capacity, data governance, and interorganizational trust do not progress in parallel. This pattern indicates that upstream constraints propagate across phases. They limit digital transparency, destabilize Lean routines, and weaken the executability and measurability of circular loops.
This study contributes in three ways. First, a conceptual LCCE5.0 model was articulated that aligns Lean flow principles, circular loops, and human–digital enablers across five project life-cycle phases. This model provides a coherent structure for joint integration. Second, an operational taxonomy of 40 barriers was developed, organized across six dimensions and five life-cycle phases. Third, a reproducible Delphi-based prioritization was delivered using predefined consensus metrics and explicit stopping rules. This output provides a traceable basis for subsequent empirical validation. Therefore, the results support a theory-to-practice pathway. In this pathway, public clients and regulators institutionalize auditable circular requirements. Project organizations then translate them into stable Lean routines and data-enabled verification.
These conclusions remain bounded by the panel size and composition. They also remain bounded by potential selection bias and Morocco-specific delivery conditions. In addition, Delphi ratings are ordinal. Therefore, the results report perceived importance and consensus rather than causal effectiveness of remedies.
Future research could prioritize empirical validation through pilots embedded in real public tenders. Multi-project comparative case studies can provide complementary evidence. These designs could test whether the top ten barriers predict measurable gaps in cost, schedule, and circular value outcomes. Moreover, model testing should move from Delphi ranking to explanatory pathways. Researchers can estimate direct and indirect effects, for example from procurement barriers to LC–CE–C5.0 adoption, and then to project performance outcomes. Causal modeling can support this step, including PLS-SEM, to assess mediation and boundary conditions. In addition, researchers could develop actionable outputs from the hierarchy. These outputs include tender-ready clauses, evaluation scoring rubrics, and auditable verification protocols. This package could also include a shared indicator dictionary and minimum data-governance rules. It could include a staged maturity pathway tailored to SMEs’ capability-building constraints. Transferability could then be examined by replicating the taxonomy across peer contexts in the Maghreb or Francophone Africa. Researchers could also compare infrastructure and building delivery settings. Finally, policy-oriented work could define a roadmap for CE standards that remain auditable within procurement routines. This step may be necessary because tender enforceability dominated expert judgments.
Taken together, the findings reframe LCCE5.0 adoption as a governance problem with identifiable leverage points. They also provide procurement-focused, practice-oriented suggested directions that remain to be validated in future pilots and empirical studies.

Supplementary Materials

The following supporting information can be downloaded at: https://www.mdpi.com/article/10.3390/recycling11030063/s1, Supplementary File S1 contains the complete Delphi questionnaire (Q1–Q40), including the scale anchors and item wording.

Author Contributions

Conceptualization, A.E.H., A.E.-n. and M.R.; Methodology, A.E.H., A.E.-n. and M.R.; Software, A.E.H. and M.R.; Validation, A.E.H. and M.R.; Formal analysis, A.E.H. and M.R.; Investigation, A.E.H., A.E.-n. and M.R.; Resources, A.E.H., A.E.-n. and M.R.; Data curation, A.E.H., A.E.-n. and M.R.; Writing—original draft preparation, A.E.H. and M.R.; Writing—review and editing, A.E.H., A.E.-n. and M.R.; Visualization, A.E.H., A.E.-n. and M.R.; Supervision, A.E.-n. and M.R.; Project administration, A.E.H., A.E.-n. and M.R. All authors have read and agreed to the published version of the manuscript.

Funding

This research received no external funding.

Institutional Review Board Statement

This study involved a non-interventional Delphi survey with expert participants and did not include medical procedures, biological materials, or health data. Moroccan Law No. 28-13 regulates biomedical research conducted to develop biological or medical knowledge or to meet public health requirements; therefore, this study fell outside the scope of regulated biomedical research under Law No. 28-13 and did not require ethics committee/IRB approval. Personal data were processed in accordance with Morocco’s personal data protection framework (Law No. 09-08). The study was conducted in accordance with the principles of the Declaration of Helsinki (1975, revised in 2013).

Informed Consent Statement

Informed consent for participation was obtained from all subjects involved in the study.

Data Availability Statement

The data supporting the findings of this study are available from the corresponding author upon reasonable request. No code or proprietary software was developed for this review.

Acknowledgments

The authors would like to thank the members of the Delphi expert panel for their time, insights, and constructive feedback throughout the two-round process. The authors also acknowledge the administrative and logistical support that facilitated expert recruitment and data collection. The authors further express their gratitude to the leadership of Université Sidi Mohamed Ben Abdellah (USMBA) and the Faculty of Sciences and Techniques (FST), USMBA, for their institutional support and encouragement. The authors also thank the Laboratory of Industrial Techniques (LTI) for supporting the research environment in which this study was conducted. Finally, the authors acknowledge all individuals who contributed, directly or indirectly, to the successful completion of this study.

Conflicts of Interest

The authors declare no conflicts of interest.

Abbreviations

The following abbreviations are used in this manuscript:
10RRefuse, Rethink, Reduce, Reuse, Repair, Refurbish, Remanufacture, Repurpose, Recycle, Recover
3RReduce, Reuse, Recycle
4D4-Dimensional (time-linked) BIM/planning
5D5-Dimensional (cost-linked) BIM
6RRefuse, Reduce, Reuse, Repair, Recycle, Recover
A3A3 problem-solving report (Lean)
AIArtificial Intelligence
APIApplication Programming Interface
BIMBuilding Information Modeling
C4.0Construction 4.0
C5.0Construction 5.0
CAFMComputer-Aided Facility Management
CBFCritical Barrier Factor(s)
CDECommon Data Environment
CDWConstruction and Demolition Waste
CECircular Economy
CMMSComputerized Maintenance Management System
COBieConstruction-Operations Building information exchange
CVIContent Validity Index
DBDesign–Build
DBBDesign–Bid–Build
DfDDesign for Disassembly
DfMADesign for Manufacture and Assembly
DTsdigital twins
EIRsExchange Information Requirements
EPCEnergy Performance Contract
EPDEnvironmental Product Declaration
ESGEnvironmental, Social, and Governance
GWPGlobal Warming Potential
HCPSsHuman–Cyber–Physical Systems
HRCHuman–Robot Collaboration
I-CVIitem-level Content Validity Index
IBMInternational Business Machines (brand; used for SPSS)
IDSInformation Delivery Specification (buildingSMART)
IEQIndoor Environmental Quality
IFCsIndustry Foundation Classes
IFC4Industry Foundation Classes (Version 4)
IoTInternet of Things
IPDIntegrated Project Delivery
IPMVPInternational Performance Measurement and Verification Protocol
IQRInterquartile range
ISO 19650ISO 19650 series for information management using BIM
JITJust-in-Time
KPIKey Performance Indicator
LCLean Construction
LCALife Cycle Assessment
LCCE5.0Lean Construction, Circular Economy, and Construction 5.0
LPDSLean Project Delivery System
LPSLast Planner System
MCIMaterial Circularity Indicator
MENAMiddle East and North Africa
MLMachine Learning
ObeyaObeya room (visual management room)
OpenBIMOpen Building Information Modeling (open interoperability standard)
PDCAPlan–Do–Check–Act
PMOProject Management Office
PPCPercent Plan Complete
QAQuality Assurance
QCQuality Control
RACIResponsible–Accountable–Consulted–Informed
RFIDRadio Frequency Identification
RQ1Research Question 1
RQ2Research Question 2
RTLSsReal-Time Location Systems
S-CVI/Avescale-level Content Validity Index (average approach)
S-CVI/UAscale-level Content Validity Index (universal agreement)
SMEsSmall and Medium-sized Enterprises
SPSSStatistical Package for the Social Sciences
T1Delphi Round 1
T2Delphi Round 2
TaktTakt time/Takt planning
TFVTransformation–Flow–Value
TVDTarget Value Design
VDCVirtual Design and Construction
VRVirtual Reality
VSMValue Stream Mapping
WIPWork In Progress (CDE information state)
XRExtended Reality

Appendix A

Table A1. LCCE5.0 framework by life-cycle macro-phase, mapping lean and circular tool families, C5.0 capabilities, indicator families, and deliverables, consistent with the hypothesized chain moving from transparency and traceability to lean routine reliability and circular loop executability.
Technologies 5.0 (Tools/Levers)CE (Tools/Levers)LC (Tools/Levers)KPIs (Examples)
Design/engineeringCore• BIM–LCA integration
• Passports (DPP) requirements at design
• BIM 3D authoring and coordination (model-based design coordination, issue tracking, clash management baseline)
• Model information requirements and LOIN compliance checks (data readiness for downstream indicators)
• Circular DfX (10R) and circular design guidelines
• Design for disassembly/deconstruction (DfD) and adaptability
• DfMA modular design and early DfMA integration
• LCA- and EPD-informed material selection
• Early CE simulations in BIM and circularity indices
• Design-to-procurement circular requirements (specifications and BoQ-ready criteria)
• LPS for design and pull information flow
• Target Value Design (TVD) and set-based design
• Design VSM and A3 problem solving
• Design standard work, poka-yoke design, and integrated quality management
• Visual management and BIM coordination
• Design Kaizen (continuous improvement cycles)
• PPC_design (% design tasks on time) ↑
• Design change rework hours ↓
• Clash rate (number of hard clashes/100 m2 GFA) ↓
• GWP_design (kg CO2-eq/m2 GFA) ↓
• Reused content share (% mass of materials with verified recycled/reused content) ↑
• Design-for-reuse potential (% mass of components specified as reusable/repairable/demountable) ↑
• Passport coverage (% mass with MP/DPP) ↑
• BIM model completeness/LOIN compliance (%) ↑
• Design cycle time (days per work package) ↓

Measurement basis & source: per m2 GFA and per work package; extracted from CDE/BIM logs (LOIN), clash reports, LCA outputs, and MP/DPP registry.
Advanced• BIM 4D/5D
• Material Passports (MP)/Digital Product Passports (DPP) requirements at design
• Digital Twins
• AI/ML
• Material stock data/urban mining and reuse component libraries• Takt design (when taktable design packages exist)
Contextual• XR (AR/VR)
• Scan-to-BIM (renovation/legacy assets)
• BIM–GIS (territorial/infrastructure scope)
• CE-oriented stakeholder collaboration (marketplace/readiness dependent)• Collaborative governance (IPD/Big Room)
Procurement/supply chainCore• Interoperable Common Data Environment (CDE) aligned with ISO 19650 (information governance, access control, audit logs)
• EIR/AIR and BIM Execution Plan (BEP) specifying circular data fields and evidence formats
• Circular procurement clauses (10R-aligned) with enforceable verification responsibilities
• Weighted award model with explicit circular and environmental criteria and mandatory evidence bundles
• EPD- and LCA-based requirements (recycled content, GWP thresholds, toxicity constraints) for key materials
• Verified reuse/recycling channels and diversion route documentation
• Lean supply planning (pull-based replenishment and buffer strategy linked to LPS lookahead)
• Supplier collaboration routines (visual management, A3, problem-solving at interfaces)
• Standard work for submittals, RFIs, approvals, and evidence verification gates
• Share of tenders using CE clause library (%) ↑
• Circular criteria weight in award model (%) ↑
• Evidence completeness rate (% bids with valid MP/DPP IDs, EPD links, diversion routes) ↑
• Procurement cycle time (days per lot) ↓
• On-time deliveries (% deliveries on promised date) ↑
• Supplier compliance rate at post-award audit (%) ↑
• Share of traced materials at receipt (% lots with QR/RFID/MP linkage) ↑
• Bid dispute frequency on CE clauses (#/tenders) ↓
• Purchased material carbon intensity (kg CO2-eq/kg purchased material) ↓
• Project-level embodied carbon of purchased materials (kg CO2-eq/m2 GFA) ↓

Measurement basis & source: per lot and per supplier; extracted from e-tendering records, CDE audit logs (ISO 19650), EPD/LCA files, MP/DPP registry, and post-award audit reports.
Advanced• Material Passports (MP)/DPP IDs required in bids for priority components and materials
• Supplier digital onboarding and API-based data exchange (ERP–CDE integration)
• IoT/QR/RFID tagging plans for inbound materials and logistics traceability
• Permissioned distributed ledger (DLT) for tamper-resistant audit trails where legally supported
• Circular supplier scorecards and dynamic compliance dashboards• Heijunka leveling to smooth supply variability and stabilize handoffs
• Takt-aligned logistics and delivery slot management (when takt is deployed on site)
Contextual• Digital procurement workflows (e-tendering) with structured data capture for CE/LC requirements
• BIM–GIS logistics planning for regional sourcing and reverse logistics corridors
• Take-back/EPR-ready clauses and reverse logistics routing requirements
• Secondary material marketplaces and product-as-a-service contracts (market maturity dependent)
• Collaborative governance (IPD/Big Room) to align incentives and responsibilities across actors
Construction (Execution)Core• On-site connectivity and data capture (Wi-Fi/LTE/5G) enabling real-time reporting to the CDE
• Field BIM/VDC coordination and issue management linked to CDE (RFI/submittals/QA records)
• Digital inspections and QA/QC workflows with geo/time-stamped evidence and audit logs
• Material receipt verification for priority components linked to MP/DPP IDs (QR/RFID) and chain-of-custody records
• On-site segregation and controlled storage for reusable/recyclable streams with documented diversion routes
• Traceable installation records for priority components (component ID ↔ location ↔ MP/DPP)
• Waste tracking with standardized codes and mass-balance reporting (reused/recycled/landfilled)
• Last Planner System (LPS) with lookahead planning and constraint removal
• Standard work, 5S, and visual management (boards, Andon) for stable execution
• Daily huddles and A3/PDCA problem solving for rapid learning cycles
• Pull-based material flow and kitting aligned with work packages
• PPC_site (% weekly commitments completed) ↑
• Rework rate (% or hours per work package) ↓
• Cycle time per work package (days) ↓
• Takt adherence (% zones on time) ↑ (where takt is used)
• RFI turnaround time (days) ↓
• QA/QC first-pass yield (%) ↑
• Waste diversion rate (% reused + recycled) ↑
• Contamination rate of sorted streams (%) ↓
• Share of installed components linked to MP/DPP (% by mass or count) ↑
• Site carbon intensity (kg CO2-eq/day or /m2 GFA) ↓

Measurement basis & source: per work package, per zone, and per ton of waste; extracted from LPS logs, CDE issue/QA records, weighbridge tickets, and MP/DPP-linked receipt and installation logs.
Advanced• IoT/RTLS for location and status tracking of materials, equipment, and work packages
• Digital twin updates for as-built/as-is synchronization and constraint detection
• Predictive analytics/AI for schedule-risk forecasting and constraint detection
• Reverse logistics scheduling for surplus and off-cuts (return-to-supplier/reuse hubs)• Takt planning and production control (where taktable zones exist)
• Obeya/Big Room routines for cross-trade coordination (project complexity dependent)
• Just-in-time (JIT) packaging reduction and returnable packaging agreements
Contextual• Computer vision/drones for progress validation and safety monitoring (where permissible)
• Robotics/exoskeletons for workforce augmentation in repetitive/high-risk tasks
• Permissioned DLT for tamper-resistant evidence across multiple actors (where legally supported)
• Circular prefabrication/off-site (DfMA) to reduce waste and enable disassembly where applicable
• On-site pre-processing for selected materials (space/equipment dependent)
• Collaborative governance escalation paths (IPD-like behaviors without full IPD contracts)
Operation & Maintenance (O&M)Core• Asset information model (AIM) maintained in CDE (ISO 19650) with validated as-built data
• CMMS/CAFM integration with BIM/AIM for work orders, spare parts, and maintenance history
• Digital commissioning and handover data checks (COBie/IFC deliverables where applicable)
• Preventive maintenance and life-extension strategies for high-impact systems
• Service life planning and renewal strategies at component and system levels
• Repair and refurbishment protocols with documented parts provenance and quality checks
• Decommissioning-ready records for disassembly and take-back (component IDs, access, hazards)
• Standard work for maintenance routines and shutdown planning
• Total Productive Maintenance (TPM) combining autonomous and planned maintenance
• Visual management and daily management system for O&M performance
• PDCA cycles and A3 problem solving for recurring failures and service variability
• Preventive planning (lookahead) for maintenance windows and resource leveling
• Asset data completeness in AIM (% assets with validated as-built + MP/DPP link) ↑
• Mean time between failures (MTBF) ↑
• Mean time to repair (MTTR) ↓
• Planned maintenance ratio (% planned vs. reactive) ↑
• Energy intensity (kWh/m2·year) ↓
• Replacement parts circularity (% of replacement parts spend that is compliant reused/remanufactured) ↑
• Waste diversion from maintenance activities (%) ↑
• Service request lead time (hours/days) ↓

Measurement basis & source: per asset and per m2·year; extracted from CMMS/CAFM logs, AIM/CDE audits, MP/DPP registry, and energy management systems.
Advanced• Material Passports (MP)/DPP continuity for critical assets and replaceable components
• Operational digital twins for condition monitoring and scenario simulation
• Cognitive digital twin for learning-based optimization where data maturity supports it
• IoT sensors for condition-based maintenance and energy monitoring
• Analytics/explainable AI for failure prediction and maintenance prioritization
• Component-level circularity tracking and compliance scoring using MP/DPP-linked service records (parts provenance, interventions, end-of-life routes)
• Closed-loop spares management with certified remanufacturing partners and return logistics (core items, warranty, and acceptance criteria defined)
• Value stream mapping (VSM) for maintenance service flows and response-time reduction
Contextual• XR (AR) for assisted maintenance and remote expert support
• Permissioned DLT for service and component history integrity (where legally supported)
• Spare parts circularity (remanufactured/reused components) where compliant and available
• Product-as-a-service/performance contracting for selected equipment (market maturity dependent)
• Secondary material marketplaces for replacement parts (availability dependent)
• Collaborative governance routines with service providers for shared KPIs and escalation
End-of-life (Renovation/Deconstruction)Core• Deconstruction planning model in BIM with component IDs and access logic (DfD-ready information)
• Digital deconstruction work packs (method statements, sequencing) linked to CDE evidence logs
• Waste and material tracking system with QR/RFID linkage to weights and destinations
• Selective deconstruction protocols targeting high-value reuse streams (10R priority)
• Pre-demolition resource audit (PRA) to quantify recoverable materials and set recovery targets
• Certified salvage and reuse channels with documented transfer and quality checks
• Reverse logistics execution and take-back routing (supplier or hub-based)
• Material grading and testing for reuse eligibility (structural, contamination, compliance)
• Mass-balance reporting and circularity claims supported by verified evidence
• Deconstruction work structuring (work packages) and pull planning for dismantling
• Standard work and visual management for sorting stations and safety controls
• Pull-based logistics for outbound flows (staging, kitting for reuse bundles)
• Daily huddles and A3/PDCA for incident learning and flow stabilization
• Reuse rate (% mass reused) ↑
• Recycling rate (% mass recycled) ↑
• Landfill diversion rate (% diverted) ↑
• Contamination rate of sorted streams (%) ↓
• Traceability completeness (% outgoing mass with MP/DPP + destination proof) ↑
• Recovery yield of target components (% eligible recovered vs. planned) ↑
• Deconstruction cycle time (days per zone) ↓
• Safety incident rate (#/100,000 h) ↓

Measurement basis & source: per ton and per component; extracted from weighbridge tickets, QR/RFID logs, MP/DPP registry, transfer notes, and deconstruction work-pack evidence in the CDE.
Advanced• As-built BIM and scan-to-BIM inventory for salvage assessment and quantity validation
• MP/DPP retrieval and validation for outgoing components (hazards, provenance, performance data)
• Reality capture (scan/photogrammetry) for as-is verification and salvage planning
• Deconstruction digital twin (DT) for sequencing and logistics optimization
• Circularity scenario assessment tool to compare reuse, recycling, and disposal pathways
• Design feedback loop to update libraries and future specifications based on recovery outcomes
• Takt-based deconstruction planning (zones/sequence) and constraint removal
• VSM of deconstruction flow to reduce waiting and double-handling
Contextual• Computer vision for sorting assistance and contamination detection (where permissible)
• Robotics for selective demolition/deconstruction in high-risk environments
• Permissioned DLT for chain-of-custody integrity across multiple actors (where legally supported)
• Urban mining databases and regional reuse marketplaces (availability dependent)• Collaborative governance with regulators and reuse operators for acceptance criteria
Note 1. MP/DPP denote Material Passports/Digital Product Passports that link component IDs to verified attributes and end-of-life information across the asset life cycle. DLT denotes an optional permissioned distributed ledger used only to provide tamper-evident multi-party audit logs when contractually and legally supported (not a prerequisite). Lean terms are used in an AEC-adapted sense: SMED-inspired rapid changeover refers to reducing workface setup and handover time (crew/equipment/material staging), and Jidoka-inspired quality-at-source refers to immediate defect or safety escalation with defined stop-work authority and an agreed resolution workflow. Note 2. Hypothesized interpretation: across phases, C5.0 capabilities primarily increase transparency and traceability (e.g., CDE, IoT/QR/RFID, DT, MP/DPP). This transparency strengthens lean routine reliability (e.g., LPS, Takt, standard work) and makes circular loops executable and auditable (e.g., MCI, reuse rate, EPD-based attributes). Boundary conditions are detailed in Section 2.4. Note 3. Core denotes prerequisites required to operationalize the hypothesized chain on most projects. Advanced denotes higher data and market maturity capabilities. Contextual denotes case-dependent levers.

Appendix B

Table A2. Search keywords and synonyms by concept (LC, CE, and C5.0).
ConceptKeyword/Terms
Lean Construction (LC)“lean construction”; “lean project delivery”; “last planner”; “last planner system”; LPS; “value stream mapping”; VSM; “takt time”; “takt planning”; “takt time planning”; “pull planning”; “pull scheduling”; “standard work”; “standardized work”; 5S; “just-in-time”; JIT; kaizen; “continuous improvement”; “integrated project delivery”; “IPD”
Circular Economy (CE)“circular economy”; circularity; “circular construction”; “circular building”; “circular built environment”; “closing the loop”; “closed-loop”; “cradle to cradle”; “cradle-to-cradle”; “reverse logistics”; “design for disassembly”; “design for deconstruction”; DfD; “design for reuse”; “design for remanufacturing”; “end-of-life”; “end of life”; “3R”; “4R”; “6R”; “9R”; “10R”
Digital/Construction 5.0 (C5.0)“construction 4.0”; “construction 5.0”; “smart construction”; “digital construction”; “ Building Information Modeling “; “building information modelling”; BIM; “digital twin”; “digital twins”; “cyber-physical system*”; CPS; “internet of things”; IoT; “radio frequency identification”; RFID; “augmented reality”; AR; “virtual reality”; VR; “mixed reality”; MR; “extended reality”; XR; robot*; “human–robot collaboration”; “3D printing”; “additive manufacturing”; “3D laser scanning”; LiDAR; “unmanned aerial vehicle*”; UAV*; drone*; “computer vision”; “big data”; “data analytics”; “data mining”; “cloud computing”; “edge computing”; “artificial intelligence”; “machine learning”; “deep learning”; blockchain
Note: In the search string, * denotes a wildcard/truncation symbol used to retrieve multiple variants of the same root term.
Table A3. Inclusion and exclusion criteria.
Inclusion CriteriaExclusion Criteria
Studies on the construction and built environment (buildings and/or civil works)Studies not related to the construction/built environment
Clear contribution to the integration of Lean and Circular Economy and/or to their interaction with digital/Construction 5.0 technologies in constructionStudies addressing only one pillar (Lean only, Circular only, or digital only) without explicit links to the others
Explicit research design (empirical or structured conceptual) described in the paperEditorials, opinion pieces, descriptive texts without identifiable method
Peer-reviewed journal articles, reviews, and conference papers; selected book chapters with a transferable methodTheses, dissertations, reports, white papers, and other non-peer-reviewed documents
Empirical findings and/or conceptual models/frameworks related to Lean–Circular–Digital integration in constructionNo results or mechanisms related to this integration, or only generic sustainability discussions
Full text available for full assessment of methods and resultsFull text not available (only abstract or partial view)
No language restrictions applied

Appendix C

Table A4. Delphi expert panel profile (n = 22): stakeholder roles, sector coverage, experience, and familiarity with LC, CE, and Construction 5.0-related digital technologies.
Expert IDRole in Value Chain *SectorExperience (Years)LCCEC5.0/Technology Providers Decision Level
E01Cli/owInfrastructure14ImplementationImplementationImplementationOperational
E02Cli/owBuilding25LeadLeadLeadTactical
E03Cli/owInfrastructure21LeadLeadLeadTactical
E04Cli/owMixed32LeadLeadLeadTactical
E05Cont.Infrastructure26ImplementationImplementationLeadTactical
E06Cont.Building22LeadLeadLeadTactical
E07Cont.Mixed15LeadImplementationImplementationTactical
E08Cont.Mixed28LeadLeadLeadTactical
E09Cont.Infrastructure16ImplementationImplementationImplementationOperational
E10Eng/cBuilding18ImplementationImplementationImplementationOperational
E11Eng/cInfrastructure30LeadLeadLeadTactical
E12Eng/cInfrastructure18ImplementationImplementationImplementationOperational
E13Eng/cBuilding24LeadLeadLeadTactical
E14Eng/cMixed20LeadImplementationImplementationTactical
E15Pub/rMixed30LeadLeadLeadTactical
E16Pub/rInfrastructure14ImplementationImplementationImplementationOperational
E17Pub/rBuilding24ImplementationImplementationLeadTactical
E18Pub/rInfrastructure22LeadLeadLeadTactical
E19Tech/pMixed7ImplementationImplementationImplementationOperational
E20Tech/pMixed18ImplementationImplementationImplementationOperational
E21Acad/rMixed4ImplementationImplementationImplementationOperational
E22Acad/rMixed12LeadImplementationImplementationOperational
* Client/Owner (Cli/ow); Contractor (Cont.); Engineering consultant (Eng/c); Public authority/Regulator (Pub/r); Technology provider (Tech/p); Academic/Researcher (Acad/r).
Table A5. Delphi expert panel profile (n = 22): stakeholder representation by professional background.
CriterionCategoryNumber of Experts (n = 22)Percentage (%)
Professional
background
Clients/Owners418.2%
Contractors522.7%
Engineering consultants522.7%
Public authorities/Regulators418.2%
Technology providers (BIM, digital solutions)29.1%
Academics/Researchers29.1%
Total 22100
Table A6. Delphi expert panel characteristics (n = 22): sector, experience, LC/CE/C5.0 familiarity, decision level, and context.
CriterionCategoryNumber of Experts (n = 22)Percentage (%)
Sector of activityBuilding construction522.7%
Infrastructure projects836.4%
Mixed (building & infrastructure)940.9%
Professional experience>20 years 1150.0%
11–20 years940.9%
<10 years29.1%
Familiarity with
Lean Construction
Implementation1045.5%
Lead1254.5%
Familiarity with
Circular Economy
Implementation1359.1%
Lead940.9%
Familiarity with Construction 5.0-related digital technologiesImplementation1150.0%
Lead1150.0%
Decision-making roleOperational940.9%
Tactical1359.1%
Geographical contextMorocco (national context)22100%

Appendix D

Table A7. Item-level content validity evidence for the 40 CBFs: I-CVI, Pc, and modified kappa (k*), with scale-level indices (S-CVI/Ave; S-CVI/UA).
CodeI-CVIPck* CodeI-CVIPck*
CS10.8750.0312500.871OR30.8750.0312500.871
CS21.0000.0039061.000OR40.8750.0312500.871
CS31.0000.0039061.000OR51.0000.0039061.000
CS41.0000.0039061.000OR60.8750.0312500.871
CS50.8750.0312500.871RC11.0000.0039061.000
CS61.0000.0039061.000RC21.0000.0039061.000
CS71.0000.0039061.000RC30.8750.0312500.871
CS81.0000.0039061.000RC40.8750.0312500.871
CS91.0000.0039061.000RC51.0000.0039061.000
EC11.0000.0039061.000RC60.8750.0312500.871
EC21.0000.0039061.000RC71.0000.0039061.000
EC31.0000.0039061.000RC80.8750.0312500.871
EC40.8750.0312500.871TD11.0000.0039061.000
EC51.0000.0039061.000TD21.0000.0039061.000
EC61.0000.0039061.000TD30.8750.0312500.871
EN11.0000.0039061.000TD40.8750.0312500.871
EN20.8750.0312500.871TD51.0000.0039061.000
EN31.0000.0039061.000TD61.0000.0039061.000
OR10.8750.0312500.871TD71.0000.0039061.000
OR20.8750.0312500.871TD81.0000.0039061.000
S-CVI/Ave = 0.953
S-CVI/UA = 0.625

References

  1. Swarnakar, V.; Khalfan, M. Circular Economy in Construction and Demolition Waste Management: An In-Depth Review and Future Perspectives in the Construction Sector. Smart Sustain. Built Environ. 2024; ahead-of-print. [CrossRef] [Scilit]
  2. United Nations Environment Programme (UNEP); Global Alliance for Buildings and Construction (GlobalABC). Global Status Report for Buildings and Construction 2024/2025: Not Just Another Brick in the Wall—The Solutions Exist: Scaling Them Will Build on Progress and Cut Emissions Fast; UNEP: Nairobi, Kenya, 2025; Available online: https://www.unep.org/resources/report/global-status-report-buildings-and-construction-20242025 (accessed on 7 November 2025).
  3. Ginga, C.P.; Ongpeng, J.M.C.; Daly, M.K.M. Circular Economy on Construction and Demolition Waste: A Literature Review on Material Recovery and Production. Materials 2020, 13, 2970. [Google Scholar] [CrossRef] [Scilit]
  4. Guerra, B.C.; Leite, F. Circular Economy in the Construction Industry: An Overview of United States Stakeholders’ Awareness, Major Challenges, and Enablers. Resour. Conserv. Recycl. 2021, 170, 105617. [Google Scholar] [CrossRef] [Scilit]
  5. Javed, M.H.; Ahmad, A.; Rehan, M.; Farooq, M.; Farhan, M.; Raza, M.A.; Nizami, A.-S. Advancing Circular Economy Through Optimized Construction and Demolition Waste Management Under Life Cycle Approach. Sustainability 2025, 17, 4882. [Google Scholar] [CrossRef] [Scilit]
  6. Shahid, M.U.; Ali, M. Enablers and Policy Framework for Construction Waste Minimization Under Circular Economy: Stakeholder Perspectives. Sustainability 2025, 17, 4129. [Google Scholar] [CrossRef] [Scilit]
  7. Haut-Commissariat au Plan (HCP). Bâtiments & Constructions. Available online: https://www.hcp.ma/Batiments-constructions_r403.html (accessed on 7 November 2025).
  8. Royaume du Maroc. Stratégie Nationale de Réduction et de Valorisation des Déchets (SNRVD): Rapport de Synthèse. 2019. Available online: https://www.logipro.ma/images/Traitement_des_deee/Rapport_de_synthese_SNRVD_FR.pdf (accessed on 7 November 2025).
  9. Partnership for Action on Green Economy (PAGE). La Transition du Maroc vers une Économie Verte: État des Lieux et Inventaire; UNDP Morocco: Rabat, Morocco, 2022; Available online: https://www.undp.org/fr/morocco/publications/la-transition-du-maroc-vers-une-economie-verte-etat-des-lieux-et-inventaire (accessed on 7 November 2025).
  10. Koskela, L. An Exploration towards a Production Theory and Its Application to Construction. Ph.D. Thesis, VTT Publications 408. VTT Technical Research Centre of Finland, Espoo, Finland, 2000. Available online: https://publications.vtt.fi/pdf/publications/2000/P408.pdf (accessed on 7 November 2025).
  11. Howell, G.; Ballard, G. Lean Production Theory: Moving beyond “Can-Do”. In Proceedings of the 2nd Annual Conference of the International Group for Lean Construction (IGLC-2), Santiago, Chile, 28–30 September 1994; pp. 17–24. [Google Scholar]
  12. Pittri, H.; Godawatte, G.A.G.R.; Esangbedo, O.P.; Antwi-Afari, P.; Bao, Z. Exploring Barriers to the Adoption of Digital Technologies for Circular Economy Practices in the Construction Industry in Developing Countries: A Case of Ghana. Buildings 2025, 15, 1090. [Google Scholar] [CrossRef] [Scilit]
  13. Ellen MacArthur Foundation. Towards the Circular Economy, Vol. 1: An Economic and Business Rationale for an Accelerated Transition; Ellen MacArthur Foundation: Cowes, UK, 2013; Available online: https://www.ellenmacarthurfoundation.org/towards-the-circular-economy-vol-1-an-economic-and-business-rationale-for-an (accessed on 7 November 2025).
  14. O’Grady, T.; Minunno, R.; Chong, H.-Y.; Morrison, G.M. Design for Disassembly, Deconstruction and Resilience: A Circular Economy Index for the Built Environment. Resour. Conserv. Recycl. 2021, 175, 105847. [Google Scholar] [CrossRef] [Scilit]
  15. Pomponi, F.; Moncaster, A. Circular Economy for the Built Environment: A Research Framework. J. Clean. Prod. 2017, 143, 710–718. [Google Scholar] [CrossRef] [Scilit]
  16. Benachio, G.L.F.; Freitas, M.D.C.D.; Tavares, S.F. Circular Economy in the Construction Industry: A Systematic Literature Review. J. Clean. Prod. 2020, 260, 121046. [Google Scholar] [CrossRef] [Scilit]
  17. Chen, X.; Liu, F.; Ghaffarianhoseini, A.; GhaffarianHoseini, A.; Guo, B. From Construction 4.0 to Construction 5.0: Principles and Enabling Technologies. In Proceedings of the International Conference on Smart and Sustainable Built Environment (SASBE 2024); GhaffarianHoseini, A., Ghaffarianhoseini, A., Rahimian, F., Babu Purushothaman, M., Eds.; Lecture Notes in Civil Engineering; Springer Nature: Singapore, 2025; Volume 591, pp. 915–927. [Google Scholar]
  18. Garcés, G. Human-Robot Synergy in Building Construction: Advances, Challenges, and Future Horizons for Construction 5.0. Discov. Civ. Eng. 2025, 2, 135. [Google Scholar] [CrossRef] [Scilit]
  19. Pal, U.K.; Zhang, C.; Haupt, T.C.; Li, H.; Su, L. The Evolution of Construction 5.0: Challenges and Opportunities for the Construction Industry. Buildings 2024, 14, 4010. [Google Scholar] [CrossRef] [Scilit]
  20. Yitmen, I.; Almusaed, A.; Alizadehsalehi, S. Investigating the Causal Relationships among Enablers of the Construction 5.0 Paradigm: Integration of Operator 5.0 and Society 5.0 with Human-Centricity, Sustainability, and Resilience. Sustainability 2023, 15, 9105. [Google Scholar] [CrossRef] [Scilit]
  21. Rejeb, A.; Appolloni, A.; Rejeb, K.; Treiblmaier, H.; Iranmanesh, M.; Keogh, J.G. The Role of Blockchain Technology in the Transition toward the Circular Economy: Findings from a Systematic Literature Review. Resour. Conserv. Recycl. Adv. 2023, 17, 200126. [Google Scholar] [CrossRef] [Scilit]
  22. Forcael, E. Lean Construction 4.0 and Society 5.0, How Close Are They? In Proceedings of the 32nd Annual Conference of the International Group for Lean Construction (IGLC 32), Auckland, New Zealand, 1–7 July 2024; Costa, D.B., Drevland, F., Florez-Perez, L., Eds.; International Group for Lean Construction: Berkeley, CA, USA, 2024; pp. 1280–1292. [Google Scholar] [CrossRef] [Scilit]
  23. Hines, P.; Magnani, F.; Mula, J.; Sanchis, R. Toward Lean Industry 5.0: A Human-Centered Model for Integrating Lean and Industry 4.0 in an Automotive Supplier. Int. J. Prod. Res. 2026, 64, 250–273. [Google Scholar] [CrossRef] [Scilit]
  24. ISO 19650-1:2018; Organization and Digitization of Information about Buildings and Civil Engineering Works, Including Building Information Modelling (BIM)—Information Management Using Building Information Modelling—Part 1: Concepts and Principles. International Organization for Standardization: Geneva, Switzerland, 2018.
  25. Abanda, F.H.; Balu, B.; Adukpo, S.E.; Akintola, A. Decoding ISO 19650 Through Process Modelling for Information Management and Stakeholder Communication in BIM. Buildings 2025, 15, 431. [Google Scholar] [CrossRef] [Scilit]
  26. Benachio, G.L.F.; Freitas, M.D.C.D.; Tavares, S.F. Interactions between Lean Construction Principles and Circular Economy Practices for the Construction Industry. J. Constr. Eng. Manag. 2021, 147, 04021068. [Google Scholar] [CrossRef] [Scilit]
  27. El Hafiane, A.; En-nadi, A.; Ramadany, M. Towards Sustainable Construction: Systematic Review of Lean and Circular Economy Integration. Sustainability 2025, 17, 6735. [Google Scholar] [CrossRef] [Scilit]
  28. Boukherroub, T.; Nganmi Tchakoutio, A.; Drapeau, N. Using Lean in Deconstruction Projects for Maximising the Reuse of Materials: A Canadian Case Study. Sustainability 2024, 16, 1816. [Google Scholar] [CrossRef] [Scilit]
  29. Marzouk, M.; Elmaraghy, A.; Voordijk, H. Lean Deconstruction Approach for Buildings Demolition Processes Using BIM. Lean Constr. J. 2019, 2019, 147–173. [Google Scholar]
  30. Diamond, I.R.; Grant, R.C.; Feldman, B.M.; Pencharz, P.B.; Ling, S.C.; Moore, A.M.; Wales, P.W. Defining Consensus: A Systematic Review Recommends Methodologic Criteria for Reporting of Delphi Studies. J. Clin. Epidemiol. 2014, 67, 401–409. [Google Scholar] [CrossRef] [Scilit]
  31. Hsu, C.-C.; Sandford, B.A. The Delphi Technique: Making Sense of Consensus. Pract. Assess. Res. Eval. 2007, 12, 10. [Google Scholar] [CrossRef]
  32. Koskela, L. The Continuous Evolution of Lean Construction—What Next? In Proceedings of the International Conference on Civil Infrastructure and Construction (CIC), Doha, Qatar, 5–8 February 2023; p. 17. [Google Scholar] [CrossRef] [Scilit]
  33. McHugh, K.; Dave, B.; Koskela, L. On the Role of Lean in Digital Construction. In Industry 4.0 for the Built Environment; Bolpagni, M., Gavina, R., Ribeiro, D., Eds.; Structural Integrity; Springer International Publishing: Cham, Switzerland, 2022; Volume 20, pp. 207–226. [Google Scholar] [CrossRef] [Scilit]
  34. Jørgensen, B.; Emmitt, S. Lost in Transition: The Transfer of Lean Manufacturing to Construction. Eng. Constr. Archit. Manag. 2008, 15, 383–398. [Google Scholar] [CrossRef] [Scilit]
  35. Simonsen, E.; Herrera, R.; Atencio, E. Benefits and Difficulties of the Implementation of Lean Construction in the Public Sector: A Systematic Review. Sustainability 2023, 15, 6161. [Google Scholar] [CrossRef] [Scilit]
  36. Ballard, G.; Howell, G. Shielding Production: Essential Step in Production Control. J. Constr. Eng. Manag. 1998, 124, 11–17. [Google Scholar] [CrossRef] [Scilit]
  37. Morato, M.L.S.; Ferreira, K.A. Value Stream Mapping Application for Construction Industry Loss and Waste Reduction: A Systematic Literature Review. Int. J. Lean Six Sigma 2024, 15, 817–837. [Google Scholar] [CrossRef] [Scilit]
  38. Sacks, R.; Treckmann, M.; Rozenfeld, O. Visualization of Work Flow to Support Lean Construction. J. Constr. Eng. Manag. 2009, 135, 1307–1315. [Google Scholar] [CrossRef] [Scilit]
  39. Ahmed, S.; Sobuz, M.H.R. Challenges of Implementing Lean Construction in the Construction Industry in Bangladesh. Smart Sustain. Built Environ. 2020, 9, 174–207. [Google Scholar] [CrossRef] [Scilit]
  40. Bajjou, M.S.; Chafi, A. Lean Construction Implementation in the Moroccan Construction Industry: Aware-ness, Benefits and Barriers. J. Eng. Des. Technol. 2018, 16, 533–556. [Google Scholar] [CrossRef] [Scilit]
  41. Feldmann, F.G. Towards Lean Automation in Construction—Exploring Barriers to Implementing Automation in Prefabrication. Sustainability 2022, 14, 12944. [Google Scholar] [CrossRef] [Scilit]
  42. Moradi, S.; Sormunen, P. Lean and Sustainable Project Delivery in Building Construction: Development of a Conceptual Framework. Buildings 2022, 12, 1757. [Google Scholar] [CrossRef] [Scilit]
  43. Likita, A.J.; Jelodar, M.B.; Vishnupriya, V.; Rotimi, J.O.B.; Vilasini, N. Lean and BIM Implementation Barriers in New Zealand Construction Practice. Buildings 2022, 12, 1645. [Google Scholar] [CrossRef] [Scilit]
  44. Moradi, S.; Sormunen, P. Implementing Lean Construction: A Literature Study of Barriers, Enablers, and Implications. Buildings 2023, 13, 556. [Google Scholar] [CrossRef] [Scilit]
  45. Romo, R.; Alejo-Reyes, A.; Orozco, F. Statistical Analysis of Lean Construction Barriers to Optimize Its Implementation Using PLS-SEM and PCA. Buildings 2024, 14, 486. [Google Scholar] [CrossRef] [Scilit]
  46. Albalkhy, W.; Sweis, R. Barriers to Adopting Lean Construction in the Construction Industry: A Literature Review. Int. J. Lean Six Sigma 2021, 12, 210–236. [Google Scholar] [CrossRef] [Scilit]
  47. Shaqour, E.N.; Azzam, M.S.; Almashhour, R.T.N. Statistical Investigation of Hindrances of Applying Lean in Egyptian Constructions. Ain Shams Eng. J. 2025, 16, 103349. [Google Scholar] [CrossRef] [Scilit]
  48. Demirkesen, S.; Bayhan, H.G. A Lean Implementation Success Model for the Construction Industry. EMJ Eng. Manag. J. 2020, 32, 219–239. [Google Scholar] [CrossRef] [Scilit]
  49. Hyarat, E.; Montalbán-Domingo, L.; Pellicer, E. Lean Construction Barriers in Jordan’s Building Sub-Sector: A Comprehensive Knowledge Framework. Ain Shams Eng. J. 2024, 15, 102703. [Google Scholar] [CrossRef] [Scilit]
  50. Geissdoerfer, M.; Savaget, P.; Bocken, N.M.P.; Hultink, E.J. The Circular Economy–A New Sustainability Paradigm? J. Clean. Prod. 2017, 143, 757–768. [Google Scholar] [CrossRef] [Scilit]
  51. Kirchherr, J.; Reike, D.; Hekkert, M. Conceptualizing the Circular Economy: An Analysis of 114 Definitions. Resour. Conserv. Recycl. 2017, 127, 221–232. [Google Scholar] [CrossRef] [Scilit]
  52. Munaro, M.R.; Tavares, S.F.; Bragança, L. Towards Circular and More Sustainable Buildings: A Systematic Literature Review on the Circular Economy in the Built Environment. J. Clean. Prod. 2020, 260, 121134. [Google Scholar] [CrossRef] [Scilit]
  53. Osobajo, O.A.; Oke, A.; Omotayo, T.; Obi, L.I. A Systematic Review of Circular Economy Research in the Construction Industry. Smart Sustain. Built Environ. 2022, 11, 39–64. [Google Scholar] [CrossRef] [Scilit]
  54. Ottenhaus, L.-M.; Yan, Z.; Brandner, R.; Leardini, P.; Fink, G.; Jockwer, R. Design for Adaptability, Disassembly and Reuse—A Review of Reversible Timber Connection Systems. Constr. Build. Mater. 2023, 400, 132823. [Google Scholar] [CrossRef] [Scilit]
  55. Hernández, H. Circular Industrialized Construction: A Perspective Through Design for Manufacturing, Assembly, and Disassembly. Buildings 2025, 15, 2174. [Google Scholar] [CrossRef] [Scilit]
  56. Chen, Q.; Feng, H.; Garcia de Soto, B. Revamping Construction Supply Chain Processes with Circular Economy Strategies: A Systematic Literature Review. J. Clean. Prod. 2022, 335, 130240. [Google Scholar] [CrossRef] [Scilit]
  57. Minunno, R.; O’Grady, T.; Morrison, G.M.; Gruner, R.L.; Colling, M. Strategies for Applying the Circular Economy to Prefabricated Buildings. Buildings 2018, 8, 125. [Google Scholar] [CrossRef] [Scilit]
  58. Dev, N.K.; Shankar, R.; Qaiser, F.H. Industry 4.0 and Circular Economy: Operational Excellence for Sustainable Reverse Supply Chain Performance. Resour. Conserv. Recycl. 2020, 153, 104583. [Google Scholar] [CrossRef] [Scilit]
  59. Tennakoon, G.; Rameezdeen, R.; Chileshe, N. Diverting Demolition Waste toward Secondary Markets through Integrated Reverse Logistics Supply Chains: A Systematic Literature Review. Waste Manag. Res. 2022, 40, 274–293. [Google Scholar] [CrossRef] [Scilit]
  60. Wijewickrama, M.; Chileshe, N.; Rameezdeen, R.; Ochoa, J.J. Quality Assurance in Reverse Logistics Supply Chain of Demolition Waste: A Systematic Literature Review. Waste Manag. Res. 2021, 39, 3–24. [Google Scholar] [CrossRef] [Scilit]
  61. Bressanelli, G.; Adrodegari, F.; Pigosso, D.C.A.; Parida, V. Towards the Smart Circular Economy Paradigm: A Definition, Conceptualization, and Research Agenda. Sustainability 2022, 14, 4960. [Google Scholar] [CrossRef] [Scilit]
  62. Papamichael, I.; Voukkali, I.; Loizia, P.; Zorpas, A.A. Construction and Demolition Waste Framework of Circular Economy: A Mini Review. Waste Manag. Res. 2023, 41, 1728–1740. [Google Scholar] [CrossRef] [Scilit]
  63. Kanters, J. Circular Building Design: An Analysis of Barriers and Drivers for a Circular Building Sector. Buildings 2020, 10, 77. [Google Scholar] [CrossRef] [Scilit]
  64. Mahpour, A. Prioritizing Barriers to Adopt Circular Economy in Construction and Demolition Waste Management. Resour. Conserv. Recycl. 2018, 134, 216–227. [Google Scholar] [CrossRef] [Scilit]
  65. Idir, R.; Djerbi, A.; Tazi, N. Optimising the Circular Economy for Construction and Demolition Waste Management in Europe: Best Practices, Innovations and Regulatory Avenues. Sustainability 2025, 17, 3586. [Google Scholar] [CrossRef] [Scilit]
  66. AlJaber, A.; Martinez-Vazquez, P.; Baniotopoulos, C. Barriers and Enablers to the Adoption of Circular Economy Concept in the Building Sector: A Systematic Literature Review. Buildings 2023, 13, 2778. [Google Scholar] [CrossRef] [Scilit]
  67. Sajid, Z.W.; Aftab, U.; Ullah, F. Barriers to Adopting Circular Procurement in the Construction Industry: The Way Forward. Sustain. Futures 2024, 8, 100244. [Google Scholar] [CrossRef] [Scilit]
  68. Cruz Rios, F.; Grau, D.; Bilec, M. Barriers and Enablers to Circular Building Design in the US: An Empirical Study. J. Constr. Eng. Manag. 2021, 147, 04021117. [Google Scholar] [CrossRef] [Scilit]
  69. Akinade, O.; Oyedele, L.; Oyedele, A.; Davila Delgado, J.M.; Bilal, M.; Akanbi, L.; Ajayi, A.; Owolabi, H. Design for Deconstruction Using a Circular Economy Approach: Barriers and Strategies for Improvement. Prod. Plan. Control 2020, 31, 829–840. [Google Scholar] [CrossRef] [Scilit]
  70. Rao, P.A.; Rahman, M.M.; Duraman, S.B. Adopting Circular Economy in Construction: A Review. Front. Built Environ. 2025, 11, 1519219. [Google Scholar] [CrossRef] [Scilit]
  71. Giorgi, S.; Lavagna, M.; Wang, K.; Osmani, M.; Liu, G.; Campioli, A. Drivers and Barriers towards Circular Economy in the Building Sector: Stakeholder Interviews and Analysis of Five European Countries Policies and Practices. J. Clean. Prod. 2022, 336, 130395. [Google Scholar] [CrossRef] [Scilit]
  72. Gonçalves, B.d.S.M.; Carvalho, F.L.d.; Fiorini, P.d.C. Circular Economy and Financial Aspects: A Systematic Review of the Literature. Sustainability 2022, 14, 3023. [Google Scholar] [CrossRef] [Scilit]
  73. Adams, K.T.; Osmani, M.; Thorpe, T.; Thornback, J. Circular Economy in Construction: Current Awareness, Challenges and Enablers. Proc. Inst. Civ. Eng. Waste Resour. Manag. 2017, 170, 15–24. [Google Scholar] [CrossRef] [Scilit]
  74. Jayarathna, H.S.N.M.; Perera, B.A.K.S.; Atapattu, D.; Rodrigo, N. Circular Economy and Blockchain-Integrated Road Map to Improve Construction Waste Management. Constr. Innov. 2025, 25, 23–49. [Google Scholar] [CrossRef] [Scilit]
  75. Bilal, M.; Khan, K.I.A.; Thaheem, M.J.; Nasir, A.R. Current State and Barriers to the Circular Economy in the Building Sector: Towards a Mitigation Framework. J. Clean. Prod. 2020, 276, 123250. [Google Scholar] [CrossRef] [Scilit]
  76. Densley Tingley, D.; Cooper, S.; Cullen, J. Understanding and Overcoming the Barriers to Structural Steel Reuse, a UK Perspective. J. Clean. Prod. 2017, 148, 642–652. [Google Scholar] [CrossRef] [Scilit]
  77. Ababio, B.K.; Lu, W. Barriers and Enablers of Circular Economy in Construction: A Multi-System Perspective towards the Development of a Practical Framework. Constr. Manag. Econ. 2023, 41, 3–21. [Google Scholar] [CrossRef] [Scilit]
  78. Charef, R.; Morel, J.-C.; Rakhshan, K. Barriers to Implementing the Circular Economy in the Construction Industry: A Critical Review. Sustainability 2021, 13, 12989. [Google Scholar] [CrossRef] [Scilit]
  79. Hosseini, M.R.; Rameezdeen, R.; Chileshe, N.; Lehmann, S. Reverse Logistics in the Construction Industry. Waste Manag. Res. 2015, 33, 499–514. [Google Scholar] [CrossRef] [Scilit]
  80. Ranta, V.; Aarikka-Stenroos, L.; Ritala, P.; Mäkinen, S.J. Exploring Institutional Drivers and Barriers of the Circular Economy: A Cross-Regional Comparison of China, the US, and Europe. Resour. Conserv. Recycl. 2018, 135, 70–82. [Google Scholar] [CrossRef] [Scilit]
  81. Marinelli, M. From Industry 4.0 to Construction 5.0: Exploring the Path towards Human–Robot Collaboration in Construction. Systems 2023, 11, 152. [Google Scholar] [CrossRef] [Scilit]
  82. Akhavan, M.; Alivirdi, M.; Jamalpour, A.; Kheradranjbar, M.; Mafi, A.; Jamalpour, R.; Ravanshadnia, M. Impact of Industry 5.0 on the Construction Industry (Construction 5.0): Systematic Literature Review and Bibliometric Analysis. Buildings 2025, 15, 1491. [Google Scholar] [CrossRef] [Scilit]
  83. Trstenjak, M.; Benešova, A.; Opetuk, T.; Cajner, H. Human Factors and Ergonomics in Industry 5.0—A Systematic Literature Review. Appl. Sci. 2025, 15, 2123. [Google Scholar] [CrossRef] [Scilit]
  84. Yang, Y.; Chen, C.; Liu, X.; Zhang, Z. Integration of Lean Construction and BIM in Sustainable Built Envi-ronment: A Review and Future Research Directions. Buildings 2025, 15, 2411. [Google Scholar] [CrossRef] [Scilit]
  85. Sacks, R.; Brilakis, I.; Pikas, E.; Xie, H.; Girolami, M. Construction with Digital Twin Information Systems. Data-Centric Eng. 2020, 1, e14. [Google Scholar] [CrossRef] [Scilit]
  86. Mathias, P.M.; Javier, M.S.; Felipe, M.L.R. Virtual Worlds in AECO Operations: Towards a Human-Centric Framework. Autom. Constr. 2025, 180, 106529. [Google Scholar] [CrossRef] [Scilit]
  87. Borkowski, A.S. A Literature Review of BIM Definitions: Narrow and Broad Views. Technologies 2023, 11, 176. [Google Scholar] [CrossRef] [Scilit]
  88. Chowdhury, M.; Hosseini, M.R.; Edwards, D.J.; Martek, I.; Shuchi, S. Comprehensive Analysis of BIM Adoption: From Narrow Focus to Holistic Understanding. Autom. Constr. 2024, 160, 105301. [Google Scholar] [CrossRef] [Scilit]
  89. Liu, W.; Lv, Y.; Wang, Q.; Sun, B.; Han, D. A Systematic Review of the Digital Twin Technology in Buildings, Landscape and Urban Environment from 2018 to 2024. Buildings 2024, 14, 3475. [Google Scholar] [CrossRef] [Scilit]
  90. Deng, M.; Menassa, C.C.; Kamat, V.R. From BIM to Digital Twins: A Systematic Review of the Evolution of Intelligent Building Representations in the AEC-FM Industry. J. Inf. Technol. Constr. (ITcon) 2021, 26, 58–83. [Google Scholar] [CrossRef] [Scilit]
  91. Alhady, A.; Alanany, M.; Khodair, Y.; Salem, S.; El Maghraby, Y. Integrating Building Information Modelling (BIM) and Extended Reality (XR) in the Transportation Infrastructure Industry. Adv. Bridge Eng. 2024, 5, 22. [Google Scholar] [CrossRef] [Scilit]
  92. Alizadehsalehi, S.; Hadavi, A. Synergies of Lean, BIM, and Extended Reality (LBX) for Project Delivery Management. Sustainability 2023, 15, 4969. [Google Scholar] [CrossRef] [Scilit]
  93. Klumbyte, E.; Georgali, P.-Z.; Spudys, P.; Giama, E.; Morkunaite, L.; Pupeikis, D.; Jurelionis, A.; Fokaides, P. Enhancing Whole Building Life Cycle Assessment through Building Information Modelling: Principles and Best Practices. Energy Build. 2023, 296, 113401. [Google Scholar] [CrossRef] [Scilit]
  94. Bolognesi, C.; Bassorizzi, D.; Balin, S.; Manfredi, V. An Overview on LCA Integration in BIM: Tools, Applications, and Future Trends. Digital 2025, 5, 31. [Google Scholar] [CrossRef] [Scilit]
  95. Khan, A.A.; Bello, A.O.; Arqam, M.; Ullah, F. Integrating Building Information Modelling and Artificial Intelligence in Construction Projects: A Review of Challenges and Mitigation Strategies. Technologies 2024, 12, 185. [Google Scholar] [CrossRef] [Scilit]
  96. Ikudayisi, A.E.; Chan, A.P.C.; Darko, A.; Adedeji, Y.M.D. Integrated Practices in the Architecture, Engineering, and Construction Industry: Current Scope and Pathway towards Industry 5.0. J. Build. Eng. 2023, 73, 106788. [Google Scholar] [CrossRef] [Scilit]
  97. Centre for Digital Built Britain (CDBB). The UK BIM Framework. Available online: https://www.cdbb.cam.ac.uk/BIM/uk-bim-framework (accessed on 24 November 2025).
  98. Valero, E.; Adán, A.; Cerrada, C. Evolution of RFID Applications in Construction: A Literature Review. Sensors 2015, 15, 15988–16008. [Google Scholar] [CrossRef] [Scilit]
  99. Mariano-Hernández, D.; Hernández-Callejo, L.; Zorita-Lamadrid, A.; Duque-Pérez, O.; García, F.S. A Review of Strategies for Building Energy Management System: Model Predictive Control, Demand Side Management, Optimization, and Fault Detect & Diagnosis. J. Build. Eng. 2021, 33, 101692. [Google Scholar] [CrossRef] [Scilit]
  100. Honic, M.; Kovacic, I.; Aschenbrenner, P.; Ragossnig, A. Material Passports for the End-of-Life Stage of Buildings: Challenges and Potentials. J. Clean. Prod. 2021, 319, 128702. [Google Scholar] [CrossRef] [Scilit]
  101. Costa, A.R.; Hoolahan, R.; Charef, R. Eight Recommendations to Adopt Materials Passports and Accelerate Material Reuse in Construction: Insights from Academia and Practice. npj Mater. Sustain. 2025, 3, 33. [Google Scholar] [CrossRef] [Scilit]
  102. Charef, R.; Emmitt, S. Uses of Building Information Modelling for Overcoming Barriers to a Circular Economy. J. Clean. Prod. 2021, 285, 124854. [Google Scholar] [CrossRef] [Scilit]
  103. Bajpai, A.; Misra, S.C. Barriers to Implementing Digitalization in the Indian Construction Industry. Int. J. Qual. Reliab. Manag. 2022, 39, 2438–2464. [Google Scholar] [CrossRef] [Scilit]
  104. Shojaei, A.; Ketabi, R.; Razkenari, M.; Hakim, H.; Wang, J. Enabling a Circular Economy in the Built Envi-ronment Sector through Blockchain Technology. J. Clean. Prod. 2021, 294, 126352. [Google Scholar] [CrossRef] [Scilit]
  105. Yitmen, I.; Almusaed, A.; Alizadehsalehi, S. Facilitating Construction 5.0 for Smart, Sustainable and Resilient Buildings: Opportunities and Challenges for Implementation. Smart Sustain. Built Environ. 2024; ahead-of-print. [CrossRef] [Scilit]
  106. Illankoon, C.; Vithanage, S.C. Closing the Loop in the Construction Industry: A Systematic Literature Review on the Development of Circular Economy. J. Build. Eng. 2023, 76, 107362. [Google Scholar] [CrossRef] [Scilit]
  107. Pibal, S.S.; Bittner, R.; Kovacic, I. A BIM-Based Framework for Life Cycle, Cost, and Circularity Data Integration in Environmental Impact Assessment. Sustainability 2025, 17, 2656. [Google Scholar] [CrossRef] [Scilit]
  108. Dewagoda, K.G.; Ng, S.T.; Kumaraswamy, M.M.; Chen, J. Design for Circular Manufacturing and Assembly (DfCMA): Synergising Circularity and Modularity in the Building Construction Industry. Sustainability 2024, 16, 9192. [Google Scholar] [CrossRef] [Scilit]
  109. Tsoka, S.; Tsikaloudaki, K. Design for Circularity, Design for Adaptability, Design for Disassembly. In Circular Economy Design and Management in the Built Environment: A Critical Review of the State of the Art; Bragança, L., Griffiths, P., Askar, R., Salles, A., Ungureanu, V., Tsikaloudaki, K., Bajare, D., Zsembinszki, G., Cvetkovska, M., Eds.; Springer Nature: Cham, Switzerland, 2024; pp. 257–272. [Google Scholar] [CrossRef] [Scilit]
  110. Gómez-Gil, M.; Sesana, M.M.; Salvalai, G.; Espinosa-Fernández, A.; López-Mesa, B. The Digital Building Logbook as a Gateway Linked to Existing National Data Sources: The Cases of Spain and Italy. J. Build. Eng. 2023, 63, 105461. [Google Scholar] [CrossRef] [Scilit]
  111. Al Hattab, M.; Hamzeh, F. Using Social Network Theory and Simulation to Compare Traditional versus BIM-Lean Practice for Design Error Management. Autom. Constr. 2015, 52, 59–69. [Google Scholar] [CrossRef] [Scilit]
  112. EL Mounla, K.; Beladjine, D.; Beddiar, K.; Mazari, B. Lean-BIM Approach for Improving the Performance of a Construction Project in the Design Phase. Buildings 2023, 13, 654. [Google Scholar] [CrossRef] [Scilit]
  113. Likita, A.J.; Jelodar, M.B.; Vishnupriya, V.; Rotimi, J.O.B. A Guideline for BIM and Lean Integrated Construc-tion Practice. Smart Sustain. Built Environ. 2025, 14, 1264–1291. [Google Scholar] [CrossRef] [Scilit]
  114. Alnajjar, O.; Atencio, E.; Turmo, J. A Systematic Review of Lean Construction, BIM and Emerging Technolo-gies Integration: Identifying Key Tools. Buildings 2025, 15, 2884. [Google Scholar] [CrossRef] [Scilit]
  115. Ding, L.; Wang, T.; Chan, P.W. Forward and Reverse Logistics for Circular Economy in Construction: A Systematic Literature Review. J. Clean. Prod. 2023, 388, 135981. [Google Scholar] [CrossRef] [Scilit]
  116. Ballard, G.; Elfving, J. Supplier Development: The Gateway to Supply Chain Management in the Construction Industry. Lean Constr. J. 2020, 1–41. Available online: https://leanconstruction.org/lean-construction-journal/doi-info-2020-1-41/ (accessed on 7 November 2025).
  117. Janné, M.; Fredriksson, A. Construction Logistics Governing Guidelines in Urban Development Projects. Constr. Innov. 2019, 19, 89–109. [Google Scholar] [CrossRef] [Scilit]
  118. Jebbouri, H.; Chafi, A.; Kammouri Alami, S. Additive Manufacturing as an Enabler of Lean Construction: A Systematic Literature Review. Buildings 2026, 16, 880. [Google Scholar] [CrossRef] [Scilit]
  119. Bestul, B.; Gruis, V. Six Business Model Types for Circular Building Component Reuse Actors. Sustainability 2024, 16, 5425. [Google Scholar] [CrossRef] [Scilit]
  120. Ballard, G.; Howell, G.A. Lean Project Management. Build. Res. Inf. 2003, 31, 119–133. [Google Scholar] [CrossRef] [Scilit]
  121. Tommelein, I. Work Density Method for Takt Planning of Construction Processes with Nonrepetitive Work. J. Constr. Eng. Manag. 2022, 148, 04022134. [Google Scholar] [CrossRef] [Scilit]
  122. Cespedes-Cubides, A.S.; Jradi, M. A Review of Building Digital Twins to Improve Energy Efficiency in the Building Operational Stage. Energy Inf. 2024, 7, 11. [Google Scholar] [CrossRef] [Scilit]
  123. Kuzminykh, A.; Granja, J.; Parente, M.; Azenha, M. Promoting Circularity of Construction Materials through Demolition Digitalisation at the Preparation Stage: Information Requirements and openBIM-Based Technological Implementation. Adv. Eng. Inform. 2024, 62, 102755. [Google Scholar] [CrossRef] [Scilit]
  124. Baniya, B. Circularity in Facility Management: Conceptualisation and Potential Areas for Circularity-Oriented Actions. Sustainability 2023, 15, 8460. [Google Scholar] [CrossRef] [Scilit]
  125. Aldairi, J.; Khan, M.K.; Munive-Hernandez, J.E. Knowledge-Based Lean Six Sigma Maintenance System for Sustainable Buildings. Int. J. Lean Six Sigma 2017, 8, 109–130. [Google Scholar] [CrossRef] [Scilit]
  126. Dodampegama, S.; Hou, L.; Asadi, E.; Zhang, G.; Setunge, S. Revolutionizing Construction and Demolition Waste Sorting: Insights from Artificial Intelligence and Robotic Applications. Resour. Conserv. Recycl. 2024, 202, 107375. [Google Scholar] [CrossRef] [Scilit]
  127. de Oliveira, J.; Schreiber, D.; Jahno, V.D. Circular Economy and Buildings as Material Banks in Mitigation of Environmental Impacts from Construction and Demolition Waste. Sustainability 2024, 16, 5022. [Google Scholar] [CrossRef] [Scilit]
  128. Saradara, S.M.; Khalfan, M.M.A.; Jaya, S.V.; Swarnakar, V.; Rauf, A.; El Fadel, M. Advancing Building Construction: A Novel Conceptual Framework Integrating Circularity with Modified Lean Project Delivery Systems. Dev. Built Environ. 2024, 20, 100531. [Google Scholar] [CrossRef] [Scilit]
  129. Najjar, M.; Figueiredo, K.; Palumbo, M.; Haddad, A. Integration of BIM and LCA: Evaluating the Environ-mental Impacts of Building Materials at an Early Stage of Designing a Typical Office Building. J. Build. Eng. 2017, 14, 115–126. [Google Scholar] [CrossRef] [Scilit]
  130. Mankata, L.M.; Antwi-Afari, P.; Frimpong, S.; Ng, S.T. Material Passports in Construction Waste Management: A Systematic Review of Contexts, Stakeholders, Requirements, and Challenges. Buildings 2025, 15, 1825. [Google Scholar] [CrossRef] [Scilit]
  131. Luna, A.; Herrera, R.F.; Castañeda, K.; Atencio, E.; Biotto, C. Benefits and Limitations of Lean Tools in the Building Design Process: A Functional and Comparative Analysis. Appl. Sci. 2025, 15, 5137. [Google Scholar] [CrossRef] [Scilit]
  132. Memon, S.A.; Shehata, W.; Rowlinson, S.; Sunindijo, R.Y. Generative Artificial Intelligence in Architecture, Engineering, Construction, and Operations: A Systematic Review. Buildings 2025, 15, 2270. [Google Scholar] [CrossRef] [Scilit]
  133. Deng, Y.; Gan, V.; Das, M.; Cheng, J.; Anumba, C. Integrating 4D BIM and GIS for Construction Supply Chain Management. J. Constr. Eng. Manag. 2019, 145, 04019015. [Google Scholar] [CrossRef] [Scilit]
  134. Kent, D.C.; Becerik-Gerber, B. Understanding Construction Industry Experience and Attitudes toward Integrated Project Delivery. J. Constr. Eng. Manag. 2010, 136, 815–825. [Google Scholar] [CrossRef] [Scilit]
  135. Mesa, H.A.; Molenaar, K.R.; Alarcón, L.F. Comparative Analysis between Integrated Project Delivery and Lean Project Delivery. Int. J. Proj. Manag. 2019, 37, 395–409. [Google Scholar] [CrossRef] [Scilit]
  136. Eriksson, P. Improving Construction Supply Chain Collaboration and Performance: A Lean Construction Pilot Project. Supply Chain. Manag. Int. J. 2010, 15, 394–403. [Google Scholar] [CrossRef] [Scilit]
  137. Hasson, F.; Keeney, S.; McKenna, H. Research Guidelines for the Delphi Survey Technique. J. Adv. Nurs. 2000, 32, 1008–1015. [Google Scholar] [CrossRef] [Scilit]
  138. Beiderbeck, D.; Frevel, N.; von der Gracht, H.A.; Schmidt, S.L.; Schweitzer, V.M. Preparing, Conducting, and Analyzing Delphi Surveys: Cross-Disciplinary Practices, New Directions, and Advancements. MethodsX 2021, 8, 101401. [Google Scholar] [CrossRef] [Scilit] [PubMed]
  139. von der Gracht, H.A. Consensus Measurement in Delphi Studies: Review and Implications for Future Quality Assurance. Technol. Forecast. Soc. Change 2012, 79, 1525–1536. [Google Scholar] [CrossRef] [Scilit]
  140. Preston, C.C.; Colman, A.M. Optimal Number of Response Categories in Rating Scales: Reliability, Validity, Discriminating Power, and Respondent Preferences. Acta Psychol. 2000, 104, 1–15. [Google Scholar] [CrossRef] [Scilit]
  141. Lynn, M.R. Determination and Quantification of Content Validity. Nurs. Res. 1986, 35, 382–386. [Google Scholar] [CrossRef] [Scilit]
  142. Polit, D.F.; Beck, C.T. The Content Validity Index: Are You Sure You Know What’s Being Reported? Critique and Recommendations. Res. Nurs. Health 2006, 29, 489–497. [Google Scholar] [CrossRef] [Scilit]
  143. Polit, D.F.; Beck, C.T.; Owen, S.V. Is the CVI an Acceptable Indicator of Content Validity? Appraisal and Recommendations. Res. Nurs. Health 2007, 30, 459–467. [Google Scholar] [CrossRef] [Scilit] [PubMed]
  144. Holey, E.A.; Feeley, J.L.; Dixon, J.; Whittaker, V.J. An Exploration of the Use of Simple Statistics to Measure Consensus and Stability in Delphi Studies. BMC Med. Res. Methodol. 2007, 7, 52. [Google Scholar] [CrossRef] [Scilit]
  145. Boulkedid, R.; Abdoul, H.; Loustau, M.; Sibony, O.; Alberti, C. Using and Reporting the Delphi Method for Selecting Healthcare Quality Indicators: A Systematic Review. PLoS ONE 2011, 6, e20476. [Google Scholar] [CrossRef] [Scilit]
  146. Taber, K.S. The Use of Cronbach’s Alpha When Developing and Reporting Research Instruments in Science Education. Res. Sci. Educ. 2018, 48, 1273–1296. [Google Scholar] [CrossRef] [Scilit]
  147. Hayes, A.F.; Coutts, J.J. Use Omega Rather than Cronbach’s Alpha for Estimating Reliability. But…. Commun. Methods Meas. 2020, 14, 1–24. [Google Scholar] [CrossRef] [Scilit]
  148. Xu, L.; Jia, F.; Yan, F.; Chen, L. Circular Procurement: A Systematic Literature Review. J. Clean. Prod. 2022, 365, 132845. [Google Scholar] [CrossRef] [Scilit]
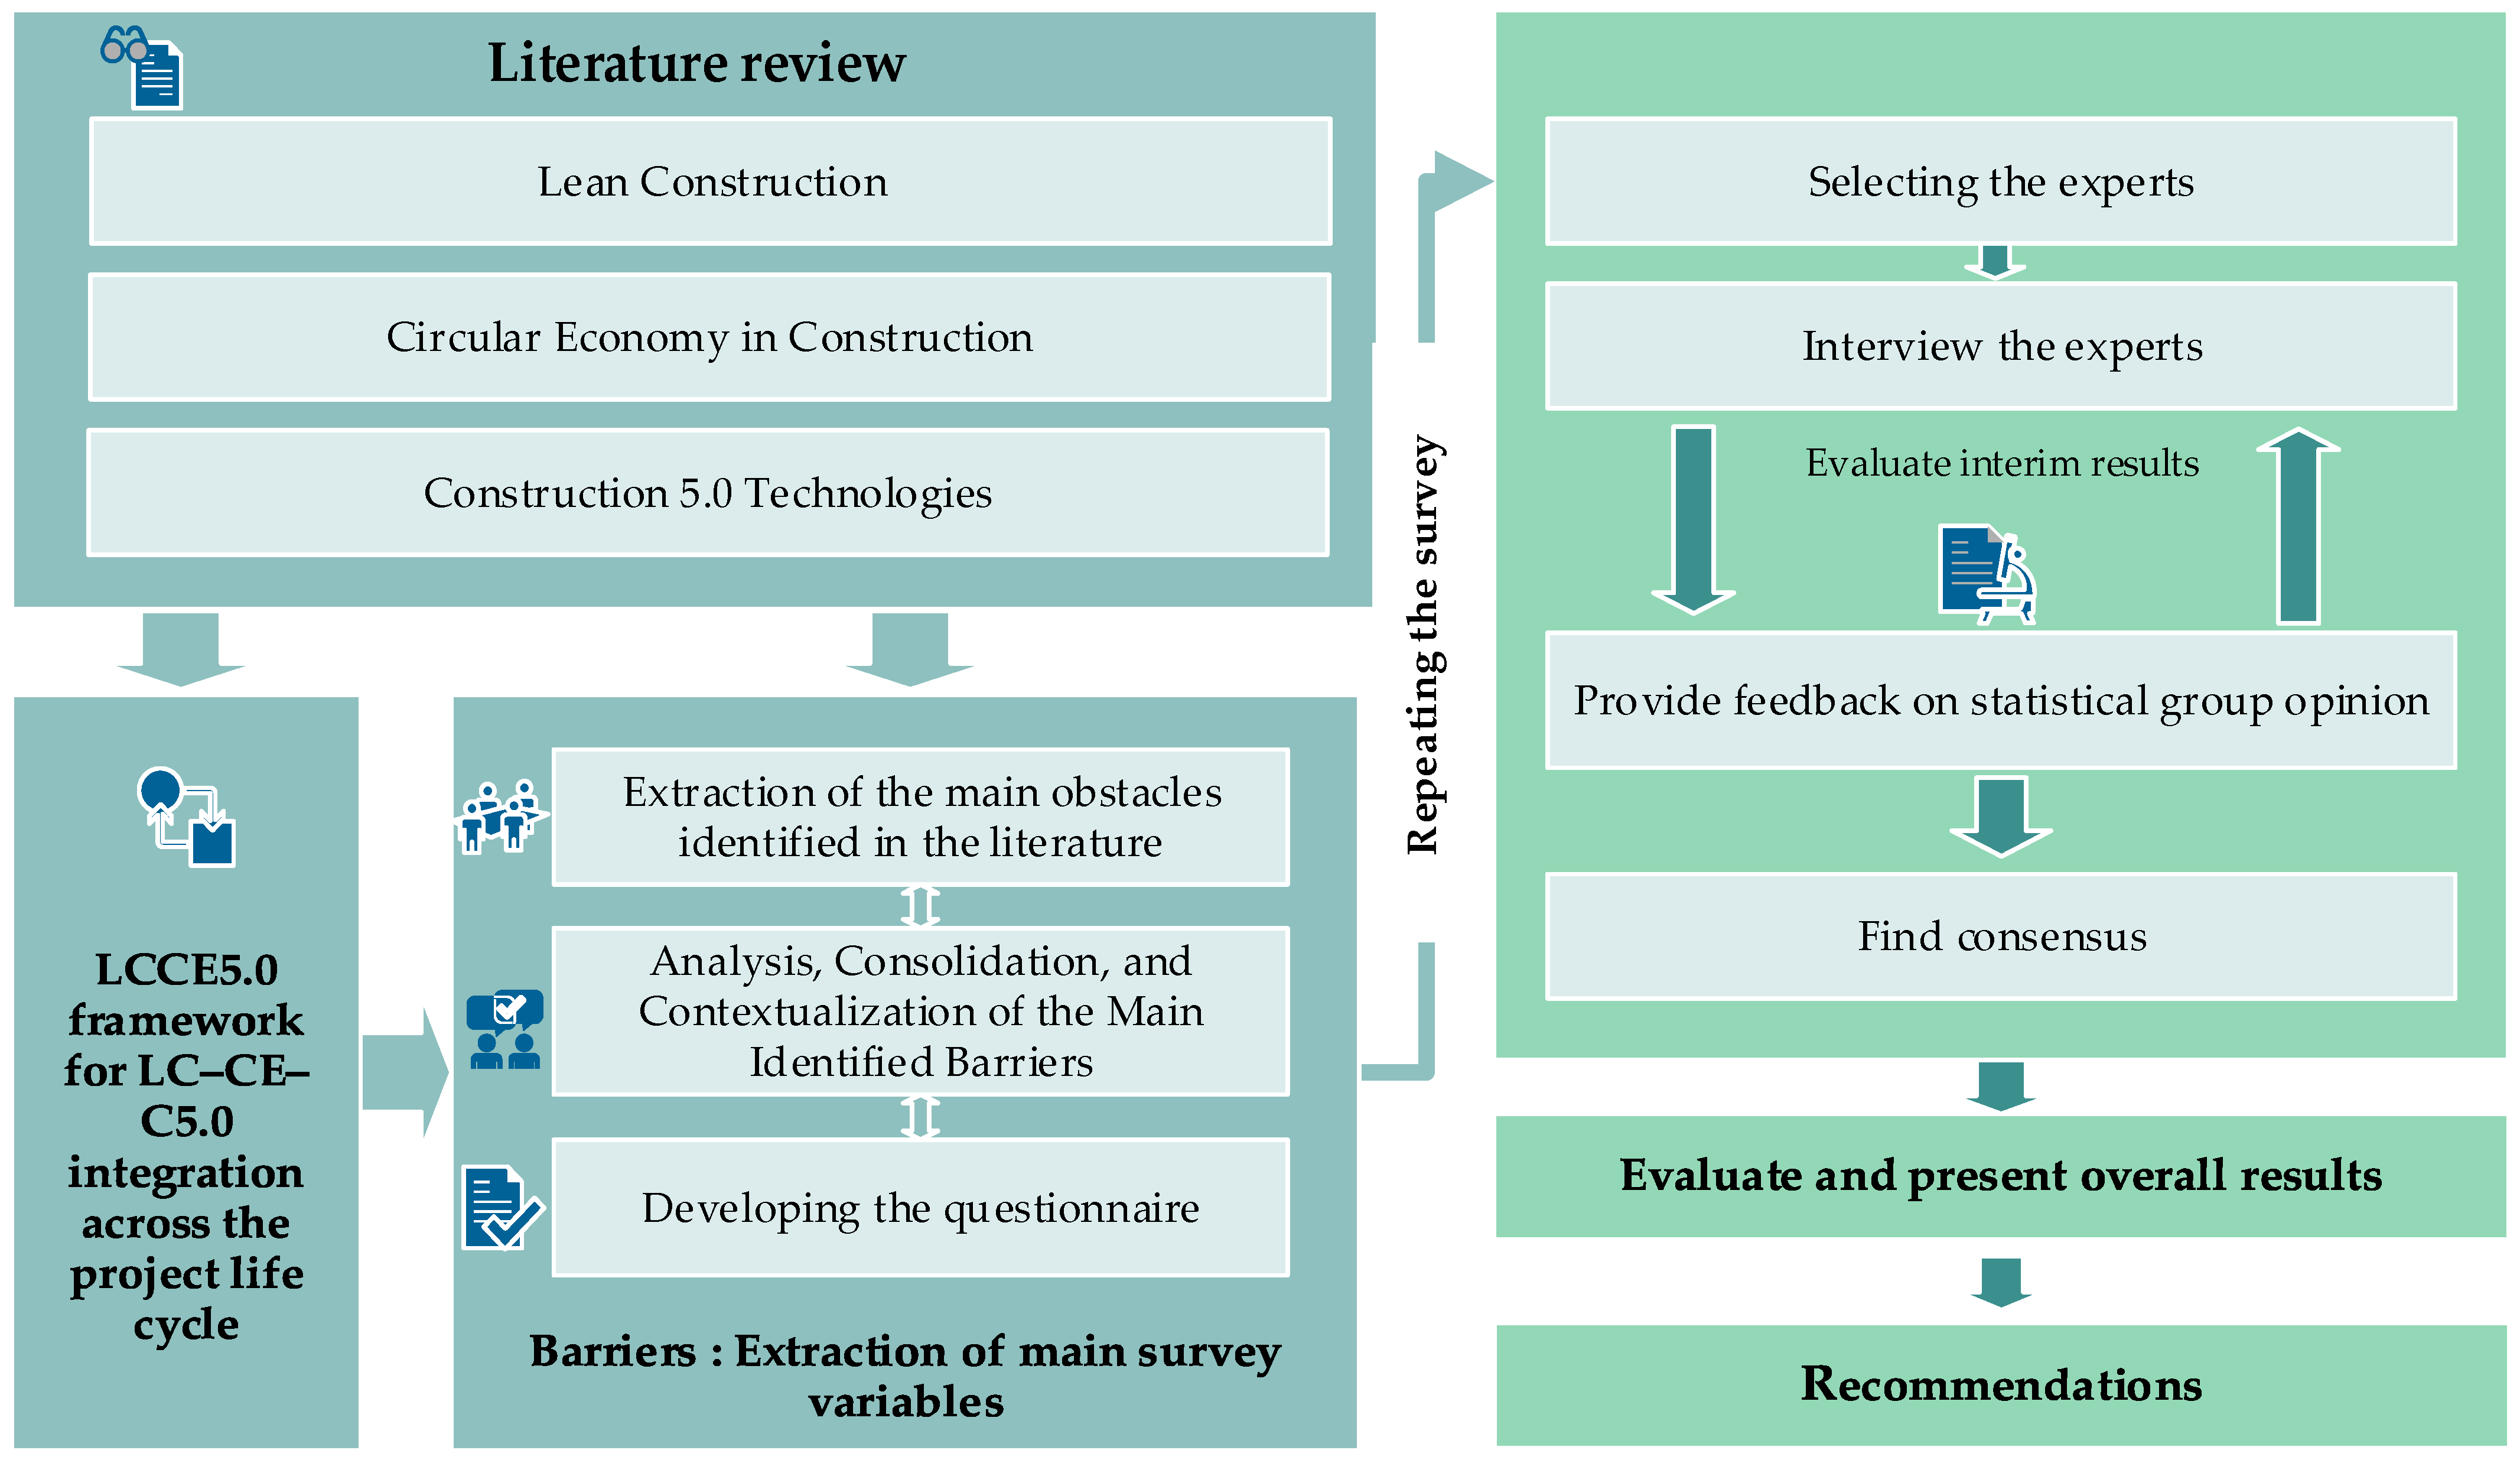
Figure 1. Research design.
Recycling 11 00063 g001
Figure 2. LCCE5.0 conceptual model across the project life cycle and its hypothesized chain, moving from digital transparency and traceability to Lean routine reliability, and then to circular loop executability.
Recycling 11 00063 g002
Figure 3. Scientific literature search and selection process (stage-wise screening and eligibility traceability).
Recycling 11 00063 g003
Figure 4. Barrier intensity hotspots across the LCCE5.0 structure: mean T2 medians by dimension and life-cycle phase. Note: Items coded as “Design/Procurement” were displayed in both the Design and Procurement columns to reflect their hybrid nature (specification plus tender translation), without modifying the final T2 ranking.
Recycling 11 00063 g004
Table 2. LCCE5.0 barrier universe: dimensions, life-cycle phases, and critical barrier factors (CBFs).
CodeCBFLife-Cycle PhaseReference
Cultural/socio-technicalCS1Lack of interorganizational trust and transparencyCross-cutting[34,41,45,47,70,136]
CS2 Limited commitment of project owners to measurable sustainability targets aligned with LC–CE–C5.0Cross-cutting[4,35,40,49,68,70,73]
CS3 Insufficient awareness among project owners of sustainable value creation through LC–CE–C5.0Cross-cutting[4,43,64,66,68,73]
CS4 Low employee motivation to engage in trainingCross-cutting[12,18,41,49,73]
CS5 Insufficient baseline skills to benefit effectively from trainingCross-cutting[12,40,41]
CS6 Organizational resistance to changing existing practices and processesCross-cutting[45,47,51,136]
CS7 Weak transfer of academic and applied research results into professional practiceCross-cutting[41,44,49,70,120]
CS8 Insufficient high-level commitment of public authorities and corporate top management to LC–CE–C5.0 approachesCross-cutting[18,40,43,46,81]
CS9 Reluctance to share data and concerns about confidentiality and cybersecurityCross-cutting[12,19,68,73,96]
Economic/financialEC1 Perceived lack of profitability of interorganizational LC–CE–C5.0 initiativesCross-cutting[39,41,103]
EC2 Insufficient market demand for compliant secondary materialsProcurement[66,68,69,71,74]
EC3 High cost and lack of viable business models for specialized LC–CE–C5.0 training and advisory servicesCross-cutting[12,39,71,73,75]
EC4 Lack of seed financing mechanisms for these approachesDesign[68,70,71,74,75]
EC5 Limited access to green finance and targeted subsidiesDesign[44,66,70,71,72,73]
EC6 Limited availability of compliant secondary materials on local marketsProcurement[12,68,71,74]
EnvironmentalEN1 Local contextual and environmental conditions at territorial scale (e.g., logistics, transport distances, dispersed sites)Cross-cutting[41,44,48,66,78]
EN2 Insufficient regional infrastructure for sorting, storage, reuse platforms and recycling facilitiesEnd-of-life[4,64,67,69,71]
EN3 Poor governance and operational performance of territorial CDW management systemsEnd-of-life[64,78,80]
OrganizationalOR1 Limited autonomy of project teams and site managers to adapt processes and apply LC–CE–C5.0 practicesCross-cutting[40,43,47,49]
OR2 Insufficient interorganizational synchronization of information and execution flowsConstruction[44,47,48]
OR3 Limited organizational capacity of SMEs, due to small firm size, to deploy these approachesCross-cutting[40,44,45,49]
OR4 Non-strategic, tool-centered deployment of LC–CE–C5.0 practices and related digital toolsCross-cutting[12,27,44,47,49,131]
OR5 On-site logistics constraints that hinder Lean practices and circularity loopsConstruction[64,67,79,80]
OR6 Poor sequencing of supplies and late design/scope changes that disrupt workflow and material flows on siteConstruction[36,48,49]
Regulatory/ContractualRC1 Limited use of collaborative, risk-sharing contract modelsDesign/
Procurement
[49,105,136]
RC2 Lack of operational CE guidelines and standards in public procurementDesign/
Procurement
[12,69,70,71,78]
RC3 Instability and inconsistencies in the regulatory frameworkCross-cutting[51,70,78]
RC4 Site-level regulatory requirements (e.g., inspections, mandatory procedures) that constrain the deployment of LC–CE–C5.0 approachesConstruction[41,65,66]
RC5 Legal and insurance uncertainty regarding responsibilities and 10R certificationEnd-of-life[15,19,78,96]
RC6 Marginal consideration of environmental criteria in public procurementProcurement[4,71]
RC7 Safety and insurance constraints that limit 10R circularity strategiesEnd-of-life[15,64,80,81]
RC8 Lack of circularity targets and digital requirements in tender documentsProcurement[63,78,102]
Technical/digitalTD1 Insufficient integration of CE principles into prefabricated solutions at the design stageDesign[40,41,45,48]
TD2 Limited technical reusability and recyclability of available materialsEnd-of-life[71,78,79]
TD3 Lack of early integration of reverse logistics in project designDesign[64,69,79,80]
TD4 Limited number of accredited laboratories to test material circularityEnd-of-life[4,19,68,81,96]
TD5 Insufficient digital interoperability and on-site connectivityConstruction[12,69,71,78]
TD6 Limited deployment of material passports and traceability systemsCross-cutting[69,76,100,101]
TD7 Absence of a shared indicator dictionary and robust data governanceCross-cutting[12,69,71,77,78]
TD8 Lack of integration of operation–maintenance data into material passportsOperation and maintenance[71,78,86]
Table 3. Final prioritization of the 40 barriers (T2 reference): analytical dimension, life-cycle phase, and Delphi summary statistics (Mdn_T1, Mdn_T2, IQR_T2, TopBox%_T2) with the final rank.
CodeLife-Cycle PhaseMdn
T1
IQR_T1Mdn
T2
IQR
T2
TopBox%T2Rank
T2
RC2 Design/Procurement7.00.007.00.75100.0%1
RC6 Procurement7.01.007.01.00100.0%2
RC8 Procurement7.00.757.01.0090.9%3
CS2 Cross-cutting 6.00.756.51.0086.4%4
CS8 Cross-cutting 6.00.756.00.0095.5%5
RC3 Cross-cutting 6.01.006.01.0095.5%6
CS1 Cross-cutting 6.01.006.01.0090.9%7
RC1 Design/Proc5.51.006.01.0086.4%8
OR4 Cross-cutting5.51.756.01.0077.3%9
OR2 Construction5.51.006.01.0054.5%10
OR1 Cross-cutting5.02.005.51.0050.0%11
TD5 Construction4.03.005.01.0045.5%12
CS9 Cross-cutting 5.02.005.01.0040.9%13
TD7 Cross-cutting 5.01.755.01.0036.4%14
TD6 Cross-cutting 5.01.005.00.7522.7%15
OR3 Cross-cutting 5.02.005.01.0018.2%16
EC3 Cross-cutting 5.01.755.01.0013.6%17
CS5 Cross-cutting 4.51.004.51.0018.2%18
EC5 Design3.51.004.01.0013.6%19
TD1 Design4.01.004.00.759.1%20
EN2 End-of-life3.51.004.01.009.1%21
EC1 Cross-cutting3.51.004.01.004.5%22
RC4 Construction3.51.004.01.004.5%22
CS6 Cross-cutting 4.01.754.00.000.0%24
CS4 Cross-cutting 4.01.004.00.750.0%25
CS3 Cross-cutting 4.01.004.01.000.0%26
EN3 End-of-life3.01.003.51.009.1%27
EN1 Cross-cutting3.01.003.51.000.0%28
OR6 Construction3.01.753.51.000.0%28
EC2 Procurement3.00.003.00.754.5%30
TD3 Design2.51.003.00.750.0%31
CS7 Cross-cutting2.51.003.01.000.0%32
EC4 Design4.01.003.01.000.0%32
EC6 Procurement3.01.753.01.000.0%32
OR5 Construction3.51.003.01.000.0%32
RC5 End-of-life3.01.003.01.000.0%32
RC7 End-of-life3.01.003.01.000.0%32
TD4 End-of-life3.01.003.01.000.0%32
TD8 Operation and maintenance1.00.003.01.000.0%32
TD2 End-of-life2.01.002.01.000.0%40
Table 4. Distribution of barrier status at T2 (Central/Secondary/Peripheral) by analytical dimension, with CBF codes and within-dimension shares (n, %).
DimensionCentralSecondaryPeripheral
Cultural/socio-technical (n = 9)CS2, CS8, CS1
(3; 33.3%)
CS9, CS5, CS6, CS4, CS3
(5; 55.6%)
CS7
(1; 11.1%)
Economic/financial (n = 6)(0; 0.0%)EC3, EC5, EC1
(3; 50.0%)
EC2, EC4, EC6
(3; 50.0%)
Environmental (n = 3)(0; 0.0%)EN2, EN3, EN1
(3; 100.0%)
(0; 0.0%)
Organizational (n = 6)OR4
(1; 16.7%)
OR2, OR1, OR3, OR6
(4; 66.7%)
OR5
(1; 16.7%)
Regulatory/Contractual (n = 8)RC2, RC6, RC8, RC3, RC1
(5; 62.5%)
RC4
(1; 12.5%)
RC5, RC7
(2; 25.0%)
Technical/digital (n = 8)(0; 0.0%)TD5, TD7, TD6, TD1
(4; 50.0%)
TD3, TD4, TD8, TD2
(4; 50.0%)
Total92011
Table 5. Item-level convergence and stability diagnostics between Delphi rounds (T1–T2) across the 40 CBFs.
CodeRank T2Consensus_T1Consensus_T2ΔMdn *ΔIQR *Stability *
RC2 1StrongStrong0.000.75Stable
RC6 2StrongStrong0.000.00Stable
RC8 3StrongStrong0.000.25Stable
CS2 4StrongStrong0.500.25Stable
CS8 5ModerateStrong0.00−0.75Stable
RC3 6ModerateStrong0.000.00Stable
CS1 7ModerateStrong0.000.00Stable
RC1 8ModerateStrong0.500.00Stable
OR4 9NoneStrong0.50−0.75Stable
OR2 10ModerateModerate0.500.00Stable
OR1 11NoneModerate0.50−1.00Stable
TD5 12NoneModerate1.00−2.00Unstable
CS9 13NoneModerate0.00−1.00Stable
TD7 14NoneModerate0.00−0.75Stable
TD6 15ModerateModerate0.00−0.25Stable
OR3 16NoneModerate0.00−1.00Stable
EC3 17NoneModerate0.00−0.75Stable
CS5 18ModerateModerate0.000.00Stable
EC5 19ModerateModerate0.500.00Stable
TD1 20ModerateModerate0.00−0.25Stable
EN2 21ModerateModerate0.500.00Stable
EC1 22ModerateModerate0.500.00Stable
RC4 22ModerateModerate0.500.00Stable
CS6 24NoneModerate0.00−1.75Stable
CS4 25ModerateModerate0.00−0.25Stable
CS3 26ModerateModerate0.000.00Stable
EN3 27ModerateModerate0.500.00Stable
EN1 28ModerateModerate0.500.00Stable
OR6 28NoneModerate0.50−0.75Stable
EC2 30ModerateModerate0.000.75Stable
TD3 31ModerateModerate0.50−0.25Stable
CS7 32ModerateModerate0.500.00Stable
EC4 32ModerateModerate−1.000.00Unstable
EC6 32NoneModerate0.00−0.75Stable
OR5 32ModerateModerate−0.500.00Stable
RC5 32ModerateModerate0.000.00Stable
RC7 32ModerateModerate0.000.00Stable
TD4 32ModerateModerate0.000.00Stable
TD8 32ModerateModerate2.001.00Unstable
TD2 40ModerateModerate0.000.00Stable
* Stable items satisfied |ΔMdn| < 1 and ΔIQR ≤ 1, Ranks are dense ranks; tied items were assigned identical ranks (Section 3.6.2).
Table 6. Panel-level rank concordance across Delphi rounds (Kendall’s W).
Roundn (Experts)Kendall’s Wχ2dfp (Asymptotic)
T1220.810694.78639<0.001
T2220.817700.62539<0.001
Table 7. Consensus tier distribution and agreement shift across Delphi rounds (T1–T2).
Consensus TierT1, n (%)T2, n (%)Net Change (T2–T1), n
Strong4 (10.0%)9 (22.5%)+5
Moderate26 (65.0%)31 (77.5%)+5
None10 (25.0%)0 (0.0%)−10
Note: Tier upgrades occurred for 14 items (35.0%): 4 Moderate-to-Strong, 9 None-to-Moderate, and 1 None-to-Strong; no downgrades occurred.
Disclaimer/Publisher’s Note: The statements, opinions and data contained in all publications are solely those of the individual author(s) and contributor(s) and not of MDPI and/or the editor(s). MDPI and/or the editor(s) disclaim responsibility for any injury to people or property resulting from any ideas, methods, instructions or products referred to in the content.