Abstract
This study developed sustainable foam-type composites from recycled paper (P), corrugated cardboard (C), and their 1:1 mixture (PC) for use in thermal and acoustic insulation. The materials were produced by water-assisted defibration, gas foaming with sodium bicarbonate and yeast, and oven curing, resulting in lightweight porous panels without synthetic binders. The composites exhibited distinct density and porosity profiles that influenced moisture behavior and stability. Cardboard-based panels absorbed the most water and swelled the most, while paper-based panels were more resistant. Despite these differences, all materials showed uniformly low thermal conductivity, confirming their strong insulation capability. Acoustic performance was enhanced by perforation and multilayer assembly. Cardboard panels with a triple-layer perforated design achieved the highest sound absorption, while mixed paper–cardboard composites provided balanced broadband performance. Microscopy revealed that fiber morphology—coarse in cardboard, fine in paper, and interlaced in mixtures—shaped the porous structure and bonding. Mechanical tests indicated comparable stiffness and strength across all types, with cardboard showing the strongest internal bonding. Overall, the results demonstrate that fiber structure and porosity govern material performance. These foam composites combine effective thermal insulation, competitive sound absorption, and sufficient mechanical strength, positioning them as biodegradable, low-cost alternatives for sustainable construction and acoustic applications.
1. Introduction
In light of growing concerns regarding material sustainability and acoustic performance, composites derived from recycled cardboard and paper have emerged as biodegradable, low-energy alternatives to conventional building materials. In the current low-carbon era—where resource recycling is essential for a sustainable future for both the planet and humanity—corrugated cardboard is gaining attention as an eco-friendly, sound-absorbing material. For instance, introducing perforations in cardboard structures can enhance their sound absorption coefficient by up to 3.5 times at frequencies just below 1000 Hz [1].
Several recent studies have explored innovative applications of cardboard-based composites for thermal and acoustic insulation. An experimental study conducted in Dubai, UAE, investigated thermal insulation panels fabricated from recycled cardboard aggregates combined with biodegradable binders such as cornstarch, lime, and clay [2]. When integrated into an existing building model and validated with onsite weather and energy consumption data, 100 mm-thick cardboard–cornstarch panels reduced HVAC energy consumption by up to 19.71% during peak summer and 10.3% annually. Economic analyses further highlighted favorable material costs and payback periods, underscoring their potential as sustainable alternatives to conventional insulation.
Efforts to enhance the mechanical performance of paper-based materials have also shown promise. For example, treatment of paper sheets with cellulose-derived materials, particularly carboxymethyl cellulose (CMC), significantly improved breaking stress, strain, and fracture energy without affecting stiffness [3]. Microscopic analysis showed that CMC entered and covered the paper fibers, indicating that these changes at the fiber level are responsible for the improved fracture resistance.
Biologically derived composites represent another promising avenue. Mycelium-bound composites—engineered from agro-industrial waste—can be tailored to achieve specific functional properties, including enhanced acoustic absorption through structure-informed design [4]. Cardboard-based mycelium composites, both shredded and fine-particle forms, have demonstrated favorable acoustic absorption and potential for sustainable paneling applications [5]. These results motivate further investigations into how growth parameters influence their acoustic, mechanical, and morphological properties, facilitating reliable and scalable integration into architectural systems.
Complementing these findings, studies in southeast Morocco have developed ecological thermo-acoustic insulation composites from cardboard waste and natural fibers, achieving thermal and acoustic performances comparable to commercial synthetic materials [6]. In parallel, evaluation methods for assessing the recyclability of composite packaging have been proposed, accounting for regional processing variations, standardization efforts, and evolving product designs to improve the recyclability of paper-based composites [7].
Further advancements include concrete composites incorporating silica fume-modified cardboard fibers and polyester textile fibers, which demonstrated enhanced mechanical performance and durability under thermal and freeze–thaw cycles, supporting their potential as sustainable construction materials [8]. Similarly, Faria et al. [9] showed that composites reinforced with cardboard tube waste and green polyurethane—with or without Ca(OH)2 surface treatment—exhibit substantial mechanical strength and thermal insulation properties comparable to conventional materials. These developments highlight opportunities for value-added applications aligned with circular economy principles while reducing environmental impact.
In terms of thermal insulation, panels fabricated from recycled cardboard aggregates (CA) and biodegradable cornstarch binders (CS) exhibited thermal conductivity below 0.1 W/m·K. These CA–CS composites offered an optimal balance of strength, density, and insulation performance, promoting waste reduction and resource conservation as sustainable alternatives to conventional materials [10].
Bio-based polyurethane composite foams incorporating kraft lignin and wood particles have demonstrated enhanced thermal stability, compressive strength, and water resistance when lignin partially replaced commercial polyol, supporting the valorization of abundant natural biopolymers in sustainable foam production [11]. Moreover, the acoustical performance of polyurethane foam composites has been significantly improved using a Taguchi optimization approach, where formulation variables such as monomer mixture, filler ratio, and sample thickness were fine-tuned to increase the noise reduction coefficient from 0.485 to 0.555 [12].
Lightweight wood–polyurethane composite foams with industrial kraft lignin as a partial bio-based polyol replacement also exhibited improved compressive properties, reduced water absorption, and potential for value-added applications in building and furniture materials [13]. Exposure to wood-rot fungi altered the appearance of reinforced polyurethane foams; notably, lignin-containing composites showed superior color stability, indicating lignin’s potential for high-value applications beyond energy recovery [14]. Optimizing the fibrillation degree of conventional plant fibers through pulp refining has been demonstrated to control foam microstructure and enhance compression and cushioning properties, achieving optimal performance at 60 °SR in low-cost plant fiber-based foams [15]. Additionally, a novel process converting waste polystyrene foam into flax fiber–reinforced wood–plastic composites achieved high mechanical performance and solvent recovery, providing an environmentally and economically viable material for furniture and exterior cladding applications [16]. Ethylene propylene diene monomer rubber bio-composite foams reinforced with silane-modified wood fibers exhibited reduced water absorption alongside enhanced mechanical and thermal insulation properties, suggesting their suitability as sustainable, low-cost, non-structural insulation materials [17].
Previous studies have demonstrated that cardboard-based composite panels can provide lightweight, environmentally friendly, and cost-effective sound insulation solutions for spaces such as offices, classrooms, and home studios. However, their limitations in mechanical strength, moisture resistance, and durability require further enhancement through coatings, reinforcements, or hybrid designs [18].
Building on this foundation, the present study focuses on developing sustainable foam composite boards using recycled paper, cardboard, and a paper–cardboard mix, processed by employing an original baking method. It aims to evaluate characteristics, micro-structural and chemical features of the obtained foam composites and compare their physical properties—including density, dimensional stability, thermal conductivity, and sound absorption—and mechanical properties such as bending strength and internal bonding, as a basis to assess their potential for practical applications. The original baking method is novel because it introduces a low-cost, binder-free, thermally driven foaming process using sodium bicarbonate and yeast to generate gas within recycled cellulose fibers—unlike prior methods relying on chemical foaming agents, synthetic binders, or freeze-drying.
2. Results and Discussion
The physical and mechanical properties, including standard deviation for the three types of composites, are displayed in Table 1.

Table 1.
Physical and mechanical properties of the composites.
The results of this study highlight how the combination of recycled raw materials, namely paper (P), corrugated cardboard (C), and their mixture (PC), with a gas-assisted foaming process fundamentally governs the structure–property relationships of the manufactured composite panels. The adopted manufacturing route, water-assisted fiber defibration followed by the incorporation of sodium bicarbonate and yeast and subsequent oven curing, proved effective in generating highly porous structures. During thermal curing, the decomposition of sodium bicarbonate released carbon dioxide [19,20], while yeast fermentation contributed additional CO2 during the earlier, lower-temperature stage. This biological gas generation occurred while the slurry was still viscous, producing finer, more uniformly distributed microbubbles, which improved pore homogeneity and structural stability in the final composite material. Both of them expanded the fiber matrix and created lightweight, foamed structures. Cellulose-based materials, such as paper and cardboard fibers, are inherently capable of forming stable porous architectures without requiring additional matrix support, as demonstrated in previous studies on cellulose foams prepared by wet foaming methods followed by solvent removal through drying [15]. These findings confirm that the chosen processing route not only ensured effective fiber dispersion, but also provided the necessary structural integrity for acoustic and thermal insulation applications.
2.1. Vertical Density Profile of the Samples
The VDP analysis (Figure 1) revealed clear and statistically significant differences among the three material systems (p < 0.05), highlighting the strong influence of raw material type on density development within the foamed composites. The average bulk density values were 220 kg/m3, 161 kg/m3, and 216 kg/m3 for P, C, and PC panels, respectively. These results demonstrate that C-based panels are the least dense, whereas both P- and PC-based panels are much denser and structurally more compact. Statistical analysis confirmed that these differences were significant (p < 0.05), with sample P (Figure 1b) and sample PC (Figure 1c) grouped together and distinctly separated from sample C (Figure 1a) by approximately 27% of a higher density value.
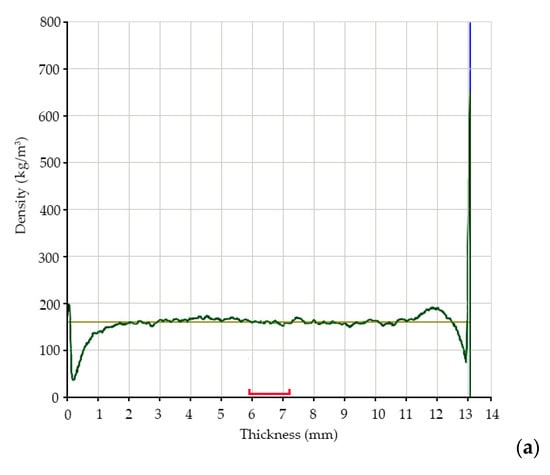
Figure 1.
Vertical density profile of the samples: P (a), C (b), and PC (c). The green line represents the measured density curve, the yellow line indicates the mean density, the red bracket marks the core zone, and the blue line denotes the surface boundary. Note: The spike in density at the end is due to a systematic measurement error and does not represent the actual material properties.
The high moisture content recorded for cardboard fibers (9.5%) can promote the formation of larger voids during the foaming process. This effect is amplified by the natural hollow and wavy shape of the fibers, which already tends to create wider gaps between them. In contrast, the finer morphology of paper fibers allowed for a denser structure and, consequently, greater density. The PC-based panels had densities similar to the P-based panels, indicating that the paper fibers helped counterbalance the more open structure created by the cardboard. These density variations are strongly correlated with porosity and moisture content. C panels exhibited the highest porosity of 90%, accompanied by the highest moisture uptake, whereas P-based panels showed the lowest porosity at 86% together with the lowest moisture content of 6.6%. The hybrid panels balanced these characteristics, with porosity of 87% and moisture content of 8.5%. Collectively, the observed variations in density, porosity, and moisture content directly account for the significant differences in water absorption and dimensional stability observed across the different panel types.
Overall, these results demonstrate that the interplay between fiber morphology and moisture behavior was decisive in shaping the vertical density profile of the foamed composites. The statistically significant separation between C- and the P-containing panels confirms that even modest changes in fiber type and water retention capacity can produce distinct density distributions, with important implications for both mechanical performance and thermal properties of recycled fiber composite foams.
2.2. Dimensional Stability of the Samples
The water absorption (WA) and thickness swelling (TS) of the composite panels (Figure 2) demonstrated the strong influence of fiber type and porosity on their dimensional behavior.
Figure 2.
Dimensional stability of the samples. Different letters above the bars indicate statistically significant differences among group means according to Tukey’s honestly significant difference (HSD).
Water absorption (WA) tests further underlined the previously presented correlations. After two hours of immersion into water, 286%, 560%, and 258% of WA values were recorded for P, C, and PC samples, respectively. After 24 h, values increased to 294%, 564%, and 265%, respectively. All results after 2 and 24 h showed statistically significant differences among the panels (p < 0.05). The remarkably high-water uptake of the C samples reflects its open, porous structure and the rapid penetration of water. In contrast, the P sample showed significantly lower WA values, consistent with its denser structure and reduced void space. Interestingly, the PC samples exhibited the lowest WA values among all panels at both 2 and 24 h. This suggests a synergistic interaction where paper fibers fill the large voids within the cardboard fiber network, hindering water penetration and stabilizing the structure against excessive swelling. The reduced WA values of the PC sample highlights the benefit of mixture paper–cardboard in moderating the extreme hydrophilicity of C panels.
Thickness swelling (TS) results further demonstrated differences in dimensional stability. After 2 h, TS ranged 4.1%, 5.7%, and 5.6% for P, C, and PC, respectively. Statistical analysis indicated no significant difference at this stage (p > 0.05), suggesting that short-term swelling is largely similar across composite panels. After 24 h of immersion into water, significant differences emerged (p < 0.05). The P sample swelled 5.0%, the C sample 8.6%, and the PC sample 6.8%. These findings confirm that cardboard fibers, with their higher water uptake, induce greater long-term dimensional instability, whereas paper fibers provide superior resistance to prolonged swelling compared to cardboard ones. Nevertheless, the PC sample occupied an intermediate position, but closer to P, reinforcing the conclusion that paper fibers effectively mitigate the instability of cardboard. From a practical perspective, this outcome suggests that while pure C panels may be unsuitable for applications involving high humidity, P and PC mixture offer an improved balance of dimensional stability and water resistance. This behavior can be attributed to the coarse morphology of the cardboard fibers rather than the paper fibers, as reported in previous studies [21]. The high porosity of 90%, and elevated moisture content of 9.5% promoted fiber wall expansion for C samples. In contrast, the P samples, with the moisture content of 6.64%, finer fibers and a porosity of 86%, formed a denser network that resisted swelling, while the PC samples, with an intermediate moisture content of 8.5% and porosity of 87%, exhibited swelling behavior reflecting contributions from both types of fibers. Similar trends have been reported in previous studies [22]. The PC formulation balances the swelling effects, achieving lower water absorption and moderate swelling compared to pure cardboard, highlighting the importance of fiber selection and network formation in designing foam-type composites with improved water durability.
2.3. Thermal Conductivity of the Samples
Thermal conductivity results (Figure 3) were found to be statistically significant (p < 0.05) for P and C samples, where P samples exhibited the lowest thermal conductivity (0.053 W/m·K), while C and PC samples both registered slightly higher values (0.055 W/m·K). The lack of a direct correlation between density and thermal conductivity can be explained by the dominant influence of pore structure over bulk density. While density gives an overall measure of material compactness, thermal conductivity is more sensitive to how pores are distributed, connected, and shaped. A denser material does not always insulate better if its pores are larger or more continuous, since these channels can facilitate heat transfer. Conversely, a lower-density material with many small, closed pores can exhibit lower conductivity by effectively trapping air and reducing convective flow. Thus, the microstructural characteristics of the composites—particularly pore size, connectivity, and orientation—play a more decisive role in thermal insulation than density alone. Small and closed voids suppress conduction and convection due to the stagnant, low-conductivity gas trapped within, whereas large and open voids allow fluid circulation and enhance heat transfer. In this context, the fine fibers in the P panel produced small void spaces in the composite structure, and these void spaces directly influenced heat conduction efficiency by restricting convective pathways and improving thermal insulation. Such a direct relationship between fiber morphology and thermal conductivity has been documented in previous studies [23]. In contrast, the C panel, with coarser fibers and a higher porosity of 90%, formed larger, interconnected voids that slightly enhanced thermal conduction.
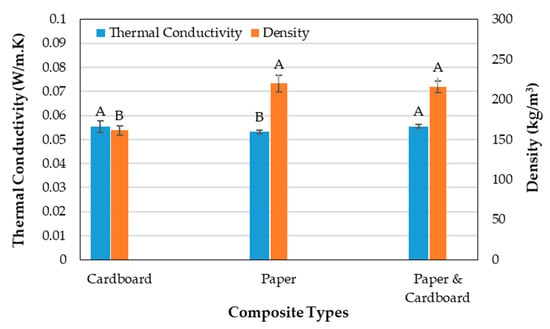
Figure 3.
Thermal conductivity of the samples. Different letters above the bars indicate statistically significant differences among group means according to Tukey’s honestly significant difference (HSD).
The obtained results demonstrate that the thermal performance of foam-type composites is governed by fiber morphology and porosity. The grouping of C and PC, separated from P, highlights that changes in fiber type can impact thermal insulation properties.
2.4. Sound Absorption Coefficient α
The acoustic characterization provided further valuable insights into structure–property relationships. The absorption coefficients were evaluated across the frequency range of 50 Hz to 6400 Hz. For the unperforated specimens, the single-layer paper specimen (P) exhibited absorption peaks primarily at high frequencies. P achieved a maximum absorption coefficient of 0.633 in the frequency range of 4800 Hz to 6400 Hz. With increased thickness, P2x reached 0.630 at frequencies above 5500 Hz, while P3x reached 0.627 between 5300 Hz and 6400 Hz (Figure 4a). Increasing the thickness did not produce meaningful performance improvements, indicating that the fine fiber morphology of paper created a dense network with small pore sizes that primarily dissipated sound energy at higher frequencies but was ineffective in the low- to mid-frequency range. This behavior aligns with established findings that smaller pore structures restrict airflow resistivity and limit viscous losses at lower frequencies, resulting in absorption that becomes more effective only in the high-frequency domain [24,25]. For the perforated single-layer paper specimen (PH), the absorption improved at low frequencies, achieving 0.761 between 2000 Hz and 2200 Hz, which represented a considerable enhancement compared to the unperforated P. However, increasing the number of layers diminished performance, with PH2x showing 0.725 at frequencies above 6000 Hz and PH3x decreasing further to 0.695 around 5800 Hz to 6400 Hz. These results, illustrated in Figure 4a, indicate that perforations are most effective in improving low-frequency absorption when applied to thinner panels, as thicker structures restrict airflow penetration and reduce the efficiency of perforation-induced resonance.
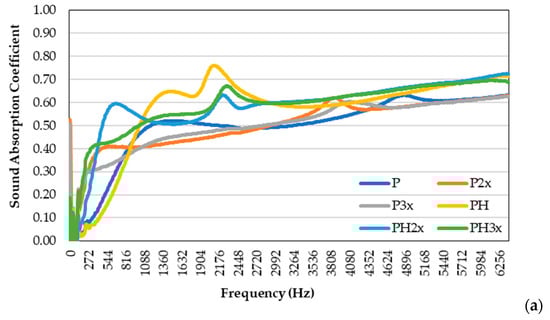
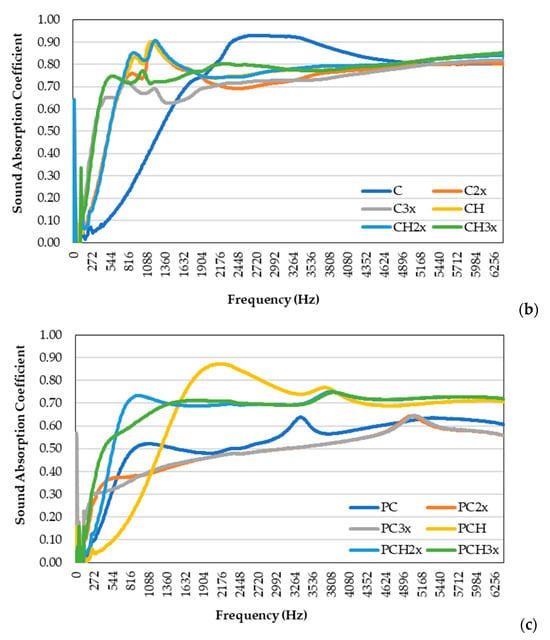
Figure 4.
Sound absorption coefficient of the samples: P (a), C (b), and PC (c).
In contrast, the single-layer cardboard specimen (C) exhibited higher sound absorption, especially in the low to mid-frequency range. C achieved the highest performance among all unperforated specimens, reaching a maximum absorption coefficient of 0.930 between 2400 Hz and 3400 Hz. With increased thickness, C2x shifted absorption toward lower frequencies, recording 0.899 at 1100 Hz–1300 Hz. However, further addition of a third layer reduced efficiency at high frequencies, as C3x achieved 0.817 in the range of 5200 Hz to 6400 Hz (Figure 4b). This trend can be attributed to the coarse morphology of cardboard fibers, which produced larger interconnected pores capable of dissipating sound energy effectively at lower frequencies through viscous friction and turbulent airflow within the void network. Previous studies have similarly reported a direct relationship between fiber size and the acoustic performance of composite materials [26]. The perforated cardboard specimen (CH) exhibited strong and consistent performance in the low-frequency range (Figure 4b). CH reached 0.902 between 1100 Hz and 1300 Hz, while CH2x slightly improved to 0.906 between 1100 Hz and 1400 Hz. With three layers, CH3x shifted absorption toward higher frequencies, reaching 0.851 in the range of 6200 Hz to 6400 Hz. These results demonstrate that perforation in cardboard-based composites promotes low-frequency absorption by enabling sound energy to penetrate and interact with the large, interconnected pores of the coarse fibers.
The unperforated PC samples (Figure 4c) displayed intermediate behavior. PC achieved an absorption coefficient of 0.638 at frequencies ranging from 3300 Hz to 3400 Hz. PC2x and PC3x performed similarly, both showing maximum coefficients of 0.645 in the frequency ranges between 4900 Hz and 5200 Hz. The introduction of perforations in the first layer significantly influenced the acoustic response by enhancing airflow penetration and enabling Helmholtz-type resonances within the pore system [4]. The perforated hybrid specimen (PCH) provided the broadest response among all tested configurations, as shown in Figure 4c. PCH achieved 0.873 between 2000 Hz and 2300 Hz, showing excellent performance in the low to mid-frequency range. PCH2x maintained effective absorption with a coefficient of 0.750 between 3700 Hz and 4000 Hz, while PCH3x reached 0.747 between 3800 and 4000 Hz. Although the magnitude of absorption decreased slightly with thickness, the hybrid PC perforated specimens demonstrated stable performance across a wider frequency spectrum, suggesting that the combination of fine and coarse fibers, together with perforation, created a multiscale pore architecture capable of dissipating sound.
The results confirm that cardboard-based composites, particularly CH and its multilayer configurations, provided the most effective sound absorption, with coefficients exceeding 0.90 in the frequency ranges most relevant for building acoustics. Paper-based samples, with their fine pore structure, were limited to high-frequency performance, while PC composites offered balanced behavior across frequencies. The enhanced low-frequency absorption observed in perforated specimens can be explained by Helmholtz resonance effects and increased airflow resistivity [4].
The acoustic performance of the foam-type composite panels was further quantified through the Sound Absorption Average (SAA) and Noise Reduction Coefficient (NRC), as demonstrated in Figure 5. Both parameters revealed clear effects of fiber type, perforation, and panel thickness on sound absorption capacity.
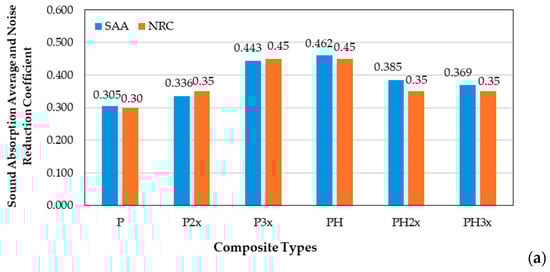
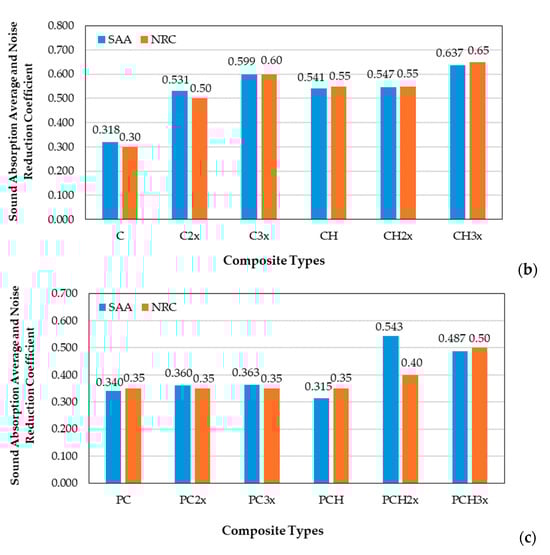
Figure 5.
Sound absorption average (SAA) and noise reduction coefficient (NRC) of the samples: P (a), C (b), PC (c).
It can be noticed that increasing the thickness through multilayer stacking substantially improved SAA and NRC values. This thickness-dependent enhancement is consistent with the well-established principle that greater specimen thickness increases the path length for sound waves within the porous structure, thereby promoting multiple reflections, and energy losses [4].
Perforation of the first layer also had a pronounced influence on absorption behavior, higher compared to the unperforated counterparts. This enhancement can be attributed to the creation of Helmholtz-type resonances and increased airflow resistivity at the perforated surfaces, with sound energy dissipation, particularly at low and mid frequencies.
Also, the results align with the observed porosity trends. The high porosity of the C samples favors greater airflow resistivity and enhances sound absorption, while the P samples offers more compact pore networks with negative influence on the acoustic efficiency. PC samples provided intermediate but balanced performance, benefiting from both pore connectivity and density.
These findings highlight the critical influence of fiber morphology, pore architecture, perforation design and thickness on the acoustic functionality of foam-type composites, offering valuable insights for tailoring sustainable panels for noise control applications. Increased panel thickness enhances broadband absorption, while perforation provides additional benefits by introducing resonant mechanisms and increasing acoustic damping. Cardboard-based composites consistently outperformed paper and hybrid systems in both SAA and NRC, likely due to the coarser fiber morphology of cardboard, which promotes larger pore channels and increases the effective flow resistivity of the network.
2.5. Microscopic Investigation
Microscopic investigation at 120× magnification (Figure 6) provided important confirmation of the structure–property relationships.
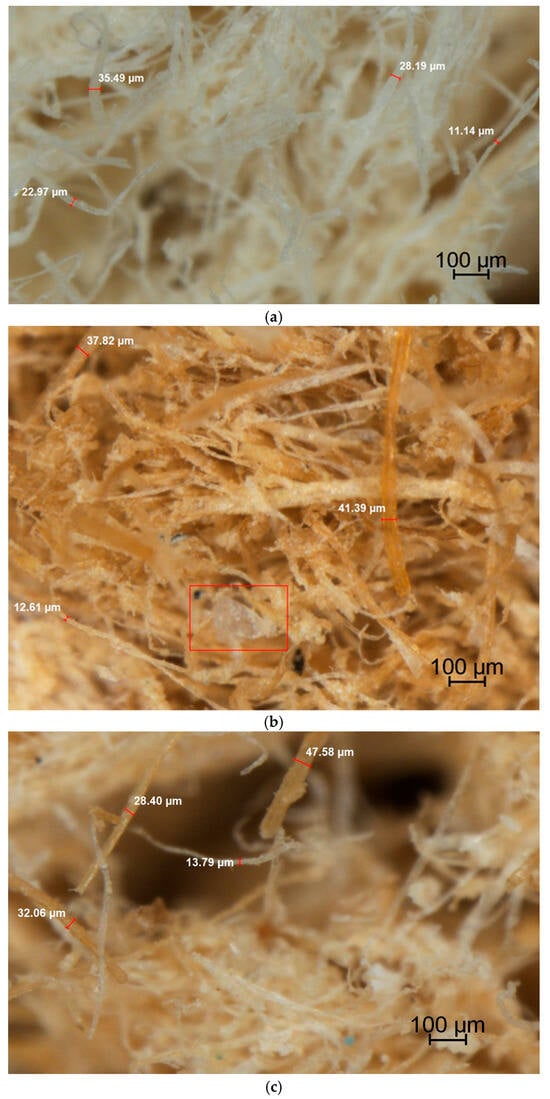
Figure 6.
Microscopic investigation of the samples: P (a), C (b), PC (c).
The P-based specimens (Figure 6a) displayed finer fibers, predominantly within the 11 μm to 35 μm range, creating a compact and tightly packed network. This compactness correlates directly with the higher density of 220 kg/m3, lower porosity of 86%, and reduced water absorption of 286% after 2 h. While such compact structures improve stiffness, as reflected in the relatively high modulus of elasticity of 77 N/mm2, they provide fewer open pathways for sound dissipation. The C-based specimens (Figure 6b) were characterized by relatively coarse and irregular fibers with diameters between 35 μm and 41 μm, forming a heterogeneous network with large voids. This morphology is consistent with the low density of 161 kg/m3 and the high-water absorption (559% after 2 h). At the same time, the larger pore size distribution enhances acoustic damping by increasing airflow resistivity, which explains the favorable sound absorption observed for C panels. The PC specimens exhibited intermediate morphology, with fiber diameters spanning from 13 μm to 47 μm. Here, finer paper fibers interlaced with coarser cardboard structures, producing a mixed pore distribution that balanced structural compactness with interconnected porosity. This architecture supports the superior property balance of PC panels, which combine relatively high density with controlled water uptake and enhanced acoustic response.
A noteworthy observation was the detection of residual sodium bicarbonate in the cardboard-based sample, highlighted in the micrograph by the red-marked region (Figure 6b). The presence of these crystalline deposits suggests incomplete decomposition during the foaming process. Sodium bicarbonate residues can contribute to the formation of micro-voids that further improve acoustic energy dissipation. However, their agglomeration in certain regions may also introduce local heterogeneity, potentially influencing both mechanical and acoustic performance.
2.6. Mechanical Properties of the Samples
Mechanical properties testing results are displayed in Table 1 and Figure 7. Statistical analysis showed no significant differences among MOE values (p > 0.05), indicating that all panels exhibited comparable stiffness despite differences in density and morphology. Similarly, MOR values did not differ significantly (p > 0.05), suggesting that bending strength was not strongly affected by fiber type. In contrast, internal bonding (IB) strength exhibited statistically significant differences (p < 0.05). These results reflect the role of cardboard fibers in enhancing inter-fiber adhesion and load transfer, whereas the P and PC samples, despite their advantages in water resistance and dimensional stability, exhibited weaker bonding. From an application perspective, this indicates that while mixture paper-cardboard improves several functional properties, optimization of interfacial bonding may be required to fully exploit mechanical performance.
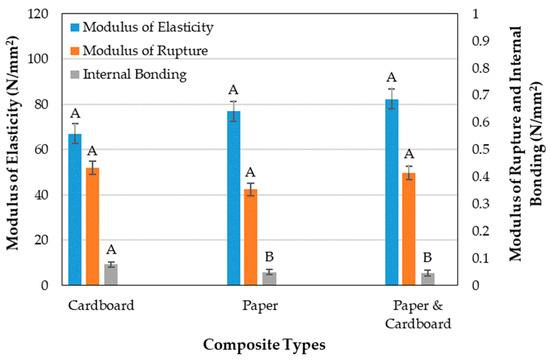
Figure 7.
Mechanical properties of the samples. Different letters above the bars indicate statistically significant differences among group means according to Tukey’s honestly significant difference (HSD).
These results indicate that the foamed network architecture, rather than fiber type alone, predominantly controlled stress distribution during bending. The reduced IB of the PC samples results from interfacial heterogeneity between paper and cardboard fibers, which may have limited optimal bonding. Additionally, fibrillation during blending could promote additional hydrogen bonding between fibers and fines, improving network stability [15]. These results highlight a trade-off between bending performance and internal adhesion. While MOE and MOR remain relatively stable across fiber types, IB is sensitive to fiber compatibility and network homogeneity in foam-type composites.
2.7. Fourier-Transform Infrared Spectroscopy
FTIR analysis was employed to study and compare the chemical structural features of the raw materials and the final foamed composites. The comparative FTIR spectra of the different layers of the printed corrugated cardboard employed as main raw material are depicted in Figure 8a, while a calculated average spectrum of the cardboard fibrous material alongside those of sodium bicarbonate and yeast powder, employed as foaming agents are presented in Figure 8b. In Figure 8a it can be observed that the spectra C_B, C_C and C_F_B_verso, corresponding to the back layer, middle layer and the verso of the printed face layer, respectively, are quite similar, highlighting features characteristic for cellulosic rich fibers from lignocellulosic resources. The high absorption at around 3325 cm−1 is assigned to stretching of hydrogen bonded hydroxyl groups, while the double peak at around 2914 cm−1 and 2860 cm−1 is assigned to asymmetric and symmetric stretching of C-H bonds in aliphatic methylene and methyl groups, confirmed by scissoring vibration of C-H in methylene at 1423 cm−1 [27], assigned to cellulose [28,29]. The other cellulose assignable absorptions are those at 1367 cm−1–1365 cm−1 and 1315 cm−1 (C-H vibration in carbohydrates, respectively, and C-H vibration in cellulose with a contribution of C-O vibration in syringyl derivatives), 1155 cm−1 and around 1020 cm−1 (C-O vibrations in carbohydrates) and the small shoulder at around 896 cm−1 [29,30]. The small absorption at around 1738 cm−1, characteristic to unconjugated carbonyl groups, might be assigned to the acetyl groups in hemicelluloses and is slightly higher for the middle paper, very likely due to the presence of starch-based adhesive as binder of the three-layered corrugated cardboard [31]. The absorption at around 1642 cm−1 could be assigned to either conjugated or aromatic carbonyls, possibly from the structure of lignin remains, as well as to absorbed water, which certainly has to be considered more likely in the present case [29].
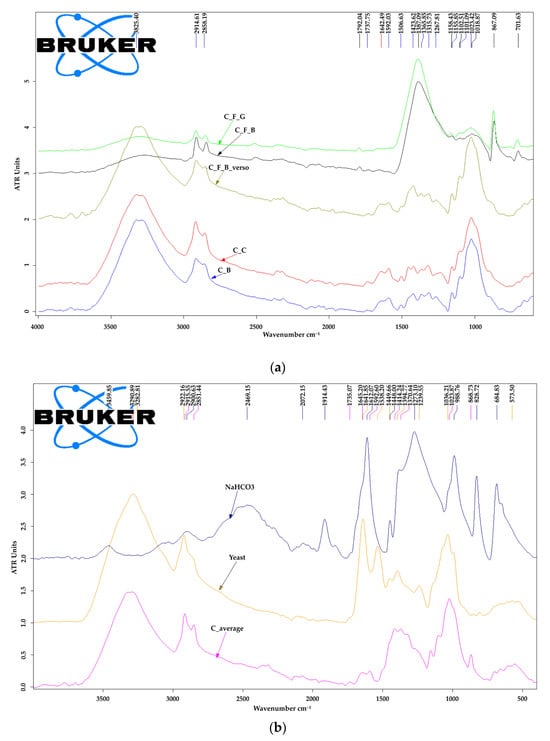
Figure 8.
FTIR investigation of the raw materials: (a) comparative chemical features of the different layers of the printed recycled corrugated cardboard employed as raw material: C_B—back paper layer; C_C—middle paper layer; C_F_B -black printed face paper layer; C_F_G—green printed face paper layer; C_F_B_verso—verso of the printed surface layer; (b) recycled printed cardboard (average spectrum), sodium bicarbonate and yeast powder.
The absorption at around 1600 cm−1 is assignable to aromatic ring, very likely from the structure of lignin fragments still present in cardboard fibers, as also suggested by the small absorptions at around 1507 cm−1 (aromatic skeletal vibration of lignin) and 1268 cm−1 (guaiacyl ring breathing). Accordingly, FTIR analysis results are in accordance with literature data referring the chemical composition of corrugated cardboard, composed of cellulose fibers as main component, alongside smaller amounts of hemicelluloses and lignin [32] and confirm previous research of the authors [18,31].
On the other hand, the spectra of the surface printed paper of the recycled corrugated cardboard (C_F_B, C_F_G in Figure 8a) are also very similar, regardless the color black or green of the printing ink, but clearly different from those of the unprinted layers of paper in the composition of the cardboard. The main differences are: a barely distinguishable hydroxyl groups absorption at 3325 cm−1, a better differentiation of the double peak absorption of methylene and methyl groups at 2914 cm−1–2860 cm−1, a small absorption at 1792 cm−1, a very strong absorption band with the maximum at around 1368 cm−1, cumulating and overlapping all the distinct absorptions in the range 1550 cm−1–1200 cm−1, registered for the unprinted layers of paper (C_B, C_C, C_F_B verso). Moreover, a less intense but broad absorption band, with a maximum in the range 1030 cm−1–1023 cm−1, is replacing/covering the characteristic C-O, C-O-C absorptions of cellulose in the range 1200 cm−1–850 cm−1. At the same time, distinct absorptions appear at 867 cm−1 and 701 cm−1, which could be related to some inorganic components, either used as fillers or possibly present in the composition of the colored ink. From chemical point of view, these FTIR features indicate that, very likely, a polymeric product and fillers were employed to seal the paper and avoid uncontrolled ink absorption, ensuring a better surface quality for the actual printing. This assumption is sustained by literature data, suggesting also that the sharp absorption at 867 cm−1 might be assigned to calcium carbonate, as for 871 cm−1 [33]. Moreover, other FTIR literature data [34], present FTIR absorption bands of calcium carbonate at 2515 cm−1, 1800 cm−1, 1418 cm−1, 874 cm−1 and 712 cm−1, which means that it might cause interferences and overlapping with other absorptions of the different components, explaining the strong combined absorption at 1368 cm−1.
This means that the upper layer of the printed face is a so called “coated paper”, having on top a compound polymer layer, where the inorganic filler is linked to the cellulosic fibers (generally shorter than for uncoated paper) by a natural or synthetic binder [35]. Literature sources indicate that fillers, such as calcium carbonate (CaCO3), kaolin (SiO2/Al2O3) and talcum (MgSi), as well as titanium dioxide (TiO2) as a white pigment, by case, are often contained by the outermost layer of cardboards used for food packaging, to provide a better barrier against moister and oxygen and provide, at the same time, smoother surfaces that are more suitable for printing than the rough untreated board layer. For instance, styrene/allyl alcohol polymer, kaolin with chlorinated polyethylene and calcium carbonate (CaCO3) were identified by FTIR microscopy in successive layers of a printed cardboard box [36].
An average spectrum of the printed cardboard used in this research, resulted by calculation with the OPUS 7.2 software, considering the spectra of the three paper layers is presented in Figure 8b, alongside the spectra of the employed foaming agents sodium bicarbonate and yeast. In the case of sodium bicarbonate have to be remarked the strong sharp absorptions at around 1914 cm−1, 1612 cm−1, 1273 cm−1, 989 cm−1, 828 cm−1 and 685 cm−1. The spectrum of yeast presents a complex spectrum reflecting a complex composition containing lipids, proteins and polysaccharides. The most characteristic absorptions for these bio- components are those at 2920 cm−1–2860 cm−1 (aliphatic methylene in fatty acids/lipids), the triplicate absorption bands at 1642 cm−1 (amide I), 1539 cm−1 (amide II) and 1450 cm−1 (-CH3) characteristic to proteins and those in the region 1150 cm−1–900 cm−1, which are characteristic to carbohydrates and polysaccharides, related to the amount of nucleic acids, so that the 1037 cm−1 band is attributed to the C-O stretching [37].
Figure 9 illustrated the FTIR spectra of the mixtures of ingredients prepared for the three types of composites, as air dried materials in comparison with the final foamed composite panels C, P, PC, resulting after the thermal treatment process. The depicted spectra highlight some differences between the air-dried ingredients mixtures and the resulting panels for all the three types of composites, partly influenced by the type of fibrous material employed. Similar spectra of the air-dried mixtures and the final composites were registered for those made of recycled paper (P) or a blend of 50% recycled paper and 50% recycled cardboard. The spectra of the prepared mixtures (air-dried) are a combination of the spectra of ingredients and retained water, presenting high absorption of hydroxyl (3300 cm−1) and methylene groups (2917 cm−1–2860 cm−1), a distinct sharp absorption at 1644 cm−1, a combined absorption band at 1422 cm−1, the characteristic absorptions of carbohydrates in the range of 1150 cm−1–900 cm−1 and a sharp absorption of calcium carbonate filler at 874 cm−1. Following the thermal treatment of 15 h at 150 °C, the absorption at 1644 cm−1 is decreasing to a small shoulder, while a new absorption is observed at 1572 cm−1.
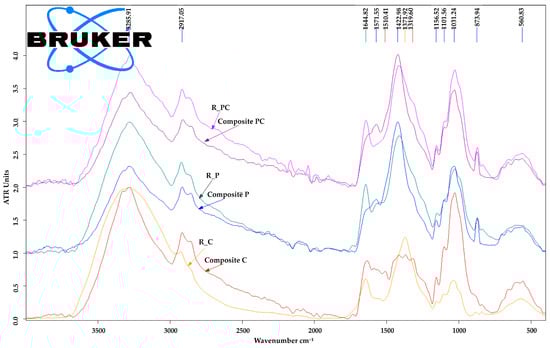
Figure 9.
FTIR spectra for the three types of composites as prepared recipes R_C, R_P, R_PC (before thermal treatment) and the final foamed panels (C, P, PC).
The spectrum of the prepared air-dried mixture for the composite C, made only from recycled cardboard as fibrous material, looks similar with those for the other two types P and PC, excepting a significantly reduced absorption of calcium carbonate at 874 cm−1, indicating a reduced filler content. Considering the usual higher content of fillers in the printed paper and the relative contributions of this type of recycled cellulose fibers in the composites P and PC compared to C, the result is perfectly explicable. Following the thermal the absorption at 1644 cm−1 decreased but less obvious than in case of composites P and PC, whilst the increase in absorption in the range 1600 cm−1–1500 cm−1 was also less obvious, while the three small absorptions in this range resemble a protein fingerprint, possibly yeast residues. The decrease in the absorption at 1644 cm−1 as result of backing is very likely related to the decrease in absorbed water content and thermal decomposition of sodium bicarbonate employed as foaming agent. In conclusion, the three composite types share largely similar chemical characteristics, with specific differences depending on the recycled cellulosic material used as the base. Their formation through baking appears to be primarily a physical process, supported by the thermal decomposition of sodium bicarbonate, which, together with yeast, acts as a foaming agent.
3. Materials and Methods
3.1. Preparation of Composites
In this study, the foam panels were made from fibrous inputs: printed paper (P), printed cardboard (C), and a 1:1 blend of the two (PC), all sourced from recycling.
In the first step, the base material was cut into small pieces (Figure 10a,b) and immersed in the normal water for a few minutes. The soaked raw material was defibrated using a blender (Figure 10c,d), after which the excess water was removed by squeezing the fiber-based material (Figure 10e,f) until the desired amount of water was reached, according to the experimental recipes (Table 2).
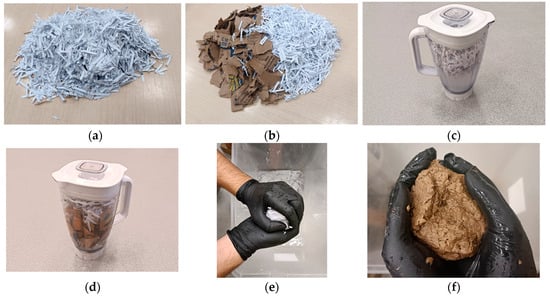
Figure 10.
Preparation of the fibrous material for the three types of composites: (a) small pieces of printed paper (P); (b) mixture of small pieces of printed paper-cardboard; (c) blending the paper and water; (d) blending the paper-cardboard mixture and water; (e) squeezing the fibers of disintegrated paper (P); (f) squeezing the fibers of disintegrated cardboard (C).
Table 2.
Recipes of the compositions employed to obtain the foamed composites by further baking.
Yeast (Saccharomyces cerevisiae) and sodium bicarbonate (NaHCO3) function as distinct leavening agents, differing fundamentally in their chemical and biochemical mechanisms. Yeast acts as a biological leavening agent, producing carbon dioxide through a slow, enzymatic fermentation process that also generates ethanol and various flavor compounds. In contrast, sodium bicarbonate serves as a chemical leavening agent, releasing carbon dioxide rapidly through acid–base or thermal decomposition reactions, which yield water and sodium salts as by-products. Yeast activity is sensitive to temperature, ceasing above approximately 50 °C, whereas sodium bicarbonate decomposes thermally above 80 °C. Unlike yeast, sodium bicarbonate requires the presence of an acid to fully react. Yeast fermentation generates CO2 biologically at moderate temperatures, producing finer and more uniform pores, while sodium bicarbonate decomposes thermally, creating larger pores and overall expansion. Their combined use enables controlled multi-scale porosity, enhancing both structural integrity and insulation performance.
Afterward, based on the composite type recipe, the rest of the materials, namely the foaming agents (sodium bicarbonate and yeast), were added to the fibers and mixed perfectly (Figure 11a,b).
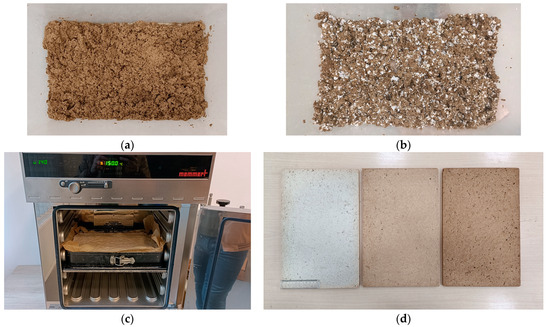
Figure 11.
(a) Mixture for cardboard composite (C); (b) Mixture for paper-cardboard composite (PC); (c) Composition in a mold, ready to be baked in the oven; (d) The three types of experimental foamed composites (P, PC, C).
Finally, the prepared composition cakes were placed in rectangular aluminum molds and lined with baking paper to prevent the adhesion of the composite to the mold. After that, they were baked in the oven for 15 h at 150 °C (Figure 11c). After this thermal treatment, the composites were left to cool down at room temperature. To ensure dimensional consistency and remove any overcooked material or uneven surface layers, the three types of composites were planed and trimmed to achieve a uniform average thickness of 30 mm (Figure 11d).
3.2. Methods
3.2.1. Vertical Density Profile
To evaluate the internal density distribution of the composite panels, vertical density profiles (VDP) were measured using a DPX300 X-ray density profiler IMAL, San Damaso, Italy production. From each type of panel, eight square specimens measuring 50 × 50 mm were cut. Before testing, the weight of each specimen was recorded using a high-precision EU C-LCD technical balance, Gibertini Elettronica, Novate Milanese, Italy production. The built-in dimension verification system of the X-ray analyzer was employed to validate the sample sizes, thereby ensuring the accuracy of the density measurements. The VDP test was carried out through the full thickness of each specimen.
3.2.2. Thermal Conductivity
The thermal conductivity coefficient (λ) of the composite samples was evaluated using a heat flow meter HFM436 Lambda, Netzsch, Selb, Germany production, in accordance with ISO 8301 [38] and DIN EN 12667 [39] standards. Prior to testing, the device underwent calibration, following the standard procedures to ensure measurement accuracy, with specific attention to the set temperature difference (ΔT) and average temperature (Tm) related to the hot plate and cold plate of the equipment. During the test, each sample was positioned between the two parallel plates—the hot one maintained constantly at 20 °C (as for an indoor temperature), while the cold plate temperature was varied from −10 °C to 15 °C with an increment of 5 °C. The resulting heat flux through the material was measured by the equipment, which automatically calculated the thermal conductivity coefficient, based on Fourier’s Law.
3.2.3. Dimensional Stability
In order to assess the water absorption (WA) and thickness swelling (TS), eight specimens (50 mm × 50 mm) were prepared for each composite type, following the guidelines of the SR EN 317:1996 standard [40]. The samples were fully immersed in distilled water maintained at 20 °C for duration of 24 h. Before immersion, each specimen was weighed using an electronic balance with 0.01 g precision, and the thickness was measured at the center point along the diagonal using a digital caliper with a 0.01 mm accuracy. These measurements were repeated after 2 h and again after 24 h of immersing into water. This approach enabled precise monitoring of both weight and dimensional changes throughout the testing period.
3.2.4. Sound Absorption
A Brüel & Kjær Type 4206 impedance tube (Nærum, Denmark production) (Figure 12a) was used to evaluate the sound absorption properties of the samples. For each composite type, four samples with a diameter of 29 mm were prepared; one of these samples included a number of 7 perforations with holes, each 3 mm in diameter (Figure 12b). The sound absorption coefficient (α) was measured over a frequency range of 50 to 6400 Hz. The impedance tube tests followed the standard procedure for measurements using the two-microphone transfer function method (TFM), in accordance with ISO 10534-2 and ASTM E1050-12 standards [41,42]. Data acquisition and visualization were carried out using Pulse 7758® software from Brüel & Kjær. For each composite type there were six measurements category which are displayed in Table 3: two structures with 1 layer, two with 2 layers and three with 3 layers.
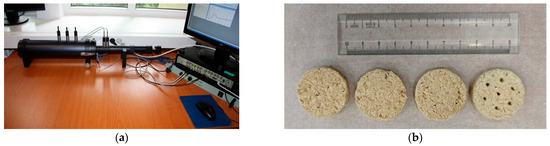
Figure 12.
(a) The impedance tube for sound absorption evaluation; (b) The samples used for sound absorption evaluation.
Table 3.
The description of the measurement structures.
3.2.5. Porosity of the Samples
The porosity of the specimens was determined using an AccuPyc III 1350 Gas Pycnometer (Micromeritics Instrument Corporation, Norcross, GA, USA). For each sample type, five rectangular specimens with dimensions of 10 mm × 10 mm × 35 mm were prepared. The dimensions were accurately measured using a digital caliper with a precision of 0.01 mm. The pycnometer measures the true density (ρ_true) by determining the gas displacement within the solid phase, thereby excluding interparticle voids but including any closed pores. In addition, the bulk density (ρ_bulk) was obtained, which accounts for both the pores and the interparticle spaces in the sample.
3.2.6. Mechanical Properties
In addition, mechanical tests were performed using a Zwick Roell Z010 Universal Testing Machine (Ulm, Germany) (Figure 13a), in order to assess the strength of the composite samples. In order to determine the modulus of elasticity (MOE) and modulus of rupture (MOR), eight samples from each type of composite panels were prepared in accordance with EN 326-1 [43]. The testing was conducted using a 10,000 N load cell, following the European standard EN 310 [44]. Additionally, eight square samples (50 mm × 50 mm) from each composite type were tested to evaluate internal bonding (IB) perpendicular to the panel surface, according to EN 319 [45].
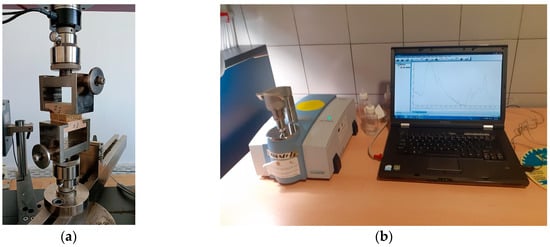
Figure 13.
Equipment used for the conducted tests: (a) Zwick Roell Z010 Universal Testing Machine; (b) ALPHA Bruker spectrometer.
3.2.7. Microscopic Analysis
For microscopic analysis, samples cut from all three composite categories were examined using a Nikon SMZ18 stereo-microscope (Nikon Corporation, Tokyo, Japan) with a magnification range of 22.5× to 405×. Surface images were captured at 120× magnification using the NIS-Elements 2.0 Imaging Software, enabling the fiber measurements.
3.2.8. FTIR Analysis
Fourier Transform Infrared Spectroscopy (FTIR) analysis was conducted using an ALPHA Bruker spectrometer (Bruker, Ettlingen, Germany) equipped with an attenuated total reflectance (ATR) unit (Figure 13b). FTIR–ATR spectra were recorded for all composite types over the range of 4000 cm−1–400 cm−1, with a resolution of 4 cm−1 and 24 scans per spectrum. The spectra were subsequently processed for baseline correction and smoothing, and average spectra were generated for each composite type using OPUS software (version 7.2, Bruker, Ettlingen, Germany). These average spectra were then normalized using min–max normalization and then analyzed in comparison with reference data from previous studies.
3.2.9. Statistical Analysis
Statistical analysis was performed to assess the significance of differences between the composite groups. Standard deviations were calculated in Microsoft Excel, applying a 95% confidence interval with a significance level of α = 0.05 (p < 0.05). An Anova one-way test was conducted using Minitab 19 statistical software. This analysis compared the mean values of several parameters, including VDP, WA and TS, thermal conductivity coefficient (λ), modulus of elasticity (MOE), modulus of rupture (MOR), and internal bonding strength (IB) for all composite types.
4. Conclusions
This study successfully developed sustainable foam-type composite panels from recycled paper (P), corrugated cardboard (C), and their hybrid (P–C) using a water-assisted defibration and gas-assisted foaming technique incorporating sodium bicarbonate and yeast. The adopted process effectively produced lightweight, highly porous structures without synthetic binders, highlighting its potential as a scalable, low-energy, and environmentally benign manufacturing route.
The physical characterization revealed statistically significant differences (p < 0.05) among the panel types. The average densities of the P, C, and P–C panels were 220, 161, and 216 kg/m3, respectively, corresponding to porosities of 86%, 90%, and 87%. The coarser fiber morphology of cardboard contributed to the lowest density and highest porosity, whereas the finer paper fibers resulted in denser, more compact networks. These microstructural distinctions influenced the equilibrium moisture content, which was 6.6% for P, 9.5% for C, and 8.5% for P–C, directly affecting dimensional stability. After 24 h of immersion, cardboard panels exhibited the highest water absorption of 564% and thickness swelling of 8.6%, followed by P–C with 265% water absorption and 6.8% swelling, and P with 294% water absorption and 5.0% swelling. Despite these variations, all panels displayed low thermal conductivity values between 0.053 and 0.055 W/m·K, confirming their excellent thermal insulation capacity.
The acoustic characterization demonstrated that sound absorption was strongly influenced by structural configuration and porosity. The triple-layer perforated cardboard panel (CH3x) achieved the highest acoustic performance, with a sound absorption average of 0.637 and a noise reduction coefficient of 0.65, while hybrid panels (PCH3x) provided more uniform broadband absorption, reaching a sound absorption average of 0.487 and a noise reduction coefficient of 0.50. Microscopic examination supported these findings, showing coarse fibers in the C panels with diameters between 35 and 41 μm, fine fiber networks in the P panels ranging from 11 to 35 μm, and interlaced morphologies in the P–C panels with fiber diameters between 13 and 47 μm. Occasional sodium bicarbonate residues were also observed, generating additional microvoids that enhanced both acoustic and thermal performance.
Mechanical evaluation confirmed sufficient structural integrity for non-load-bearing insulation applications. The modulus of elasticity and modulus of rupture ranged from 67.1 to 82.4 N/mm2 and from 0.35 to 0.43 N/mm2, respectively, with the internal bond strength highest in the C panels, reaching 0.078 N/mm2. These results demonstrate that the interplay between fiber morphology, porosity, and binder-free foam structure governs the composite’s multifunctional performance.
In conclusion, the findings confirm that foamed composites derived from recycled paper and cardboard combine low density, high porosity, strong thermal insulation, competitive acoustic absorption, and adequate mechanical stability. These characteristics position them as biodegradable, cost-effective alternatives to conventional synthetic insulation materials, contributing to circular economy principles and the advancement of sustainable building materials. Future studies should focus on optimizing the foaming process, enhancing moisture resistance, and integrating natural coatings or fiber reinforcements to further improve performance and durability.
Author Contributions
Conceptualization, M.H.M. and C.C.; methodology, M.H.M. and C.C.; software, M.H.M., A.L., S.V.G. and M.C.T.; validation, M.H.M., A.L., M.C.T. and C.C.; formal analysis, C.C.; investigation, M.H.M., S.V.G., M.C.T., M.I. and C.C.; resources, M.H.M. and M.I.; data curation, M.H.M. and A.L.; writing—original draft preparation, A.L., M.H.M. and M.C.T.; writing—review and editing, C.C.; visualization, M.C.T., M.I. and C.C.; supervision, C.C.; project administration, M.H.M.; funding acquisition, M.H.M. All authors have read and agreed to the published version of the manuscript.
Funding
This research received no external funding.
Data Availability Statement
Data are contained within the article.
Acknowledgments
The authors acknowledge the structural funds project PRO-DD (POS-CCE, O.2.2.1., ID 123, SMIS 2637, No. 11/2009) for providing the infrastructure used in this work and the Contract No. 7/9.01.2014. We acknowledge also the support provided by the Ministry of Research, Innovation and Digitization, UEFISCDI, through project no. 61PCE/2022 (PN-III-P4-PCE2021-0885), ACADIA—Qualitative, dynamic, and acoustic analysis of anisotropic systems with modified interfaces.
Conflicts of Interest
The authors declare no conflicts of interest.
Abbreviations
The following abbreviations are used in this manuscript:
| ATR | Attenuated total reflectance unit |
| C | Foam-type composite from cardboard |
| FTIR | Fourier Transform Infrared Spectroscopy |
| MOR | Modulus of Rupture |
| MOE | Modulus of Elasticity |
| NRC | Noise Reduction Coefficient |
| PC | Foam-type composite from paper and cardboard blended |
| P | Foam-type composite from paper |
| SAA | Sound Absorption Average |
| TFM | Transfer function method |
| VDP | Vertical density profile |
References
- Kang, C.W.; Kim, M.K.; Jang, E.S. An Experimental Study on the Performance of Corrugated Cardboard as a Sustainable Sound-Absorbing and Insulating Material. Sustainability 2021, 13, 5546. [Google Scholar] [CrossRef]
- Mathews, J.M.; Vivek, B.; Charde, M. Thermal insulation panels fabricated using recycled cardboard for energy efficiency in buildings: Retrofit performance evaluation in hot climate. Int. J. Sustain. Energy 2025, 44, 2432280. [Google Scholar] [CrossRef]
- Kobayashi, J.; Kaneko, M.; Supachettapun, C.; Takada, K.; Kaneko, T.; Kim, J.Y.; Ishida, M.; Kawai, M.; Mitsumata, T. Mechanical Properties and Reinforcement of Paper Sheets Composited with Carboxymethyl Cellulose. Polymers 2024, 16, 80. [Google Scholar] [CrossRef]
- Sun, W.; Strässle Zúñiga, S.H.; Philippe, V.; Rinaldi, L.; Abitbol, T. Mycelium-Bound composites from agro-industrial waste for broadband acoustic absorption. Mater. Des. 2025, 250, 113591. [Google Scholar] [CrossRef]
- Walter, N.; Gürsoy, B. A Study on the Sound Absorption Properties of Mycelium-Based Composites Cultivated on Waste Paper-Based Substrates. Biomimetics 2022, 7, 100. [Google Scholar] [CrossRef]
- Ouakarrouch, M.; Bousshine, S.; Bybi, A.; Laaroussi, N.; Garoum, M. Acoustic and thermal performances assessment of sustainable insulation panels made from cardboard waste and natural fibers. Appl. Acoust. 2022, 199, 109007. [Google Scholar] [CrossRef]
- Kochersperger, S.; Schabel, S. Recyclability of Paper-Based Composites for Packaging Applications—The Role of Evaluation Methods. Chem. Ing. Tech. 2024, 96, 891–901. [Google Scholar] [CrossRef]
- Haigh, R.; Sandanayake, M.; Yaghoubi, E.; Joseph, P.; Vrcelj, Z. The mechanical and microstructural investigations of concrete incorporating waste textile and cardboard fibers following thermal and freeze–thaw cycles. Struct. Concr. 2025, 26, 2757–2772. [Google Scholar] [CrossRef]
- Faria, D.L.; Mesquita Junior, L.; do Lago, R.C.; Soriano, J.; Guimaraes Junior, M.; Pires, N.J.; da Silva Bezerra, A.C.; de Oliveira, J.E.; de Paula Protasio, T.; Martins, M.A.; et al. Valorization of cardboard waste in the production of polyurethane biocomposites: A new and environmentally friendly material for civil construction. Constr. Build. Mater. 2025, 462, 139902. [Google Scholar] [CrossRef]
- Mathews, J.M.; Vivek, B.; Charde, M. Thermal insulation panels for buildings using recycled cardboard: Experimental characterization and optimum selection. Energy Build. 2023, 281, 112747. [Google Scholar] [CrossRef]
- Luo, S.; Gao, L.; Guo, W. Influence of Adding Lignin and Wood as Reactive Fillers on the Properties of Lightweight Wood–Polyurethane Composite Foams. Forest Prod. J. 2020, 70, 420–427. [Google Scholar] [CrossRef]
- Wahab, H.A.; Rus, A.Z.M.; Moen, A.T.; Ngadimon, K.N.; Noor, F.M. Optimization of Acoustical Properties Polyurethane (PU) Wood Fibres Foam Composites. In Proceedings of the ICME 2019, Ayer Keroh, Melaka, Malaysia, 29–30 August 2019; IOP Conference Series: Materials Science and Engineering. IOP Publishing: Bristol, UK, 2020; Volume 824, p. 012016. [Google Scholar]
- Luo, S.; Gao, L.; Guo, W. Effect of incorporation of lignin as bio-polyol on the performance of rigid lightweight wood–polyurethane composite foams. J. Wood Sci. 2020, 66, 23. [Google Scholar] [CrossRef]
- Aramburu, A.B.; Guidoti, A.B.; Schneider, D.M.; Cruz, N.D.; Delucis, R.A. Colour of polyurethane foams filled with wood and wood derivatives exposed to two xylophagous fungi. J. Cell. Plast. 2022, 58, 541–553. [Google Scholar] [CrossRef]
- Li, J.; Yang, X.; Xiu, H.; Dong, H.; Song, T.; Ma, F.; Feng, P.; Zhang, X.; Kozliak, E.; Ji, Y. Structure and performance control of plant fiber based foam material by fibrillation via refining treatment. Ind. Crops Prod. 2019, 128, 186–193. [Google Scholar] [CrossRef]
- Khedr, R.F.; Elnahas, H.H. Preparation of wood plastic composite from flax fibers and post consumed polystyrene foam based on environmental and economical scales. J. Thermoplast. Compos. Mater. 2024, 37, 869–884. [Google Scholar] [CrossRef]
- Chen, G.; Gupta, A.; Mekonnen, T.H. Effects of wood fiber loading, silane modification and crosslinking on the thermomechanical properties and thermal conductivity of EPDM biocomposite foams. Ind. Crops Prod. 2023, 200, 116911. [Google Scholar] [CrossRef]
- Mazaherifar, M.H.; Timar, C.M.; Georgescu, S.V.; Coșereanu, C. Sustainable thermal and acoustic insulating panels from recycled cardboard. BioResourses 2025, 20, 4115–4135. [Google Scholar] [CrossRef]
- Fauzi, M.S.; Lan, D.N.; Osman, H.; Ghani, S.A. Effect of sodium bicarbonate as blowing agent on production of epoxy shape memory foam using aqueous processing method. Sains Malays. 2015, 44, 869–874. [Google Scholar] [CrossRef]
- Hussein, M.S.; Leng, T.P.; Rahmat, A.R.; Zainuddin, F.; Keat, Y.C.; Suppiah, K.; Alsagayar, Z.S. The effect of sodium bicarbonate as a blowing agent on the mechanical properties of epoxy. Mater. Today Proc. 2019, 16, 1622–1629. [Google Scholar] [CrossRef]
- Mikhailidi, A.M.; Saurov, S.K.; Markin, V.I.; Kotelnikova, N.E. Functional materials from paper wastes: I. From waste newsprint paper and cardboard to high-grade cellulose fibers. Russ. J. Bioorg. Chem. 2019, 45, 888–894. [Google Scholar] [CrossRef]
- Tajvidi, M.; Azad, F. Effect of particle size, fiber content and compatibilizer on the long-term water absorption and thickness swelling behavior of reed flour/polypropylene composites. J. Reinf. Plast. Compos. 2009, 28, 2341–2351. [Google Scholar] [CrossRef]
- Rebolledo, P.; Cloutier, A.; Yemele, M.C. Effect of density and fiber size on porosity and thermal conductivity of fiberboard mats. Fibers 2018, 6, 81. [Google Scholar] [CrossRef]
- Rutkevičius, M.; Austin, Z.; Chalk, B.; Mehl, G.H.; Qin, Q.; Rubini, P.A.; Stoyanov, S.D.; Paunov, V.N. Sound absorption of porous cement composites: Effects of the porosity and the pore size. J. Mater. Sci. 2015, 50, 3495–3503. [Google Scholar] [CrossRef]
- Luo, X.; Li, W.; Jin, X.; Zeng, L. Effects of porosity and pore size on sound absorption characteristic of ceramsite porous material. J. Chin. Ceram. Soc. 2011, 39, 158–163. [Google Scholar]
- Istana, B.; Batan, I.M.L.; Sutikno Khem, S.; Ubaidillah, U.; Yahya, I. Influence of particle size and bulk density on sound absorption performance of oil palm frond-reinforced composites particleboard. Polymers 2023, 15, 510. [Google Scholar] [CrossRef]
- Wang, X.; Sotoudehniakarani, F.; Yu, Z.; Morrell, J.J.; Cappellazzi, J.; McDonald, A.G. Evaluation of corrugated cardboard biochar as reinforcing fiber on properties, biodegradability and weatherability of wood-plastic composites. Polym. Degrad. Stab. 2019, 168, 108955. [Google Scholar] [CrossRef]
- Schwanninger, M.; Rodrigues, J.C.; Pereira, H.; Hinterstoisser, B. Effects of short-time vibratory ball milling on the shape of FTIR spectra of wood and cellulose. Vib. Spectrosc. 2004, 36, 23–40. [Google Scholar] [CrossRef]
- Manandhar, S.; Shrestha, B.; Sciortino, F.; Ariga, K.; Shrestha, L.K. Recycling Waste Paper for Further Implementation: XRD, FTIR, SEM, and EDS Studies. J. Oleo Sci. 2022, 71, 619–626. [Google Scholar] [CrossRef]
- Pandey, K.K.; Pitman, A.J. FTIR studies of the changes in wood chemistry following decay by brown-rot and white-rot fungi. Int. Biodeterior. Biodegrad. 2003, 52, 151–160. [Google Scholar] [CrossRef]
- Mazaherifar, M.H.; Coşereanu, C.; Timar, C.M.; Georgescu, S.V. Physical and mechanical properties of foam-type panels manufactured from recycled cardboard. Constr. Build. Mater. 2024, 411, 134685. [Google Scholar] [CrossRef]
- Xu, H.; Huang, L.; Xu, M.; Qi, M.; Yi, T.; Mo, Q.; Zhao, H.; Huang, C.; Wang, S.; Liu, Y. Preparation and Properties of Cellulose-Based Films Regenerated from Waste Corrugated Cardboards Using [Amim]Cl/CaCl2. ACS Omega 2020, 5, 23743–23754. [Google Scholar] [CrossRef] [PubMed]
- Goué, E.L.; Ham-Pichavant, F.; Grelier, S.; Remy, J.; Coma, V. Functional Chitosan–Calcium Carbonate Coatings for Enhancing Water and Fungal Resistance of Paper Materials. Molecules 2022, 27, 8886. [Google Scholar] [CrossRef] [PubMed]
- Matei, C.; Berger, D.; Dumbrava, A.; Radu, M.; Gheorghe, E. Calcium carbonate as silver carrier in composite materials obtained in green seaweed extract with topical applications. J. Sol-Gel Sci. Technol. 2020, 93, 315–323. [Google Scholar] [CrossRef]
- www.spentopapers.com. Available online: https://spentopapers.com/pages/coated-vs-uncoated-paper (accessed on 15 September 2025).
- www.shimadzu-webapp.eu. Available online: https://www.shimadzu-webapp.eu/magazine/issue-2017-3_en/just-paper-isnt-it/ (accessed on 15 September 2025).
- Mihoubi, W.; Sahli, E.; Gargouri, A.; Amiel, C. FTIR spectroscopy of whole cells for the monitoring of yeast apoptosis mediated by p53 over-expression and its suppression by Nigella sativa extracts. PLoS ONE 2017, 12, e0180680. [Google Scholar] [CrossRef] [PubMed]
- ISO 8301:1991; Determination of Steady-State Thermal Resistance Properties. Heat Flow Meter Apparatus. Latvian Standard; International Organization for Standardization: Riga, Latvia, 1991.
- Institution, B.S. Thermal Performance of Building Materials and Products: Determination of Thermal Resistance by Means of Guarded Hot Plate and Heat Flow Meter Methods: Products of High and Medium Thermal Resistance; British Standards Institution: London, UK, 2001. [Google Scholar]
- EN 317:1996; Particleboards and Fibreboards–Determination of Swelling in Thickness after Immersion in Water. European Committee for Standardization: Brussels, Belgium, 1996.
- ISO 10534:1998; Acoustics—Determination of Sound Absorption Coefficient and Impedance in Impedance Tubes: Part 1: Method Using Standing Wave Ratio, Part 2: Transfer-Function Method. International Organization for Standardization (ISO): Geneva, Switzerland, 1998.
- ASTM E1050:1998; Standard Test Method for Impedance and Absorption of Acoustical Materials Using a Tube, Two Microphones and a Digital Frequency Analysis System. ASTM International: West Conshohocken, PA, USA, 1998.
- EN 326-1; Wood-Based Panels–Sampling, Cutting and Inspection–Part 1: Sampling and Cutting of Test Pieces and Expression of Test Results. European Committee for Standardization: Brussels, Belgium, 1994.
- EN 310; Wood-Based Panels. Determination of Modulus of Elasticity in Bending and Bending Strength. European Committee for Standardization: Brussels, Belgium, 1993.
- EN 319; Particleboards and Fiberboards. Determination of Tensile Strength Perpendicular to the Plane of the Board. European Committee for Standardization: Brussels, Belgium, 1993.


Disclaimer/Publisher’s Note: The statements, opinions and data contained in all publications are solely those of the individual author(s) and contributor(s) and not of MDPI and/or the editor(s). MDPI and/or the editor(s) disclaim responsibility for any injury to people or property resulting from any ideas, methods, instructions or products referred to in the content. |
© 2025 by the authors. Licensee MDPI, Basel, Switzerland. This article is an open access article distributed under the terms and conditions of the Creative Commons Attribution (CC BY) license (https://creativecommons.org/licenses/by/4.0/).