Article

Decarbonising Island Kitchens: Assessing the Small-Scale Flexible Balloon Digester’s Clean Cooking Potential in Fiji

by
Rinal Rinay Prasad
1,
Ramendra Prasad
1,2,3,
Malvin Kushal Nadan
1,
Shirlyn Vandana Lata
2,
Antonio Comparetti
4,* and
Dhrishna Charan
2,3
1
Interdisciplinary Energy and Environment Research Group, Department of Science, School of Science and Technology, The University of Fiji, Saweni, Lautoka 679, Fiji
2
Department of Science, School of Science and Technology, The University of Fiji, Saweni, Lautoka 679, Fiji
3
Centre for Climate Change, Energy, Environment and Sustainable Development, The University of Fiji, Saweni, Lautoka 679, Fiji
4
Department of Agricultural, Food and Forest Sciences, University of Palermo, 90128 Palermo, Italy
*
Author to whom correspondence should be addressed.
Recycling 2025, 10(5), 183; https://doi.org/10.3390/recycling10050183
Submission received: 8 August 2025 / Revised: 11 September 2025 / Accepted: 22 September 2025 / Published: 28 September 2025

Abstract

Access to clean cooking technologies is crucial for achieving SDG7 for remote households in small Pacific Islands like Fiji and for developed countries alike. Many small households in Fiji still rely on traditional biomass for cooking. This study explores the environmental sustainability and clean cooking potential of the Home Biogas 2.0 flexible balloon digester installed at Kamil Muslim College in Ba, Fiji. Comparative bench experiments were also performed. The bench-scale experiments produced higher biogas yields than the digester trials, with optimal outputs recorded from fresh cow dung (541 mL of cumulative biogas) and vegetable waste excluding rice (125 mL). When scaled, annual energy production from fresh cow dung reached 4644.64 MJ, equivalent to replacing 7.82 standard LPG cylinders, while vegetable waste produced 3763.76 MJ, offsetting 6.34 cylinders. Notably, biogas from cow dung exceeded the estimated annual household cooking demand of 3840 MJ for a family of four persons. The biogas produced from fresh cow dung provided an average cooking duration of 1 h 29 min, while biogas from vegetable waste lasted for 1 h 21 min. The economic analysis indicated that combining liquid digestate, used as biofertiliser, and biogas from cow dung resulted in the highest financial return, with a 67% Internal Rate of Return, a Net Present Value of $12,364.30, a Benefit Cost Ratio of 5.12, and a Discounted Payback Period of 1.28 years. This indicates the potential of Home Biogas 2.0 as a climate-smart technology that integrates renewable energy production, waste reduction, and sustainable agriculture, making it particularly suitable for rural and remote communities.

1. Introduction

Access to clean cooking fuels and technologies is crucial for achieving Sustainable Development Goal 7 “Affordable and clean energy”, particularly for remote households in small islands of developing countries like Fiji in the Pacific Ocean but also developed countries like Balearic Islands (Spain), Crete (Greece), Malta and Gozo (Malta) in the Mediterranean Sea.
Global energy demand is rising as the global population grows, fueling economic activity and technological developments in both developing and developed countries. Much of the world’s energy is still provided by fossil fuels such as coal, natural gas, and oil [1]. For instance, out of the global total final energy consumption (TFEC) of 399 EJ in 2022, only 12.9% came from modern renewable energy sources, while the rest continued to be sourced from fossil fuels [2]. Growing energy consumption complicates the shift in world energy systems away from fossil fuels, towards low-carbon sources of energy. Over the past decade (2012–2022), the global TFEC has increased by 16%, reflecting the growing need for a developing global green economy [2]. Hence, for developing countries like Fiji, in order to achieve environmentally friendly economic growth, more alternative energy sources such as biogas need to be comprehensively explored.
In the Pacific, 64% of the population is without regular access to energy, with an overwhelming 60% of the rural population lacking access to the grid for energy. Several Pacific Island Countries (PICs) have ambitious renewable energy programs in place to generate “100% renewable energy” by 2030 for the dual purpose of increasing energy security and mitigating greenhouse gas (GHG) emissions.
Fiji heavily relies on fossil fuels for thermal energy generation, whereas ca. 45.10% of the total generated electricity comes from industrial diesel oil (IDO) and heavy fuel oil (HFO) [3]. In Fiji, renewable energy has the potential to promote economic growth, reduce the level of poverty, and promote energy security. Fiji has set high targets for renewable energy with a commitment of reaching 100% electricity production through renewable energy sources (RES) by 2036 [4]. For Pacific Small Island Developing States (PSIDS), the Nationally Determined Contributions (NDCs) offer a chance to switch to a carbon-neutral and more sustainable route toward a firm commitment to reducing GHG emissions [5]. The main aim of Fiji’s NDC is to reduce carbon dioxide emissions by 30 percent by 2030 compared to a business-as-usual (BAU) baseline from the energy sector, through the electricity, industry, and transport sub-sectors. Bioenergy generation, particularly through biomass and waste-to-energy, forms a part of the medium-term goals (2021–2025) under the electricity generation and transmission sub-sector in Fiji’s NDC. Under clean cooking, the NDC refers to rocket stoves, liquefied petroleum gas (LPG), kerosene, and electric stoves as means of transitioning away from open fire cooking; however, no initiative on clean cooking through biogas has been identified in the document, indicating a policy gap on alternative, renewable clean cooking technologies.
Almost 50% of domestic cooking in Fiji is conducted in highly inefficient open-fire stoves, while the remaining 50% relies on heavily polluting fossil fuels [6]. For urban areas in Fiji, LPG, which mainly consists of a mixture of propane, butane, or ethane and methane gases, is largely used for cooking [7]. However, to curb the looming energy crisis and waste management issues in Fiji, it is needed to move towards renewable sources of bioenergy that can be produced at a local level. The importance of moving away from imported LPG was highlighted during the unexpected COVID-19 pandemic, which revealed the status of Fiji’s energy poverty, resulting in many citizens missing out on LPG.
Apart from LPG, biomass continues to be the traditional energy source for cooking in the South Pacific, often in the form of coconut shells and wood. Affordability, infrastructure, and cultural practices continue to impede access to clean cooking energy in the region [8]. Biomass energy in Fiji is particularly characterised by major inefficiencies in its production and harvest. According to a study by Chandra and Hemstock [9], 53% of the 72.37 PJ of biomass energy produced annually in the country is lost through harvesting and processing, charcoal conversion and residue losses from agriculture and forestry. Sheikh and Kumar [6] investigated the potential of using biomass briquettes, from wood residues from furniture workshops and logging sites, for cooking and found that 120,498 L of kerosene and 163,360 L of LPG would be potentially replaced from their use. While improving the efficiency associated with biomass use remains important, a transition towards cleaner and advanced renewable energy sources is becoming increasingly popular. It is important, however, that any such transition must be affordable, as currently most people in Fiji cannot afford them [8].
To a large extent, biomass could be replaced by new renewable energy technologies, such as Waste-to-Energy (WtE), that could potentially provide cleaner energy access [1]. Clean cooking with flexible balloon digester, such as Home Biogas 2.0, is a promising waste-to-energy technology that could be the best solution for reducing greenhouse gas (GHG) emissions worldwide [10].
For instance, Home Biogas 2.0 was tested in Sicily (Italy) for converting kitchen bio-waste from the canteen of an agricultural high school of Marsala (Trapani, Sicily, Italy) into biogas and digestate. This equipment works as a continuous flow bioreactor: the waste is fed in one end, while biogas and digestate come out from the other. The process continuously takes place at an average temperature of ca. 18 °C. The liquid digestate was sanitised by using three chlorite tablets, in order to reduce the amount of active bacteria in this effluent. Therefore, the liquid digestate was immediately used as a biofertiliser for the soilless cultivation of tomato, strawberry, aubergine and pepper plants, inside a greenhouse. Home Biogas 2.0 had a disposal capacity of 1.7 t of biowaste per year, equal to ca. 4.8 kg per day. During the testing period, this equipment produced 525 L of biogas and 7.78 L of liquid digestate per day, according to the principles of Circular Bioeconomy (CBE) [10].
As a small island nation, Fiji’s NDC target can easily be achieved if the biogas production for clean cooking is focused on reducing the carbon footprint, compared to open stoves and other inefficient stoves. A clean cooking stove reduces the amount of polluting and harmful fuels that households use daily to put food on the table. Home Biogas 2.0 (HB2.0) is a low-pressure stove designed to ensure maximum efficiency and complete elimination of common fuels such as firewood, coal, kerosene, and others. Many households in Fiji are adopting Home Biogas Waste-to-Energy (WtE) technology for cooking purposes. In 2022, the Ministry of Agriculture initiated a program using Home Biogas digesters to enhance waste conversion to energy on piggery farms. The Department of Energy, Fiji, was designated as the leading agency responsible for this initiative. Surpassing expectations, by the end of 2021, 31 biogas plants had already been installed, as outlined in the NDP. Additionally, the Ministry of Agriculture had embarked on providing 22 digesters to agricultural households in 2022. While a few units were dispatched to farmers, the status of this initiative remains unclear. Policies that provide subsidies or better availability of finance are needed in Fiji to develop its biogas sector, as currently this sector suffers from a low level of financial and institutional support, a missing policy framework, and a know-how gap [11].
This study seeks to determine the feasibility of using HB2.0 for biogas and digestate production in rural and remote areas of Fiji and the Pacific, and also elsewhere, in other small islands having similar characteristics [12]. The primary goal of this study was to produce biogas from organic waste (vegetable waste and fresh cow dung) using HB2.0 and to determine its viability in supporting rural communities whilst mitigating Fiji’s carbon emissions. A pilot feasibility study of HB2.0 was carried out at Kamil Muslim College, where HB2.0 was installed in October 2020. This study is relevant to policy and decision-makers who are responsible for Renewable Energy (RE) advancement in Fiji, involving biogas production for clean cooking with flexible balloon digesters.
A review of literature has revealed that there is a lack of research on the use of flexible balloon digesters for bioenergy generation in the South Pacific and Fiji. The flexible digester has not been effectively evaluated for its mono or co-digestion capacity, pathogen loading, durability, cost-effectiveness, community uptake, temperature, and pH stability.
This study tries to address some of these gaps to prove the biogas generation from anaerobic digestion (AD) of kitchen waste and cow dung (manure) and validate it using bench experiments. An economic analysis is also performed to provide the stakeholders with costs and benefits, according to the methodology used by Asciuto et al. [13]. The economics of flexible balloon digesters have received little attention, especially when it comes to comparing the setup and upkeep expenses of this inexpensive biogas technology to the financial savings that consumers receive when switching from traditional fuel wood to biogas to satisfy their home’s energy needs. However, a detailed investigation of the financial sustainability and local preferences for distinct and inexpensive digesters, such as flexible balloon ones, was beyond the scope of this study.

2. Materials and Methods

A bench experiment was conducted to estimate the potential biogas production of kitchen waste [14] and cow dung under controlled conditions. The bench experiment helped in the identification of the optimal combination of different waste materials, and the results served as a foundation to scale up production in a digester installed at Kamil Muslim College.

2.1. Bench Experiment

The bench experiment was aimed at assessing the Anaerobic Digestion of kitchen waste produced at the above school.
Two setups of bench experiments were designed using two substrates: kitchen waste and fresh cow dung. Kitchen waste was collected from the Kamil Muslim College canteen. In order to facilitate a faster anaerobic digestion, the kitchen waste was blended into smaller pieces using a household blender. A digital kitchen scale was used to measure both substrates, as shown in Figure 1.
Setup 1: For the first bench experiment, 200 g of kitchen waste was measured and blended. The approximate composition of kitchen waste used is presented in Table 1. As substrate-to-water ratio impacts the biogas yield, the recommended ratio of 1:1, as set by the manufacturer, was used in this case. Subsequently, 200 mL of water was placed in the conical flask with 200 g of kitchen waste.
Setup 2: In the second bench experimental setup, water was added using the same 1:1 ratio, with 200 mL of water mixed with 200 g of fresh cow dung.
Both setups were placed in the same room under identical environmental conditions. The biogas was collected with the downward displacement of water method. The volume of biogas produced was recorded daily.
A total of four trials of bench experiments was conducted.
Trial 1: The first experiment included 200 g of kitchen waste from the school canteen and 200 g of fresh cow dung, as described above.
Trial 2 & Trial 3: The second and third experiments were a repetition of the first experiment, aimed at verifying the consistency of the results.
Trial 4: The fourth experiment was conducted using kitchen substrate without rice to evaluate changes in biogas production. The use of cooked rice was excluded in this experiment because its high starch content causes rapid fermentation into organic volatile fatty acids (VFA), leading to acidification of the digester and, therefore, low biogas yield. In fact, the use of soya bean and rice resulted in acid inhibition at load of 1.0 g VS/day [15]. When the pH falls below the optimal range of 6.8–7.5, methanogenic bacteria are inhibited, resulting in reduced or failed methane production. In addition, cooked rice tends to become sticky and gelatinous when wet, which can clog small-scale biodigesters and hinder proper operation. Thus, in order to increase the biogas yield, the rice was excluded from the substrate and the biogas production was estimated and evaluated.

2.2. Home Biogas 2.0 Experimentation

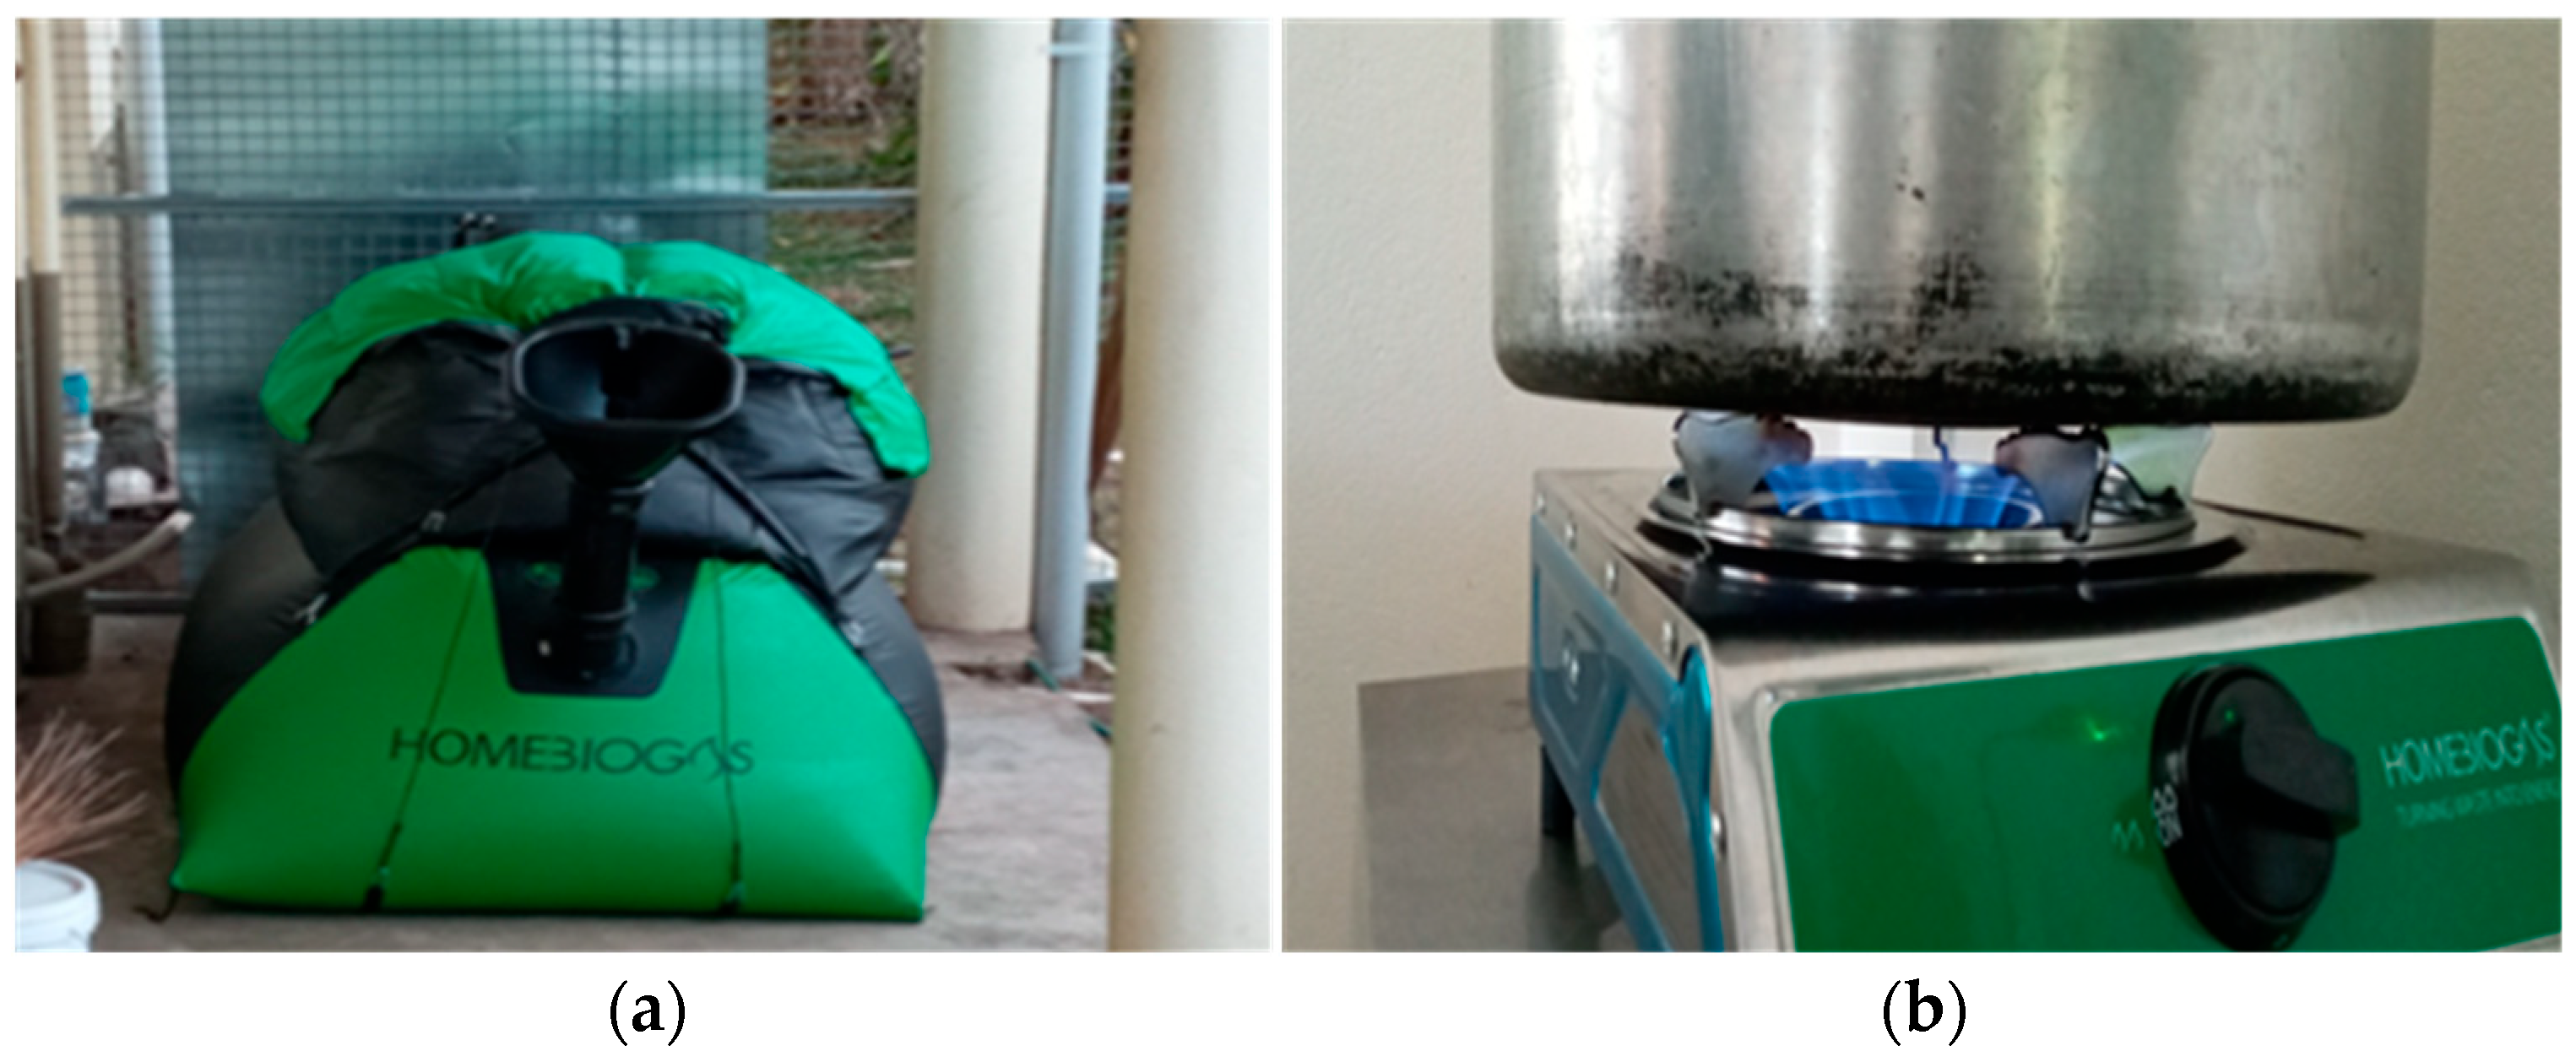
A Home Biogas 2.0 balloon digester, (HomeBiogas Ltd., Beit Yanai, Israel) was installed at Kamil Muslim College, Ba, Fiji, to generate cooking biogas from food waste produced from the school canteen (Figure 2).
In order to initiate the process, a slurry using a 1:1 ratio of 1200 L of water and 120 kg of fresh cow dung was made and filled into the digester. The 1:1 ratio was consistently maintained for the bench experiment and the home biogas empirical trials, as the Home Biogas 2.0 manufacturer recommended this ratio. The slurry was made using 20 L buckets in which 10 kg of fresh cow dung was mixed with 10 L of water and fed into the Home Biogas 2.0. The top pockets of the balloon were filled with 1 kg of fine sand in every pouch, adding up to 40 kg of fine sand in total to apply pressure to the gas chamber for a consistent flow of biogas through the gas pipes.
The experiment was conducted as described below using kitchen waste and cow dung as feedstocks.

Home Biogas 2.0

Biogas produced from kitchen waste and cow dung using Home Biogas 2.0 was studied. Home Biogas Case Study 1: 2.5 kg of 1 canteen kitchen waste was fed daily into the Home Biogas 2.0 after mixing it with 2.5 L of water to maintain a 1:1 ratio. A digital pH meter (Extech, model PH100, Nashua, NH, USA) was used to measure the pH of the mixture. The experiment on the canteen waste was conducted for 6 weeks and recorded. The daily cooking times from the low-pressure gas cooker installed at the canteen were monitored and recorded.
Kitchen waste was collected from the Kamil Muslim College canteen daily for the Home Biogas 2.0. The waste collected consisted of different types of organic waste, including onion, potato, and garlic peelings, as well as different vegetable waste, rice, bread, and leftover food, including curry and chicken bones. A separate bin was provided in the school canteen to collect the kitchen waste to exclude lemon and other citric fruits and unwanted inorganic wastes such as plastics, metals, and paper wrappers. The Citrus fruits (lemons and other acidic fruits) were separated from the rest of the waste in order to keep an optimal pH for Anaerobic Digestion.
Home Biogas Case Study 2: After a two-week waiting period, the experimentation with fresh cow dung commenced. An initial 2.5 kg mass of fresh cow dung was fed into the digester, mixed with water in a 1:1 ratio. The fresh cow dung was fed into the Home Biogas 2.0 daily for another 6 weeks. The volume of biogas and liquid digestate, together with the cooking time using biogas, was recorded daily. Since sufficient funding was not available to purchase a gas flow meter, the theoretical value was used in this study. Data analysis was conducted using MS Excel. For animal waste experimentation, fresh cow dung (FCD) was brought from a nearby small dairy farm located in Karavi, Ba.

2.3. Estimation of Biogas Volume

Since there was a lack of funding available, the biogas flow meter could not be purchased. The best traditional estimation method was used in this study, by considering the maximum biogas production and maximum cooking time provided by the manufacturer as the proxy. Using the theoretical maximum cooking time of two hours, the flow rate was estimated assuming a consistent volume of biogas being used for the two hours of cooking duration with the low-pressure stove supplied with the setup. Hence, considering this, the theoretical flow rate calculated was:
Theoretical flow rate = 0.7 m3/120 min = 5.83 × 10⁻³ m3·min−1
The daily cooking time was recorded and, then, the volume of biogas produced was estimated using the above theoretical flow rate.

2.4. Energy Content of Generated Biogas

The biogas production for cooking at the school canteen was estimated over four weeks and was extrapolated for the whole year. Using this, the energy content of the estimated biogas produced was calculated for kitchen waste and fresh cow dung, and compared to the energy content of a 12 kg LPG cylinder to estimate the number of 12 kg LPG cylinders that could be replaced if kitchen waste and cow dung were used with Home Biogas 2.0. The amount of energy present in each 12 kg LPG cylinder was found by noting the energy content of butane in the LPG cylinder itself.

2.5. Economic Analysis

An economic analysis was performed based on the extrapolated annual biogas production. The baseline used was the average cost of the 12 kg LPG cylinder in 2022. The following parameters were used to perform the economic analysis [13].

2.5.1. Net Present Value (NPV)

The Net Present Value (NPV) describes the difference between the present value of cash inflows and cash outflows over some time [13,16,17,18,19,20,21,22,23,24]. A positive NPV envisages a profitable project, while the reverse is true for a negative NPV. Equation (1) was used to calculate the NPV:
N P V = t = 1 T ( C t ( 1 + r ) t ) C 0 ,
where C t is the cash flow in year t, C0 is the total initial investment, r is the discount rate [%], t is the period [year], and T is the number of periods [years]. The discount rate used in this study is 10%, and the number of periods is set to 15 years, which is the lifespan of the Home Biogas 2.0.

2.5.2. Internal Rate of Return (IRR)

The Internal Rate of Return (IRR) is a discount rate that makes the NPV equal to zero; that is, the present value of the cash outflow is equal to the present value of the cash inflow [17,19,21,22]. With this method, the profitability of potential investments is estimated and calculated using Equation (2).
I R R = t = 1 T ( C t ( 1 + r ) t ) C 0 = 0 ,

2.5.3. Benefit Cost Ratio (BCR)

Benefit Cost Ratio (BCR) or Cost–Benefit Ratio is a profitability indicator used in cost–benefit analysis to determine the viability of cash flows generated from an asset or project [16]. The benefit–cost ratio is calculated using Equation (3):
B C R = P r e s e n t   V a l u e   o f   N e t   P o s i t i v e   C a s h   F l o w P r e s e n t   V a l u e   o f   N e t   N e g a t i v e   C a s h   F l o w

2.5.4. Payback Time (PB)

The Payback Time is the length of time required to cover the cost of an investment [21]. Equation (4) presents the PB time. A shorter payback time from a project is more desirable for investors.
PB = I n v e s t m e n t A n n u a l   C a s h   F l o w ,

2.5.5. Discounted Payback Period (DPBP)

The Discounted Payback Period (DPBP) is used to evaluate the profitability and timing of cash inflows of a project or investment by estimating the future cash flows adjusted for the time value of money. The discounted cash inflow for each period [16] is calculated using Equation (5):
D i s c o u n t e d   C a s h   I n f l o w = A c t u a l   C a s h   I n f l o w ( 1 + i ) n
where i is the discount rate, and n is the period to which the cash inflow relates.
The cumulative cash flow [24] is replaced by the cumulative discounted cash flow (Equation (6)).
D i s c o u n t e d   P a y b a c k   P e r i o d = A + B C
where A = last period with a negative discounted cumulative cash flow; B = Absolute value of discounted cumulative cash flow at the end of period A; C = Discounted cash flow during the period after A.

2.6. Avoided Carbon Emissions

The avoided carbon emissions by the use of biogas to cook for a household were calculated using Equation (7). The baseline used was that the energy generated from the implementation of WtE technology will offset the use of fossil fuel (LPG), which is used as cooking gas.
Avoided   carbon   emissions = ( 63.1 ) ( k g G J ) × E W t E ,
where EWtE is the energy generated from AD of organic waste in GJ per year, and 63.100 kg/GJ is the emission factor for LPG [25].

3. Results

The outcomes of the bench experiment and the balloon digester with two different feedstocks (canteen kitchen waste and fresh cow dung) are presented in this section.

3.1. Comparison of Biogas Production from Bench Experiments

The cumulative biogas production from the two bench experiments is presented in Figure 3. Bench Experiment 1 had canteen kitchen waste as feedstock, while Bench Experiment 2 had cow dung as feedstock. Both setups were under the same environmental conditions. Figure 3 shows that the biogas production from the kitchen waste commenced quickly, but it reached its peak within eight to nine days before tapering off completely thereafter. On the other hand, delayed biogas production from the fresh cow dung was noted, even if a higher volume of biogas was produced from cow dung in comparison to the kitchen waste. Liu et al. [26] conducted a study in China whereby food waste and sewage sludge were co-digested, so that the highest rate of biogas production occurred within the first two hours after each feeding across all test groups. This demonstrated the system’s rapid response to the intermittent introduction of these materials. Consequently, the combination of food waste and sewage sludge was considered an effective substrate for flexible biogas production.
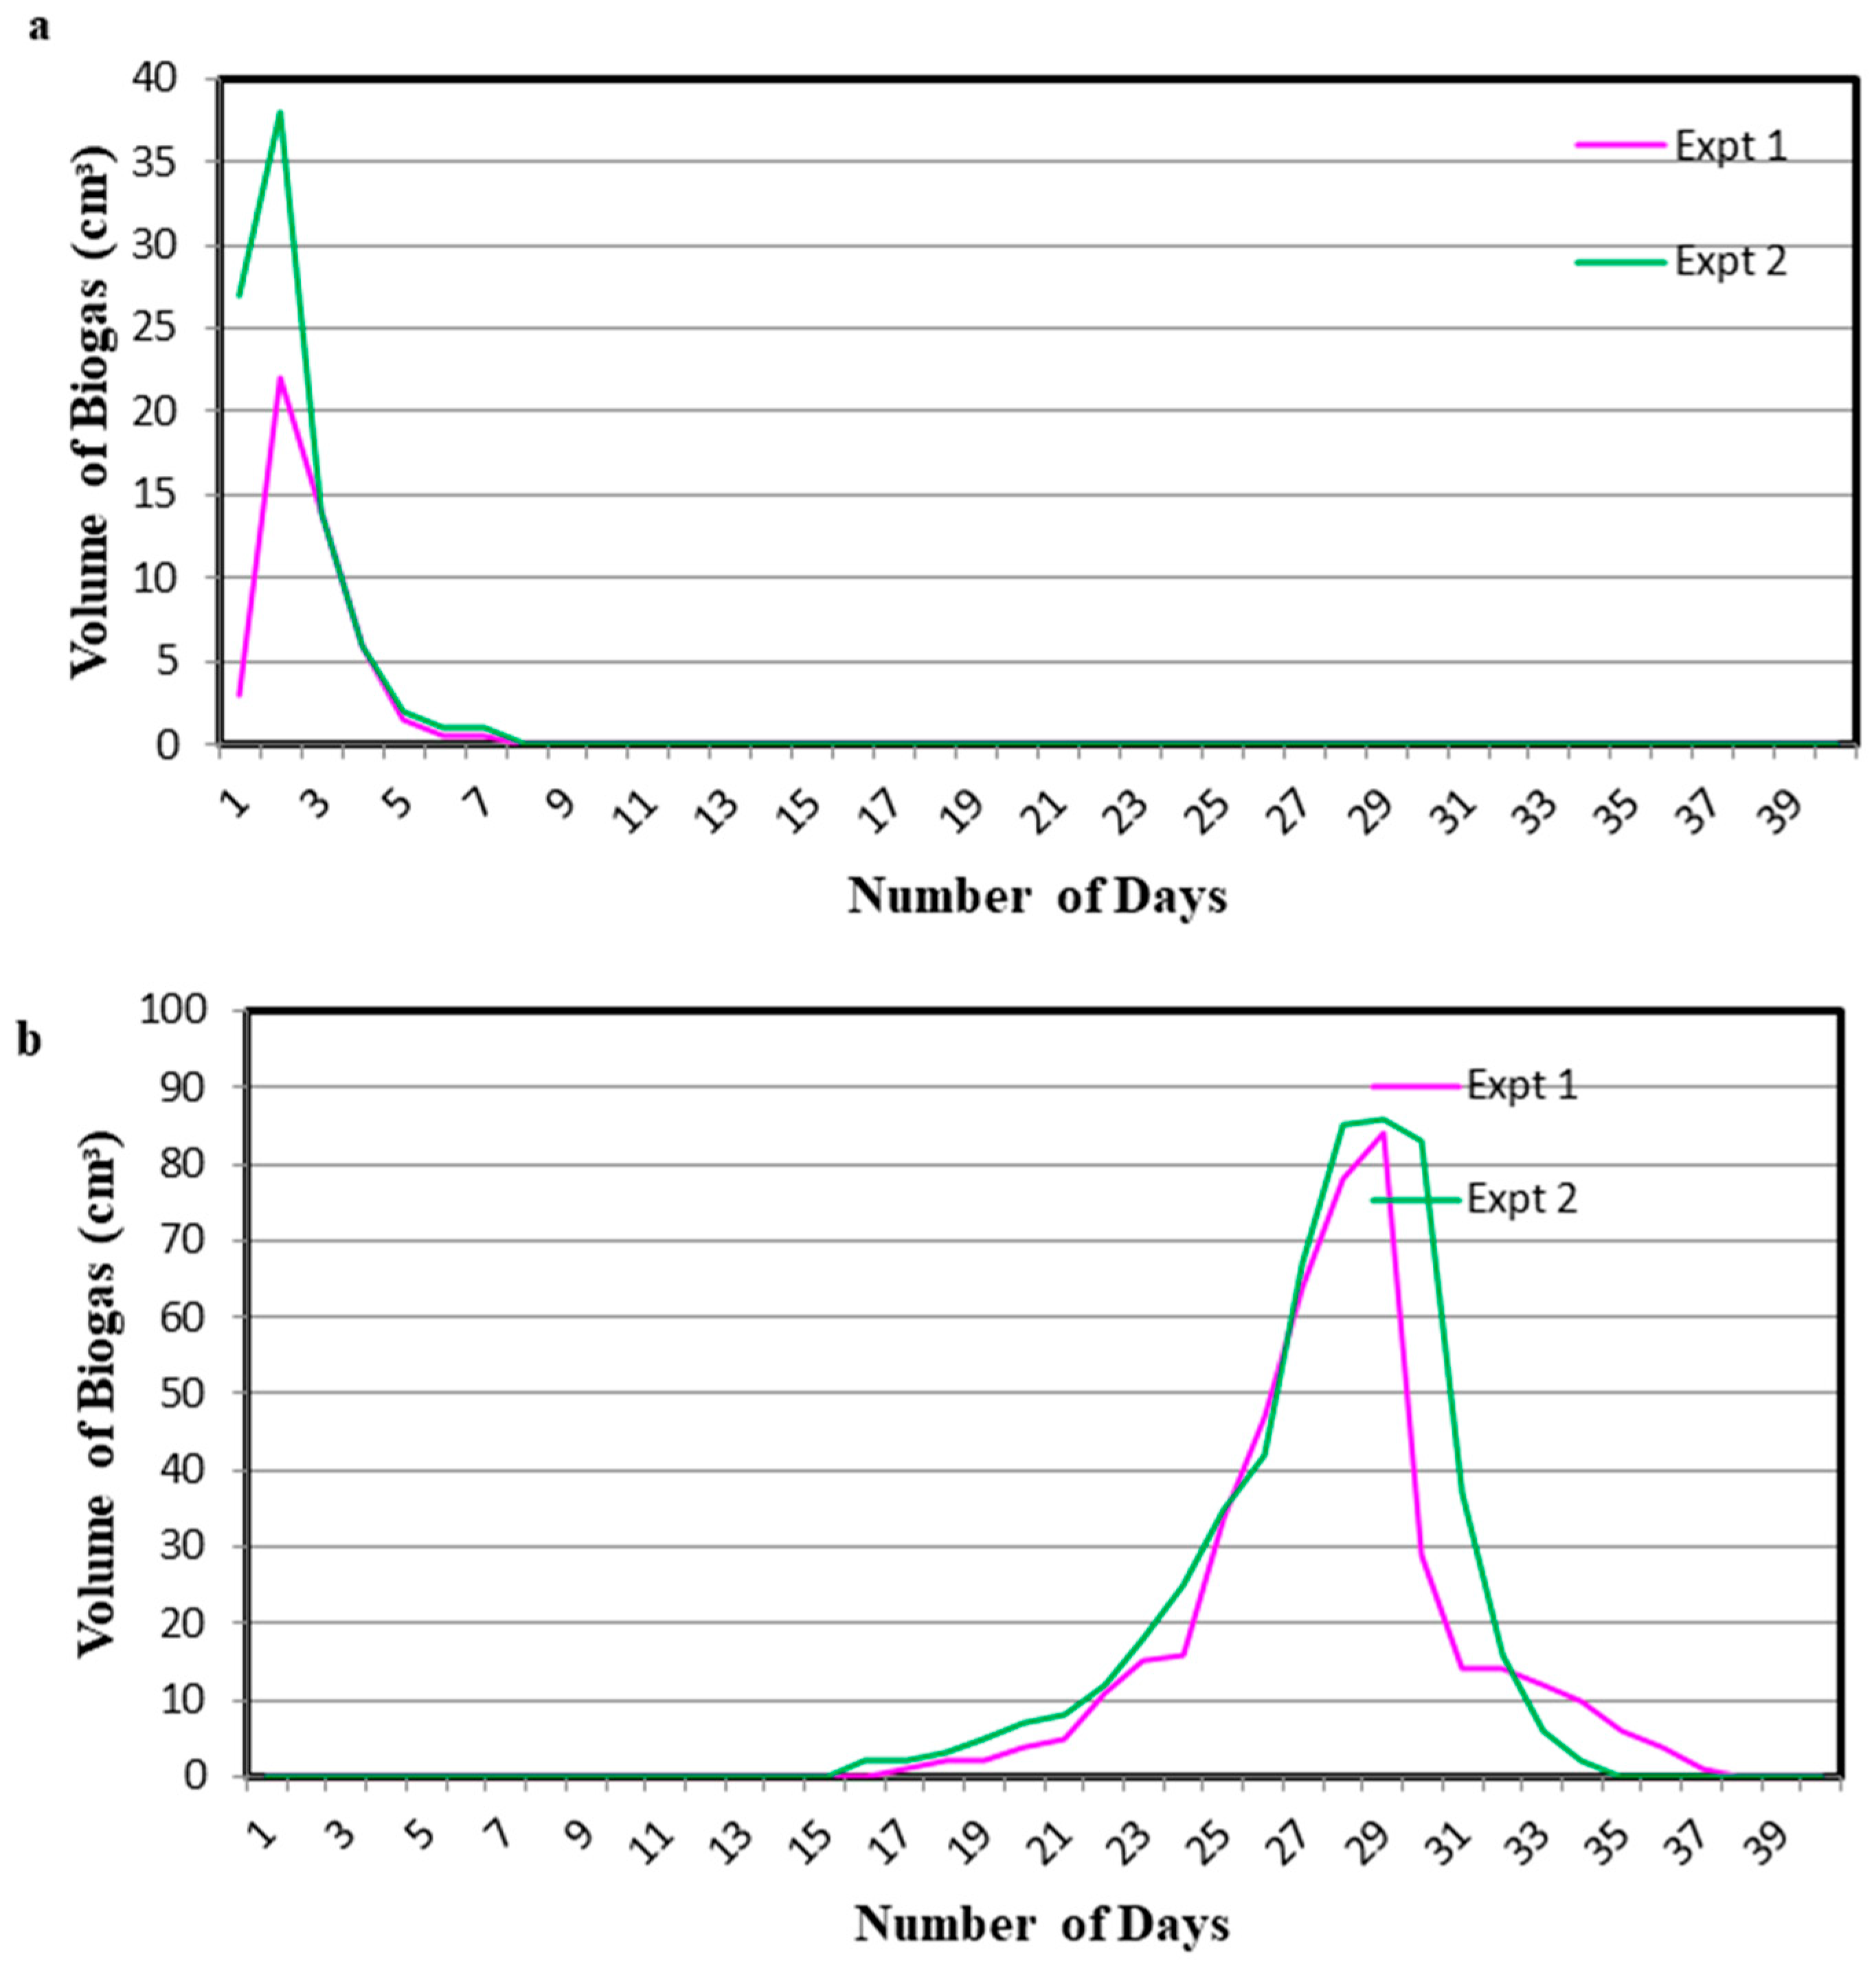
Figure 4a,b presents the additional two trials aimed at validating the outcomes of Trial 1 (Figure 3). Figure 4a further ascertains that the biogas generation from kitchen waste had a quick onset, but it stopped very quickly. However, the biogas production from fresh cow dung takes time to start (slow onset) and accumulatively produces more biogas compared to the kitchen waste (Figure 4b). Thus, it is evident that biogas production from fresh cow dung is preferable compared to kitchen waste for higher production of biogas at the household level.
This pattern from the bench experiments suggests that, at the household level, fresh cow dung offers a more reliable substrate for long-term biogas generation compared to kitchen waste alone. These findings align closely with previous research. Al-Wahaibi et al. [27] observed that biogas production from cow dung progresses more slowly, due to its complex lignocellulosic structure and high total solids content, which extends the hydrolysis phase required for microbial activity. Conversely, kitchen waste, with its smaller particle size and higher carbohydrate content, provides more readily available organic matter, leading to a quicker but less sustained biogas yield. Furthermore, challenges such as acidic conditions or high fat and protein concentrations in kitchen waste can negatively impact digestion efficiency, ultimately reducing biogas output. At the same time, Pati et al. [28] emphasised that the co-digestion of cow dung with kitchen waste produces superior results compared to either feedstock alone. Cow dung not only provides the necessary microbial inoculum but also contributes to buffering capacity, thereby stabilising the anaerobic digestion process. The optimal performance, however, depends on factors such as substrate ratios, temperature, pH, and solid-to-water balance. Taken together, these results reinforce the importance of cow dung both as a primary substrate for steady biogas production and as a complementary feedstock when co-digested with kitchen waste to maximise process efficiency and biogas quality.

3.2. Optimising Biogas Production from Kitchen Waste

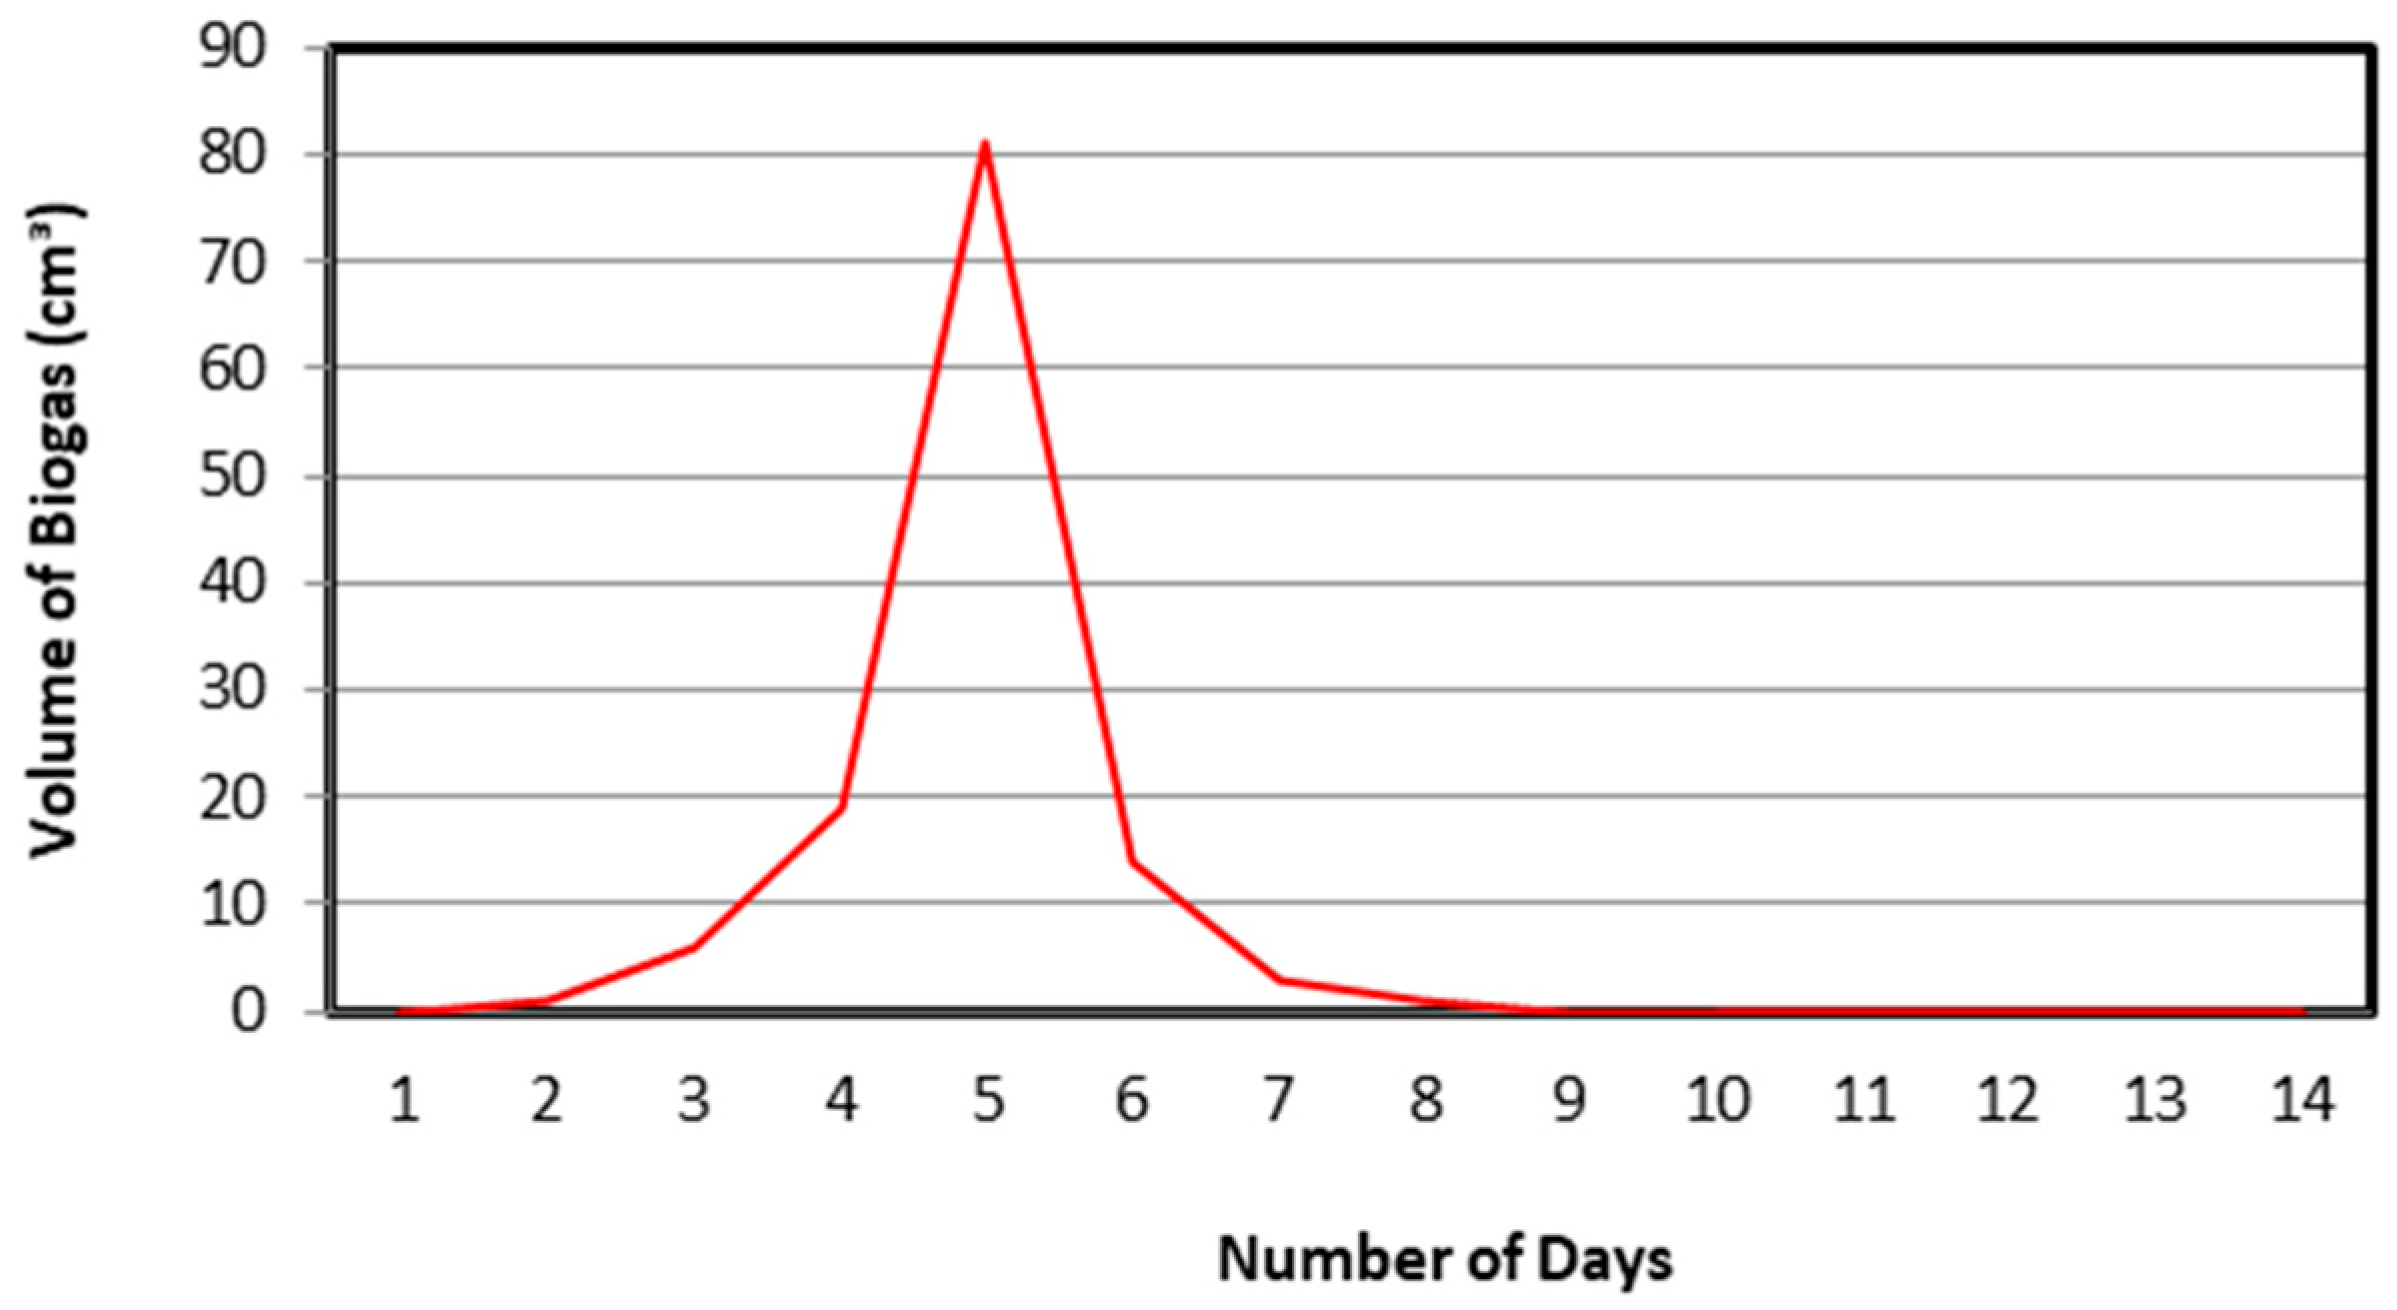
Since the purpose of a home digester is to be used at the household level with kitchen waste, it is important to optimise and maximise the production of biogas from kitchen waste substrates, thus achieving the maximum benefit. The C:N ratio is a critical factor in the anaerobic digestion process, which impacts the balance of nutrients in the input materials and, therefore, the activity of the bacteria involved in the process reactions [29]. Hence, analysing the composition of the canteen kitchen waste revealed high amounts of rice (~60% ref. Table 1). Rice has high starch content that potentially disrupts the C:N ratio. Consequently, Bench Experiment Trial 4 investigated the effect of excluding rice from the production of biogas. Figure 5 shows the amount of biogas produced from the kitchen waste, including the cowpea waste and pumpkin peelings, and excluding rice. It is evident from Figure 5 that the production of biogas started on the second day of the experimentation and followed a gradually increasing trend. It reached peak production of 81 cm3 on the fifth day, after which a decrease in production rate was recorded for the rest of the period. The production became zero on the eighth day of experimentation, and it continued to be zero until the final day. It was evident that rice did not have the right C:N in the range of 25 to 35 to keep microorganisms active, so that the exclusion of rice increased the biogas production.
Despite rice possessing considerably higher carbohydrate content in comparison to its nitrogen content, which is opposite to animal manure, the variability in the performance of AD across different climatic and geographical regions, especially in areas with high rice consumption and production, necessitates a more localised optimisation of the process parameters [30]. In a study by Mrosso et al. [31], they found that the highest amount of biogas was produced by cooked rice in comparison to cabbage and suggested that cooked rice waste could be used for mono-digested biogas production. The authors also claimed that no published work showed a higher biogas yield than the current study. However, there have been mixed outcomes with co-digestion with vegetable waste. In a study by Glivin and Sekhah [32], the analytical biogas production study showed that the percentage composition of methane was 66.97% from cow dung, 53.97% from rice waste, 53.01% from vegetable waste, and 53.12% from a mixture of rice and vegetable wastes. The experimental biogas production percentages from these substrates resulted in 61.13, 52.98, 52.01, and 51.11%, respectively.

3.3. Case Study of Home Biogas 2.0

Since installation, the Home Biogas 2.0 has converted over 2737.5 kg of waste into clean cooking energy.

3.3.1. Home Biogas Case Study 1—Vegetable Waste Substrate

For this case study, the process began by depositing organic kitchen waste, such as vegetable peels, leftover food, and other biodegradable materials (Table 2) into the Home Biogas digester. The Home Biogas digester uses anaerobic bacteria to break down the biowaste, producing biogas and liquid digestate as by-products. The captured biogas, primarily composed of biomethane, can be conveniently used for cooking, providing a sustainable alternative to traditional fossil fuels. At the same time, a nutrient-dense liquid digestate is produced, which is beneficial for boosting the fertility of soil in gardens or for plants grown at home. The vegetable scraps predominantly consisted of carbohydrates like rice and bread, along with vegetable remains such as potato, dalo, and onion skins. It was observed that the environmental average temperature around the flexible balloon digester stood at 26.4 °C.
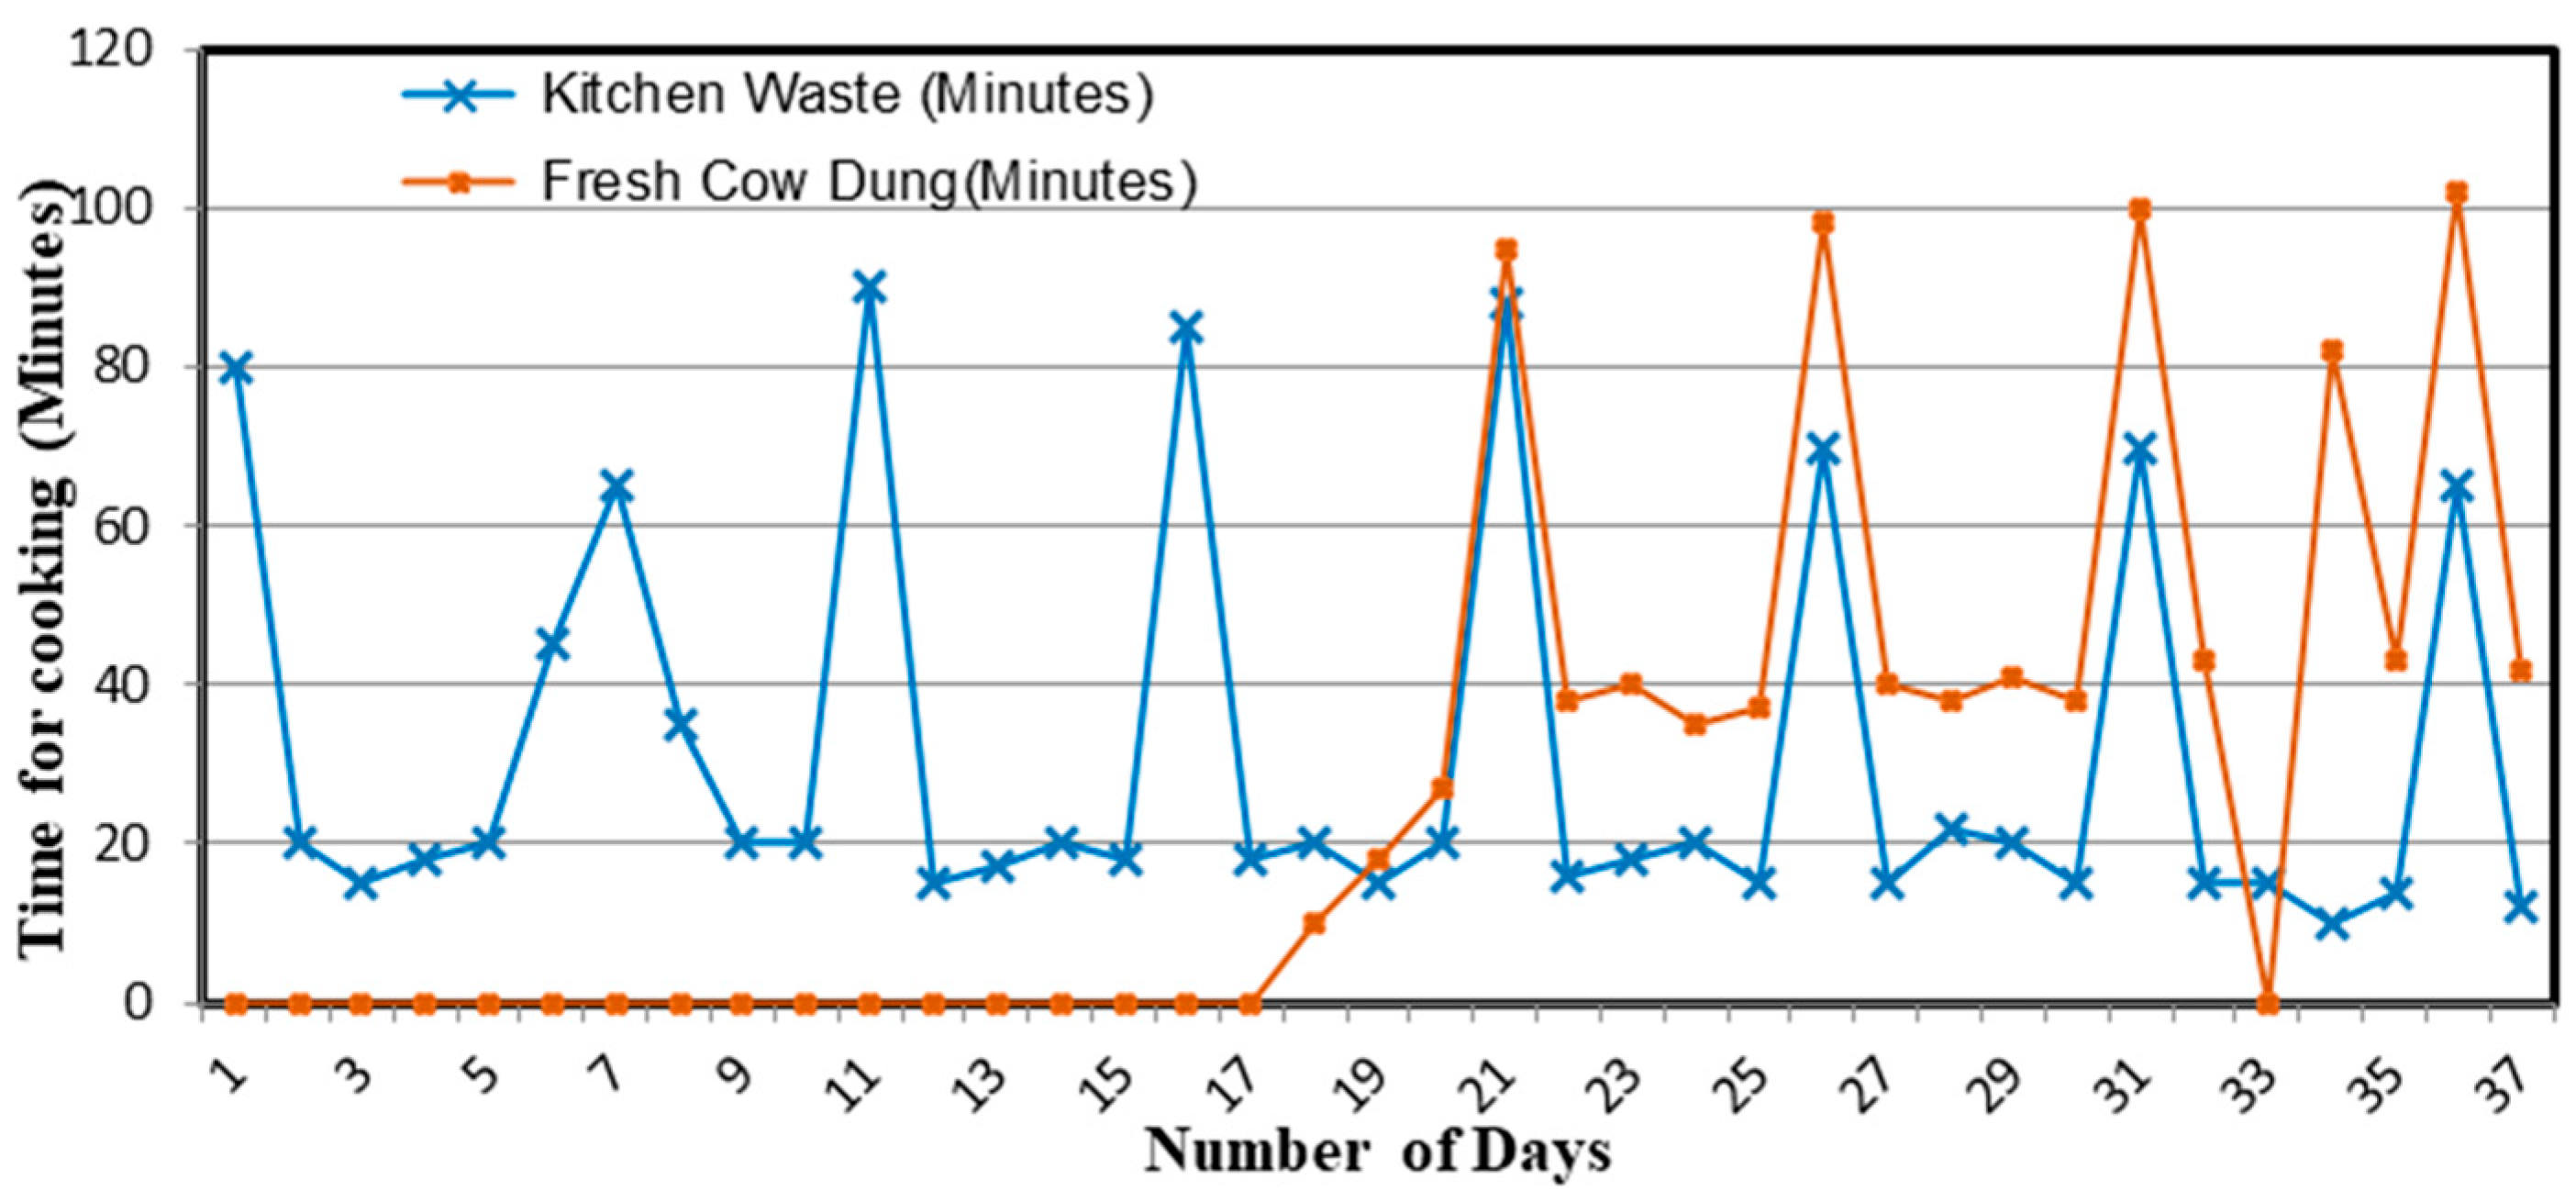
Figure 6 illustrates the cooking duration and the respective number of days of experimentation using Home Biogas 2.0 with vegetable scraps. All procedures as per the biodigester manual were closely followed, but the types of vegetable waste varied daily, depending on what was available in the school canteen.
The cooking time on the first day of biogas generation was 80 min. After the production of the biogas stabilised, the peak cooking time during the four weeks of feeding after the weekends was recorded to be 90, 85, 88, and 70 min, respectively. The average cooking time is just below 20 min with vegetable waste for the rest of the days of the week.
It was anticipated that the flexible balloon digester could generate up to two hours (120 min) of cooking biogas daily using food waste; however, this was not reached during our experimental period, for which a maximum of 90 min was recorded. In addition, it was observed that the longest cooking times occurred on Mondays, suggesting that the flexible balloon digester accumulated more biogas over the weekends. Consequently, the average daily output of liquid digestate (biofertiliser) was noted to be 4.82 L.

3.3.2. Home Biogas Case Study 2—Fresh Cow Dung Substrate

Using fresh cow dung as feedstock in home digesters for the production of biogas has shown some promising results, as shown in Figure 6. The maximum cooking time recorded using biogas from cow dung was 102 min, surpassing the peak cooking duration with vegetable waste by 12 min. Additionally, the average cooking time exceeded 35 min when cow dung was used. The digestate collected daily is shown in Table 3. This experimental trial yielded over 4.5 L of liquid digestate daily with an average daily digestate yield of 4.76 L (Table 3). The environmental temperature around the flexible digester was 26.5 °C.
The efficiency of biogas production from cow dung is not only influenced by temperature but also by the nutrient content and composition of the substrate. The microbiome responsible for anaerobic digestion relies on a balanced combination of organic materials, such as carbon and nitrogen, present in the feedstock [29,33]. Furthermore, the hydraulic retention time (HRT) of the substrate within the digester, the ratio of carbon to nitrogen, and the pH of the system are essential factors that demand close attention for achieving optimal biogas yields [29]. Ongoing research and advancements in process control technologies continue to enhance understanding of these intricate interactions, paving the way for more efficient and sustainable biogas production systems.
The use of cow dung in biogas production serves a dual purpose that addresses waste management by converting organic waste into a valuable energy resource, while also mitigating environmental issues associated with traditional waste disposal methods. Using Home Biogas 2.0, individuals not only reduce their carbon footprint but also play a role in fostering a more sustainable and eco-friendly lifestyle. The integration of cow dung as a feedstock underscores the versatility and practicality of biogas systems, showcasing their potential as a viable and accessible solution for decentralised bioenergy production.

3.4. Economic Analysis Outcomes

3.4.1. Using Theoretical Values Estimation Approach

Using the theoretical maximum cooking time of two hours (according to the supplier’s specifications) and the maximum volume of gas as 0.7 m3 (when the gas chamber is full), the gas flow rate was estimated as:
Flow rate = 0.7 m3/120 min = 5.83 × 10⁻³ m3·min−1
Using this flow rate, the total volume of biogas produced in four weeks was calculated to be:
Volume of Biogas = 5.83 × 10⁻³ m3/min × 3360 min = 19.59 m3
The Lower Heating Value (LHV) of biogas typically ranges from 16 to 28 MJ/m3 [34]. Using these values, the average LHV was determined to be:
L H V a v e = 16 M J m 3 + 28   M J m 3 2
Using the average value of LHV, the energy content of biogas produced over 4 weeks was found to be:
19.59 m3 × 22 MJ/m3 = 430.95 MJ.
Extrapolating this magnitude, the annual biogas production is expected to be:
430.95 MJ × 13 = 5602.35 MJ.
According to Putti et al. [35], the annual cooking thermal energy requirement is ca. 3840 MJ per household of four members. This assumption is also used by the Government of Fiji for its household energy consumption estimations, and the same approximation has been adopted in this study. In Fiji, the 12 kg LPG cylinder, which contains 100% butane, is being used for household clean cooking. The energy content of n-butane is cited as 49.5 MJ/kg in the Natural Gas Conversion Guide by the International Gas Union [36]. Considering that the 12 kg LPG cylinder contains 100% butane, the total energy content of the cylinder amounts to 49.5 MJ/kg × 12 kg = 594 MJ. Using the energy consumption as 3840 MJ, a total of 6.5 cylinders is required per household to satisfy the annual cooking thermal energy needs.
Based on the potential biogas production, energy that is equivalent to 9.4 LPG 12 kg standard cylinders can be produced from the biogas system. The cost of a 12 kg LPG cylinder per month in 2022 is shown in Figure 7. The average cost of a 12 kg LPG cylinder was calculated as $45.05 and used in the economic analysis.
Moreover, using the theoretical value of 9.4 LPG 12 kg standard cylinders and the average price of $45.05 per 12 kg LPG cylinder, the amount of savings that can be accumulated over a year is determined to be $423.47.
The IRR, NPV, and BCR are important in understanding the viability of a project. Table 3 presents the IRR, NPV, and BCR outcomes using the theoretical specifications. The IRR is a parameter that can be used to estimate the return on investment. In this case, using the theoretical specifications, the IRR was found to be 11%. It indicates that the investment is going to have good returns.
In addition, the cost–benefit analysis, via BCR, is a systematic method for quantifying and, then, comparing the costs to the total expected rewards of undertaking a project or making an investment. If the benefits highly outweigh the costs, the decision should go ahead; otherwise, it should probably not. In this study, the BCR was found to be 0.833, which is below 1.0, indicating that the cost outweighs the benefit; however, this BCR computation does not consider other benefits such as the production of liquid digestate (biofertiliser). The DPBP, which is an important parameter for evaluating the profitability of investment, was found to be ca. 14.5 years, based on the theoretical specifications (Table 4) and the manufacturer’s estimate of a life span of 15 years. Hence, the DPBP is within the range of the durability of the project, showing that the project is feasible.

3.4.2. Economic Analysis for Biogas Generation from Kitchen Vegetable Waste

In order to ascertain the maximum achievable economic value, the peak cooking times of 80, 65, 90, and 88 min, respectively (Figure 6), were used to compute an average peak cooking time of 81 min.
The feeding was continuously carried out but there was no constant rate of production. The production was dependent upon the type of vegetable waste being fed into the Home Biogas 2.0. The cooking time reached its peak on Mondays of the week when more time was given for biogas production during the weekends.
Consequently, assuming that the biogas production is 81 min daily and, using the flow rate as 5.83 × 10⁻³ m3/min, the average production of biogas per day was calculated as 0.49 m3, which gives an energy content of 10.34 MJ, provided an energy content of 22 MJ/m3. This corresponds to 289.52 MJ per month (4 weeks) and 3763.76 MJ per year of energy that can be harnessed from the digester.
Assuming that the 12 kg LPG cylinder has an energy content of 594 MJ with a price of $45.05, the annual accumulated saving of $285.45 is determined.
Furthermore, the economic analysis using the vegetable waste approximations showed that the IRR was 5%, which shows that the investment is not going to have a good return (Table 3). The BCR was determined as 0.56, which is below 1.0, indicating that costs are higher than the benefits. Other benefits, such as the production of liquid digestate (biofertiliser), have not been included in this calculation. The Discounted Pay Back Period for the biogas production from vegetable waste is over 50 years, which exceeds the warranty period of 15 years of Home Biogas 2.0. Therefore, it can be stated that biogas production with vegetable waste only is not economically viable.

3.4.3. Economic Analysis for Biogas Generation from Fresh Cow Dung

Similarly, to the kitchen waste analysis, also for fresh cow dung the peak cooking time was observed on Mondays. It was noted that the peak cooking time with biogas generated from fresh cow dung over four weeks was 95, 98, 100, and 102 min, respectively (Figure 6). The average peak production time was computed as 99 min.
Using the flow rate as 5.83 × 10⁻³ m3/min, the average production of biogas per day is computed to be 0.58 m3, which corresponds to an energy content of 12.76 MJ, provided an energy content of 22 MJ/m3. The total energy that can be harnessed annually amounts to 4644.64 MJ. Using the same assumption as in the previous section, 7.82 LPG 12 kg cylinders worth of energy can be produced from this system, which is more than the amount produced when kitchen substrate is used. Consequently, this amounts to a saving of $352.29 over a year.
A further economic analysis of biogas produced from fresh cow dung revealed that the IRR was 8% revealing a good investment return. The BCR of 0.69338 and DPBP of 26.48 years suggest that this system is not economically viable, but this analysis does not take into account other additional benefits, such as the production of liquid digestate (bio-fertiliser) and the reduction in greenhouse gas emissions.

3.5. Sensitivity Analysis

A sensitivity analysis is an integral part of anaerobic digestion modelling. The analysis helps in understanding the robustness of the system and optimising its performance. It is far more reliable to make predictions based on a detailed analysis of all the variables. As such, Table 5a–c presents different prices that have been used to carry out a sensitivity analysis on the economic viability of the production of biogas by means of Home Biogas 2.0. The parameters, such as the feedstock composition, environmental temperature, pH level, loading rate, and hydraulic retention time, have been assumed to be constant.
Thus, as the price of LPG rises (Table 5a–c), the financial parameters associated with a project or investment exhibit distinct changes. The IRR experiences a decline, reflecting the reduced profitability of the venture. Conversely, the NPV shows an increase, indicating a potentially higher overall economic benefit despite the escalating LPG costs. The Benefit Cost Ratio also sees an uptick, suggesting that the benefits derived from the project outweigh the costs to a greater extent. Additionally, the DPBP decreases, implying a shorter time frame for recovering the initial investment as the project becomes more economically viable with higher LPG prices. This interplay of financial indicators underscores the sensitivity of project viability to changes in LPG costs.

3.6. Economic Analysis Considering Income from Liquid Digestate

Considering that farmers can install the Home Biogas 2.0 in their households in remote and rural areas and use the liquid digestate as organic fertiliser for at least $2 per liter instead of purchasing fertilisers, which is an added advantage. The market for liquid fertiliser is not well developed on the islands; hence, the best estimate was ascertained through a survey. Taking different prices for 12 kg LPG cylinders ($40.00, $45.05, and $50.00) and carrying out the economic analysis, it was found that when fresh cow dung is used and analysis is carried out at $50.00 for the price of 12 kg LPG cylinder with the liquid digestate, the viability of the project increases. Table 5c (i.e., Average LPG 12 kg Cylinder Price: $50.00) under sensitivity analysis shows the economic analysis with the best outcomes, yielding an IRR of 67%, a NPV of $12,364.30, a Benefit Cost Ratio (BCR) of 5.12, and a Discounted Payback Period (DPP) of 1.28 years. In comparison, the economic benefits of vegetable waste are a bit low under a similar scenario, despite including the economic benefit of liquid digestate (IRR = 65%, NPV = $11,824.20, BCR = 4.94, and DPBP = 1.79 years).
There have been limited studies on full economic analysis of home biogas digesters and, hence, it is difficult to perform a direct comparison with these studies. Obileke et al. [38] conducted a feasibility study of digester made from composite materials comprising high-density polyethylene (HDPE), bricks and cement in South Africa. For this digester, the total initial cost was found to be $1623.41 with an IRR of 8.5%, a DPP of 2 years and a NPV of $1783.10. In Ngoma, Rwanda, Home Biogas costs $1000 to install and was expected to produce six hours of cooking energy from the dung of one or two cows [39].

3.7. Estimated Carbon Emission Reduction

An estimation of the total carbon emission reduction that could be achieved from using waste at a single Home Biogas 2.0 technology level was determined by estimating the energy generation capacity of anaerobic digestion. The energy available was used to determine the carbon emissions reduction and to approximate total displacement in LPG cylinders for clean cooking in households.
Since the installation of the Home Biogas 2.0 in August 2020, approximately 2737.5 kg of kitchen waste has been digested by the digester. The figure is based on an average production of 2.5 kg of kitchen waste daily for a period of 3 years.
The maximum amount of energy that can be replaced annually by using Home Biogas 2.0 with fresh cow dung is 4644.64 MJ (Section 3.4.2). The avoided carbon emissions from the use of fresh cow dung and vegetable waste in Home Biogas 2.0 for energy generation for cooking through AD were determined to be 293.10 kg CO2/year and 273.51 kg CO2/year using Equations (8) and (9) [25], respectively. It was assumed that the energy generated from the implementation of WtE technology would offset the use of fossil fuel (LPG 12 kg cylinders) used for cooking.
Avoided   carbon   emissions = ( 63.100 ) ( k g G J ) × E Fresh Cow Dung   ( GJ ) = ( 63.100 ) ( k g C O 2 G J )   ×   4.645   ( G J a n n u m ) = 293.10   k g C O 2 / year
Avoided   carbon   emissions = ( 63.100 ) ( k g G J ) × E Vegetable   Waste     ( GJ ) = ( 63.100 ) ( k g C O 2 G J )   ×   3.764   ( G J a n n u m ) = 237.51   k g C O 2 / year
Since in this case the LPG is being replaced with biogas, an energy comparison is used to determine the avoided carbon emissions. The avoided carbon emissions are calculated depending on the amount of energy that is being displaced with the different substrates using the Home Biogas 2.0 [25].

4. Discussion

The substrate characteristics significantly affect biogas yield: cooked rice has a considerably higher carbohydrate content (92.24% VS) in comparison to its protein content (7.13% VS), which is opposite in case of animal manure (cow dung). Food waste derived from white rice has higher biogas yield compared to pigmented ones. The optimum C/N ratio for AD is between 20 and 30, since lower values reduce microbial activity while higher ones result in lower biogas production [30].
The above results of the bench experiments can be compared to those obtained by Mrosso et al. [31]. In their study, ten substrates of kitchen waste and Municipal Solid Waste (MSW) were mono-digested for biogas production in batch reactors, where cabbage showed a 96.36 ± 1.73% VS and a biogas yield of 800 ± 8.8 mL within 10 days, while cooked rice had an 83.00 ± 1.49% VS and a biogas yield of 2821 ± 31.03 mL within 28 days. The C/N ratio for cabbage and cooked rice waste was 13.9 and 30.9, respectively, whereas their pH values were 6.2 and 7.2, respectively. Therefore, cooked rice waste could be mono-digested for biogas production and no published work showed a high yield as their study, while the other substrates require co-digestion in order to improve the biogas yield.
The bench experiments provide a valuable platform for the scientific community to develop and refine biogas production techniques, ultimately contributing to more sustainable and efficient bioenergy solutions. Additionally, bench experiments enable the testing of various substrates and microbial cultures systematically, allowing researchers to assess which combinations result in the most efficient and robust biogas generation. The controlled environment also facilitates real-time monitoring and data collection, enabling researchers to fine-tune parameters for maximum biogas production. In this study, the outcomes of the bench experiments have shown that an effective and optimised biogas production is essential. In a laboratory setting, researchers can meticulously manipulate variables such as temperature, pH, and substrate composition to create an ideal environment for the growth and activity of methane-producing microorganisms. This level of precision allows for the identification of optimal conditions for the biogas production process, leading to higher yields. The feed composition is responsible for the variations in biogas yields with wastes that are rich in carbohydrate and fiber content, such as rice waste, carrying remarkable potential for biogas and biomethane yields [27].
In addition, kitchen waste is typically rich in carbohydrates and proteins, whereas cow dung primarily contains digested plant material, fibers, and microbial biomass. It is high in organic matter content and microbial activity. Generally, kitchen waste can produce significant amounts of biogas rich in biomethane, and fresh cow dung typically yields substantial amounts of biogas, due to its high organic matter content and microbial activity. However, a drawback with the kitchen waste substrate was the foam production, which could have been another reason for the low biogas production. In order to mitigate the negative effects of foam production on biogas production, operators may employ various strategies such as adjusting substrate composition, optimising operating conditions (e.g., temperature and pH), introducing anti-foaming agents, enhancing mixing techniques, and implementing foam control systems [40]. Biogas production is highly dependent on the temperature of the anaerobic digestion process, which typically works best in a mesophilic (temperature of 25–45 °C) or thermophilic (temperature of 45–70 °C) range, depending on the specific bacteria involved [29].
The economic analysis revealed favourable outcomes from the effective combination of using liquid fertiliser with biogas from fresh cow dung for clean cooking, which has proven to have co-benefits in agricultural settings. Farmers who adopt this integrated approach witness improved crop performance, reduced input costs, and a more sustainable and efficient use of resources.
When kitchen food waste is discarded, all inputs used in producing, processing, transporting, preparing, and storing discarded food are also wasted. The connection between food loss and waste and climate change is increasingly recognised as important, with the link between climate change, agriculture, and supply chain resiliency. The fact is that the 1.3 gigatons of edible food waste releases 3.3 gigatons equivalent of carbon dioxide (CO2), meaning that for every 1 kg of food waste, just over 2.5 kg of CO2 is emitted. Hence, when food ends up in landfills, it generates methane, a greenhouse gas 25 times more potent than CO2 [41]. Clean cooking is one of the achievement indicators of sustainable development, and biogas production through renewable means, using flexible balloon digesters, is supporting the NDC targets as well.
In the rural and remote areas of Fiji, traditional cooking methods often rely on firewood or charcoal, contributing to deforestation and air pollution [7]. In communities where households typically consist of up to four members, this innovative technology can make a significant impact. By embracing Home Biogas 2.0, rural and remote households in Fiji can enjoy sustainable cooking solutions while contributing to environmental conservation efforts.
As with other studies, there are some limitations to this study, too. The gas flow-rate meter was also not available, so estimates were used that might have induced uncertainties. Hence, the results need to be used with caution. In addition, only one trial was performed with the exclusion of rice from substrates. Additional trials without rice are necessary with different combinations to ascertain the best substrate combination. In addition, this study is constrained by its reliance on theoretical values and extrapolations in the absence of direct measurements of gas flow rates or energy content. Consequently, the economic results remain speculative, as the assumptions underlying the IRR, NPV, and BCR calculations are not sufficiently supported by empirical data or comparable studies. Further research needs to integrate co-digestion and the use of flow meters to optimise biogas production. In addition, biogas purification through the scrubbing method is a promising approach to enhance the energy density of this renewable fuel source. The scrubbing method involves the removal of impurities, such as hydrogen sulfide and carbon dioxide, from biogas using a liquid absorbent. There is a genuine need for a study on the durability of the Home Biogas 2.0, since the manufacturers recommend it lasts for 15 years. Studying the durability of Home Biogas 2.0 in the harsh conditions of the Fiji Islands is imperative for ensuring sustainable and reliable energy solutions. The unique environmental challenges posed by the islands, including high temperatures, humidity, and exposure to saltwater, necessitate a thorough examination of how Home Biogas 2.0 withstands these conditions.

5. Conclusions

Generating energy in small islands has always been a challenge, and addressing the issues of waste management is quite costly. This study was conducted to determine the feasibility of a small-scale balloon digester that converts household organic kitchen waste to biogas for cooking. The amount of energy generated through the production of biogas from the Home Biogas 2.0 installed at Kamil Muslim College was ascertained by feeding different organic waste, mainly the kitchen waste from the school canteen, and fresh cow dung.
The bench experimental setup generated a higher volume of biogas compared to the trials conducted with Home Biogas 2.0. The optimal biogas production in the bench experiment when fresh cow dung was used resulted in a cumulative output of 541 mL, while using vegetable waste (excluding rice), the most favourable outcome was achieved, yielding 125 mL of biogas.
Moreover, it was found that when peak cooking time was considered, fresh cow dung had the maximum cooking time with the annual energy harnessed from the generated biogas of 4644.64 MJ, whereas vegetable waste had less annual energy harnessed from the generated biogas, which amounted to 3763.76 MJ. The results showed that with fresh cow dung, 7.82 12 kg LPG cylinders can be replaced, while the use of vegetable waste can replace 6.34 12 kg LPG cylinders. The biogas produced during peak cooking times with fresh cow dung surpassed the annual cooking thermal energy requirement of 3840 MJ per household consisting of two adults and two children.
Furthermore, the most favourable economic outcome was observed when liquid digestate (biofertiliser) and clean cooking with biogas from fresh cow dung were combined, yielding an Internal Rate of Return (IRR) of 67%, a Net Present Value (NPV) of $12,364.30, a Benefit Cost Ratio (BCR) of 5.12, and a Discounted Payback Period of 1.28 years. The synergistic combination of liquid digestate application and the use of clean cooking with biogas derived from fresh cow dung has proven to yield the most favourable economic outcomes in agricultural settings, addressing both the environmental and economic challenges faced by farmers.
It has been estimated that the Home Biogas 2.0 digester will be able to reduce the GHG emissions by 293.10 kg CO2/year with fresh cow dung and 237.51 kg CO2/year with vegetable waste. This digester is feasible for rural and remote areas of Fiji where fresh cow dung is available and the digestate can be used as organic fertiliser, reducing the cost of buying fertilisers. Moreover, this digester is feasible elsewhere, in all the islands of developing and developed countries having characteristics similar to Fiji Islands.
In fact, Home Biogas 2.0 is a very environmentally friendly and climate-smart agricultural technology that is very useful for people living in rural and remote areas. It benefits by reducing organic waste and changing to pure-blue gas that is free and it also helps reduce carbon footprints.

Author Contributions

Conceptualization, R.R.P. and R.P.; methodology, R.R.P., M.K.N. and R.P.; validation, R.P., M.K.N. and R.R.P.; formal analysis, R.R.P.; investigation, R.R.P. resources, R.P. and R.R.P.; data curation, R.R.P., M.K.N., S.V.L. and R.P.; writing—original draft preparation, S.V.L., R.R.P., R.P. and A.C.; writing—review and editing, A.C., R.P. and D.C.; visualization, R.R.P., S.V.L. and D.C.; supervision, R.P. and M.K.N.; project administration, R.R.P. and R.P.; funding acquisition, R.R.P. All authors have read and agreed to the published version of the manuscript.

Funding

This research was funded by the Fiji Water Foundation (Education Grant 2020—Kamil Muslim College).

Data Availability Statement

The original contributions presented in this study are included in the article. Further inquiries can be directed to the corresponding author.

Acknowledgments

A grant from the Fiji Water Foundation led to the installation of a Home Biogas 2.0 digester at Kamil Muslim College, Ba, Fiji, and the authors are thankful to the Fiji Water Foundation.

Conflicts of Interest

The authors declare no conflicts of interest.

References

  1. Achakulwisut, P.; Erickson, P.; Guivarch, C.; Schaeffer, R.; Brutschin, E.; Pye, S. Global fossil fuel reduction pathways under different climate mitigation strategies and ambitions. Nat. Commun. 2023, 14, 5425. [Google Scholar] [CrossRef] [PubMed]
  2. REN 21. Renewables 2024 Global Status Report Collection, Global Overview. 2024. Available online: https://www.ren21.net/gsr-2024/modules/global_overview/ (accessed on 1 July 2025).
  3. Energy Fiji Limited. 2023 Annual Report. 2023. Available online: https://www.parliament.gov.fj/wp-content/uploads/2024/07/69-Energy-Fiji-Limited-Annual-Report-2023.pdf (accessed on 1 July 2025).
  4. Government of Fiji. Republic of Fiji National Energy Policy 2023–2030; Ministry of Public Works, Meteorological Services, and Transport (MPWMST): Suva, Fiji, 2022.
  5. Michalena, E.; Kouloumpis, V.; Hills, J.M. Challenges for Pacific Small Island Developing States in achieving their Nationally Determined Contributions (NDC). Energy Policy 2018, 114, 508–518. [Google Scholar] [CrossRef]
  6. Sheikh, A.Z.; Kumar, A. Evaluating Biomass Briquettes as a Clean Cooking Fuel Alternative in Fiji. SSRN. 2024. Available online: https://ssrn.com/abstract=5201001 (accessed on 1 July 2025). [CrossRef]
  7. Vassiliades, C.; Diemuodeke, O.E.; Yiadom, E.B.; Prasad, R.D.; Dbouk, W. Policy Pathways for Mapping Clean Energy Access for Cooking in the Global South—A Case for Rural Communities. Sustainability 2022, 14, 13577. [Google Scholar] [CrossRef]
  8. Prasad, R.D.; Dbouk, W.; Yiadom, E.B.; Vassiliades, C. Biogas digester innovations as solution to clean cooking energy challenge in the Pacific Islands: A policy perspective. Energy Rep. 2025, 13, 2417–2432. [Google Scholar] [CrossRef]
  9. Chandra, V.; Hemstock, S. A biomass energy flow chart for Fiji. Biomass Bioenergy 2015, 72, 117–122. [Google Scholar] [CrossRef]
  10. Greco, C.; Comparetti, A.; Orlando, S.; Mammano, M.M. A contribution to environmental protection through the valorisation of kitchen biowaste. In Safety, Health and Welfare in Agriculture and Agro-Food Systems. SHWA 2020; Biocca, M., Cavallo, E., Cecchini, M., Failla, S., Romano, E., Eds.; Lecture Notes in Civil Engineering (LNCE); Springer International Publishing: Cham, Switzerland, 2022; Volume 252, pp. 411–420. [Google Scholar]
  11. Nadan, M.K.; Baroutian, S. Prospective of pretreatment and anaerobic digestion of dairy cow manure in Fiji. J. Chem. Technol. Biotechnol. 2023, 98, 1584–1597. [Google Scholar] [CrossRef]
  12. Attard, G.; Azzopardi, N.; Comparetti, A.; Greco, C.; Gruppetta, A.; Orlando, S. Potential Bioenergy and Biofertiliser Production from Livestock Waste in Mediterranean Islands Within Circular Bioeconomy. Conference of the Italian Society of Agricultural Engineering. In AIIA 2022: Biosystems Engineering Towards the Green Deal; Ferro, V., Giordano, G., Orlando, S., Vallone, M., Cascone, G., Porto, S.M.C., Eds.; Lecture Notes in Civil Engineering; Springer International Publishing: Cham, Switzerland, 2023; Volume 337, pp. 271–283. [Google Scholar] [CrossRef]
  13. Asciuto, A.; Agosta, M.; Attard, G.; Comparetti, A.; Greco, C.; Mammano, M.M. Development of an Investment Decision Tool for Biogas Production from Biowaste in Mediterranean Islands. Conference of the Italian Society of Agricultural Engineering. In AIIA 2022: Biosystems Engineering Towards the Green Deal; Ferro, V., Giordano, G., Orlando, S., Vallone, M., Cascone, G., Porto, S.M.C., Eds.; Lecture Notes in Civil Engineering; Springer International Publishing: Cham, Switzerland, 2023; Volume 337, pp. 251–262. [Google Scholar] [CrossRef]
  14. Comparetti, A.; Febo, P.; Greco, C.; Orlando, S.; Navickas, K.; Nekrosius, A.; Venslauskas, K. Biogas yield from Sicilian kitchen waste and cheese whey. J. Agric. Eng. 2013, XLIV, e106. [Google Scholar] [CrossRef]
  15. Dai, B.; Xu, J.; He, Y.; Xiong, P.; Wang, X.; Deng, Y.; Wang, Y.; Yin, Z. Acid inhibition during anaerobic digestion of biodegradable kitchen waste. J. Renew. Sustain. Energy 2015, 7, 023118. [Google Scholar] [CrossRef]
  16. Adeoti, O.; Ilori, M.O.; Oyebisi, T.O.; Adekoya, L.O. Engineering design and economic evaluation of a family-sized biogas project in Nigeria. Technovation 2000, 20, 103–108. [Google Scholar] [CrossRef]
  17. Karellas, S.; Boukis, I.; Kontopoulos, G. Development of an investment decision tool for biogas production from agricultural waste. Renew. Sustain. Energy Rev. 2010, 14, 1273–1282. [Google Scholar] [CrossRef]
  18. Gwavuya, S.G.; Abele, S.; Barfuss, I.; Zeller, M.; Müller, J. Household energy economics in rural Ethiopia: A cost-benefit analysis of biogas energy. Renew. Energy 2012, 48, 202–209. [Google Scholar] [CrossRef]
  19. Hublin, A.; Schneider, D.R.; Džodan, J. Utilization of biogas produced by anaerobic digestion of agro-industrial waste: Energy, economic and environmental effects. Waste Manag. Res. 2014, 32, 626–633. [Google Scholar] [CrossRef]
  20. Akbulut, A.; Arslan, O.; Arat, H.; Erbas, O. Important aspects for the planning of biogas energy plants: Malatya case study. Case Stud. Thermal Eng. 2021, 26, 101076. [Google Scholar] [CrossRef]
  21. Campello, L.D.; Barros, R.M.; Tiago Filho, G.L.; dos Santos, I.F.S. Analysis of the economic viability of the use of biogas produced in wastewater treatment plants to generate electrical energy. Environ. Develop. Sustain. 2021, 23, 2614–2629. [Google Scholar] [CrossRef]
  22. Cañote, S.J.B.; Barros, R.M.; Lora, E.E.S.; del Olmo, O.A.; Santos, I.F.S.D.; Piñas, J.A.V.; Ribeiro, E.M.; de Freitas, J.V.R.; de Castro e Silva, H.L. Energy and economic evaluation of the production of biogas from anaerobic and aerobic sludge in Brazil. Waste Biomass Valoriz. 2021, 12, 947–969. [Google Scholar] [CrossRef]
  23. Jellali, S.; Charabi, Y.; Usman, M.; Al-Badi, A.; Jeguirim, M. Investigations on biogas recovery from anaerobic digestion of raw sludge and its mixture with agri-food wastes: Application to the largest industrial estate in Oman. Sustainability 2021, 13, 3698. [Google Scholar] [CrossRef]
  24. Cudjoe, D.; Nketiah, E.; Obuobi, B.; Adu-Gyamfi, G.; Adjei, M.; Zhu, B. Forecasting the potential and economic feasibility of power generation using biogas from food waste in Ghana: Evidence from Accra and Kumasi. Energy 2021, 226, 120342. [Google Scholar] [CrossRef]
  25. Quadrelli, R.; Intergovernmental Panel on Climate Change. 2006 IPCC Guidelines for National Greenhouse Gas Inventories: Volume 2—Energy, Chapter 2: Stationary Combustion. Institute for Global Environmental Strategies, 2006. Available online: https://www.ipcc-nggip.iges.or.jp/public/2006gl/pdf/2_Volume2/V2_2_Ch2_Stationary_Combustion.pdf (accessed on 2 July 2025).
  26. Liu, Y.; Huang, T.; Peng, D.; Huang, J.; Maurer, C.; Kranert, M. Optimizing the co-digestion supply chain of sewage sludge and food waste by the demand oriented biogas supplying mechanism. Waste Manag. Res. 2020, 39, 302–313. [Google Scholar] [CrossRef]
  27. Al-Wahaibi, A.; Osman, A.I.; Al-Muhtaseb, A.H.; Alqaisi, O.; Baawain, M.; Fawzy, S.; Rooney, D.W. Techno-economic evaluation of biogas production from food waste via anaerobic digestion. Sci. Rep. 2020, 10, 15719. [Google Scholar] [CrossRef] [PubMed]
  28. Pati, A.R.; Saroha, S.; Behera, A.P.; Mohapatra, S.S.; Mahanand, S.S. The Anaerobic Digestion of Waste Food Materials by Using Cow Dung: A New Methodology to Produce Biogas. J. Inst. Eng. (India) Ser. E 2019, 100, 111–120. [Google Scholar] [CrossRef]
  29. Comparetti, A.; Febo, P.; Greco, C.; Orlando, S. Current state and future of biogas and digestate production. Bulg. J. Agric. Sci. 2013, 19, 1–14. [Google Scholar]
  30. Gyadi, T.; Bharti, A.; Basack, S.; Kumar, P.; Lucchi, E. Influential factors in anaerobic digestion of rice-derived food waste and animal manure: A comprehensive review. Bioresour. Technol. 2024, 413, 131398. [Google Scholar] [CrossRef]
  31. Mrosso, R.; Mecha, A.C.; Kiplagat, J. Characterization of kitchen and municipal organic waste for biogas production: Effect of parameters. Heliyon 2023, 9, e16360. [Google Scholar] [CrossRef]
  32. Glivin, G.; Sekhar, S.J. Studies on the Feasibility of Producing Biogas from Rice Waste. Rom. Biotechnol. Lett. 2019, 24, 728–735. [Google Scholar] [CrossRef]
  33. Felton, G.; Lansing, S.; MosQuas, A.; Klavon, K. Anaerobic Digestion Series. Anaerobic Digestion: Basic Processes for Biogas Production. Fact Sheet FS-994; Solutions in Your Community; University of Maryland Extension: College Park, MD, USA, October 2014; 7p. [Google Scholar]
  34. IEA—International Energy Agency. Outlook for Biogas and Biomethane. Prospects for Organic Growth; World Energy Outlook Special Report; IEA: Paris, France, March 2020; 93p. [Google Scholar]
  35. Putti, V.; Tsan, M.; Mehta, S.; Kammila, S. The State of the Global Clean and Improved Cooking Sector; Energy Sector Management Assistance Program, Global Alliance for Clean Cookstoves; World Bank: Washington, DC, USA, 2015. [Google Scholar]
  36. International Gas Union. Natural Gas Conversion Guide. 2012. Available online: https://www.apeg.pt/folder/documento/ficheiro/natural-gas-conversion-guide_cb4f0ccd80ccaf88ca5ec336a38600867db5aaf1.pdf (accessed on 2 July 2025).
  37. Fijian Competition and Consumer Commission. Price Control Order for LPG Products—12 kg Gas Cylinder. 2022. Available online: https://www.fccc.gov.fj (accessed on 3 July 2025).
  38. Obileke, K.; Makaka, G.; Nwokolo, N.; Meyer, E.L.; Mukumba, P. Economic Analysis of Biogas Production via Biogas Digester Made from Composite Material. ChemEngineering 2022, 6, 67. [Google Scholar] [CrossRef]
  39. United Nations Development Programme. From Dung to Dinner: Biogas Transforming Cooking Energy in Rwanda By Maxwell Gomera. 16 March 2023. Available online: https://www.undp.org/rwanda/blog/dung-dinner-biogas-transforming-cooking-energy-rwanda (accessed on 3 July 2025).
  40. Wu, D.; Peng, X.; Li, L.; Yang, P.; Peng, Y.; Liu, H.; Wang, L. Commercial biogas plants: Review on operational parameters and guide for performance optimization. Fuel 2021, 303, 121282. [Google Scholar] [CrossRef]
  41. Hoet, E. Digesting the Impact on Climate. Food Chain Magazine. 2022. Available online: https://foodchainmagazine.com/news/digesting-the-impact-on-climate/#:~:text=The%201.3%20gigatons%20of%20edible,times%20more%20potent%20than%20CO2 (accessed on 3 July 2025).
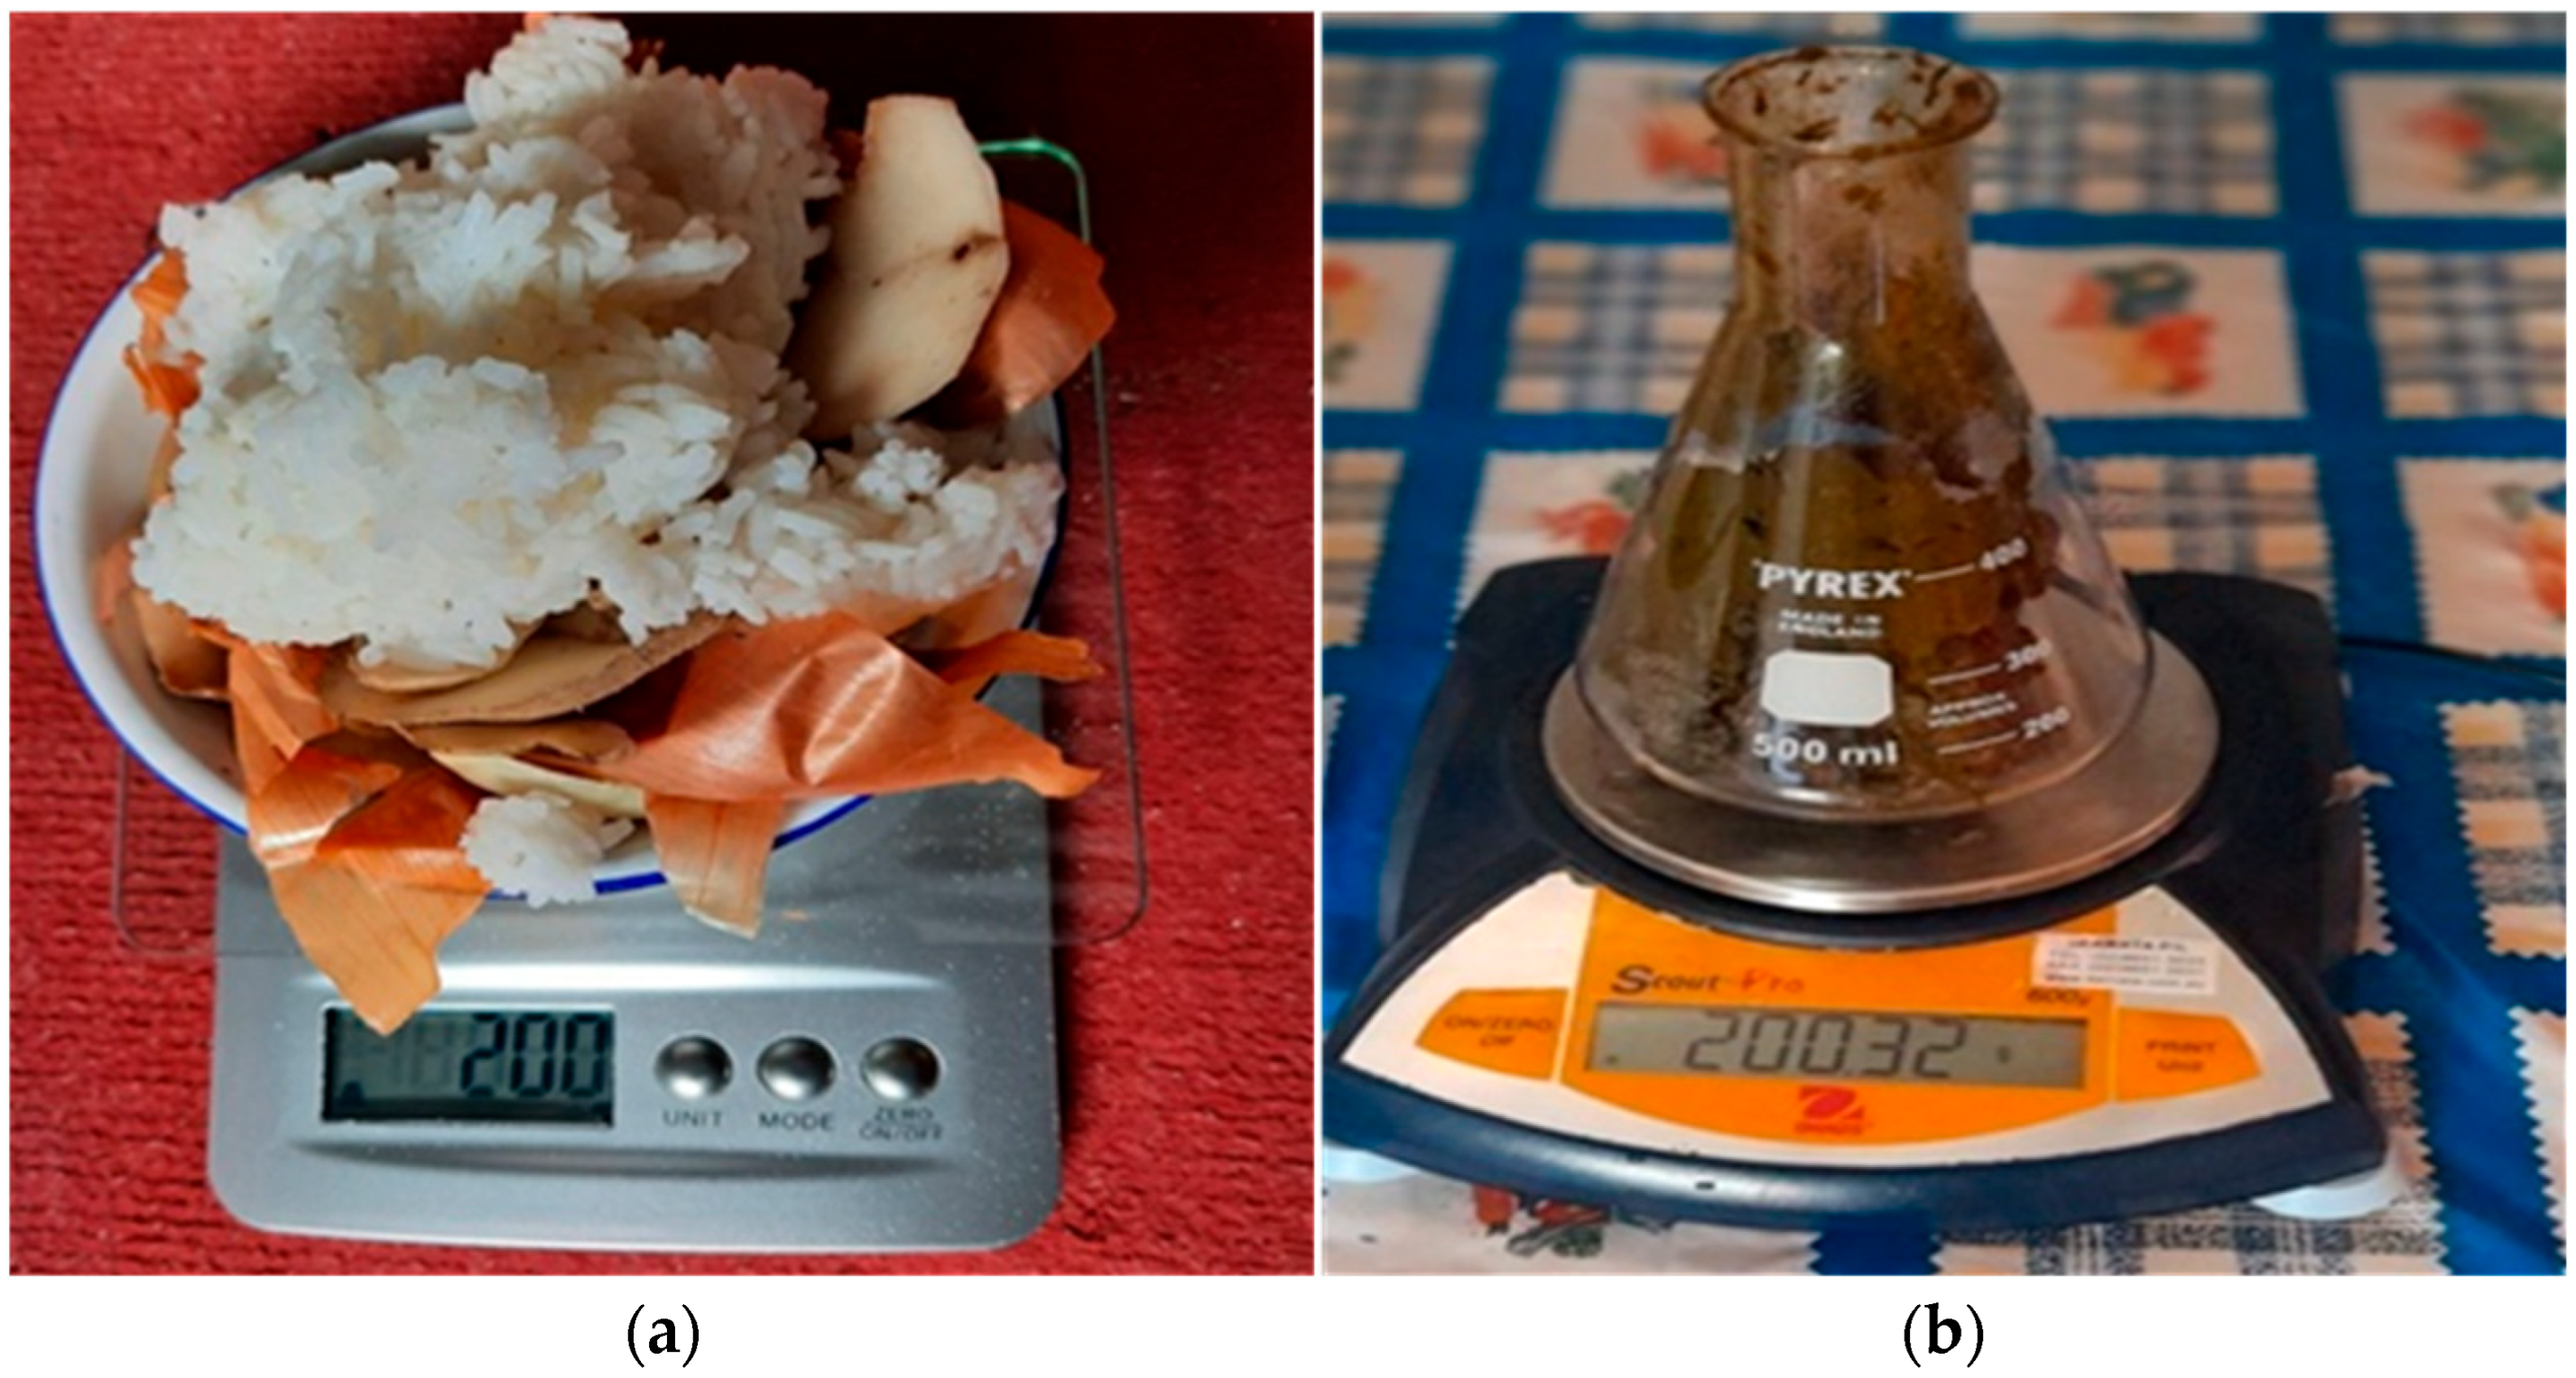
Figure 1. The mass of kitchen waste and fresh cow dung was weighed and used for the bench experiment: (a) kitchen waste; (b) fresh cow dung.
Recycling 10 00183 g001
Figure 2. Home Biogas 2.0 technology, installed at Kamil Muslim College, Ba, Fiji, to generate cooking biogas from food waste produced from the school canteen: (a) balloon digester; (b) opening of the cooking biogas stove with blue flame.
Recycling 10 00183 g002
Figure 3. Graphs of the cumulative production of biogas (cm3) from kitchen waste and cow dung.
Recycling 10 00183 g003
Figure 4. Line graph of volumes of biogas produced (cm3) daily against time using: (a) kitchen waste; (b) fresh cow dung.
Recycling 10 00183 g004
Figure 5. Graph of volumes of biogas produced (cm3) against time using vegetable waste.
Recycling 10 00183 g005
Figure 6. Graph showing the cooking time against the number of days experimented on Home Biogas 2.0 with vegetable waste and fresh cow dung as feedstocks.
Recycling 10 00183 g006
Figure 7. Monthly prices of 12 kg LPG cylinder in 2022 [37].
Recycling 10 00183 g007
Table 1. Typical quantity of waste.
Kitchen WasteQuantity (g)Animal WasteQuantity (g)
Rice120
Potato Peelings40Fresh Cow Dung200
Onion Peelings40
Total200 200
Table 2. Daily parameters from the Home Biogas 2.0 with vegetable waste.
DayDateCooking
Time
(Minutes)
Content
(Carbohydrates)
%Content
(Peelings)
%Content
(Vegetable Waste)
%pHLiquid Digestate (Liters)Temperature (°C)
116 May80Leftover Rice40Potato peelings30Vegetable waste306.94.926.7
217 May20Bread20Pumpkin peelings40Vegetable waste407.34.926.6
318 May15Leftover Rice50Potato peelings30Vegetable waste206.74.826
419 May18Leftover Rice20Potato and onion peelings60Vegetable waste206.94.926.2
520 May20Leftover Rice20Dalo peelings70Vegetable waste107.14.8526.7
623 May45Leftover Rice30Potato peelings30Vegetable waste407.34.926.5
724 May65Leftover Rice5Potato, onion and garlic peelings95 6.54.826.9
825 May35Leftover Rice40Potato peelings30Vegetable waste306.44.827.1
926 May20Leftover Rice20Potato peelings with onion peelings40Vegetable waste406.74.926.6
1027 May20Leftover Rice25Potato peelings25Pumpkin peelings506.34.926.3
1130 May90Leftover roti50Potato and onion peelings50 6.54.825.9
1231 May15Leftover Rice20Pawpaw, onion and potato peelings80 6.84.926.1
131 June17Leftover Rice25Pawpaw, onion and potato peelings75 6.84.826.3
142 June20Leftover Rice40Potato and Onion peelings30Vegetable waste306.84.826.1
153 June18Leftover Rice20Potato and Onion peelings20Vegetable waste606.84.826.3
166 June85Leftover Rice and bread80Potato and Onion peelings20 7.04.8826.4
177 June18Leftover Palao rice and cassava80Potato peelings20 6.94.826.3
188 June20Leftover Bhajia and rice80Potato and Onion peelings20 6.94.825.9
199 June15Leftover Roti70Potato, onion and Pawpaw peelings20Vegetable waste106.74.826.2
2010 June20Leftover bread30Potato and onion with garlic peelings50Vegetable peelings and carrot peelings207.14.826.1
2113 June88Leftover curry and bread60Potato and Onion peelings40 6.94.8526.1
2214 June16Leftover Rice30Potato peelings30Leftover curry406.94.826.5
2315 June18Leftover Rice20Breadfruit, potato and onion peelings80 6.84.826.6
2416 June20Leftover Rice with curry80Potato peelings20 6.94.826.3
2517 June15Leftover bread and rice70Potato and Onion peelings30 7.14.826.5
2620 June70Leftover Rice40Potato peelings20vegetable peelings and carrot peelings407.04.826.2
2721 June15Leftover Rice and bread60Potato and Onion peelings40 7.14.826.3
2822 June22Leftover cooked cassava and bara80Potato peelings20 6.94.826.1
2923 June20Leftover Rice and roti70Potato and Onion peelings30 6.94.726.2
3024 June15Leftover Rice30Potato and Onion peelings20Vegetable waste506.94.726.5
3127 June70Leftover Rice and roti40Potato and Onion peelings30Vegetable waste307.14.826.6
3228 June15Leftover Rice70Potato peelings30 6.74.826.5
3329 June15Leftover Rice, bread and cassava80Potato and Onion peelings20 6.84.826.5
3430 June10Leftover Rice and bread70Potato peelings30 6.84.826.6
351 July14Leftover Rice and roti40Potato and Onion peelings40Vegetable peelings206.84.826.1
364 July65Leftover Rice and roti and fried cassava80Onion peelings20 6.84.826.5
375 July12Leftover Rice, bread with curry70Potato and Onion peelings30 6.84.8826.4
386 July10Leftover Rice and cassava70Potato and Onion peelings30 6.74.8526.3
397 July12Leftover Rice30Potato peelings50Vegetable peelings206.74.926.2
408 Julynot usedLeftover palau, roti and bread70Potato and Onion peelings30 6.74.826.1
Table 3. Daily parameters of the Home Biogas 2.0 using fresh cow dung.
DayDateCooking Time (Minutes)pHTemperature (°C)Liquid Digestate (Liters)
125 July06.4226.84.9
226 July06.3626.74.9
327 July06.2626.84.9
428 July06.2426.94.92
529 July06.2226.74.91
61 August06.6226.94.85
72 August06.6226.94.85
83 August06.4227.14.87
94 August06.4226.34.88
105 August06.3227.44.8
118 August06.2226.24.8
129 August06.2426.14.8
1310 August06.2626.34.8
1411 August06.2227.24.75
1512 August06.3226.34.8
1615 August06.2226.44.7
1716 August06.2426.34.7
1817 August106.2625.94.75
1918 August186.2826.24.7
2019 August276.2426.14.75
2122 August956.2627.14.7
2223 August386.2826.54.7
2324 August406.2626.34.7
2425 August356.2826.74.65
2526 August376.2526.54.78
2629 August986.2826.74.7
2730 August406.2626.34.7
2831 August386.2826.54.7
291 September416.2226.64.68
302 September386.2626.74.7
315 September1006.2626.34.7
326 September426.2326.44.7
337 SeptemberOnly feeding6.2426.34.75
348 September886.2626.34.7
359 September426.2826.34.7
3612 September1026.3226.34.75
3713 September416.3526.34.7
Table 4. Comparison of the economic value attainable from theoretical specifications of the manufacturer, with the biogas produced from kitchen vegetable waste and cow dung substrates.
Theoretical Specifications
of the Manufacturer
Biogas Produced from
Kitchen Vegetable Waste
Biogas Produced
from Cow Dung
Net Present Value (NPV)−499.58−1314.53−919.87
Internal Rate of Return (IRR)11%5%8%
Benefit/cost ratio (BCR)0.8330.5660.693
Discounted payback period (DPBP)~14.5 yearsOver 50 years~26.48 years
Table 5. Economic analysis with three different LPG 12 kg cylinder prices: (a) $45.05, (b) $40, and (c) $50, respectively.
IRRNPVB/C RatioDiscounted Pay Back Period
  (a) Average LPG 12 kg Cylinder Price: $45.05
Theoretical14%$220.951.0714.5 years
Maximum Average Vegetable7%$828.850.7250+ years
Total Vegetable−5%$2115.940.2950+ years
Total Vegetable with Fertiliser65%$11,727.104.911.8 years
Maximum Fresh Cow Dung11%$320.250.8926.48 years
Total Fresh Cow Dung−3%$1629.380.4650+ years
Total Fresh Cow Dung with Fertiliser67%$12,213.705.071.74 years
  (b) Average LPG 12 kg Cylinder Price: $40.00
Theoretical12%$140.110.9521.15 years
Maximum Average Vegetable5%$1071.090.6450+ years
Total Vegetable−5%$2215.050.2650+ years
Total Vegetable with Fertiliser64%$11,628.004.881.8 years
Maximum Fresh Cow Dung9%$620.820.7950+ years
Total Fresh Cow Dung−5%$1783.030.4150+ years
Total Fresh Cow Dung with Fertiliser66%$12,060.005.021.75 years
  (c) Average LPG 12 kg Cylinder Price: $50.00
Theoretical16%$574.861.1911.62 years
Maximum Average Vegetable9%$588.870.850+ years
Total Vegetable−5%$2018.820.3350+ years
Total Vegetable with Fertiliser65%$11,824.204.941.79 years
Maximum Fresh Cow Dung13%$26.020.9918.90 years
Total Fresh Cow Dung0%$1478.780.5150+ years
Total Fresh Cow Dung with Fertiliser67%$12,364.305.121.28 years
Disclaimer/Publisher’s Note: The statements, opinions and data contained in all publications are solely those of the individual author(s) and contributor(s) and not of MDPI and/or the editor(s). MDPI and/or the editor(s) disclaim responsibility for any injury to people or property resulting from any ideas, methods, instructions or products referred to in the content.