Article

Obtaining Nutraceutical Compounds from Agroindustrial Waste by Biotransformation with Pleurotus djamor

by
Byanka A. Cruz-Moreno
1,
Benito Parra-Pacheco
1,
Linda Gilary Acosta-Lizárraga
1,
Juan C. Silva-Jarquín
2,
Juan Fernando García-Trejo
1,
Humberto Aguirre-Becerra
1 and
Ana A. Feregrino-Pérez
1,*
1
Facultad de Ingeniería, Universidad Autónoma de Querétaro, Carretera a Chichimequillas s/n km1, El Marqués C.P. 76265, Mexico
2
Facultad de Ciencias Naturales, Universidad Autónoma de Querétaro, El Marqués C.P. 76230, Mexico
*
Author to whom correspondence should be addressed.
Recycling 2025, 10(5), 185; https://doi.org/10.3390/recycling10050185
Submission received: 14 September 2025 / Revised: 24 September 2025 / Accepted: 24 September 2025 / Published: 28 September 2025

Abstract

This study explores the production of nutritious edible mushrooms from mixtures of agave bagasse, an abundant agroindustrial byproduct, through the biotechnological application of solid-state fermentation using the edible mushroom Pleurotus djamor. The ability of the fungus to biotransform different mixtures of agave bagasse and corn stover into secondary metabolites of nutraceutical interest, such as polyphenols, organic acids, and bioactive polysaccharides, was evaluated. Biological efficiency (BE), morphological change, texture, and antioxidant capacity were also assessed, correlating the results with the impact of substrates and fungal developmental stages. The color, size, and margin of P. djamor basidiomas were observed to vary among treatments; BE progressively decreased from T0 (106.5%) to T4 (33.16%). Treatments with higher amounts of agave bagasse (T4) generated firmer fungi, with a fracture toughness of 7.06 ± 3.06 newtons. During fungal development, phenols, flavonoids, and tannins fluctuated. Treatment T0 showed the highest concentration of phenols (5.41 ± 0.92 mg GAE g−1). Treatment T4 stood out for its high antioxidant capacity (DPPH) (61.83 ± 12.16% inhibition). Finally, 17 non-phenolic secondary metabolites were found: L-valine, L-leucine, L-isoleucine, L, D-phenylalanine, L-proline, alanine, L-asparagine, serine, glutamic acid, linoleic acid, palmitic acid, butanoic acid, propanoic acid, pyrimidine, succinic acid, hexanedioic acid, and phosphoric acid. In conclusion, P. djamor can biotransform agroindustrial waste into edible fungi containing nutraceutical compounds.

1. Introduction

Agave bagasse is an agroindustrial waste product resulting from tequila production. Due to the popularity of tequila, approximately 205,000 tons of bagasse are generated annually. This waste represents a lignocellulosic biomass rich in structural compounds such as cellulose, hemicellulose, and lignin, which can be transformed into high-value metabolites through biotechnological processes and utilized. The edible mushroom Pleurotus djamor, known as the pink mushroom, has a high enzymatic capacity that allows it to degrade these components through solid-state fermentation, in turn generating secondary metabolites in its fruiting bodies. These metabolites include bioactive compounds such as phenols, flavonoids, alkaloids, terpenoids, polysaccharides, vitamins, ergothioneine, and others, many of which possess nutraceutical properties such as antioxidants, antitumor, anticancer, antiparasitic, antimicrobial, anti-inflammatory, hepatoprotective, and antiviral, among many others [1,2,3,4,5,6,7].
The production and accumulation of secondary metabolites varies throughout the stages of the mushroom’s life cycle and depending on the substrate in which it grows. As the mushroom progresses from one developmental stage to another, the production of certain secondary metabolites changes according to its needs [8].
Pleurotus djamor is a native species, widely distributed throughout the continent, appreciated for both its striking color and its delicate flavor. Its cultivation is relatively rapid (40–60 days) and simple, as it does not require extensive infrastructure. It can grow and develop in various agroindustrial wastes, including agave bagasse, with biological efficiency results exceeding 65% [9].
Current research has shown that substrate type significantly regulates the expression of fungal metabolic pathways, affecting both yield and metabolite diversity [10,11]. However, there is a significant gap in the literature regarding the dynamics of metabolite accumulation during the life cycle of P. djamor, especially when grown on alternative substrates such as agave bagasse. While previous studies have documented the potential of corn stover and agave bagasse individually for P. djamor growth, with biological efficiencies exceeding 100% and 65%, respectively [12], a detailed study examining the nutraceutical profile of P. djamor at various developmental stages using these combined residues has yet to be conducted.
Determining the ratio of substrate to fruiting body can optimize mushroom cultivation based on needs: higher biomass production, shorter time between harvests, better texture, greater nutraceutical benefits, etc.
The objective of this study was to determine the concentration and diversity of nutraceutical compounds present in the basidiomas of Pleurotus djamor at different developmental stages, using substrates composed of different mixtures of agave bagasse and corn stover.

2. Results

2.1. Biological Efficiency

The biological efficiency (BE) shown by P. djamor growth in the different treatments has a constant decrease in the first four of them, following the pattern T0 > T1 > T2 > T3 (Figure 1). In the case of T4, there is a slight increase from T3 of less than 1 point; thus, statistical analysis showed no difference between these treatments (p > 0.05).
The highest BE value is presented by T0 (103.65 +/− 7.39%), a control treatment, which verifies that growth conditions were adequate; additionally, T0 presented significant differences (p < 0.05) between T3 and T4 (36.16 +/− 5.75%), the treatments with the lowest BE values. These results show how the later treatments are not optimal as a substrate for mushroom cultivation in terms of performance; nevertheless, when supplemented with corn stover, they can enhance the biomass production above 70%, as shown by T1.

2.2. Proximal Chemical Analysis of Substrate Mixtures

The results given by Proximal Chemical Analysis (PCA) characterize the different substrate mixtures and show their behavior in the different components of the nutrients available (Table 1).
In the case of moisture, it can be observed that the highest value is shown by T0 and decreases along with the decrease in the content of corn stubble in the mixture. Significant differences were found among T0, T2, and T3 (p > 0.05); nevertheless, no differences were shown between T0 and T4, the opposite mixtures. A similar pattern can be seen in nitrogen-free extract (NFE) and ashes.
Another pattern can be found in ethereal extract and crude fiber, in which T0 presents the lowest values, but then a decrease from T1 to T3, to finally have a decrease in T4. Protein is the variable in which the values do not follow any path. In that case, the highest protein content is shown by T4, which is directly related to the agave, in contrast to the corn stubble of T0, which had the lowest content, a difference reflected in the statistical analysis (p < 0.05).
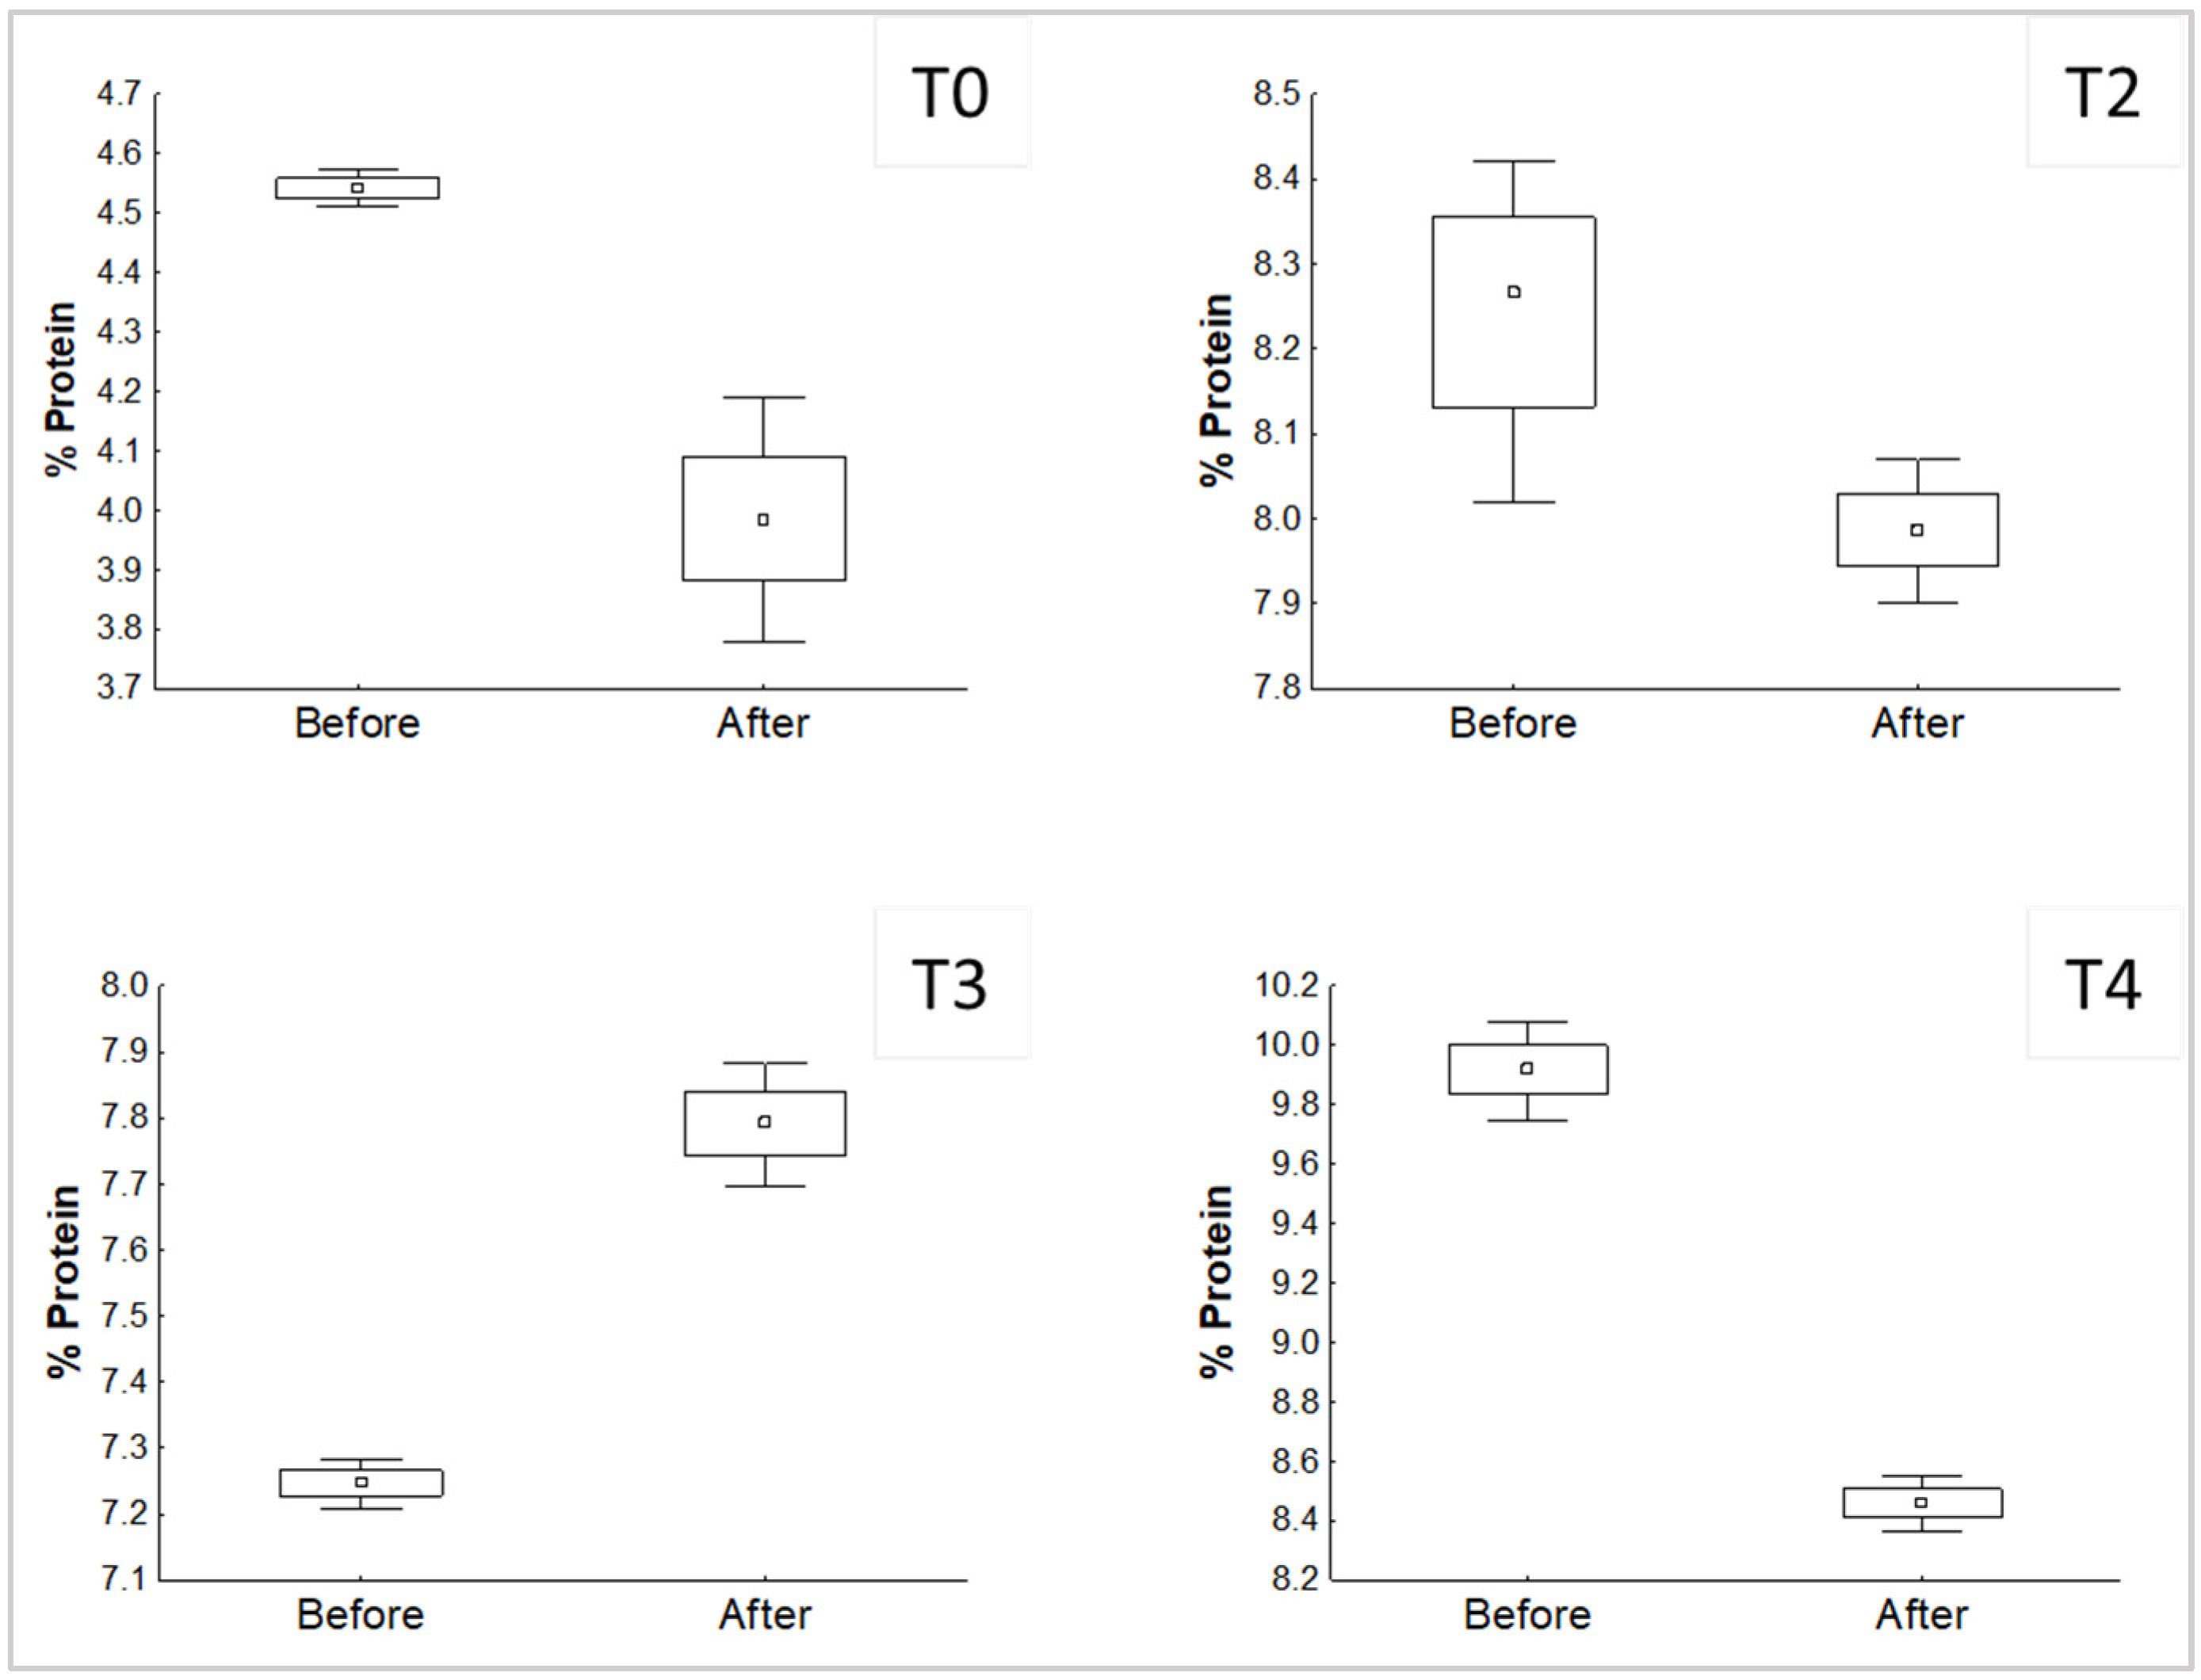
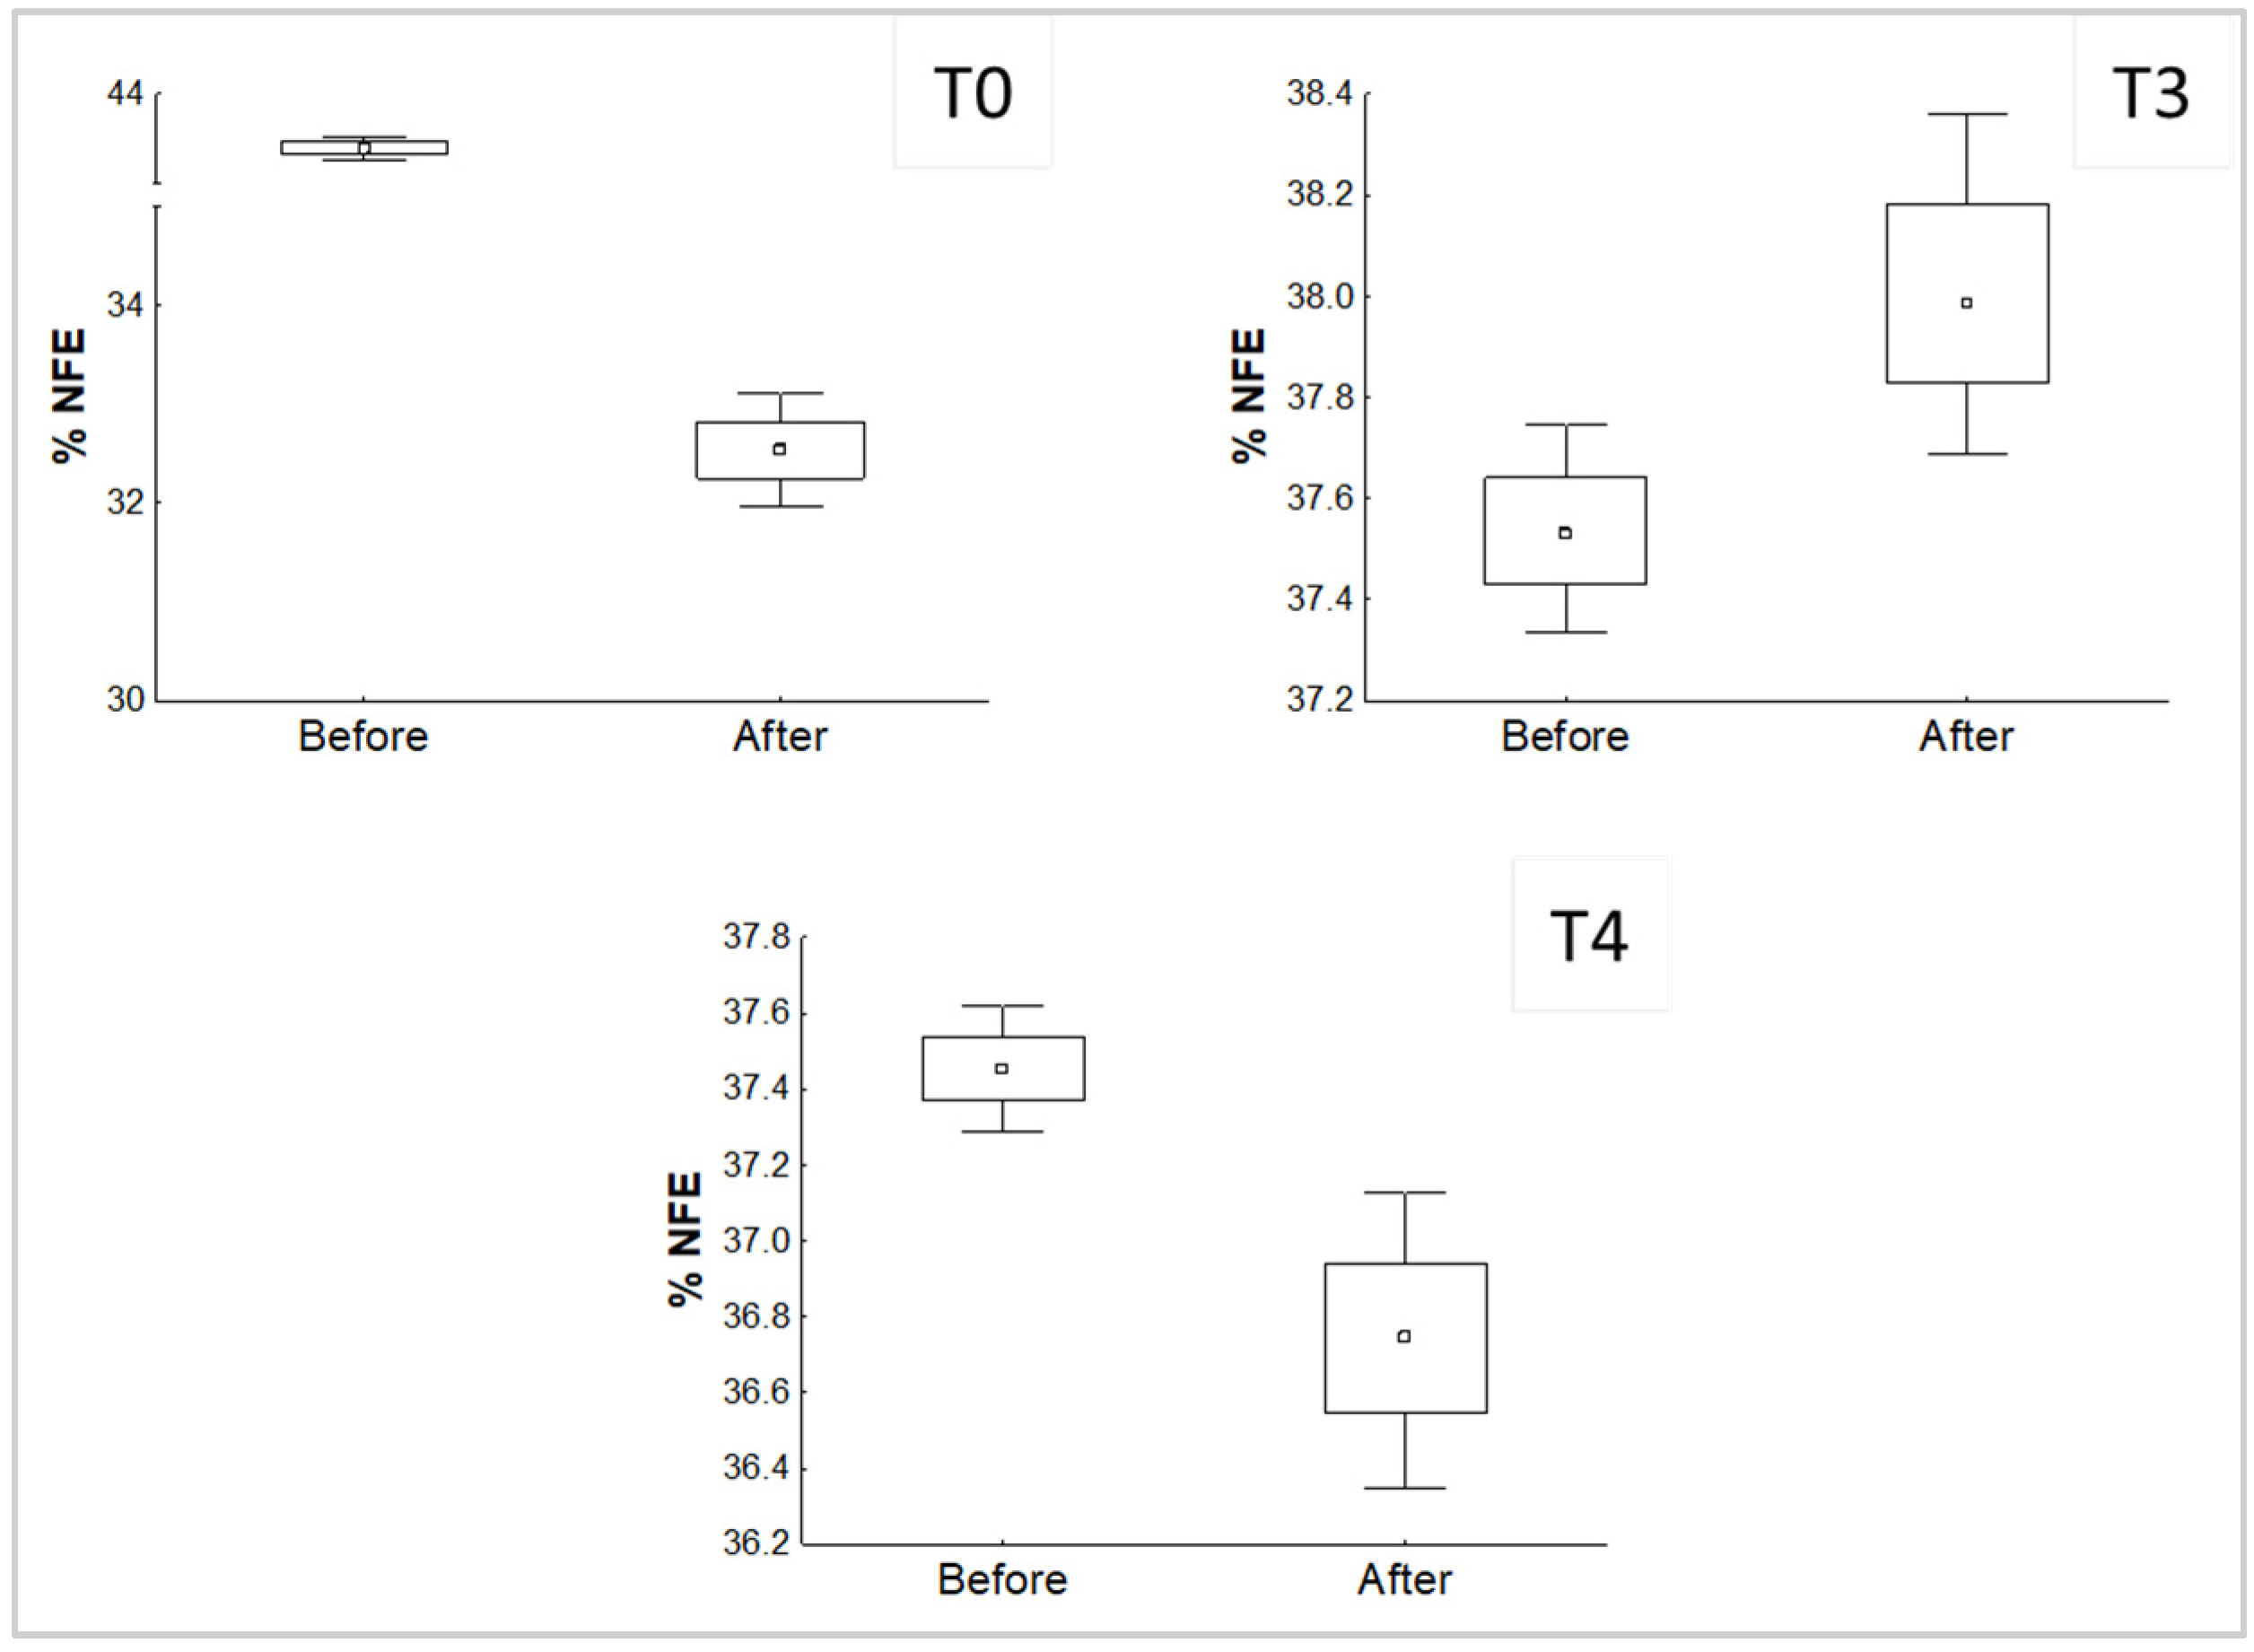
The development of P. djamor in the different treatments affected the content of protein and NFE, which was shown before the inoculation in comparison with the value after the end of the experiment. Significant differences (p < 0.05) found are shown in Figure 2 and Figure 3.
T1 showed no significant differences for protein (p > 0.05). According to the results, the growth of P. djamor in treatments without mixture decreased the percentage of protein in the substrate, the same case with T2. Nevertheless, T3 shows the opposite behavior, which means that P. djamor increased the amount of protein in the final substrate.
In the case of NFE, significant differences were found in treatments T0, T3, and T4. It is worth noting that T3 has, again, an opposite behavior against the later comparisons, which again means that P. djamor was able to increase the percentage of NFE available in the substrate at the end of the experiment.

2.3. Development of P. djamor

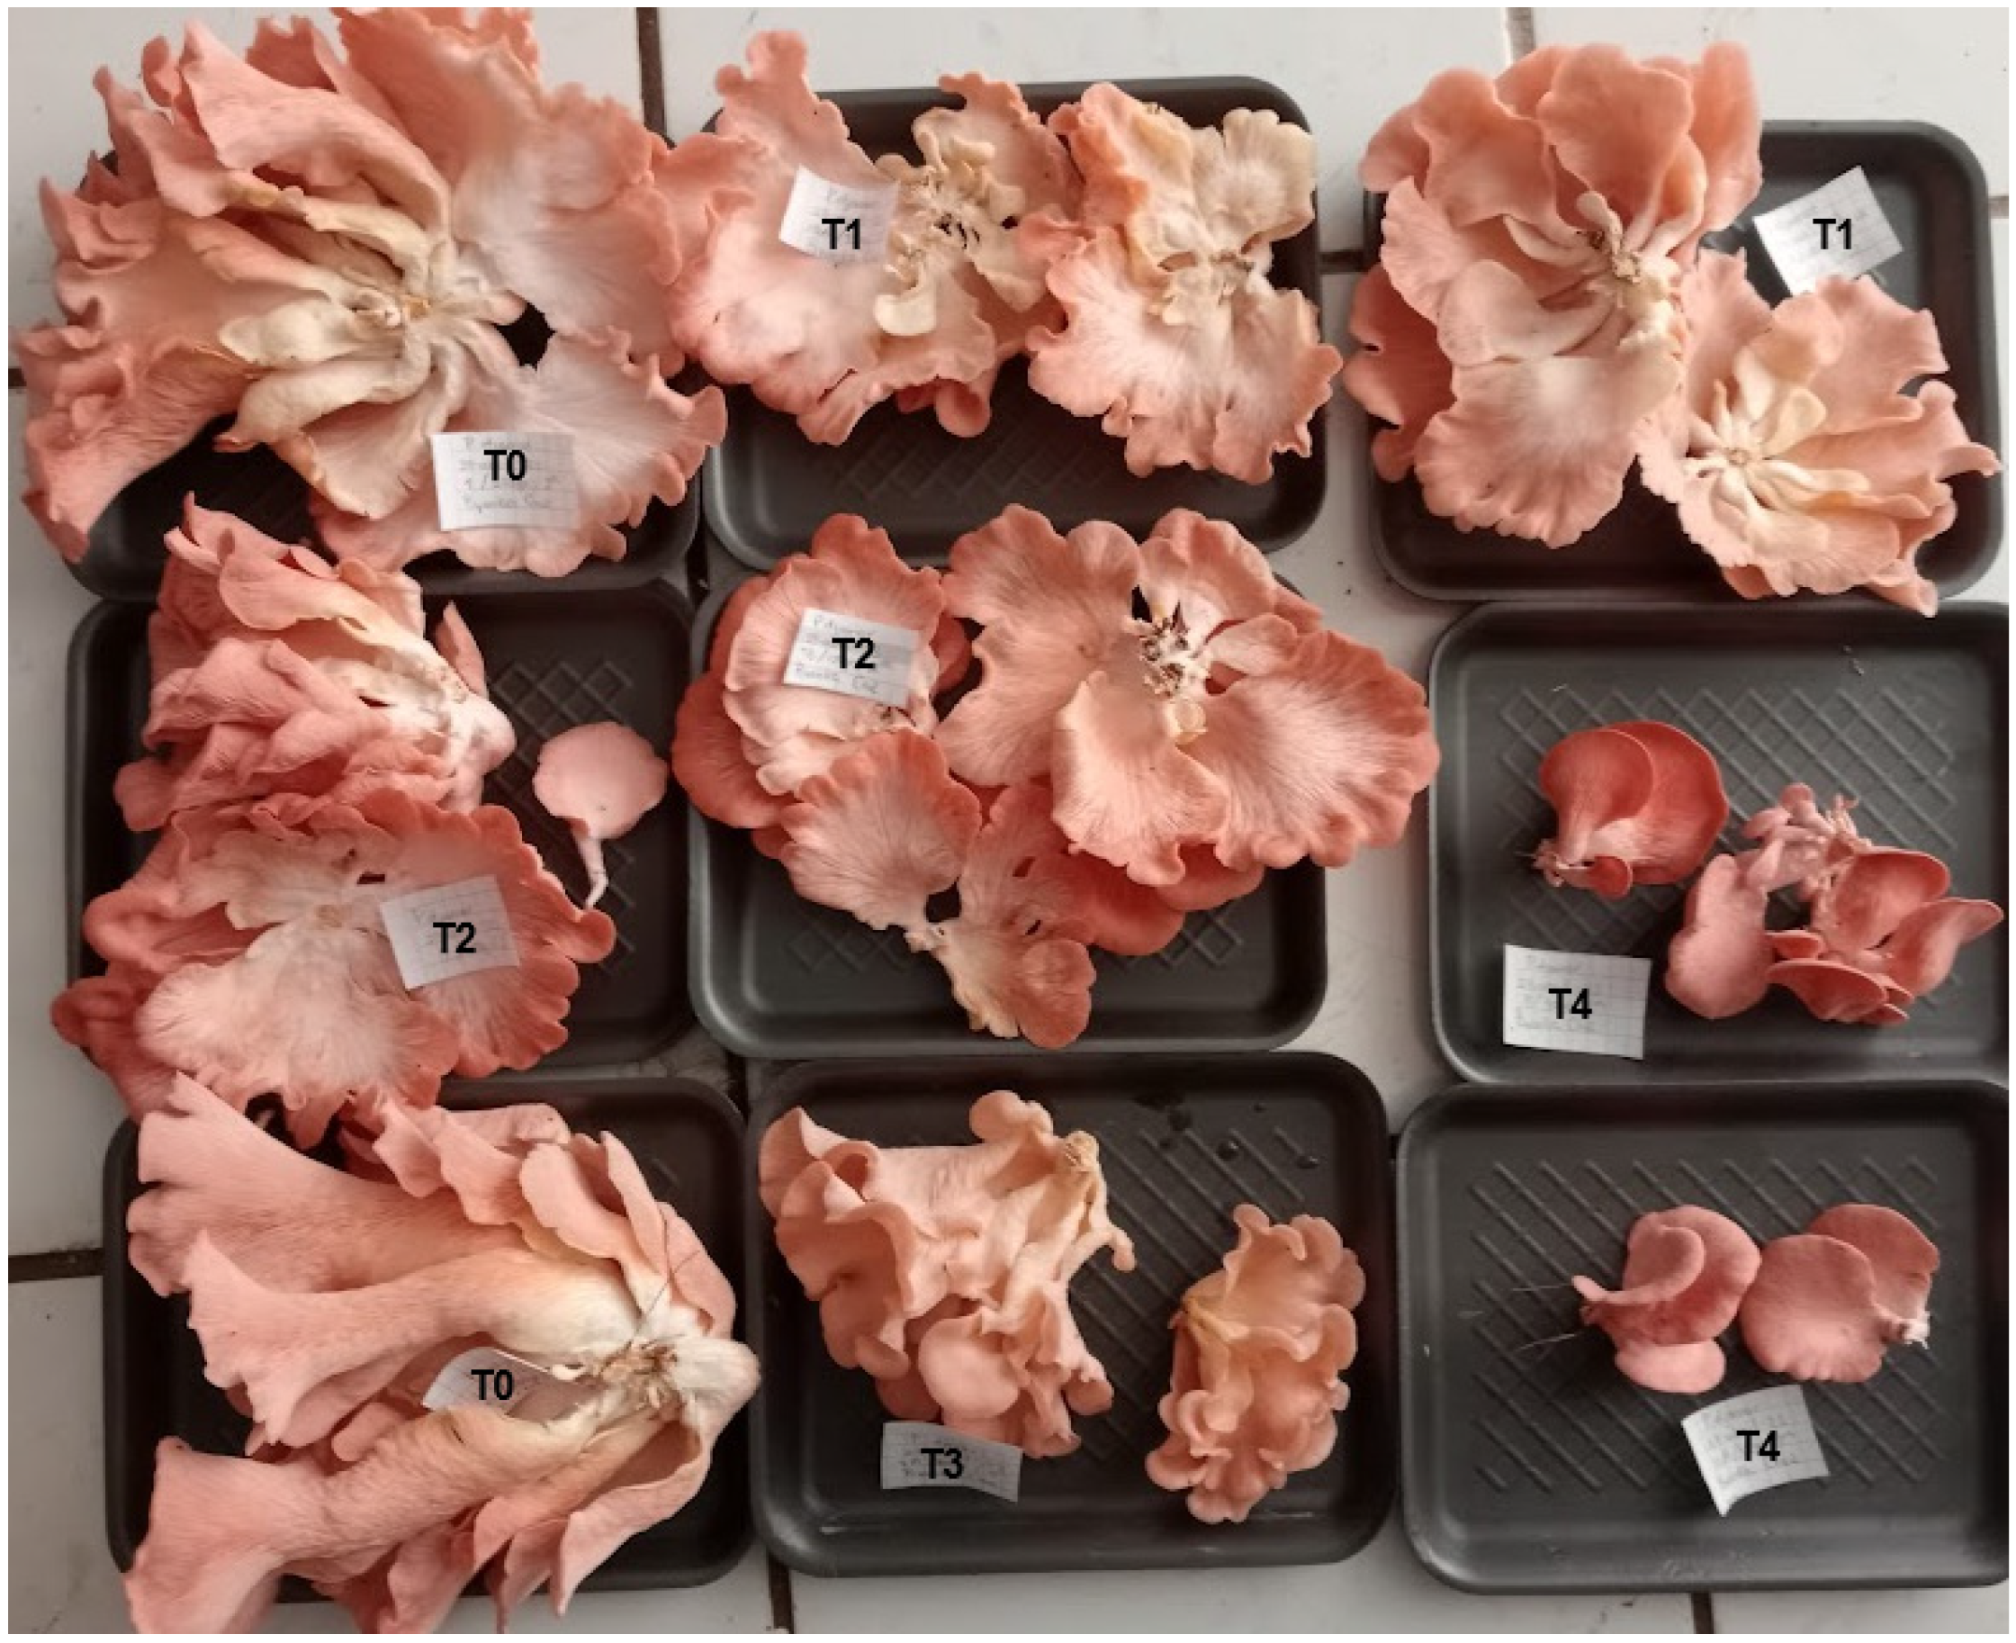
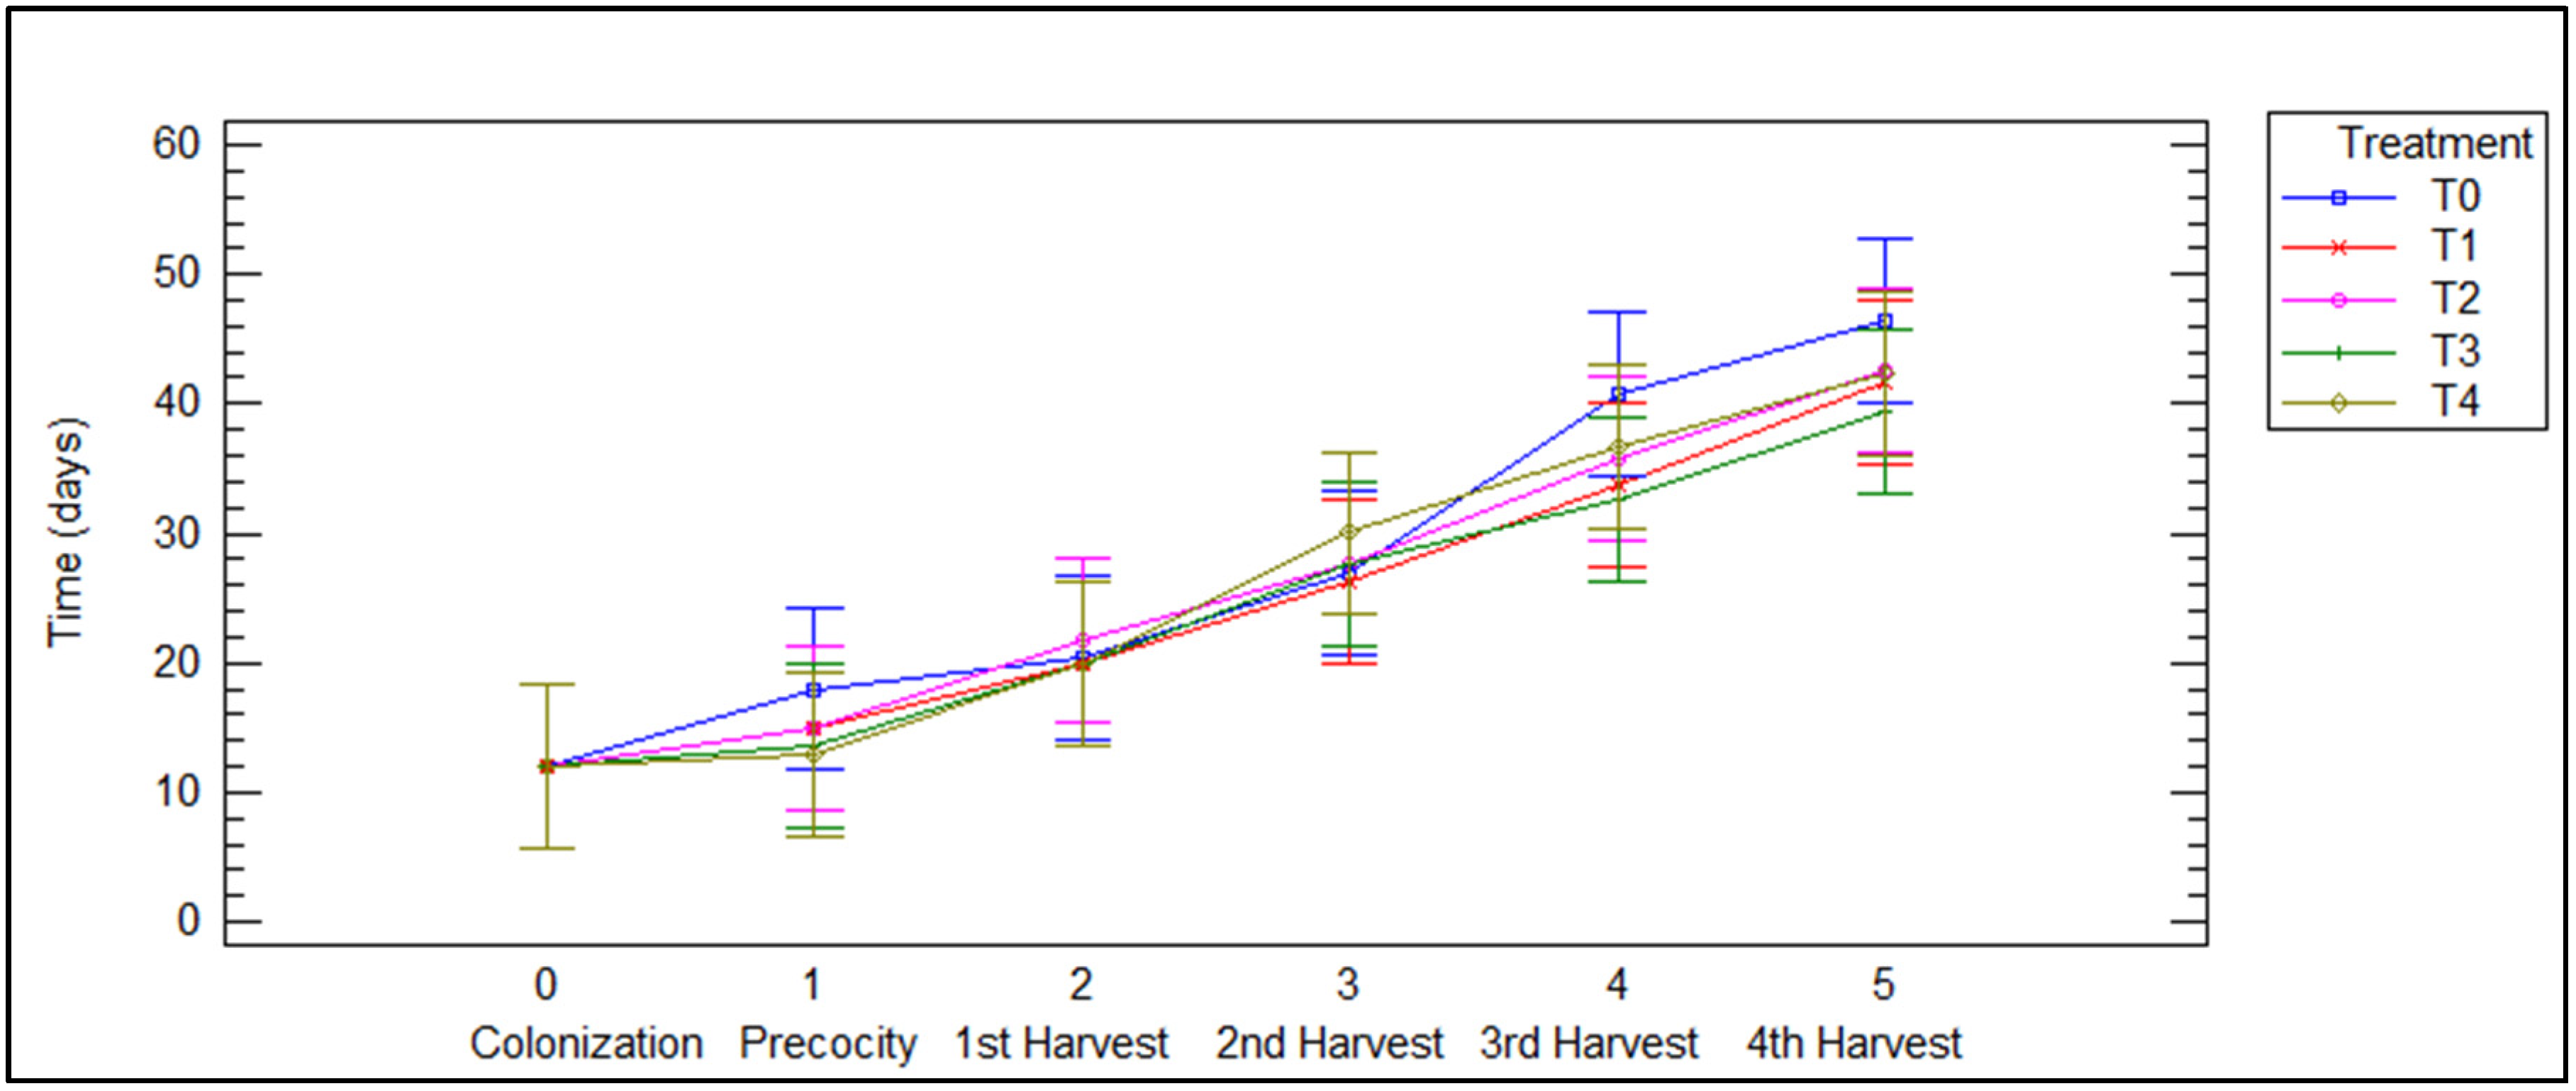
The morphological impact of different treatments on the fungi can be seen in Figure 4. The color, size, and margin of P. djamor basidiomas vary across treatments. Basidiomas obtained at T0 and T1 are pastel pink with wavy edges and are the largest. Those obtained at treatments T2 and T3 are bright pink, with wavy edges, and are slightly reduced in size. Finally, fruiting bodies at T4 are the smallest, with a deep pink hue and smooth edges. Figure 5 shows how each treatment affects development time at each stage of the fungus. In all treatments the colonization process was carried out in the same period (12 days), so there were no disadvantages or advantages in any mixture of substrates at the beginning of development; however, it can be observed that treatments with a higher proportion of agave bagasse (T3 and T4) show shorter times in the last harvests. This suggests that bagasse is a substrate that can optimize the cultivation of P. djamor by reducing the time between harvests.

2.4. Texture of the Basidiomas of P. djamor

The treatments T2, T3, and T4 show an increase in the firmness of the mushrooms compared to T0 and T1 (Table 2), which suggests that a higher concentration of agave bagasse develops a firmer texture in the mushrooms; however, no significant differences were found. We found no significant differences among the treatments in the cutting force (p > 0.05), indicating the substrate’s null participation.
Finally, no significant differences were found among the first three treatments in fracture force, with an exception between T3 (3.82 ± 1.09) and T4 (7.06 ± 3.06 N) (p < 0.05), indicating that the agave bagasse provides the mushrooms with a more resistant structure.

2.5. Lignocellulosic Content of Substrates

The average lignin, hemicellulose, and cellulose content of the different treatments is shown in Table 3. Treatment 4 (agave bagasse) shows the highest lignin content (36.6%) and, at the same time, the lowest cellulose and hemicellulose content, with statistically significant differences compared to the other treatments, which explains its low biological efficiency (36.16%). Treatment T0, on the other hand, has the highest hemicellulose content (42.01%), with statistically significant differences. Treatment T2, composed of a mixture of agave bagasse and corn stover, showed the most balanced lignocellulosic profile, with low lignin content (18.6%) and a high proportion of cellulose (24.29%), suggesting high potential as an efficient substrate for fungal growth. Treatments T1 and T3 show similar values, with no statistically significant differences.

2.6. Phenolic Compounds and Antioxidant Capacity in P. djamor

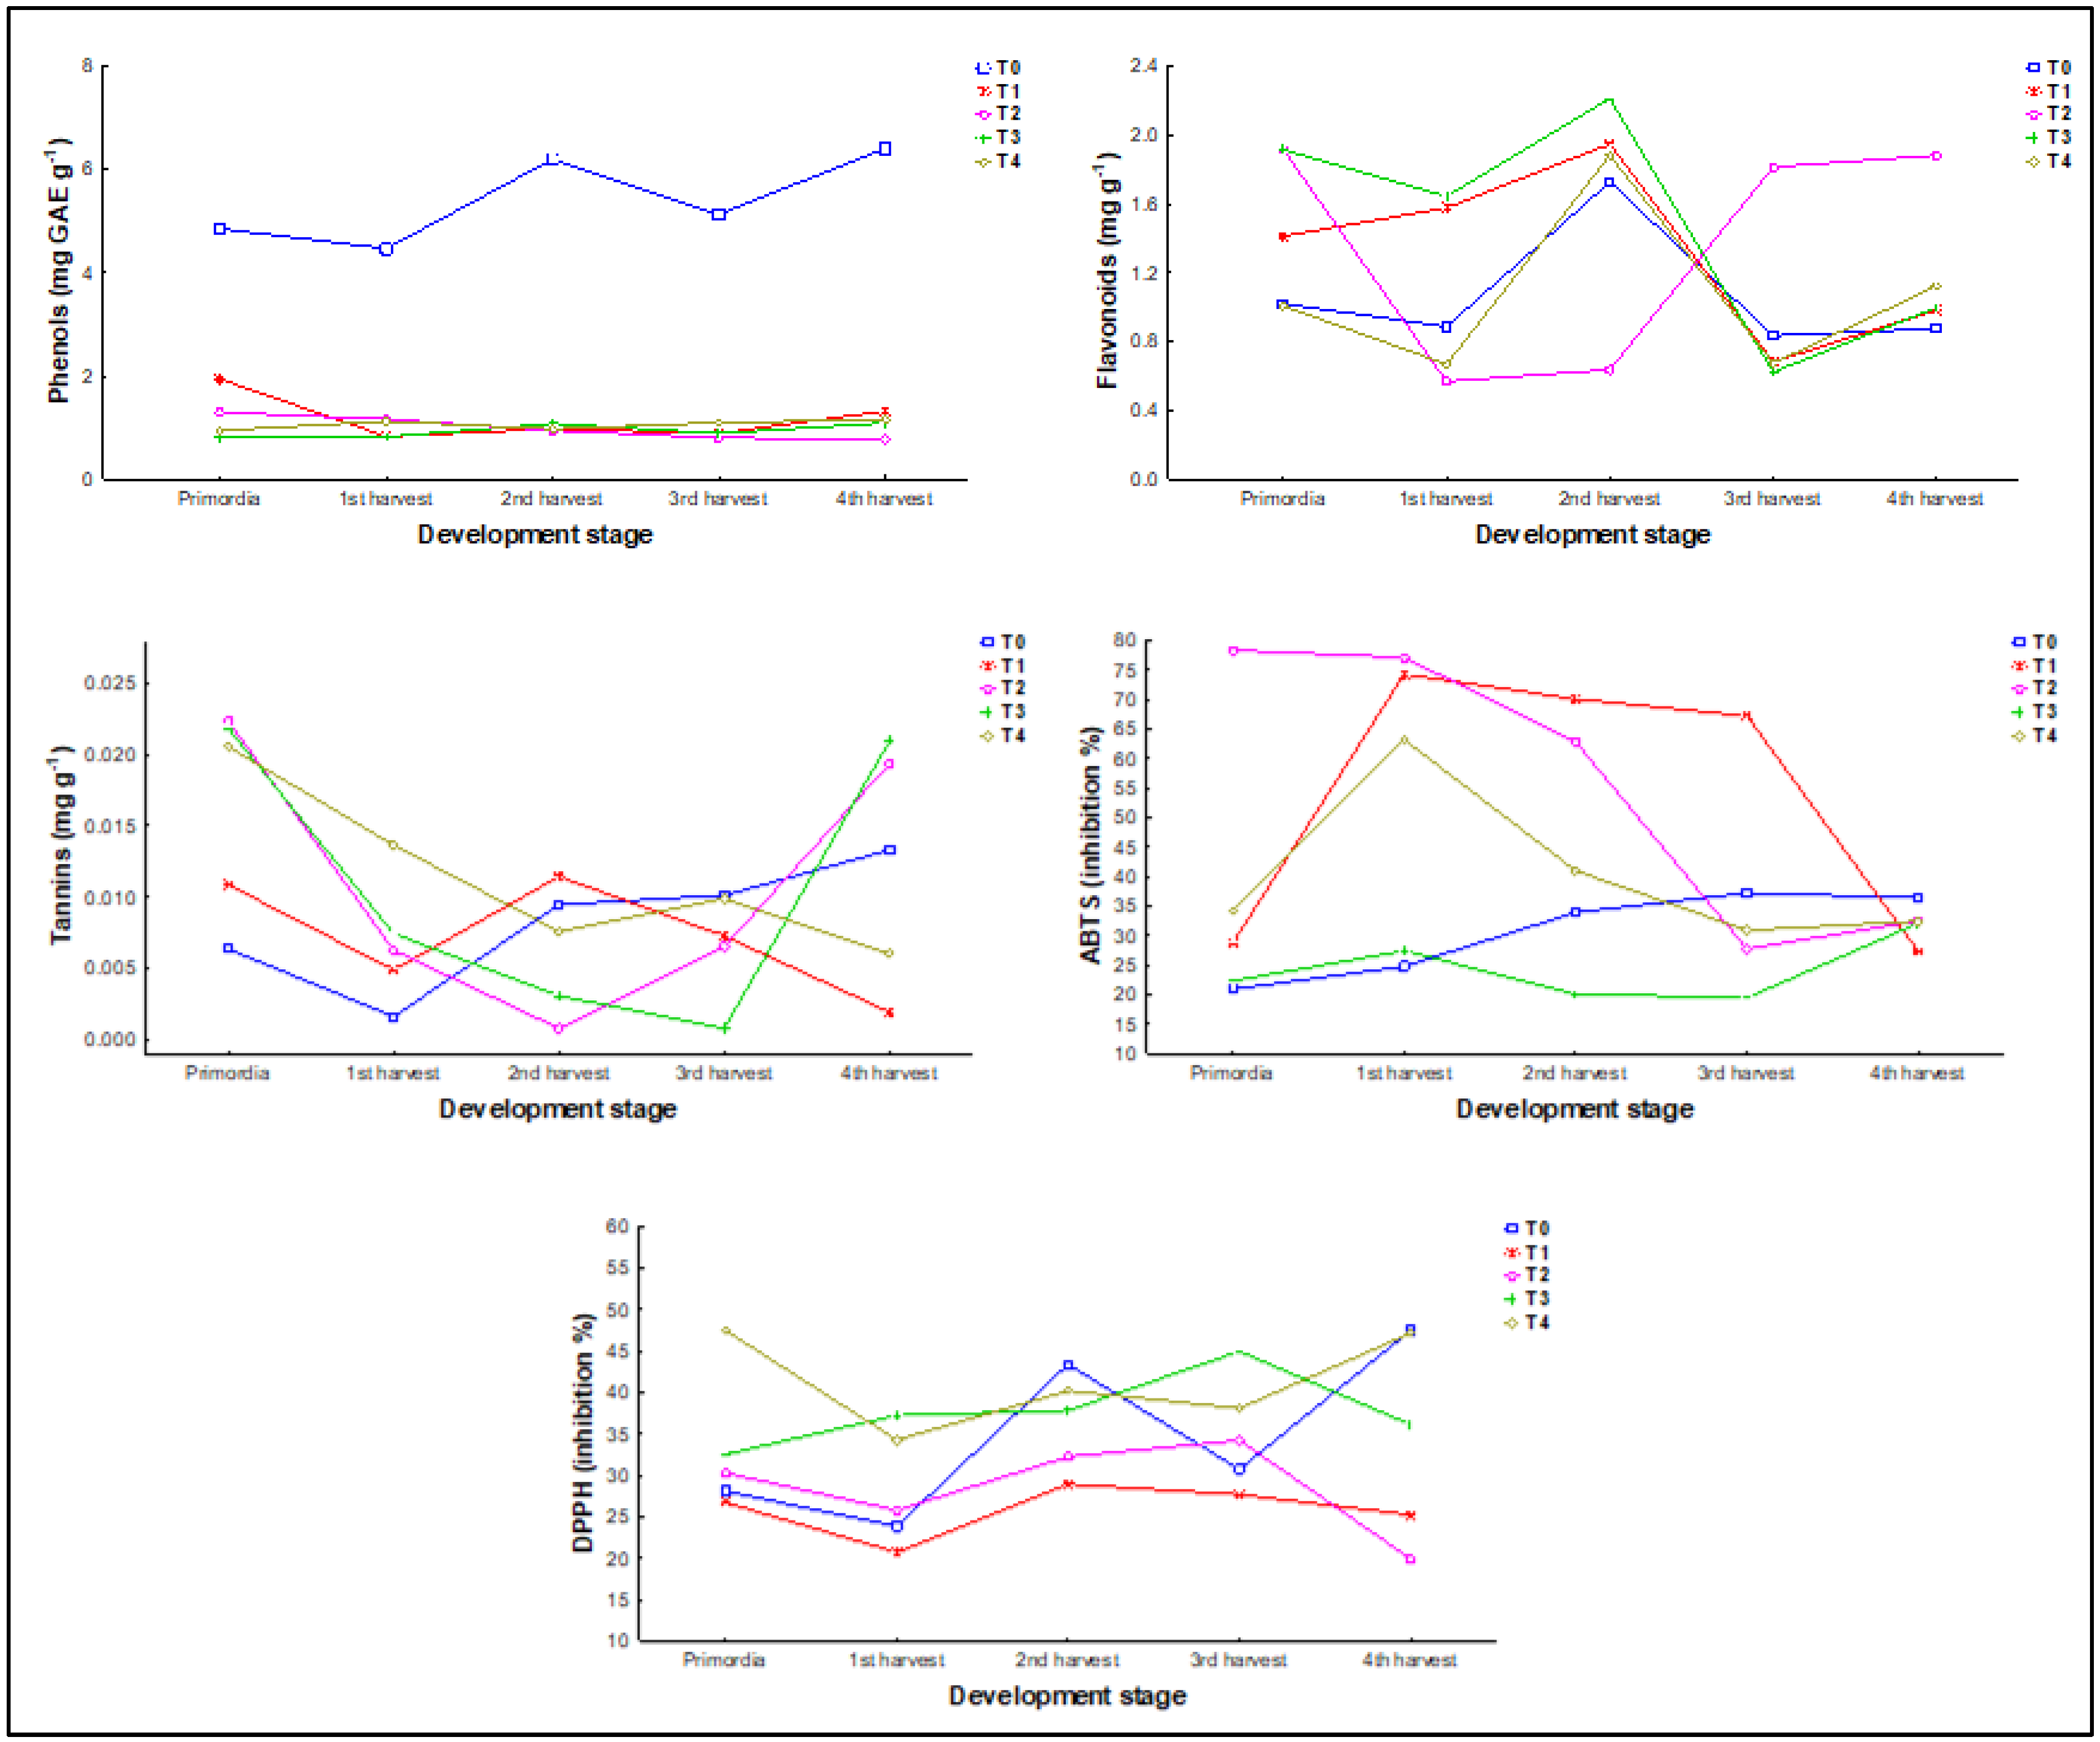
The total phenolic compound content and antioxidant capacity of P. djamor change throughout the development stage. An increase in phenols, flavonoids, and tannins will be observed as the fungus develops (Table 4). In the case of phenols, concentrations greater than the highest concentration of tannins were also found in the 2nd harvest, while the 3rd showed the lowest; however, there is an increase in concentration in the 4th harvest. Tannins were the only variable that showed significant differences (p < 0.05) between the stages of development, with the primordia and the 4th harvest being statistically like each other but different from the rest.
Contrary to the behavior of tannins observed in the comparison by developmental stage, the test grouped by treatment (Table 5) shows no significant differences in this variable, along with flavonoids (p > 0.05).
In flavonoids, excepting T2, the rest of the treatments showed a similar pattern through the developmental stages, in which the highest concentration is found in the 2nd harvest (1.68 ± 1.05 mg rutin g1) followed by a decrease in the 3rd harvest and an increase in the 4th. T2 differs from this pattern, showing the highest concentrations in primordia, 3rd (0.92 ± 0.73 mg rutin g1), and 4th harvests (1.17 ± 0.69 mg rutin g1), and the lowest in 1st and 2nd harvest.
In tannins, T2, T3, and T4 show a similar pattern through the developmental stages, beginning in primordia and ending in the 4th harvest with the highest concentrations, 0.01 ± 0.008, 0.01 ± 0.009, and 0.01 ± 0.005 mg catechin g1 respectively, forming a U shape. On the other side, T0 and T1 have a similar behavior from primordia to 3rd harvest, splitting paths for the 4th harvest, in which T1 (0.007 ± 0.004 mg catechin g1) showed a decrease in the concentration in comparison to T0 (0.008 ± 0.004 mg catechin g1).
In the case of the antioxidant capacity, for ABTS all the treatments began and ended between 20 and 35% of inhibition, with several fluctuations in the middle that did not follow a pattern. Only T2 started differently, with an inhibition above 75%. In the case of DPPH, there is a similar behavior in which four of the five treatments began between 25 and 35% of inhibition, except for T4 which started above 45%. T0 and T4 followed a W shape after primordia, which means that there was a decrease in the 1st harvest, an increase in the 2nd harvest, another decrease in the 3rd harvest, and another increase in the 4th. T1 and T2 followed a similar pattern from primordia to 3rd harvest.
In all treatments, phenol concentrations show a stable pattern throughout the different stages of development of P. djamor, without significant changes associated with growth, so it can be concluded that their synthesis and accumulation may depend more on the environmental conditions (in this case the substrate) than on the stage of development of the fungus (Figure 6).

2.7. Non-Phenolic Secondary Metabolites of P. djamor

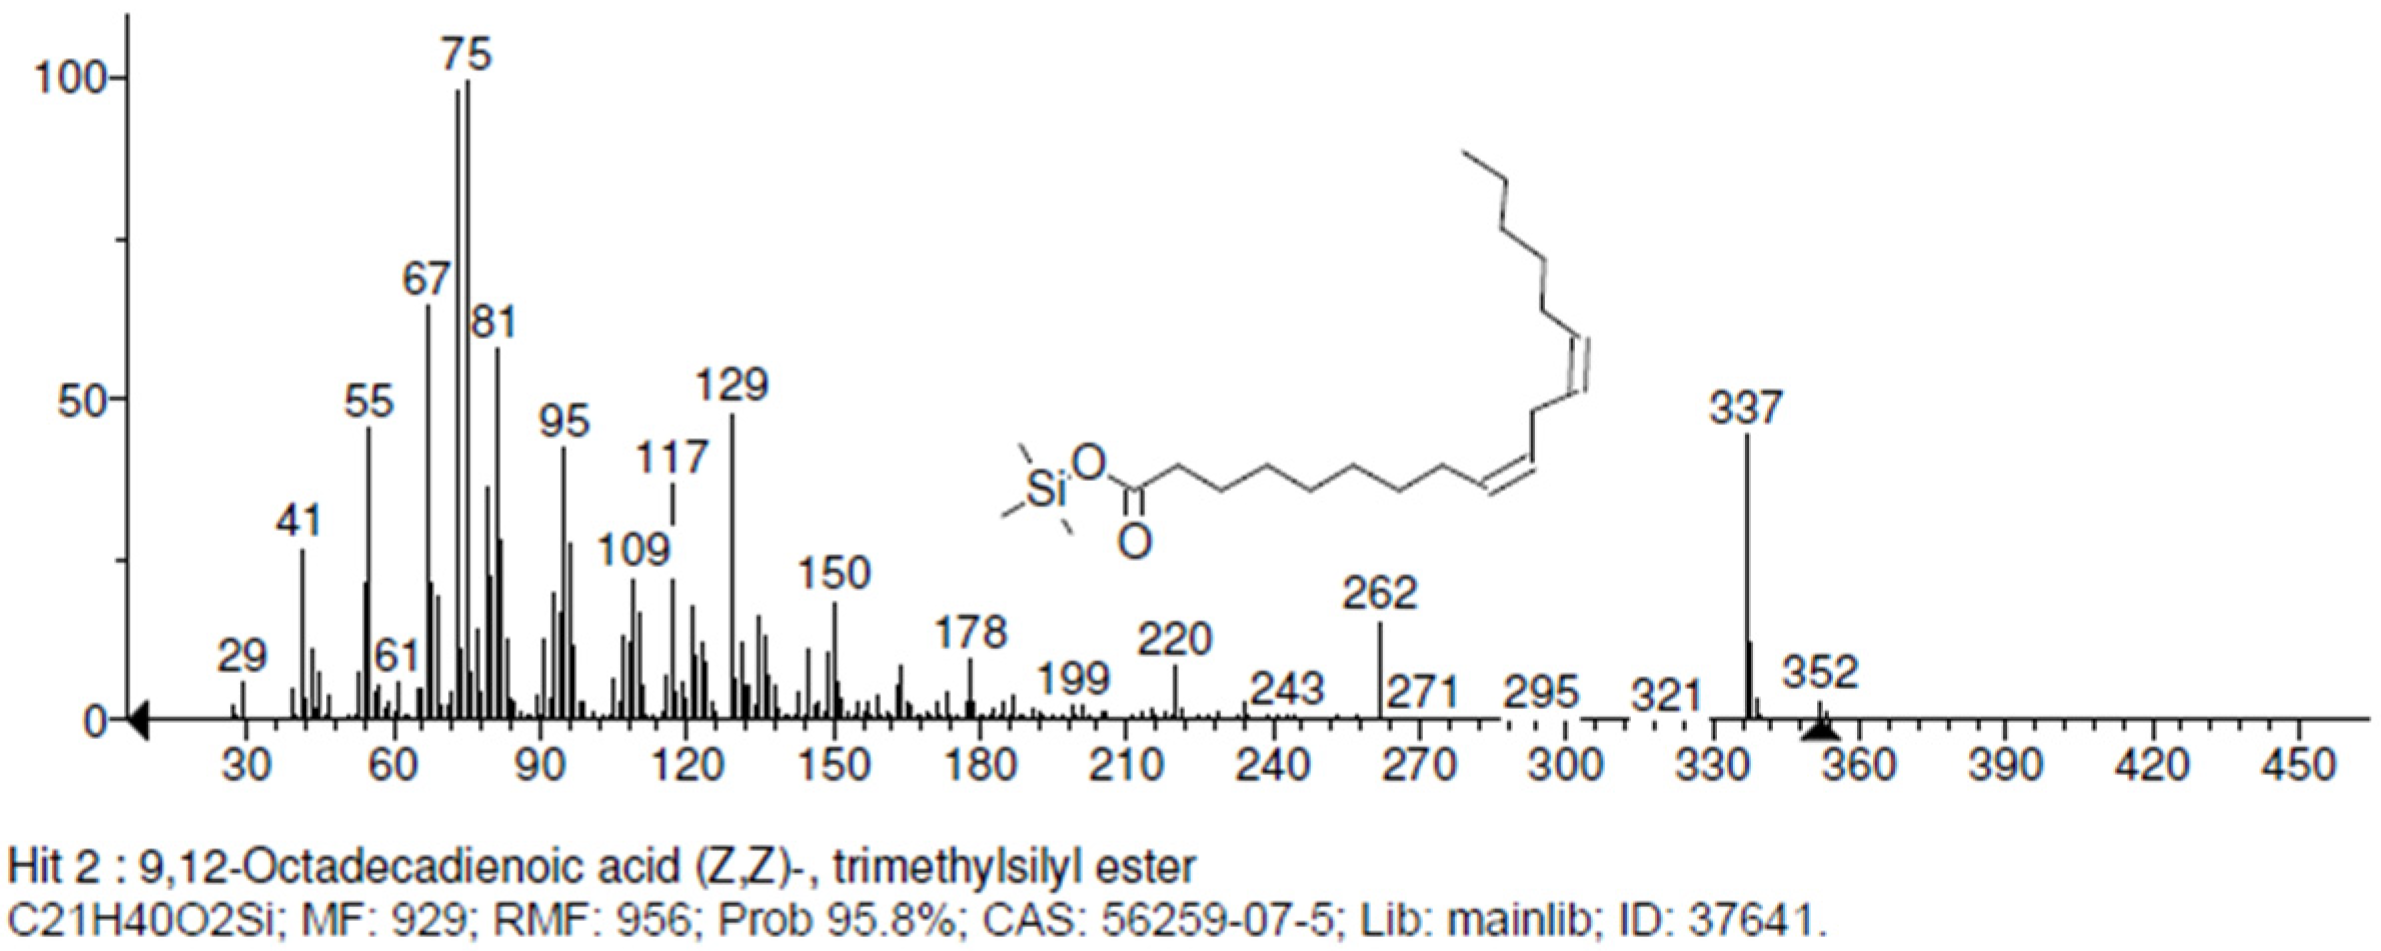
The non-phenolic metabolites present in P. djamor are shown in Table 6. Among them, four essential amino acids (L-Valine, L-Leucine, L-Isoleucine, L,D-Phenylalanine), five non-essential amino acids (L-Proline, Alanine, L-Asparagine, Serine, Glutamic acid), four fatty acids (Linoleic acid (Figure 7), Palmitic acid, Butanoic acid, Propanoic acid), one nitrogenous base (Pyrimidine), two dicarboxylic acids (Succinic acid and Hexanedioic acid), and one oxyacid (Phosphoric acid) were found, which are found in the fruiting bodies of P. djamor when grown on different substrates.

3. Discussions

3.1. Biological Efficiency (BE)

Biological efficiency showed significant differences between treatments, with the control being the one with the highest biological efficiency (T0, 103.7%), which is in line with previous research that documents corn stover as an ideal substrate for Pleurotus [13] and confirms that the experiment was conducted under optimal conditions. In contrast, T4 presented the lowest BE (36.16%), which agrees with previous research [12], highlighting that it is not a suitable substrate when used exclusively. However, when combining it with corn stover (T1), a significant improvement was observed (70.77%), demonstrating that substrate mixtures are essential to maximize biological efficiency.
Other studies conducted with agroindustrial waste suggest that substrate mixtures can increase biological efficiency with values greater than 120% compared to those using a single substrate, since the fungi exploit the different available nutrients. Therefore, both biomass production and EB are highly dependent on the nutrient content present in the substrate [10,12,14,15,16,17,18].

3.2. PCA of Substrate Mixtures

Proximate chemical analysis of the substrates used in treatments T0 to T4 revealed significant differences in their nutritional components. Substrates T2 and T4 offer a more favorable balance of protein, lipids, and fiber for Pleurotus djamor cultivation, while T0, although richer in carbohydrates, has a low protein content. The highest protein content was observed in T4 (pure bagasse), confirming that agave contributes more nitrogen than corn. These results have direct implications for the growth, yield, texture, and nutritional quality of Pleurotus djamor. Fungal growth in terms of time (days) was similar in each treatment. Yield in terms of EB and textural and nutritional quality (in terms of secondary metabolites) showed significant differences between treatments.
Each of these differences is addressed in more detail in each section.
It is noteworthy that, upon completion of the growth cycle of P. djamor in the spent substrate mixtures at T3, the protein and ELN content of said substrate increase, which may be due to the remnants of protein- and enzyme-rich mycelium. This phenomenon was previously described by [19] for Pleurotus ostreatus.

3.3. The Morphological Impact

The results obtained agree with previous research, which indicates that fungi of the genus Pleurotus have high adaptability to different lignocellulosic substrates, such as sugarcane bagasse and sawdust, as well as to different agroindustrial waste, and consequently they can grow and produce fruiting bodies although the yield and biological efficiency may vary depending on the proportions and combinations used. Furthermore, the different stages of development such as colonization (12 days), precocity (14.7 days), and fruiting (20.6 days), as well as the total production time (42.6 days) on average, compare with what was previously reported [20].

3.4. Texture of P. djamor

Regarding textural parameters, treatments that included a greater amount of agave bagasse (T2–T4) generated firmer and more resistant fruiting bodies. Although no significant differences in firmness or shear strength were detected between the different treatments, significant differences were noted in fracture resistance, with T4 showing the greatest resistance (7.06 ± 3.06 N). This indicates that agave bagasse has an impact on the structure of the mushroom, likely due to the high concentration of lignocellulosic components (lignin 31.6%, hemicellulose 15.97%, and cellulose 8.84%), which reinforce the cellular matrix.
From a commercial perspective, the increase in fracture resistance is significant, given that a more resistant mushroom simplifies its transport and storage.
However, it would be ideal to evaluate its effect in terms of palatability and functionality as a food. Our results are very similar to those obtained in texture tests conducted on P. ostreatus, whose fracture strength values range from 1 to 10 N, shear strength from 0.3 to 0.8 N, and firmness from 0.4 to 0.7 N, which is consistent with the observed values of 1.83 to 7.06 N fracture strength, 0.24 to 0.45 N shear strength, and 0.47 to 0.91 N firmness strength [21].

3.5. Lignocellulosic Content of P. djamor

The lignocellulosic characterization of the substrates showed significant differences in the amounts of lignin, hemicellulose, and cellulose, factors that directly affect nutrient availability [22]. Lignin is the most difficult component to degrade within the lignocellulosic matrix, so substrates with a high content of this polymer can reduce the bioavailability of cellulose and hemicellulose for fungi, thus affecting both their metabolic efficiency and development [23]. Therefore, treatment T4 (100% agave bagasse) is the least suitable substrate for the development of P. djamor due to the imbalance between the high lignin content (31.6%) and the low cellulose content (8.84%), which is reflected in the biological efficiency results, with T4 being the lowest of the five treatments at 36.16%.

3.6. Phenolic Compounds and Antioxidant Activity

During the different developmental stages of P. djamor, changes in the concentrations of phenolic compounds were observed. Flavonoids reached their maximum levels in the second harvest, phenols did so in the fourth harvest, and tannins followed a U-shaped pattern; the latter were the only ones that presented statistically significant differences. This suggests that the synthesis of secondary metabolites is partially influenced by the physiological changes of the fungus during its growth.
These changes in the concentration of secondary metabolites, depending on the developmental stage, have been previously verified in studies conducted on edible mushrooms. These indicate that secondary metabolites accumulate as the fruiting body matures, as they function as a defense mechanism and attract organisms for spore dispersal. This is consistent with the results of this study, as the levels of phenolic compounds are higher in the initial and final stages of fungal development [9,24,25,26].
Research indicates that the P. djamor mushroom contains a large amount of phenolic and non-phenolic metabolites. The quantity and composition depend largely on the substrate on which they develop, as well as the stage of development in which they are found.
The levels of phenols and tannins, as well as the antioxidant capacity, presented significant differences depending on the substrate on which it is developed. In this case, the control (T0) presented the highest concentrations of phenols (5.41 ± 0.92 mg GAE g1), which suggests that corn stover is more efficient in stimulating the synthesis of these compounds and is aligned with studies that attribute a high capacity to corn stover to induce production of bioactive compounds due to their chemical composition and availability of phenolic precursors. Therefore, phenol levels in fungi are directly influenced by the substrate and environmental conditions during cultivation [27,28,29].
The antioxidant activity in P. djamor presents significant differences depending on the substrate; while T2 stood out in ABTS (55.72%), T4 presented the highest percentage of inhibition in DPPH (61.83%), so the substrate culture showed a direct impact on the antioxidant capacity. On the other hand, there is variability in the antioxidant capacity between methods, which has been reported in the literature, such as in the works of Barros et al. [30] who highlight that antioxidant capacity evaluation methods are not always comparable due to differences in reaction mechanisms, and is also indicated by Dewanto [31] and Patel [32] since the DPPH method mainly measures antioxidant activity against specific free radicals while ABTS is more effective on hydrophilic and lipophilic compounds.

3.7. Non-Phenolic Secondary Metabolites of P. djamor

The compounds L-valine, L-leucine, L-proline, succinic acid, propanoic acid, pyrimidine, serine, butyric acid, phosphoric acid, linoleic acid, and D-(+)-trehalose octakis(trimethylsilyl) are present in all treatments, so it can be inferred that they are part of the metabolism of P. djamor, regardless of the substrate in which it grows, which compares with what was reported by Fogarasi [33] and Cruz-Moreno [12]. On the other hand, there are compounds that are only expressed in one of the treatments, such as butanoic acid, succinic acid, hexanedioic acid, glutamic acid, 4-hydroxyphenylethanol di-TMS, and 2,3,4-trihydroxybutyric acid derivatives, which are only present in treatment T0 (corn stubble). D-ribohexitol, 3-deoxy-1,2,4,5,6-pentakis-O-(trimethylsilyl) acid, and pentanedioic acid are only present in T1, whereas 2-pyrrolidone-5-carboxylic acid, trimethylsilyl ester, and alanine are only present in T4 (agave bagasse). Furthermore, the presence of essential amino acids is observed to increase with agave bagasse concentration.

4. Materials and Methods

4.1. Reagents and Instruments

Bradford reagent, rutin (#CAS 153-18-4), gallic acid (#CAS149-91-7), vanillin (#CAS 121-33-5), hydrochloric acid, catechin (#CAS 7295-85-4), transcinnamic acid (#CAS 140-10-3), DPPH (2-2 diphenyl-1-picrylhydrazyl) (#CAS 1898-66-4), TROLOX ((+/−)-6-Hydroxy-2,5,7,8-tetramethylchromane-2-carboxylic acid) (#CAS 53188-07-1), ABTS (2,2′-azino-bis(3-ethylbenzothiazolin-6)-sulfonic)) (#CAS 30931-67-0), potassium persulfate (K2S2O8), 2-aminoethyldiphenyl borate, Folin-Cicalteau reagent, N,O-bis (trimethylsilyl) trifluoroacetamide with 1% trimethylchlorosilane (BSTFA (#CAS 27699-84-7) +1% TMCS (#CAS 75-77-4)). Extraction solvents: dichloromethane (#CAS 75-09-2) and methanol, salicylic acid (#CAS 69-72-7), hydrogen peroxide (AS 7722-84-1), ethanol (#CAS 64-17-5), and methanol (#CAS67-56-1) for spectrophotometric determinations.
GC-MS analyses were performed using an Agilent 5975 chromatograph equipped with a mass detector (Agilent, 5975C, California, CA, USA) Texture analyzer (TA-HDi Model, TexturePro CT V1.6, Massachusetts, MA, USA), ANKOM digestion apparatus (New York, NY, USA), Multiskan GO (Genesys 10S UV-Vis, Waltham, Massachusetts, MA, USA) spectrophotometer, and centrifuge from Thermo Scientific (Waltham, MA, USA).

4.2. Biological Treatment

The experiments were carried out at the Autonomous University of Querétaro, Amazcala campus. The substrates were made from agricultural wastes of agave bagasse and corn stover in different proportions (Table 7); the mixtures were sterilized in boiling water for 4 h and then placed in plastic bags with 1 kg each.
The bags were allowed to cool and were inoculated with 100 g of sorghum seeds with P. djamor mycelium for 15 days. The previously labeled bags were placed in a growth chamber in total darkness, with a temperature between 25 and 30 °C and humidity at 80%. The development of the mushrooms was recorded every day. For this study, five developmental stages were considered: (1) Primordia; (2) 1st harvest; (3) 2nd harvest; (4) 3rd harvest; and (5) 4th harvest. The biological efficiency (BE) was calculated according to the following Formula (1).
B E = W e i g h t   o f   f r e s h   m u s h r o o m D r y   S u b s t r a t e   W e i g h t     ( 100 )

4.3. Proximate Chemical Analysis of Substrates

To determine the nutritional components provided by each treatment to the fungus, a proximate chemical analysis (PCA) was performed for each treatment, considering the variables moisture, protein, ether extract, ash, crude fiber, and nitrogen-free extract (NFE). The methods are presented in Table 8. The results are expressed in dry matter.

4.4. Lignocellulosic Content of Substrates

Because the fungus P. djamor naturally develops on stumps of different tree species, which are rich in lignocellulose, it is important to know the quantity of lignocellulose present in each treatment, so the quantities of lignin, cellulose, and hemicellulose of each of them (T0 to T4) were determined using the ANKOM method.
For this purpose, a 0.5 g dry and ground sample was placed in the previously weighed and labeled Ankom filter bags. These bags were sealed and digested in the ANKOM system at 100 °C in 2 L of NDF solution and 50 mL of thermostable α-amylase for one hour. After this time, the apparatus was purged, 2 L of water were added, and two rinses were performed at 100 °C for 5 min. They were then left to dry for 24 h in an oven at 100 °C and weighed. To determine FDA, the bags were weighed again and reintroduced into the ANKOM device to digest, this time in 2 L of a solution composed of 40 g of cetyltrimethylammonium bromide (CTAB) and 2 L of 1.00 N H2SO4 at 100 °C for 1 h. Upon completion, they were dried and weighed again. Finally, to determine the lignin content, 500 mL of 97% H2SO4 were used in a beaker in which the filter bags were immersed for 4 h with stirring at intervals, and the rinsing, drying, and weighing process was repeated.

4.5. Texture of P. djamor

Once the basidiomas of P. djamor were obtained, the texture they acquired was evaluated according to the different treatments on which they developed. Using the freshly harvested fruiting bodies, firmness strength, shear strength, and fracture strength were measured in triplicate with the texture analyzer (TA-HDi Model Texture Analyzer; TexturePro CT V1.6 Build).
Fresh P. djamor mushroom was placed on the texture analyzer work platform with the following configuration: test mode: measure the force in compression; test speed: 1 mm s−1; test distance: 3 mm.

4.6. Methanolic Secondary Metabolites in P. djamor and Substrates

Phenolic metabolites present in the fruiting bodies of P. djamor were quantified for each treatment and for each stage of its development. For this purpose, 0.2 g of each lyophilized, ground, and sieved sample was taken; subsequently, 10 mL of 80% aqueous methanol was added, the sample was sonicated for 30 min, centrifuged at 5000 rpm for 10 min at 4 °C, and finally, the supernatant was obtained. Finally, the supernatant was obtained for use in subsequent determinations [36]. The supernatant was used for tests on total phenolic content, flavonoids, tannins, DPPH, and ABTS.
The total phenolic content of the samples was determined according to the colorimetric method of Folin–Ciocalteu [31], with modifications. Absorbances were measured at 760 nm, and gallic acid was used as a reference standard. The results are expressed in mg of gallic acid equivalent per g of dried mushroom (mg GAE g−1).
The flavonoid content was determined according to the method in [37], with modifications. Absorbances were measured at 404 nm with a routine standard curve. The results are expressed in mg of rutin equivalent per g of mushrooms (mg g−1).
The content of condensed tannins was determined according to the method of [36]; performing a calibration curve of 1 mg mL−1 catechin, the absorbance was measured at 492 nm. The results are expressed in mg of catechin equivalent per g of mushroom (mg g−1).
The determination of the antioxidant capacity by the DPPH method was carried out with a calibration curve with Trolox. The absorbance readings were carried out at 520 nm at different times until the reaction stabilized; in this case, the reading that was used was performed at 90 min. The antiradical activity (inhibition %) was calculated by the percentage of DPPH decolorization using Equation (2) [37].
I n h i b i t i o n   % = 1 ( A b s m B l c ( B l c / C t r o l ) )     100
The determination of the antioxidant capacity by the ABTS method was carried out according to [38], using a calibration curve with Trolox; absorbance readings were carried out at 734 nm. The results are expressed in inhibition %. The ABTS antioxidant capacity was calculated using Equation (3).
I n h i b i t i o n   % = I n i t i a l   a b s F i n a l   a b s I n i t i a l   a b s     100

4.7. Non-Phenolic Secondary Metabolites of P. djamor

The identification of low-molecular-weight metabolites was carried out as follows. Freeze-dried and ground samples were taken at room temperature with pure methanol (99.98% HPLC grade). They were then mixed in a vortex and sonicated for 15 min. Subsequently, they were shaken for 3 h and then centrifuged for 10 min at 12,000 RCF. The resulting supernatant was dried under vacuum (Savant SC210A, Thermo Scientific) and derivatized by adding BSTFA + 1% TCS in an ultrasonic bath for 30 s and shaken for 1 min using a vortex.
The extracts were filtered through a 0.45 µm PTFB membrane and analyzed by gas chromatography-mass spectrometry (GC-MS) with the detector configured at 70 eV electronic energy and a mass range of 50–700 m/z. An HP-5MS column (30 m × 0.25 mm, 0.25 μm) was used for separation. The heating ramp was set according to [39]. Helium was used as a carrier gas with a flow rate of 1 mL min−1 and a concentration ratio of 1:10. Mass spectra were compared to the NIST standard reference database (NIST 11) to identify metabolites with a similarity score greater than 80%.

4.8. Statistical Analysis

Statistical analysis was performed using STATISTICA 7 and STAT GRAPHICS, with a significance level of p < 0.05. Non-parametric statistics were used: Kruskall–Wallis ANOVA and Fisher’s LSD for multiple comparisons of means, and the Mann–Whitney U test for comparisons of means before and after treatment.

5. Conclusions

The different concentrations of agave bagasse used in the P. djamor treatments produced basidiomas with notable variations in color, size, and margin. Control treatments (T0) and T1 produced larger basidiomas with low coloration and lobed margins, whereas treatments with higher bagasse concentrations (T3 and T4) produced small, intensely colored basidiomas with smooth margins. Treatments with a higher proportion of agave bagasse (T3 and T4) showed the lowest efficiencies (<40%), whereas the mixture with corn straw (T1) presented a biological efficiency greater than 70%. Agave bagasse increased protein content (T4), whereas corn straw favored higher levels of soluble carbohydrates (T0). The greater firmness and resistance of basidiomas grown in mixtures with agave bagasse (T3 and T4) indicates that this substrate contributes to improved structure. The synthesis of phenols, flavonoids, and tannins varied with fungal development but did not follow a linear pattern. Phenol levels remained stable, suggesting that its accumulation depends more on the type of substrate than on the growth stage. Antioxidant capacity increased in T4, suggesting that agave bagasse produces more bioactive compounds.
These results can be targeted toward specific production goals based on individual interests, helping producers choose the most attractive substrate.
In summary, it can be said that cultivating P. djamor on agave bagasse supports sustainable agroecological practices by utilizing tequila industry waste to produce food. This creates a circular economy model and helps improve food security in the region.

Author Contributions

Conceptualization: A.A.F.-P. and B.A.C.-M.; methodology, B.A.C.-M.; investigation: B.A.C.-M. and B.P.-P.; resources, J.C.S.-J., H.A.-B. and J.F.G.-T. writing—original draft preparation: B.A.C.-M. and A.A.F.-P.; writing: B.A.C.-M.; visualization: B.A.C.-M. and L.G.A.-L.; analysis and interpretation of data: L.G.A.-L.; manuscript drafting, conceptualization, data retention, and formal analysis: B.A.C.-M. and L.G.A.-L. supervision: A.A.F.-P., J.C.S.-J., H.A.-B. and J.F.G.-T. All authors have read and agreed to the published version of the manuscript.

Funding

This research received for the financial support provided by CONAHCyT through the B.A. Cruz-Moreno CVU 821765.

Data Availability Statement

The data presented in this study are available on request from the corresponding author.

Acknowledgments

The authors are grateful for the financial support provided by CONAHCyT through the B.A. Cruz-Moreno CVU 821765 to carry out her doctoral studies.

Conflicts of Interest

The authors declare no conflicts of interest. The funders had no role in the design of the study; in the collection, analyses, or interpretation of data; in the writing of the manuscript; or in the decision to publish the results.

Abbreviations

The following abbreviations are used in this manuscript:
BEBiological efficiency
NFENitrogen-free extract
CFCrude fiber
SDStandard deviation
NNewtons

References

  1. Kumar, S.; Pandey, A.K. Chemistry and Biological Activities of Flavonoids: An Overview. Sci. World J. 2013, 2013, 162750. [Google Scholar] [CrossRef]
  2. Sandargo, B.; Chepkirui, C.; Cheng, T.; Chaverra-Muñoz, L.; Thongbai, B.; Stadler, M.; Hüttel, S. Biological and chemical diversity go hand in hand: Basidiomycota as source of new pharmaceuticals and agrochemicals. Biotechnol. Adv. 2019, 37, 107344. [Google Scholar] [CrossRef]
  3. Zhang, J.; Liu, M.; Yang, Y.; Lin, L.; Xu, N.; Zhao, H.; Jia, L. Purification, characterization and hepatoprotective activities of mycelia zinc polysaccharides by Pleurotus djamor. Carbohydr. Polym. 2016, 136, 588–597. [Google Scholar] [CrossRef]
  4. Nayak, H.; Kushwaha, A.; Behera, P.C.; Shahi, N.C.; Kushwaha, K.P.; Kumar, A.; Mishra, K.K. The Pink Oyster Mushroom, Pleurotus djamor (Agaricomycetes): A Potent Antioxidant and Hypoglycemic Agent. Int. J. Med. Mushrooms 2021, 23, 29–36. [Google Scholar] [CrossRef]
  5. El-Ramady, H.; Abdalla, N.; Badgar, K.; Llanaj, X.; Törős, G.; Hajdú, P.; Eid, Y.; Prokisch, J. Edible Mushrooms for Sustainable and Healthy Human Food: Nutritional and Medicinal Attributes. Sustainability 2022, 14, 4941. [Google Scholar] [CrossRef]
  6. Pineda-Alegría, J.A.; Peña-Rodríguez, L.M.; Cardoso-Taketa, A.; Sánchez, J.E.; Torres-Acosta, J.F.D.J.; Hernández-Bolio, G.I.; Ortiz-Caltempa, A.; Villarreal, M.L.; Aguilar-Marcelino, L. 1H-NMR Metabolomic Study of the Mushroom Pleurotus djamor for the Identification of Nematocidal Compounds. Pharmaceuticals 2024, 17, 580. [Google Scholar] [CrossRef]
  7. Amirullah, N.A.; Abdullah, E.; Zainal Abidin, N.; Abdullah, N.; Manickam, S. Therapeutic potential of mushrooms: A review on NF-κB modulation in chronic inflammation. Food Biosci. 2024, 62, 105059. [Google Scholar] [CrossRef]
  8. Yang, W.; Guo, F.; Wan, Z. Yield and size of oyster mushroom grown on rice/wheat straw basal substrate supplemented with cotton seed hull. Saudi J. Biol. Sci. 2013, 20, 333–338. [Google Scholar] [CrossRef]
  9. Kalač, P. A review of chemical composition and nutritional value of wild-growing and cultivated mushrooms. J. Sci. Food Agric. 2013, 93, 209–218. [Google Scholar] [CrossRef]
  10. Bellettini, M.B.; Fiorda, F.A.; Maieves, H.A.; Teixeira, G.L.; Ávila, S.; Hornung, P.S.; Júnior, A.M.; Ribani, R.H. Factors affecting mushroom Pleurotus spp. Saudi J. Biol. Sci. 2019, 26, 633–646. [Google Scholar]
  11. Valenzuela-Cobos, J.D.; Grijalva-Endara, A.; Marcillo-Vallejo, R.; Garcés-Moncayo, M.F. Production and characterization of reconstituted strains of Pleurotus spp. Cultivated on different agricultural wastes. Rev. Mex. Ing. Quim. 2020, 19, 1493–1504. [Google Scholar] [CrossRef]
  12. Cruz-Moreno, B.A.; Pérez, A.A.F.; García-Trejo, J.F.; Pérez-García, S.A.; Gutiérrez-Antonio, C. Identification of Secondary Metabolites of Interest in Pleurotus djamor Using Agave tequilana Bagasse. Molecules 2023, 28, 557. [Google Scholar] [CrossRef] [PubMed]
  13. Vega, A.; Franco, H. Productivity and quality of the fruiting bodies of edible mushrooms Pleurotus pulmonarius RN2 and P. djamor RN81 and RN82 grown on different lignocellulosic substrates. Inf. Tecnol. 2013, 24, 69–78. [Google Scholar] [CrossRef]
  14. Baktemur, G.; Kara, E.; Yarar, M.; Yilmaz, N.; Ağçam, E.; Akyildiz, A.; Taşkin, H. Yield, quality and enzyme activity of shiitake mushroom (Lentinula edodes) grown on different agricultural wastes. Not. Bot. Horti Agrobot. 2022, 50, 12553. [Google Scholar] [CrossRef]
  15. Daşdelen, O.; Shimira, F.; Kara, E.; Baktemur, G.; Taşkin, H. Effects of different agricultural wastes on yield and quality in Pholiota nameko cultivation. Int. J. Agric. Environ. Food Sci. 2022, 6, 537–544. [Google Scholar] [CrossRef]
  16. Karmani, M.; Subramaniam, G.; Sivasamugham, L.A.; Cheng, W.H.; Wong, L.S. Effects of Different Substrates on the Growth and Nutritional Composition of Pleurotus ostreatus: A Review. J. Exp. Biol. Agric. Sci. 2022, 10, 481–486. [Google Scholar] [CrossRef]
  17. Mkhize, S.S.; Cloete, J.; Basson, A.K.; Zharare, G.E. Performance of Pleurotus ostreatus mushroom grown on maize stalk residues supplemented with various levels of maize flour and wheat bran. Food Sci. Technol. 2016, 36, 598–605. [Google Scholar] [CrossRef]
  18. Roblero-Mejía, D.O.; Aguilar-Marcelino, L.; Sánchez, J.E. Effect of substrate variation on the productivity of two strains of Pleurotus spp. Sci. Fungorum 2021, 52, e1377. [Google Scholar] [CrossRef]
  19. Sindhu, S.; Theradimani, M.; Vellaikumar, S.; Paramasivam, M.; Ramamoorthy, V. Development of novel rapid-growing and delicious Pleurotus djamor strains through hybridization. Arch. Microbiol. 2024, 206, 13. [Google Scholar] [CrossRef] [PubMed]
  20. Kotwaliwale, N.; Pramod, B.; Ajay, V. Changes in textural and optical properties of oyster mushroom during hot air drying. J. Food Eng. 2007, 78, 1207–1211. [Google Scholar] [CrossRef]
  21. Sánchez, C. Cultivation of Pleurotus ostreatus and other edible mushrooms. Appl. Microbiol. Biotechnol. 2010, 85, 1321–1337. [Google Scholar] [CrossRef]
  22. Nguyen, T.M.; Ranamukhaa, S.L. Effect of Different Culture Media, Grain Sources and Alternate Substrates on the Mycelial Growth of Pleurotus eryngii and Pleurotus ostreatus. Pak. J. Biol. Sci. 2020, 23, 223–230. [Google Scholar] [CrossRef]
  23. Hassan, N.A.; Supramani, S.; Sohedein, M.N.A.; Usuldin, S.R.A.; Klaus, A.; Ilham, Z.; Chen, W.-H.; Wan-Mohtar, W.A.A.Q.I. Efficient biomass-exopolysaccharide production from an identified wild-Serbian Ganoderma lucidum strain BGF4A1 mycelium in a controlled submerged fermentation. Biocatal. Agric. Biotechnol. 2019, 21, 101305. [Google Scholar] [CrossRef]
  24. Adebayo, E.A.; Azeez, M.A.; Alao, M.B.; Oke, M.A.; Aina, D.A. Mushroom Nanobiotechnology: Concepts, Developments and Potentials. In Microbial Nanobiotechnology. Materials Horizons: From Nature to Nanomaterials; Springer: Singapore, 2021; pp. 257–285. [Google Scholar] [CrossRef]
  25. Ferreira, I.; Barros, L.; Abreu, R. Antioxidants in Wild Mushrooms. Curr. Med. Chem. 2009, 16, 1543–1560. [Google Scholar] [CrossRef]
  26. de Medeiros, R.L.; Andrade, G.M.; Crispim, R.B.; Silva, N.N.d.S.; da Silva, S.A.; de Souza, H.A.N.; Zárate-Salazar, J.R.; de Medeiros, F.D.; Dantas, C.E.A.; Viera, V.B.; et al. Nutritional and antioxidant potential of Pleurotus djamor (Rumph. ex Fr.) Boedijn produced on agronomic wastes banana leaves and sugarcane bagasse substrates. Braz. J. Microbiol. 2024, 55, 1117–1129. [Google Scholar] [CrossRef]
  27. Puttaraju, N.G.; Venkateshaiah, S.U.; Dharmesh, S.M.; Urs, S.M.N.; Somasundaram, R. Antioxidant Activity of Indigenous Edible Mushrooms. J. Agric. Food Chem. 2006, 54, 9764–9772. [Google Scholar] [CrossRef] [PubMed]
  28. Barros, L.; Cruz, T.; Baptista, P.; Estevinho, L.M.; Ferreira, I.C.F.R. Wild and commercial mushrooms as source of nutrients and nutraceuticals. Food. Chem. Toxicol. 2008, 46, 2742–2747. [Google Scholar] [CrossRef]
  29. Dewanto, V.; Wu, X.; Adom, K.K.; Liu, R.H. Thermal Processing Enhances the Nutritional Value of Tomatoes by Increasing Total Antioxidant Activity. J. Agric. Food Chem. 2002, 50, 3010–3014. [Google Scholar] [CrossRef]
  30. Patel, P.; Sunkara, R.; Walker, L.T.; Verghese, M. Effect of Drying Techniques on Antioxidant Capacity of Guava Fruit. Food Nutr. Sci. 2016, 7, 544–554. [Google Scholar] [CrossRef]
  31. Fogarasi, M.; Socaci, S.A.; Dulf, F.V.; Diaconeasa, Z.M.; Fărcaș, A.C.; Tofană, M.; Semeniuc, C.A. Bioactive Compounds and Volatile Profiles of Five Transylvanian Wild Edible Mushrooms. Molecules 2018, 23, 3272. [Google Scholar] [CrossRef] [PubMed]
  32. Latimer, G.W. Official Methods of Analysis of AOAC International; AOAC International: Rockville, MD, USA, 2019. [Google Scholar]
  33. Nielsen, S.S. Food Analysis; Springer: Boston, MA, USA, 2010. [Google Scholar] [CrossRef]
  34. Cardador-Martínez, A.; Loarca-Piña, G.; Oomah, B.D. Antioxidant Activity in Common Beans (Phaseolus vulgaris L.). J. Agric. Food Chem. 2002, 50, 6975–6980. [Google Scholar] [CrossRef]
  35. Oomah, B.D.; Cardador-Martínez, A.; Loarca-Piña, G. Phenolics and antioxidative activities in common beans (Phaseolus vulgaris L.). J. Sci. Food Agric. 2005, 85, 935–942. [Google Scholar] [CrossRef]
  36. Deshpande, S.S.; Cheryan, M. Determination of phenolic compounds of dry beans using vanillin, redox and precipitation assays. J. Food Sci. 1987, 52, 332–334. [Google Scholar] [CrossRef]
  37. Brand-Williams, W.; Cuvelier, M.E.; Berset, C. Use of a free radical method to evaluate antioxidant activity. LWT Food Sci. Technol. 1995, 28, 25–30. [Google Scholar] [CrossRef]
  38. Re, R.; Pellegrini, N.; Proteggente, A.; Pannala, A.; Yang, M.; Rice-Evans, C. Antioxidant activity applying an improved ABTS radical cation decolorization assay. Free Radic. Biol. Med. 1999, 26, 1231–1237. [Google Scholar] [CrossRef]
  39. Figueroa-Pérez, M.G.; Rocha-Guzmán, N.E.; Pérez-Ramírez, I.F.; Mercado-Silva, E.; Reynoso-Camacho, R. Metabolite Profile, Antioxidant Capacity, and Inhibition of Digestive Enzymes in Infusions of Peppermint (Mentha piperita) Grown under Drought Stress. J. Agric. Food Chem. 2014, 62, 12027–12033. [Google Scholar] [CrossRef]
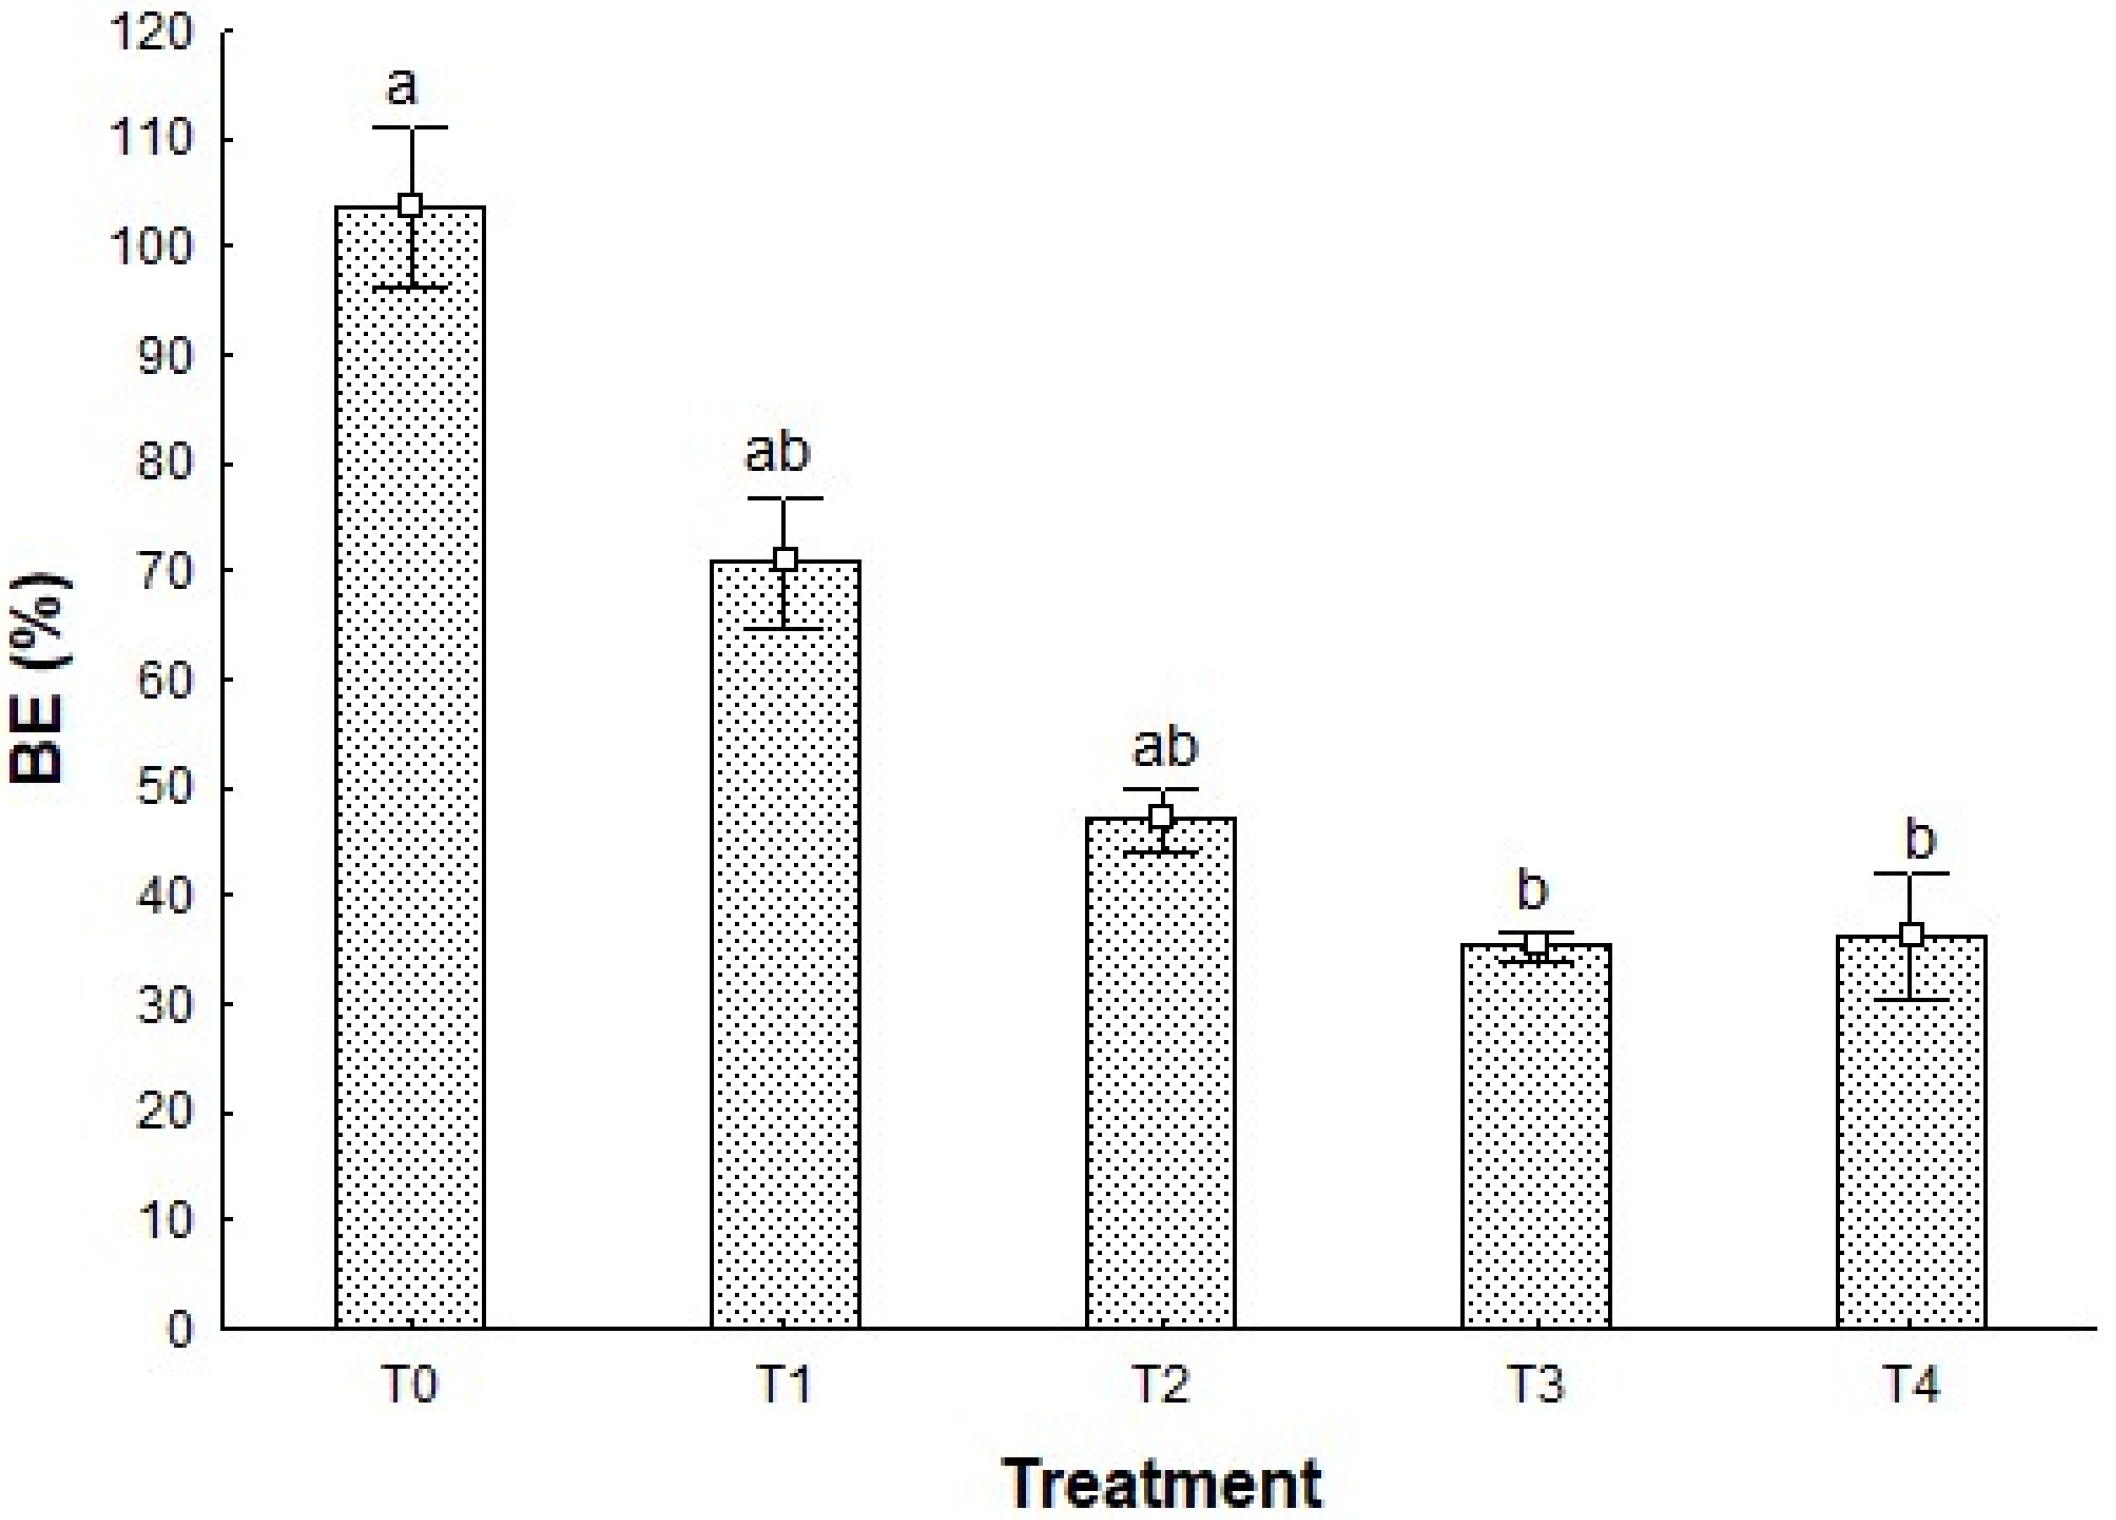
Figure 1. Biological efficiency of P. djamor in the different treatments. Different letters show the significant differences (p < 0.05) among treatments, Kruskal–Wallis statistical test at 95%. n = 4 ± standard deviation (SD).
Recycling 10 00185 g001
Figure 2. Significant differences (p < 0.05) of the comparison of the % protein in the substrates, before and after the growth of P. djamor.
Recycling 10 00185 g002
Figure 3. Significant differences of the comparison of the % NFE in the substrates before and after the growth of P. djamor.
Recycling 10 00185 g003
Figure 4. P. djamor basidiomas present on the different treatments.
Recycling 10 00185 g004
Figure 5. Developmental stages of P. djamor among different treatments.
Recycling 10 00185 g005
Figure 6. Mean concentration of secondary metabolites and antioxidant capacity in methanolic extracts of P. djamor during five development stages.
Recycling 10 00185 g006
Figure 7. Fragmentation spectra of linoleic acid.
Recycling 10 00185 g007
Table 1. Average percentages of PCA variables of substrates among different mixtures.
TreatmentMoisture
(% ± SD)
NFE
(% ± SD)
Ethereal Extract
(% ± SD)
Protein
(% ± SD)
Ashes
(% ± SD)
CF
(% ± SD)
T07.54 ± 0.09 a43.4 ± 0.13 a0.52 ± 0.05 a4.54 ± 0.03 a19.02 ± 0.11 a32.45 ± 0.12 a
T16.84 ± 0.12 ab39.51 ± 1.31 ab0.79 ± 0.12 ab7.62 ± 0.314 ab19.29 ± 1.44 a33.17 ± 0.10 a
T26.49 ± 0.08 bc37.75 ± 1.92 ab0.76 ± 0.06 ab8.24 ± 0.20 bc15.48 ± 0.30 ab35.19 ± 1.85 ab
T34.97 ± 0.19 c37.54 ± 0.21 ab2.17 ± 0.07 b7.25 ± 0.04 ac15.14 ± 0.09 b37.89 ± 0.19 bc
T46.66 ± 0.03 ac37.45 ± 0.17 b1.06 ± 0.03 b9.92 ± 0.17 b17.91 ± 0.07 ab33.65 ± 0.13 ac
Different letters show the significant differences (p < 0.05) among treatments, Kruskal–Wallis statistical test at 95%. NFE = nitrogen-free extract; CF = crude fiber; SD = standard deviation.
Table 2. Texture parameters of the fruiting bodies of P. djamor.
TreatmentForce of Firmness
(N ± SD)
Cutting Force
(N ± SD)
Fracture Force
(N ± SD)
T00.47 ± 0.28 a0.27 ± 0.11 a2.64 ± 0.95 a
T10.72 ± 0.67 a0.24 ± 0.19 a2.61 ± 2.94 a
T20.84 ± 0.74 a0.43 ± 0.39 a1.83 ± 0.73 a
T30.91 ± 0.38 a0.3 ± 0.24 a3.82 ± 1.09 ab
T40.91 ± 0.25 a0.45 ± 0.17 a7.06 ± 3.06 b
Different letters show the significant differences (p < 0.05) among treatments, Fisher LSD statistical test at 95%. n = 4. SD = standard deviation. N = newtons.
Table 3. Average concentration of lignin, cellulose, and hemicellulose in the different treatments.
TreatmentLignin
(% ± SD)
Hemicellulose
(% ± SD)
Cellulose
(% ± SD)
T028.68 ± 1.15 ab42.01 ± 2.09 a14.06 ± 0.14 ad
T120.19 ± 1.72 ab19.42 ± 0.83 ab23.4 ± 0.78 ab
T218.60 ± 0.73 b18.96 ± 3.97 ab24.29 ± 0.22 bc
T319.90 ± 0.16 ab16.34 ± 4.1 b21.8 ± 0.35 acd
T431.6 ± 0.87 a15.97 ± 2.06 b8.84 ± 1.38 d
Different letters show the significant differences (p < 0.05) among treatments, Fisher LSD statistical test at 95%. n = 4. SD = standard deviation.
Table 4. Mean concentration of phenolic compounds and antioxidant capacity in P. djamor among developmental stages.
TreatmentPhenols
(mg GAE g−1 ± SD)
Flavonoids
(mg rutin g−1 ± SD)
Tannins
(mg catechin g−1 ± SD)
ABTS
(Inhibition % ± SD)
DPPH
(Inhibition % ± SD)
T05.41 ± 0.92 a1.06 ± 0.51 a0.008 ± 0.004 a30.68 ± 8.10 ab34.74 ± 11.57 ab
T11.19 ± 0.87 b1.32 ± 1.02 a0.007 ± 0.004 a53.53 ± 22.28 a25.87 ± 9.61 b
T21.00 ± 0.27 b1.36 ± 1.04 a0.01 ± 0.008 a55.72 ± 22.64 a28.50 ± 14.88 b
T30.94 ± 0.23 b1.47 ± 1.00 a0.01 ± 0.009 a24.32 ± 5.62 b37.76 ± 13.36 ab
T41.06 ± 0.10 b1.07 ± 0.69 a0.01 ± 0.005 a40.36 ± 14.97 a61.83 ± 12.16 a
Different letters show the significant differences (p < 0.05) of the concentrations among treatments. SD = standard deviation.
Table 5. Mean concentration of phenolic compounds and antioxidant capacity in P. djamor by treatment.
Developmental StagePhenols
(mg GAE g−1 ± SD)
Flavonoids
(mg rutin g−1 ± SD)
Tannins
(mg catechin g−1 ± SD)
ABTS
(Inhibition % ± SD)
DPPH
(Inhibition % ± SD)
Primordia1.97 ± 1.73 a1.45 ± 0.83 a0.01 ± 0.007 a36.92 ± 22.14 a33.05 ± 12.38 a
1st harvest1.68 ± 1.47 a1.06 ± 0.90 a0.006 ± 0.004 b53.36 ± 24.46 a28.39 ± 10.59 a
2nd harvest2.03 ± 2.16 a1.68 ± 1.05 a0.006 ± 0.004 b45.61 ± 20.35 a36.54 ± 15.59 a
3rd harvest1.76 ± 1.74 a0.92 ± 0.73 a0.006 ± 0.003 b36.53 ± 17.74 a35.16 ± 13.77 a
4th harvest2.15 ± 2.23 a1.17 ± 0.69 a0.01 ± 0.007 a32.19 ± 4.05 a35.21 ± 14.51 a
Different letters show the significant differences (p < 0.05) of the concentration developmental stage. SD = standard deviation.
Table 6. Non-phenolic secondary metabolites in the fruiting bodies of P. djamor.
TreatmentChemical Compound# CASRetention Time
(min)
T0, T1, T2, T3, T4L-Valine007364-44-55.77
T0, T1Butanoic acid055133-95-46.06
T0, T1, T2, T3, T4L-Leucine007364-46-76.77
T1, T2Phosphoric acid, tris-TMS010497-05-96.84
T0, T3, T4Glycerol006787-10-66.84
T1, T2, T3, T4L-Isoleucine007483-92-37.17
T0, T1, T2, T3, T4L-Proline007364-47-87.23
T0, T1, T2, T3, T4Succinic acid040309-57-77.47
T0, T1, T2, T3, T4Propanoic acid038191-87-67.9
T0, T1, T2, T3, T4Pyrimidine010457-14-48.0
T1, T2, T3, T4Fumaric acid017962-03-78.11
T0, T1, T2, T3, T4Serine064625-17-88.49
T0, T1, T2, T3, T4Butyric acid007537-02-29.02
T1, T2L-Homoserine, N, O-bis(trimethylsilyl)-, trimethylsilyl ester1177129-58-610.20
T1, T2Malic acid, tris- TMS038166-11-910.99
T0Succinic acid038166-11-911.00
T42-Pyrrolidone-5-carboxylic acid, trimethylsilyl ester030274-77-211.14
T3, T4Butanedioic acid, [(trimethylsilyl)oxy]-, bis(trimethylsilyl) ester038166-11-911.38
T3L-Methionine, N-(trimethylsilyl)-, trimethylsilyl ester027844-10-611.53
T4Alanine002899-42-511.96
T0Hexanedioic acid055520-93-911.75
T3D-L-Phenylalanine002899-42-512.02
T1, T2, T3, T4Glutamic acid, N-(trimethylsilyl)-, bis(trimethylsilyl) ester, L015985-07-613.47
T02,3,4-Trihydroxybutyric acid tetrakis(trimethylsilyl) deriv., (R*,R*)-)038191-88-712.18
T04-Hydroxyphenylethanol, di- TMS321884-10-012.44
T0Glutamic acid015985-07-613.48
T0, T3N,O-Bis(trimethylsilyl)-L-phenylalanine007364-51-413.55
T2, T4L-Asparagine055649-62-214.46
T2a-Aminoadipic acid, triTMS066434-50-215.22
T0, T1, T2, T3, T4Phosphoric acid031038-11-616.27
T1D-Ribo-Hexitol, 3-deoxy-1,2,4,5,6-pentakis-O-(trimethylsilyl)-034665-31-117.47
T1Pentanedioic acid038166-12-018.02
T0, T2, T3, T4Palmitic acid055520-89-320.56
T1, T2Myoinositol TMS002582-79-821.72
T0, T1, T2, T3, T4Linoleic acid056259-07-523.46
T1, T2, T3, T4Uridine, 2′,3′,5′-tris-O-(trimethylsilyl)-010457-16-629.30
T0, T1, T2, T3, T4D-(+)-Trehalose, octakis(trimethylsilyl) ether1000380-43-835.65
Table 7. Proportion of substrates per treatment.
TreatmentResidue Ratio
T0100% corn stubble
T170% agave bagasse/30% corn stubble
T280% agave bagasse/20% corn stubble
T390% agave bagasse/10% corn stubble
T4100% agave bagasse
Table 8. Methods used for PCA.
ParameterMethodCite
MoistureWeight difference between fresh and dry matter[34]
Ether extractExtraction in petroleum ether and hexane[34]
AshesWeight difference between fresh and calcined matter[34]
Crude fiberAcid and alkali digestion[34]
ProteinKjeldahl method[35]
Nitrogen-free extract (NFE)Calculation of the difference in the content of the variables above[34]
Disclaimer/Publisher’s Note: The statements, opinions and data contained in all publications are solely those of the individual author(s) and contributor(s) and not of MDPI and/or the editor(s). MDPI and/or the editor(s) disclaim responsibility for any injury to people or property resulting from any ideas, methods, instructions or products referred to in the content.