Abstract
As the automotive industry increasingly relies on plastic components to meet fuel efficiency and emissions targets, the challenge of managing end-of-life vehicle (ELV) plastics continues to grow. Currently, more than 80% of ELV plastics in the U.S. are landfilled due to limited economic incentives and technical barriers to recycling. This study examines a mechanical recycling pathway for thermoplastic components disassembled from ELVs and assesses their usability for reintegration into new vehicle parts. Four representative materials were chosen based on material labels embedded in recovered parts and aligned with their virgin industrial equivalents: polypropylene (PP), 10% talc-filled PP (PP-T10), 20% talc-filled PP (PP-T20), and a 20% glass-/mineral-filled polyamide (PA6 + GF7 + MF13). The materials underwent shredding, drying, and injection molding before being characterized by particle size analysis, density measurement, thermal analysis (TGA, DSC), mechanical testing, and heat deflection temperature (HDT) evaluation. The results in this work indicated that minor differences in crystallinity were observed and small differences between model materials and ELV materials could have contributed to these changes. Mechanical testing revealed that neat polypropylene suffered a 15–20% reduction in stiffness and tensile strength, but talc-filled polypropylene and glass/mineral-filled nylon retained >90% of their modulus, strength, and heat deflection temperature values relative to virgin controls. Differences between virgin and ELV materials could have been attributed to use life degradation, contamination during use life, or even chemical/processing differences in model materials and ELV materials. However, these findings suggest that mechanically recycled, disassembled ELV plastics can retain sufficient structural performance to support circularity efforts in the automotive sector.
1. Introduction
The automotive industry is one of the largest global markets, with worldwide vehicle production reaching 94 million units in 2023. In the United States, production has grown at an average annual rate of 3.8% [1,2,3]. Vehicles are complex, multi-material assemblies with an average market value of approximately 50,000 USD [4]. A vehicle’s core structural framework is typically made from high-strength steel or aluminum, while a significant portion of the materials in a vehicle are a mixture of metals, glass, rubber, fiber-reinforced/advanced composites, and plastics. In the search for greater fuel efficiency and lower emissions, the automotive industry has learned that replacing heavier materials like metal with plastics helps reduce vehicle weight [2]. As such, between 2012 and 2021, the average amount of plastics in automobiles increased by 16%, reaching up to 186 kg per vehicle [5]. This increase in plastic usage at least partially increased fuel efficiency by 6–8% and reduced CO2 emissions by approximately 7.6 g/km driven [2]. Modern automobiles consist of more than 50% plastic by volume, but due to their low density, they contribute to less than 10% of the vehicle’s weight [6]. Currently, polypropylene (PP) constitutes 32% of the total plastic used in vehicles, followed by polyurethane (PU) at 17%, polyvinyl chloride (PVC) at 16%, and polyamide (PA) at 12%. Collectively, these materials make up 78% of all automotive plastics [7]. Lower-cost materials like PP (~1.20 USD/kg) are commonly used in bumpers, insulation, seating, and interior components, while higher-cost materials like PA (~2.82 USD/kg) [8], have found applications in higher-performance components such as intake manifolds, engine covers, radiator end tanks, and structural brackets. While it is undeniable that plastics offer tremendous benefits during the vehicle’s service life, unlike metals, their disposal presents a growing challenge for end-of-life vehicles (ELVs) where an average vehicle life timeline of 18.1 years [9].
In the U.S., the predominant stakeholders in the ELV supply chain include automotive dismantlers and shredders. While dismantlers have found uses for the resale of ELV components, the most widely utilized business model for this industry centers around recycling metal. As a result, the vast majority of plastics (an average of 80%) are landfilled at the end of a vehicle’s life [10]. With landfill tipping fees in the U.S. averaging 56.80 USD per ton in 2023, an ELV containing 193 kg of plastic would amount to an additional disposal cost of approximately 12.10 USD per vehicle from its plastic components alone [5,11]. Considering that approximately 12–15 million vehicles are scrapped annually in the U.S., the cumulative cost to shredders from plastic landfill fees alone could amount to up to 181 million USD each year [5,6]. If it were possible to recover the growing volume of plastics from this end-of-life (EOL) supply chain and displace them from the landfill, it could lead to significant cost savings for the ELV supply chain overall.
There are several existing industrial recycling technologies for plastics from ELVs. These include mechanical, thermal, chemical, and enzymatic technologies [12]. Among these, mechanical recycling remains the most widely adopted due to its commercial maturity, scalability, and energy efficiency [13]. Although chemical and enzymatic recycling methods offer promising avenues for future expansion of circular material flows, they are currently hindered by high energy demands, limited material compatibility, and lower technology readiness levels [14]. However, conversely, limitations to the mechanical recycling pathway include irreversible material impacts (i.e., chain scission, fiber length attrition, loss of filler content) caused by the thermomechanical re-manufacturing process [15,16,17]. In industrial mechanical recycling, companies will recover plastics, use physical methods to clean and separate contamination from the waste stream, and directly re-use the material to make new manufacturing feedstocks [18]. Recycling in this way can provide lower carbon materials, as a recent life cycle assessment found that producing PP pellets from recycled plastic waste can result in approximately 41.8% lower carbon emissions than virgin PP [19]. As a result, mechanical recycling continues to be one of the most accessible and sustainable routes for integrating recycled plastic content into the automotive sector, particularly when paired with improved disassembly and material separation practices at the ELV stage [20,21,22]. For example, automotive manufacturers have initiated various strategies to meet growing regulatory and sustainability targets related to recycled content in vehicles. Recent examples of this include those from several automotive original equipment manufacturers (OEMs), such as Ford Motor Company, BMW, Volvo, Honda, Nissan, and Audi, who collectively have worked to integrate sustainable (i.e., bio-derived and recycled plastics) into new vehicle designs [23,24,25,26,27,28]. Even further, recent draft legislation in the E.U. proposes that by 2030, all new vehicles must incorporate at least 25% post-consumer recyclate (PCR) in their plastic components, with 25% of that PCR being sourced from closed-loop recycling, where materials are recovered from ELVs and reused in the production of new cars. However, while mechanical recycling often preserves the polymer backbone and relies on physical reprocessing rather than chemical transformation, mechanical recycling is only effective for relatively homogenous plastic streams with purities in excess of 90% [15,29,30,31,32].
The academic literature on the physical characterization and recycling of plastics obtained directly from ELVs is limited. While several recent publications have explored the use of recycled composites in automotive components, they have not obtained these components directly from ELVs and instead used manufacturing scrap for recycling demonstrations [33,34,35,36]. Thus, it is not clear how the functional use of these materials will impact their performance upon recycling [15,16]. Others have attempted to simulate a vehicle’s use-life using thermal aging with moderate success, but there are questions around whether these methodologies will accurately mimic the material degradation experienced during UV-degradation, humidity, thermal, and freeze–thaw cycles, or debris/paint contamination [6,37]. While literature has sought to characterize the automotive shredder residue stream [38], to the best of the authors’ knowledge, disassembled ELV plastics characterization is limited. In 2024, Juan et al. explored the use of disassembled bumpers from ELVs, finding that the heterogeneity in ELV bumpers may present a barrier to recyclability in concentrations above 50% in new parts [39]. Interestingly, Kozderka et al. showed in 2019 that the incorporation of 50% recycled plastic content in new vehicle plastics resulted in reduced impacts in every impact category but ozone depletion, with the bulk of the impacts coming from virgin material production [40]. With such environmental benefits from the incorporation of recycled content and limited performance understanding in disassembled ELV plastics, there are clearly significant research efforts required to further characterize the residual performance that remains in unpainted ELV plastics when obtained from the automotive disassembler.
In this work, the authors explored the recovery and recycling of disassembled plastics obtained from ELVs as unpainted components. Working with the automotive supply chain, industrially sourced control samples were used to quantify and evaluate the effects of a vehicle’s service life on the mechanical properties of plastic components at end-of-life. ELV plastics were subjected to mechanical recycling, and the mechanical properties of injection-molded test samples produced from ELV plastics were evaluated to assess the combined effects of vehicle service life and mechanical recycling. The results of this work represent a significant step toward enabling a circular economy for automotive plastics by providing data-driven insights into the viability of closed-loop recycling for disassembled vehicle materials.
2. Results and Discussion
Four thermoplastic, unpainted ELV components were manually disassembled from vehicles at an automotive scrapyard (Figure 1) and visually inspected for labels indicating their polymer type. These included a bumper fascia (PP), a trunk interior panel (10% talc PP), a rear bumper extension (20% talc PP), and an engine cover. (20% GF/talc nylon). At the disassembler facility that these samples were obtained from, vehicles will sit on the lot for approximately 1 week where parts can be manually picked off the vehicle for re-use. The vehicle is tracked digitally throughout its time at the disassembler. After one week, the vehicle is de-polluted (i.e., the liquids are removed from the vehicle) and most of the remaining metal structural components are removed using heavy machinery for recycling. The samples collected in this work were collected from the remaining “husk” of the vehicle after valuable components had been removed using heavy machinery. The weight of each sample obtained can be found in Table S1. Plastic components were not attached to the vehicle and were facile to isolate and remove from the ELV. As shown in Figure 1 and Figure S1, each component removed was molded with a label embedded that included useful information about the material, OEM, location of manufacturing, and a lot number. These materials were labeled with the following material labels: PP, PP-T10, PP-T20, and PA6 + GF7 + MF13. These labels were used as the baseline for which the materials were identified. From this, the authors worked with scientists at chemical and material manufacturers for the automotive industry to verify whether the labels were likely to be correct. Model materials were then obtained from LyondellBasell (LYB) to represent the material at the beginning of its use life.
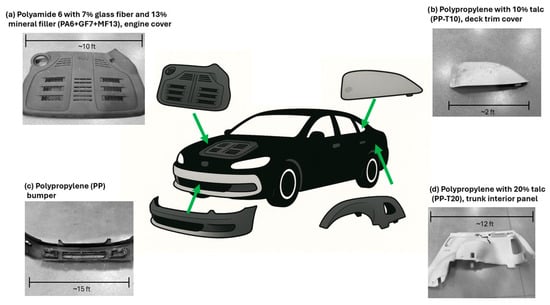
Figure 1.
(a) Polyamide 6 with 7% glass fiber and 13% mineral filler (PA6 + GF7 + MF13), engine cover (b) Polypropylene with 10% talc (PP-T10), deck trim cover (c) Polypropylene (PP), bumper (d) Polypropylene with 20% talc (PP-T20), trunk interior panel.
The mechanical recycling process followed in this work is visualized in Figure 2. ELV parts obtained from the scrapyard were found to be dusty and dirty from having sat outside for at least 1 week. To minimize contamination in the samples, all components were washed with soap and water and dried at 60 °C for at least 24 h. After drying, the parts were then cut using a bandsaw into samples approximately 11 cm × 3 cm sections so they could be manually fed into the GP20 Plastic Shredder (3Devo—Utrect, NL, EU) which is a stacked shredder and granulator system equipped with a 3 mm sieve. The shredder was operated at 14 RPM with a temperature range measured in the shredder of 26–32 °C during shredding runs. To eliminate contamination, the equipment was disassembled and cleaned using a wet/dry vacuum between the materials. After shredding, the granules were dried again in a convection oven at approximately 150 °C for at least 24 h to ensure uniform moisture removal. All samples were recovered at more than 94% using this process (Figure S2).
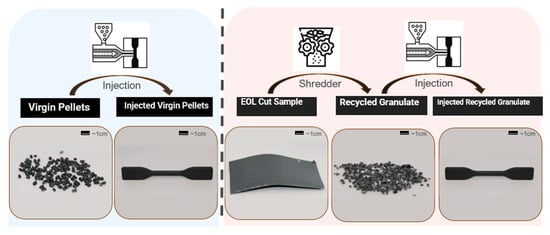
Figure 2.
Visualization of the process pathway for mechanical recycling of EOL vehicle plastics.
Particle size analysis was performed on both virgin pellets and recycled granules (Figure 3a), where virgin pellets were found to be larger and more uniform in distribution (µ = 155.1 ± 102.26 mm2), with some small dust particles contained in the batch. In contrast, the recycled granulate had a much broader size distribution with a significantly lower particle size on average (µ = 71.9 ± 64.2 mm2), constituting a 53% average reduction over virgin pellets. Previous literature has shown that directly re-manufacturing thermoplastic granules can have minimal impacts on the material properties overall but can result in parts that have reduced density due to decreased stacking efficiency [15]. To quantify any changes in resulting density of the parts, samples were analyzed using pycnometry (Figure 3b) where small changes in the resulting densities were observed between injection molded virgin and recycled samples. In the case of neat PP, injection molded samples made from recycled granules (0.95 ± 0.01 g/cm3) exhibited a statistically significant difference in density (5%, p < 0.05) compared to those made from virgin pellets (0.91 ± 0.01 g/cm3). For the filled formulations, PP-T20 showed a 4.7% difference, and PA6-GF7-MF13 showed a 2.4% difference in average density between virgin and recycled samples (both p < 0.05). Though there are small, statistically significant changes in the average density of injection molded parts, there is no clear trend in either direction observed in recycled samples. Therefore, it is unlikely that small changes observed in density between samples were directly caused by the difference in particle size observed between recycled granules and virgin pellets. It is possible that these variations were measured due to differences between model materials obtained from LYB and ELV components.
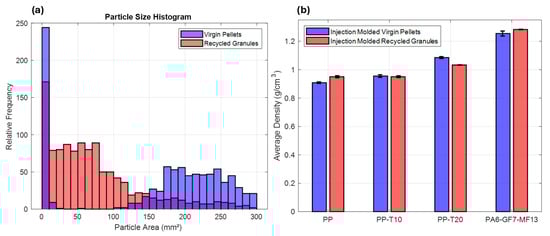
Figure 3.
(a) Particle size analysis of both granulated and virgin pellet samples (b) Average density of injected molded parts made from both virgin pellets and recycled granules. Note: Figure 3a shows blue and red bars overlapping.
The degree of crystallinity and thermal stability (Figure 4a) was measured for each material during each stage of the recycling process. A notable difference in crystallinity by approximately 12% is observed in the end-of-life PP samples as compared to injection molded virgin pellet samples. This reduction in crystallinity was maintained in both the recycled granules and injection molded recycled samples. In addition, a statistically significant increase in residual mass at 600 °C (Figure 4b) was observed in all recycled PP samples, including the end-of-life materials, recycled granules, and injection molded recycled granules, compared to their virgin counterparts. This increase in residual weight may indicate contamination in the batch (i.e., cross-material contamination during recycling, dirt/dust from vehicle use life) or local variability in the molded samples (either during manufacturing or at end of life). This increase in residual mass (and potential residual filler in recycled PP samples) may be contributing to the increase in density observed in the molded parts.
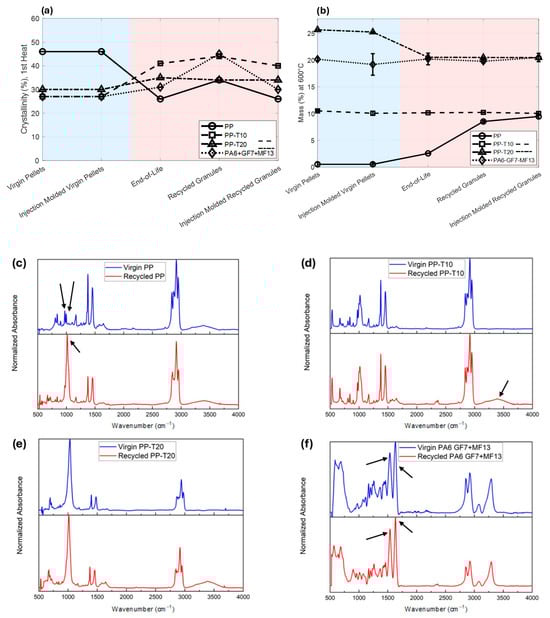
Figure 4.
(a) Crystallinity percentage (1st heat), and (b) Residual mass percentage at 600 °C, measured for each material type across different processing stages. To aid the eye, a blue background in (a,b) highlights the data collected for the model materials provided by LYB while the red background highlights the samples retrieved at EOL and after recycling. Normalized FTIR spectra comparing injection molded virgin and recycled samples for each formulation: (c) neat PP, (d) PP-T10, (e) PP-T20, and (f) PA6 + GF7 + MF13. Spectra were acquired between 500 and 4000 cm−1 and normalized to enable comparison of absorbance intensities across materials and conditions. Black arrows highlight peaks referenced in the main body of this text.
FTIR analysis of the PP samples reveals notable differences between virgin and recycled polypropylene (PP) materials (Figure 4c). The virgin PP sample exhibits a distinct doublet at 974 and 995 cm−1, characteristic of isotactic polypropylene, whereas the recycled sample shows a single, broader peak near 974 cm−1, consistent with atactic polypropylene [41,42]. This spectral difference likely reflects changes in chain ends or tacticity, which may contribute to the observed difference in crystallinity. Isotactic polypropylene has higher crystallinity due to its regular chain structure, while the increased atactic content in the recycled material disrupts crystalline packing, potentially indicating chemical degradation or alterations in tacticity [42].
Interestingly, these results are supported by the rheological performance of virgin and recycled PP (Table S2). Recycled PP samples were found to have a higher complex viscosity and lower melt flow index (MFI) as compared to virgin samples in this study. This could be because of the likely increased presence of fillers in recycled PP samples, which could have driven up the viscosity measured.
For the PP-T10 samples, a difference in crystallinity was observed in the EOL samples compared to the virgin materials. However, no statistically significant difference in residual weight at 600 °C was detected in this set. It is reasonable to assume from literature [43] that the mass at 600 °C for PP composites can be approximated as the weight of the synthetic filler material, given the known low char yield of neat PP. Based on this, the final mass of ~10% at 600 °C for the PP-T10 samples supports the theorized filler concentration as recorded from the ELV labels and the information provided by LYB. This also suggests that the observed crystallinity difference may be attributed to changes in resin chemistry or initial processing parameters rather than filler content. To support this, FTIR results for PP-T10 (Figure 4d) show that both virgin and recycled samples retain characteristic PP absorption bands, indicating that the core polymer structure remains intact. However, a broad O–H stretching peak appears near 3500 cm−1 in the recycled sample, suggesting moisture absorption in samples, which could indicate that samples should be dried before analysis. Surprisingly, viscosity was found to be higher and MFI was found to be reduced in recycled PP-10 samples suggesting that there may be differences between the processibility of the PP-10 samples at processing temperature (Table S2). The changes in resin chemistry observed in FTIR could have contributed to the difference in processibility of this material.
PP-20 samples saw a higher crystallinity in all EOL samples as compared to virgin samples. In addition, an associated reduction in the weight% at 600 °C is observed in these EOL samples as compared to virgin samples. The difference in crystallinity observed could be because of the reduction in filler content measured. This is because the virgin PP-T20 samples provided by LYB were labeled as containing 20% filler, but TGA showed a final mass of 25%, indicating a potentially higher filler content than expected. This discrepancy further supports the conclusion that the ELV and LYB materials differ in formulation. Even further, even though the virgin PP-T20 samples likely had a higher loading of filler the complex viscosity was higher and MFI was lower in the recycled PP-T20 samples (Table S5). This result could be because the samples contained a more thermally stable additive in addition to the talc, which may be reducing the viscosity.
In PA samples, a slight difference in crystallinity was observed in the recycled samples, rising from 27% in virgin material to 31% in the recycled samples. Finally, the FTIR spectra of PA6 + GF7 + MF13 samples (Figure 4f) show strong amide I and II peaks at 1640 cm−1 and 1540 cm−1, respectively, in both virgin and recycled samples, indicating retention of the polyamide backbone. Only minor differences in peak intensity and baseline were noted, suggesting minimal chemical structural differences between virgin and recycled materials. Again, recycled PA samples showed a higher complex viscosity and reduced MFI than virgin samples (Table S2). These results, in tandem, could suggest that some functional additive not picked up within the FTIR band analyzed in this work could be contributing to changes in crystallinity and viscosity in these samples. Together, these results further add to the complexity of ELV plastics and the limitations of today’s labeling schemes for materials.
Carbonyl index (CI) was calculated for all materials in this study (Figure S3). No significant differences were observed between virgin and recycled samples in this work. This result indicates that there was likely very little oxidative degradation observed in the samples obtained from ELVs, and the recycling pathway likely had little impact on the chemical structure. When compared to previous literature exploring sea microplastics (CI~0.4–1.2) and post-consumer PP (CI~0.95–1.45), these materials had comparable CI values [41,42,44]. This is a somewhat surprising result considering the longer lifetimes and repeated thermal cycling and long-duration UV-exposure of plastics obtained from ELVs. This could hint at more complex additives in the polymer matrices, including UV-stabilizers and antioxidants, that are not captured in the FTIR spectra and may be contributing to changes observed between samples. UV-stabilizers are commonly utilized and critical for PP when used outdoors, as PP has been previously shown to be highly sensitive to degradation when exposed to oxidant atmospheres and UV light [45]. Commonly utilized UV stabilizers for PP include hindered amine light stabilizers (HALSs), phenolic antioxidants such as Irganox® 1010 or Irgafox® 168, metal oxides such as zinc oxide (ZnO) and titanium dioxide (TiO2), which can act to capture free radicals generated during PP UV-oxidation [45]. During UV exposure, HALSs, for example, act as interceptors of alkyl radicals and generate amino ethers, alcohols, and ketones [45]. It is expected that evidence of these degradation products could be measured using techniques such as liquid chromatography–mass spectrometry (LC-MS). Though this technique was not explored in this work, such differences in UV and/or additive chemistries contained in ELVs, with an average use-life of 8–35 years throughout the E.U. and 10–15 years in the U.S., as compared to today’s material formulations, could be contributing to the changes observed between material systems [9,46].
Understanding the density and thermal history of the material is highly anticipated to impact its mechanical performance, where Figure 5 presents the Ultimate Tensile Strength (UTS) and Young’s Modulus of the injection molded parts made from both virgin pellets and recycled granules for all materials. A significant 33.3% and 20.4% reduction in Young’s Modulus (p < 0.05) from 2.07 GPa to 1.38 GPa and 2.70 GPa to 2.15 GPa is observed in PP and PP-T20 samples, respectively. However, there was no statistically significant difference observed in the average Young’s Modulus of PP-T10 and PA6 + GF + MF13 samples. Unsurprisingly, the nylon sample demonstrated the highest modulus among all the formulations (4.1–4.4 GPa), exhibiting agreement with literature [47]. It is postulated that the reduction in stiffness measured in recycled PP samples is caused by the reduction in crystallinity (cf. Figure 5a). It is known that increased polymer crystallinity results in increased stiffness and decreased strength [48]. However, this reduction in PP stiffness with recycling could simultaneously be the result of degradation brought on by the use-life of the vehicle, where the PP bumper fascia experienced thermal cycling and UV-ray exposure, which can induce molecular degradation of the polymer itself. This degradation could also be caused by the presence of impurities in the sample from its use life. As mentioned previously, there is no facile method to decouple the impacts of ELV plastics’ use-life from the impacts of recycling. As seen in Figure 5b, the reduction in modulus observed in PP-20 samples is most likely due to the virgin samples containing ~5 wt.% more filler on average as quantified by TGA, where fillers are known to significantly increase the stiffness of plastics.
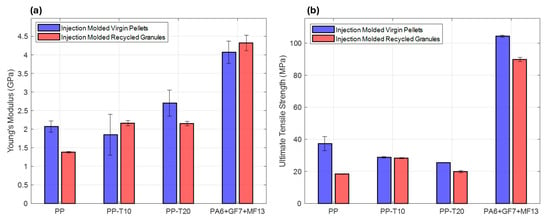
Figure 5.
(a) Young’s modulus (GPa) and (b) UTS (MPa) results from injected molded parts made from both virgin pellets and recycled granules.
The trends in UTS (Figure 5b) generally mirrored those of Young’s Modulus, with both PP and PP-T20 showing reductions in strength after recycling. The most significant drop was seen in PP, with nearly a 50% difference in UTS in recycled samples. PP-T10 maintained consistent strength around 30 MPa, while PP-T20 had a difference from 28 MPa to 21 MPa. Interestingly, PA6 + GF7 + MF13 showed a reverse trend in UTS compared to its stiffness behavior, decreasing by 12.6% from 110 MPa to 90 MPa; however, it remained the strongest material overall. This difference in UTS is likely primarily due to glass fiber breakage during the recycling process, as indicated by previous literature [49]. However, there is also the possibility of residual impurities from the samples’ use life (dirt, dust, etc.).
While mechanical performance at room temperature is a critical qualification for automotive materials, it is just as important to consider the mechanical performance at a range of temperatures. Figure 6 displays the average heat deflection temperature (HDT) for injected molded parts made from both virgin pellets (blue) and recycled granules (red) across all four materials. Interestingly, no significant differences between virgin and recycled samples were observed, regardless of the material (p > 0.05). These results indicate that the changes observed in mechanical properties and molecular structures did not significantly alter the thermomechanical stability of the samples overall, preserving function for many automotive applications. Together, these HDT results indicate that materials recovered before landfill or severe degradation may retain sufficient mechanical integrity for reintegration into new vehicle components. Essentially, while mechanical recycling of ELV plastics can induce modest changes in crystallinity, density, and mechanical strength as compared to today’s state-of-the-art materials, the core thermomechanical stability of the materials remains largely intact. This finding is especially important in the context of automotive applications, where dimensional stability at elevated temperatures is critical for under-the-hood and interior components. The preservation of HDT values across all material formulations suggests that disassembled and mechanically recycled plastics, particularly those with mineral or glass fillers, could meet functional requirements in secondary applications. These results support the feasibility of using shredded ELV plastic components as a viable feedstock in closed-loop manufacturing systems, particularly when material separation and contamination control are properly managed during disassembly and reprocessing.
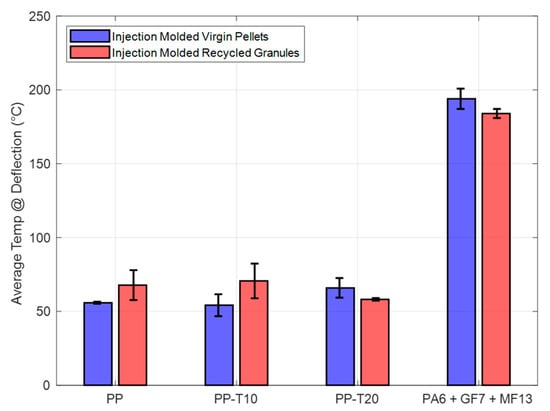
Figure 6.
Heat deflection temperature (°C) results from injected molded parts made from both virgin pellets and recycled granulates.
3. Materials and Methods
3.1. Model Materials
Four model materials were obtained from LYB to model the disassembled ELV plastics used in this study. Adstif HA801U, a neat polypropylene homopolymer, was selected to represent the virgin baseline material for the bumper fascia component. Sequel 2326 Natural, a mineral-filled polyolefin compound, was used as the virgin material for the rear deck trim cover and is referred to as PP-T10 throughout this study. Hifax TYC 1235X Black, PP homopolymer filled with 22% talc by weight, was used to represent the trunk interior panel and is referred to as PP-T20 in this work. Lastly, FP62E15 (PA6 GF15), a nylon 6 compound reinforced with approximately 15% mineral fillers, including 10–30% fiber and 1–5% carbon black by weight, was selected to match the engine cover known as PA6 + GF7 + MF13 in this study. The density for each of these materials, as reported in the technical data sheet, is presented in Table S3. These materials were chosen in collaboration with LYB partners and were selected based on identification labels found on the ELV components. The content of filler was verified using the manufacturer’s safety data sheets (SDS) and using characterization techniques previously discussed in this work.
3.2. Injection Molding
The 4 model materials obtained from LYB, and the 4 granulated samples were injection molded into ASTM D638-18 Type V dog bone specimens and flexural bars using an APSX-PIM V3 Plastic Injection Machine (APSX, Blue Ash, OH, USA) [50]. Injection molding parameters are provided in the Supplemental Information (Table S4). Granulated samples were used as feedstock for re-manufacturing to minimize material degradation associated with the compounding process that would be required to re-manufacture the material into pellet form.
3.3. Characterization
3.3.1. Particle Size Analysis
Particle size analysis was conducted using a custom image-based measurement system developed at Oak Ridge National Laboratory (ORNL). The setup consisted of a BRIO 4K Ultra HD webcam (Logitech, Lausanne, Switzerland) mounted over a white background, connected to a desktop computer. Sample trays containing recycled granules or virgin pellets were photographed under consistent lighting conditions. The images were processed using a, Chromatology (2025 Version), a Python-based image analysis tool developed by ORNL researchers. The software uses the opencv-python package to segment and identify individual particles, fit bounding rectangles around each one, and export key size metrics (e.g., area in mm2) into CSV files for further analysis. Particles were manually dispersed underneath the imaging apparatus. Shredded and model material pellets were manually dispersed on a white background. A sample size > 1000 particles was collected for each sample set.
3.3.2. Fourier-Transform Infrared (FTIR) Spectroscopy
FTIR analysis was performed using a Nicolet iS50 Spectrometer (Thermo Fisher Scientific, Waltham, MA, USA) with a resolution of 0.125 cm−1 outfitted using a diamond attenuated total reflectance (ATR) crystal. Spectra were collected from 500 to 4000 cm−1 for both injection-molded virgin and recycled samples. Three samples were analyzed 64 times. The absorbance data were normalized between 0 and 1 to allow comparison of peak intensities. Normalized spectra were plotted using stacked views to visually distinguish virgin and recycled samples, with consistent axis scaling and manually adjusted formatting for clarity. For all samples, carbonyl index was calculated to quantify oxidation and was calculated using the specific area under band (SAUB) technique, using the band absorbance of the carbonyl (C=O) peak (1650–1850 cm−1) to that of the methylene (CH2) peak (1420–1500 cm−1) procedure utilized in the previous literature [44]. This method was chosen as it is more accurate at capturing the dozens of complex degradation products of PP [41].
3.3.3. Thermogravimetric Analysis (TGA)
A TGA Q500 (TA instruments, New Castle, DE, USA) system was used to study the thermal stability of the samples. Samples were heated from room temperature to 600 °C at a rate of 10 °C/min under argon flow with a sample purge flow rate of 10 mL/min. The onset degradation temperature and residual mass at 600 °C were recorded for each sample (Table S5). Each experiment was repeated three times per sample type to ensure statistical significance. Raw TGA thermograms can be observed in Figure S4.
3.3.4. Differential Scanning Calorimetry (DSC)
DSC measurements were performed on a Q2000 DSC (TA instruments, New Castle, DE, USA) according to ASTM D3418-21 using approximately 5 mg of material in sealed aluminum pans [51]. At least 3 samples of each type were analyzed using this technique. The polymer’s melt temperature (Tm) and degree of crystallinity (Xc) were recorded for each material, where samples underwent a heat-cool-heat experiment from 0 °C (low temperature) to 250 °C (high temperature) at a heating rate of 10 °C/min. Each experiment was repeated three times per sample type. Xc was calculated from the first heating cycle using Equation (1):
where ∆Hm is the melting enthalpy, w is the weight fraction of PP or PA in the composite (e.g., 0.8 for 20% talc-filled PP), and ΔH100 is the melting enthalpy for a 100% crystalline polymer, where 207 J/g was used for PP [52] and 230 J/g was used for PA based on literature [53]. Raw DSC results can be observed in Figure S5.
3.3.5. Mechanical Testing
Dog-bone specimens (ASTM D638 Type V) were tested at room temperature using an Instron 5965 Universal Testing System (Instron, Norwood, MA, USA) with 5 kN Pneumatic Side Action Tensile Grips. Each sample was tested at a rate of 5 mm/min. At least four specimens per sample were tested, and the average tensile strength, elongation at break, and Young’s modulus were reported.
3.3.6. Heat Deflection Temperature (HDT)
A Dynamic Mechanical Analyzer (DMA) 850 (TA Instruments, New Castle, DE, USA) was used to measure the HDT for each material using a modified form of ASTM D648-18; the low-stress (0.455 MPa) condition was used, where all samples were tested with a dual cantilever fixture [54]. The sample dimensions were approximately 60 mm × 10 mm × 3 mm (l × w × t). Samples were heated from room temperature up to 74 °C at a temperature ramp rate of 2 °C/min under an air atmosphere. The deflection temperature was recorded as the temperature at which the sample reached a 0.121% strain, as previously reported, and a minimum of three samples were tested per material to ensure statistical significance [55].
3.3.7. Density
The density of the samples was measured using an AccuPyc 1340 II pycnometer (Micromeritics, Norcross, GA, USA) with helium gas. Density was calculated using this methodology as it is more accurate for manufactured parts, likely due to helium’s smaller molecule size, which can capture than displacement methods alone [15]. Each sample was cut from a small testing bar and weighed between 0.2 and 0.5 g, and each formulation was tested three times to ensure accuracy. The sample volume (cm3) and density (g/cm3) were recorded over five cycles, and the average and standard deviation were calculated for each sample to facilitate comparison.
3.3.8. Rheology
Samples for rheological characterization were prepared by melt-pressing the shredded PP and nylon specimens for 5 min at 240 °C and 290 °C, respectively. Small amplitude oscillatory shear (SAOS) measurements were performed on both PP and nylon using a rotational rheometer (DHR-3, TA Instruments, New Castle, DE, USA) with 8 mm parallel plate geometry. SAOS testing was conducted in the angular frequency range of 200–0.1 rad/s at different temperatures (240–170 °C for PP and 300–220 °C for nylon at 10 °C intervals). All measurements were performed within the linear viscoelastic regime (0.3% strain amplitude) and under a nitrogen atmosphere to alleviate concerns related to sample degradation. MFI values were calculated on the rotational rheometer using a 50 rad/s shear rate at 230 °C and 280 °C for PP and PA samples, respectively, following the previous research literature procedure [56,57]. Results for MFI are reported in Table S5.
3.3.9. Statistical Analysis
Statistical analyses were performed using JMP 18 Student Edition software (SAS Institute, Cary, NC, USA). A Student’s t test was run to compare samples. A p value < 0.05 was used to identify statistically significant differences between samples.
4. Conclusions
This study demonstrates the viability of mechanically recycling unpainted thermoplastic parts recovered from ELVs and reintroducing them into the automotive supply chain. The comparison between the ELV plastics and the model material sample sets provides valuable insight into the behavior of various thermoplastics and composites relevant to automotive recycling. Neat PP from the ELV sample set exhibited a lower stiffness (1.38 GPa) and tensile strength (38% versus ~50%) compared to the model material analyzed. These variations could be because of long-term use and/or contamination either during the use life or at EOL. In contrast, PP-T10 and PP-T20 samples showed better retention of mechanical integrity. PP-T10 exhibited consistent tensile strength (1.55–1.65 GPa), with minor differences in crystallinity (0.94–0.98 g/cm3) observed between the virgin and ELV samples. Similarly, PP-T20 displayed stiffness values ranging between ~2.15–2.70 GPa and tensile strengths of ~21–28 MPa, along with comparable crystallinity and density levels across datasets. The PA6 + GF7 + MF13 samples exhibited the highest mechanical strength across both datasets, with Young’s moduli exceeding 4 GPa, UTS above 90 MPa, and crystallinity values ranging between 27 and 31%. Across the four tested material types (PP, PP-T10, PP-T20, and PA6 + GF7 + MF13), recycled samples exhibited notable changes in density, crystallinity, and thermal stability. It is not yet clear if these differences are due to the materials’ use lives or if the differences are more driven by changes in material formulations, degradation occurring during the materials’ use lives, impacts from the recycling process itself, or contamination. However, it is undeniable that formulations differ in many cases between today’s state-of-the-art materials and materials in ELVs, which could be 10–20 years old, if not longer. The results in this work are consistent with the previous literature, which has shown residual value in model ELV plastics, which have shown minimal impacts from multiple mechanical recycling steps on polyolefin materials [40,58]. Future work is needed to confirm that these materials pass flexural and impact testing specifications for the automotive industry, which will require larger samples or sample volumes to be obtained from ELVs.
These findings suggest that vehicle disassembly, combined with direct granule-based reprocessing, can offer a practical and scalable approach to improving ELV plastic recovery rates without significant loss of material performance. Limitations still exist associated with the mechanical recycling process itself, which can negatively impact the material properties. Nevertheless, this work contributes to growing evidence that mechanical recycling of targeted plastic streams, especially when paired with material-specific disassembly, can support broader goals of automotive circularity, cost reduction, and landfill diversion. Future work is needed to quantify the environmental impacts, costs, and other benefits of mechanical recycling using this technique.
Supplementary Materials
The following supporting information can be downloaded at https://www.mdpi.com/article/10.3390/recycling10050180/s1. Figure S1: All disassembled automotive components harvested from ELVs were labeled on their surface. In this figure, the component was labeled with the original equipment manufacturer, lot number, and specific resin/fillers; Figure S2: More than 90% of each sample was recovered using the mechanical recycling process; Figure S3: Calculated carbonyl index for all virgin and recycled samples explored in this work; Figure S4: Thermogravimetric analysis (TGA) thermograms for both virgin and recycled samples that were injection molded; Figure S5: Differential scanning calorimetry results for both virgin and recycled samples during the (a) first and (b) second heat; Table S1: Weight of collected sample in each case; Table S2: Melt Flow Index (MFI) testing parameters and results; Table S3: Density for Virgin Model Materials (obtained from Material Safety Data Sheets); Table S4: Injection molding manufacturing parameters; Table S5: Results from thermogravimetric analysis (TGA).
Author Contributions
N.M.: Conceptualization, Data Curation, Writing—Original Draft; M.K.: Conceptualization, Methodology, Validation, Supervision, Writing—Original Draft, Writing—Review and Editing; A.M.H.: Formal Analysis, Methodology, Supervision, Writing—Review and Editing; K.S.: Methodology; A.L.S.A.: Methodology; A.D.: Methodology; L.K.: Methodology; S.O.: Funding Acquisition; U.V.: Project Administration, Funding Acquisition. All authors have read and agreed to the published version of the manuscript.
Funding
This work was written as a result of a Memorandum of Understanding between Oak Ridge National Laboratory and the American Chemistry Council. The work was performed in collaboration with Oak Ridge National Laboratory operated by UT-Battelle, LLC under Contract No. DE-AC05-00OR22725 with the U.S. Department of Energy. Work for this effort was performed under Employee Loan Agreement 2023-005 between UT-Battelle, LLC and the University of Tennessee.
Data Availability Statement
The datasets presented in this article are not readily available because the dataset is protected as part of the ongoing research program. Requests to access the datasets should be directed to the corresponding author: koreym@ornl.gov.
Acknowledgments
The authors would like to acknowledge Tristan McGill and Deserae Goldsby for their effort in shredding and collecting the ELV plastic components for this work. They would also like to thank Pete Glenister from LYB for providing the control materials analyzed in this work.
Conflicts of Interest
The authors declare no conflicts of interest.
References
- OICA. World Motor Vehicle Production by Country/Region and Type 2025; OICA: Paris, France, 2025. [Google Scholar]
- ACEA. Economic and Market Report: Global and EU Auto Industry—Full Year 2023; ACEA: Brussels, Belgium, 2023. [Google Scholar]
- U.S. Department of Energy. Vehicle Registration Counts by State; Alternative Fuels Data Center: Washington, DC, USA, 2023. Available online: https://afdc.energy.gov/vehicle-registration (accessed on 3 May 2025).
- Kelley Blue Book. Kelley Blue Book Report: Average New-Vehicle Prices Climb Higher For Fourth Consecutive Month, Flirt with All-Time High; Kelley Blue Book: Irvine, CA, USA, 2025; Available online: https://www.coxautoinc.com/insights-hub/december-2024-atp-report/ (accessed on 3 May 2025).
- Rose-Glowacki, H. Chemistry and Automobiles Driving the Future; American Chemistry Council: Washington, DC, USA, 2024. [Google Scholar]
- Korey, M.; Ozcan, S.; Hubbard, A.; Copenhaver, K.; Lamm, M.; Clarkson, C.; Wang, P.; Lobodin, V.; Ryder, M.; Harter, J.; et al. Durable Automotive Plastics Circularity Report; Oak Ridge National Laboratory: Oak Ridge, TN, USA, 2024. [Google Scholar]
- EuRIC. EuRIC Call for Recycled Plastic Contentin Cars; EuRIC: Brussels, Belgium, 2020. [Google Scholar]
- Exchange, T.P. Resin Markets. Available online: https://www.theplasticsexchange.com/ (accessed on 3 May 2025).
- Held, M.; Rosat, N.; Georges, G.; Pengg, H.; Boulouchos, K. Lifespans of passenger cars in Europe: Empirical modelling of fleet turnover dynamics. Eur. Transp. Res. Rev. 2021, 13, 9. [Google Scholar] [CrossRef]
- EPRB. Robust Recycled Content for Plastics in Vehicles Essential to Drive Plastic Recycling in Europe; ERPB: Brussels, Belgium, 2024. [Google Scholar]
- Alyssa Knowlton, S.B.; Bryan Staley, P.E. Analysis of MSW Landfill Tipping Fees–2023; EREF: Raleigh, NC, USA, 2023. [Google Scholar]
- Arcà, A.; Reike, D.; Bening, C.R. Beyond technical trade-offs: How the value chain impacts the deployment of mechanical and chemical recycling in the European automotive plastic sector. J. Clean. Prod. 2025, 489, 144616. [Google Scholar] [CrossRef]
- Mood, S.H.; Yorgey, G.; Perez, M.G. Evaluation of Emerging Plastics—Recycling Technologies and Management Strategies; Washington State Department of Ecology: Lacey, WA, USA, 2023.
- Martín, A.J.; Mondelli, C.; Jaydev, S.D.; Pérez-Ramírez, J. Catalytic processing of plastic waste on the rise. Chem 2021, 7, 1487–1533. [Google Scholar] [CrossRef]
- Korey, M.; Rencheck, M.L.; Tekinalp, H.; Wasti, S.; Wang, P.; Bhagia, S.; Walker, R.; Smith, T.; Zhao, X.; Lamm, M.E.; et al. Recycling polymer composite granulate/regrind using big area additive manufacturing. Compos. Part B Eng. 2023, 256, 110652. [Google Scholar] [CrossRef]
- Walker, R.; Korey, M.; Hubbard, A.M.; Clarkson, C.M.; Corum, T.; Smith, T.; Hershey, C.J.; Lindahl, J.; Ozcan, S.; Duty, C. Recycling of CF-ABS machining waste for large format additive manufacturing. Compos. Part B Eng. 2024, 275, 111291. [Google Scholar] [CrossRef]
- Copenhaver, K.; Smith, T.; Armstrong, K.; Kamath, D.; Rencheck, M.; Bhagia, S.; Korey, M.; Lamm, M.; Ozcan, S. Recyclability of additively manufactured bio-based composites. Compos. Part B Eng. 2023, 255, 110617. [Google Scholar] [CrossRef]
- Munoz Meneses, R.A.; Cabrera-Papamija, G.; Machuca-Martinez, F.; Rodriguez, L.A.; Diosa, J.E.; Mosquera-Vargas, E. Plastic recycling and their use as raw material for the synthesis of carbonaceous materials. Heliyon 2022, 8, e09028. [Google Scholar] [CrossRef] [PubMed]
- Saleem, J.; Tahir, F.; Baig, M.Z.K.; Al-Ansari, T.; McKay, G. Assessing the environmental footprint of recycled plastic pellets: A life-cycle assessment perspective. Environ. Technol. Innov. 2023, 32, 103289. [Google Scholar] [CrossRef]
- Maury, T.; Tazi, N.; de Matos, C.T.; Nessi, S.; Antonopoulos, I.; Pierri, E.; Baldassarre, B.; Garbarino, E.; Gaudillat, P.; Mathieux, F. Towards Recycled Plastic Content Targets in New Passenger Cars and Light Commercial Vehicles; Publications Office of the European Union: Luxembourg, 2023. [Google Scholar]
- Lase, I.S.; Tonini, D.; Caro, D.; Albizzati, P.F.; Cristóbal, J.; Roosen, M.; Kusenberg, M.; Ragaert, K.; van Geem, K.M.; Dewulf, J.; et al. How much can chemical recycling contribute to plastic waste recycling in Europe? An assessment using material flow analysis modeling. Resour. Conserv. Recycl. 2023, 192, 106916. [Google Scholar] [CrossRef]
- Cardamone, G.F.; Ardolino, F.; Arena, U. Can plastics from end-of-life vehicles be managed in a sustainable way? Sustain. Prod. Consum. 2022, 29, 115–127. [Google Scholar] [CrossRef]
- Ford Motor Company. Ford Bronco Sport Features First-Ever Parts Made of 100% Recycled Ocean Plastic. Available online: https://media.ford.com/content/fordmedia/fna/us/en/news/2021/12/08/ford-bronco-sport-recycled-ocean-plastic.html (accessed on 3 May 2025).
- Bowden-Eyre, J. Jaguar Land Rover Will Use Plastic Waste in Next-Generation Sustainable Luxury Interiors. Available online: https://www.jlr.com/news/2020/09/jaguar-land-rover-will-use-plastic-waste-next-generation-sustainable-luxury-interiors (accessed on 3 May 2025).
- Seidel, C. BMW i Ventures Invests in High-Performance Composites Made from Natural Fibres. Available online: https://www.press.bmwgroup.com/global/article/detail/T0377293EN/bmw-i-ventures-invests-in-high-performance-composites-made-from-natural-fibres?language=en (accessed on 3 June 2025).
- Datz, R. The All-Electric Volvo EX30 Small SUV is Designed to have the Lowest Carbon Footprint of Any Volvo Car to Date. Available online: https://www.media.volvocars.com/global/en-gb/media/pressreleases/312698/the-all-electric-volvo-ex30-small-suv-is-designed-to-have-the-lowest-carbon-footprint-of-any-volvo-c (accessed on 3 May 2025).
- Honda R&D Co. Honda and Idemitsu Kosan Begin Joint Demonstration Testing of Closed-loop Recycling of Plastics from End-of-Life Vehicles. Available online: https://global.honda/en/topics/2024/c_2024-03-28eng.html (accessed on 3 May 2025).
- Bisch, J. LyondellBasell and Audi Create First Automotive Plastic Parts From Mixed Automotive Plastic Waste. Available online: https://www.lyondellbasell.com/en/news-events/products--technology-news/lyondellbasell-and-audi-create-first-automotive-plastic-parts-from-mixed-automotive-plastic-waste/ (accessed on 3 May 2025).
- Arena, U.; Ardolino, F. Technical and environmental performances of alternative treatments for challenging plastics waste. Resour. Conserv. Recycl. 2022, 183, 106379. [Google Scholar] [CrossRef]
- Harler, C. Recovering and Recycling Plastics from ASR is Challenging, Though some Companies have Found Success. Available online: https://www.recyclingtoday.com/article/rt0715-plastics-from-asr/#:~:text=Recovering%20and%20recycling%20plastics%20from,some%20companies%20have%20found%20success.&text=Automotive%20shredder%20residue%2C%20or%20ASR,material%20is%20plastics%E2%80%94valuable%20plastics (accessed on 3 June 2025).
- Polymers, M. Experience. Technology. Capabilities. Available online: https://mbapolymers.com/ (accessed on 3 June 2025).
- Armstrong, K.O.; Kamath, D.; Zhao, X.; Rencheck, M.L.; Tekinalp, H.; Korey, M.; Hun, D.; Ozcan, S. Life cycle cost, energy, and carbon emissions of molds for precast concrete: Exploring the impacts of material choices and additive manufacturing. Resour. Conserv. Recycl. 2023, 197, 107117. [Google Scholar] [CrossRef]
- dos Santos, M.S.; dos Anjos, E.G.R.; Montagna, L.S.; Passador, F.R. Mechanical recycling of carbon fiber composites: Development of hybrid composites of epoxy resin, carbon fiber, and carbon nanotubes for functional electromagnetic applications. Polym. Eng. Sci. 2025, 65, 2500–2512. [Google Scholar] [CrossRef]
- Oliveira, B.F.; Gonçalves, T.I.; Gonçalves, R.; Lourenço, E.; Oliveira, C.; Paulo, V.; Barbosa, F.V. Assessing the environmental impact of cryogenic treatment in recycling scenarios for PBT-GF30 components. Sustain. Mater. Technol. 2025, 44, e01298. [Google Scholar] [CrossRef]
- Olonisakin, K.; Rodriguez-Uribe, A.; Wang, T.; Mohanty, A.K.; Thimmanagari, M.; Misra, M. Engineered advanced light-weight sustainable composites from surface modified recycled carbon fiber reinforced polyamide 6,6 for metallic part alternative in automotive. Compos. Part B Eng. 2025, 300, 112375. [Google Scholar] [CrossRef]
- McNeeley, A.; Liu, Y.A. Assessment of Nylon-66 Depolymerization for Circular Economy: Kinetic Modeling, Purification, and Sustainable Design. Ind. Eng. Chem. Res. 2025, 64, 4179–4203. [Google Scholar] [CrossRef]
- Arese, M.; Bolliri, I.; Ciaccio, G.; Brunella, V. Post-Industrial Recycled Polypropylene for Automotive Application: Mechanical Properties After Thermal Ageing. Processes 2025, 13, 315. [Google Scholar] [CrossRef]
- Duranceau, C.; Spangenberger, J. All Auto Shredding: Evaluation of Automotive Shredder Residue Generated by Shredding Only Vehicles; Argonne National Laboratory: Lemont, IL, USA, 2011. [Google Scholar]
- Juan, R.; Expósito, M.T.; Paredes, B.; Lechuga, D.; Martínez, C.; Cardil, A.; Aguilera-Villegas, L.; Ramos, J.; Domínguez, C.; Vega, J.F.; et al. Enhancing the recyclability of ELV plastic bumpers: Characterization of molecular, morphological, rheological, mechanical properties and ageing degradation. Polym. Degrad. Stab. 2024, 230, 111024. [Google Scholar] [CrossRef]
- Kozderka, M.; Rose, B.; Bahlouli, N.; Kočí, V.; Caillaud, E. Recycled high impact polypropylene in the automotive industry—Mechanical and environmental properties. Int. J. Interact. Des. Manuf. (IJIDeM) 2016, 11, 737–750. [Google Scholar] [CrossRef]
- Almond, J.; Sugumaar, P.; Wenzel, M.N.; Hill, G.; Wallis, C. Determination of the carbonyl index of polyethylene and polypropylene using specified area under band methodology with ATR-FTIR spectroscopy. e-Polymers 2020, 20, 369–381. [Google Scholar] [CrossRef]
- Jansson, A.; Möller, K.; Gevert, T. Degradation of post-consumer polypropylene materials exposed to simulated recycling—Mechanical properties. Polym. Degrad. Stab. 2003, 82, 37–46. [Google Scholar] [CrossRef]
- Borges, S.; Piccirillo, C.; Scalera, F.; Martins, R.; Rosa, A.; Couto, J.; Almeida, A.; Pintado, M. Valorization of porcine by-products: A combined process for protein hydrolysates and hydroxyapatite production. Bioresour. Bioprocess. 2022, 9, 30. [Google Scholar] [CrossRef] [PubMed]
- Celik, M.; Nakano, H.; Uchida, K.; Isobe, A.; Arakawa, H. Comparative evaluation of the carbonyl index of microplastics around the Japan coast. Mar. Pollut. Bull. 2023, 190, 114818. [Google Scholar] [CrossRef] [PubMed]
- Brostow, W.; Lu, X.; Gencel, O.; Osmanson, A.T. Effects of UV Stabilizers on Polypropylene Outdoors. Materials 2020, 13, 1626. [Google Scholar] [CrossRef]
- Harley, M. Why Do Today’s Cars Last Longer Than They Used To? Forbes: New York, NY, USA, 2023; Available online: https://www.forbes.com/sites/michaelharley/2023/06/11/why-do-todays-cars-last-longer-than-they-used-to/ (accessed on 22 September 2025).
- Jiang, S.; Greiner, A.; Agarwal, S. Short nylon-6 nanofiber reinforced transparent and high modulus thermoplastic polymeric composites. Compos. Sci. Technol. 2013, 87, 164–169. [Google Scholar] [CrossRef]
- Dusunceli, N.; Colak, O.U. Modelling effects of degree of crystallinity on mechanical behavior of semicrystalline polymers. Int. J. Plast. 2008, 24, 1224–1242. [Google Scholar] [CrossRef]
- Diani, M.; Colledani, M. Energy consumption assessment and modeling of a comminution process: The glass fibers reinforced composites case-study. Procedia. CIRP 2020, 90, 483–487. [Google Scholar] [CrossRef]
- ASTM D638-14; Standard Test Method for Tensile Properties of Plastics. American Society for Testing and Materials: West Conshohocken, PA, USA, 1998.
- ASTM D3418-21; Standard Test Method for Transition Temperatures and Enthalpies of Fusion and Crystallization of Polymers by Differential Scanning Calorimetry. ASTM International: West Conshohocken, PA, USA, 2021.
- Rezaei Abadchi, M.; Jalali-Arani, A. Crystallization and melting behavior of polypropylene (PP) in (vulcanized nanoscale polybutadiene rubber powder/PP) polymer-nanocomposites. Thermochim. Acta 2015, 617, 120–128. [Google Scholar] [CrossRef]
- Millot, C.; Fillot, L.-A.; Lame, O.; Sotta, P.; Seguela, R. Assessment of polyamide-6 crystallinity by DSC. J. Therm. Anal. Calorim. 2015, 122, 307–314. [Google Scholar] [CrossRef]
- ASTM D648-18; Standard Test Method for Deflection Temperature of Plastics Under Flexural Load in the Edgewise Position. ASTM International: West Conshohocken, PA, USA, 2018.
- Wasti, S.; Hubbard, A.M.; Clarkson, C.M.; Johnston, E.; Tekinalp, H.; Ozcan, S.; Vaidya, U. Long coir and glass fiber reinforced polypropylene hybrid composites prepared via wet-laid technique. Compos. Part C Open Access 2024, 14, 100445. [Google Scholar] [CrossRef]
- Ramani, K.; Dealy, J.M. Correlation of Melt Flow Index with Molecular Weight and Zero-Shear Viscosity for Thermoplastics. J. Rheol. 1997, 41, 197–219. [Google Scholar]
- Seavey, K.C.; Liu, Y.A.; Khare, N.P. Quantifying Relationships among the Molecular Weight Distribution, Non-Newtonian Shear Viscosity, and Melt Index for Linear Polymers. Ind. Eng. Chem. Res. 2003, 42, 5354–5362. [Google Scholar] [CrossRef]
- Guo, W.; Li, K.; Fang, Z.; Feng, T.; Shi, T. A sustainable recycling process for end-of-life vehicle plastics: A case study on waste bumpers. Waste. Manag. 2022, 154, 187–198. [Google Scholar] [CrossRef] [PubMed]


Disclaimer/Publisher’s Note: The statements, opinions and data contained in all publications are solely those of the individual author(s) and contributor(s) and not of MDPI and/or the editor(s). MDPI and/or the editor(s) disclaim responsibility for any injury to people or property resulting from any ideas, methods, instructions or products referred to in the content. |
© 2025 by the authors. Licensee MDPI, Basel, Switzerland. This article is an open access article distributed under the terms and conditions of the Creative Commons Attribution (CC BY) license (https://creativecommons.org/licenses/by/4.0/).