Abstract
Sustainability and the circular economy are increasingly recognized as global priorities, particularly in industrial waste management. This study explores the development of a sustainable composite material using wood waste and natural fibers, contributing to circular economy practices. Sandwich panels were manufactured with a green epoxy resin matrix, incorporating wood waste in the core and flax fibers in the outer layers. Mechanical tests on the sandwich panel revealed a facing bending stress of 92.79 MPa and a core shear stress of 2.43 MPa. The panel demonstrated good compressive performance, with an edgewise compressive strength of 61.39 MPa and a flatwise compressive strength of 96.66 MPa. The material’s viscoelastic behavior was also characterized. In stress relaxation tests (from an initial 21 MPa), the panel’s stress decreased by 20.2% after three hours. The experimental relaxation data were successfully fitted by the Kohlrausch–Williams–Watts (KWW) model for both short- and long-term predictions. In creep tests, the panel showed a 21.30% increase in displacement after three hours under a 21 MPa load. For creep behavior, the KWW model was preferable for short-term predictions, while the Findley model provided a better fit for long-term predictions.
1. Introduction
On the world stage, sustainability, defined as “the ability to meet our present needs without compromising the ability of future generations to meet their own needs”, is increasingly recognized as a global priority, with the concept of sustainable development being adopted by governments, organizations and society in general [1].
The circular economy, a fundamental concept in sustainability and sustainable development, contrasts with the linear economy model, where resources are extracted, used and discarded. In contrast, the circular economy aims to minimize waste and maximize the reuse of resources by recycling or repurposing products and materials [2,3]. The reuse of waste from industry is a crucial pillar of the circular economy, especially considering the growing volume of waste generated by this sector. In the circular economy model, waste is viewed as a resource to be recovered and utilized as inputs for other production cycles. This approach enables businesses to extend their control over products and materials throughout their life cycles, such as retaining ownership of products by providing them as a service to customers [4,5]. Transforming this waste into resources is a strategy that not only contributes to environmental sustainability but can also result in significant economic opportunities [6].
In this context, composite materials have emerged as a promising solution to the problem of improper industrial waste management. Despite the significant improvements already recorded in this field, a substantial proportion of this waste is still subject to disposal processes. To solve this problem, composite materials reinforced with natural fiber waste have been used in several studies and have interesting properties, such as low density, high stiffness and low cost. In addition, they involve less complex and more secure manufacturing processes [7,8,9,10].
Several studies have developed technical solutions to extend the life of these waste materials by combining different families of materials to create a new material for a specific application. As a strategy to reduce plastic pollution, Owen et al. [11] used industrial plastic waste reinforced with recycled nylon fibers, specifically designed for paving applications. New manufacturing technologies of a sandwich with an up-cycled polyethylene core made from discarded bottle caps and several thermoplastic composite skins reinforced with aluminum or coir fiber [12], a recycled polyethylene terephthalate (PET) bottle foil and a castor oil bio-polyurethane [13] and flax or glass fibers [14] are being developed as environmentally friendly solutions for secondary structural applications.
McCracken and Sadeghian investigated the mechanical behavior of beams made from green materials for both the core and skin components of a sandwich for building applications. A unidirectional flax fabric and a partially bio-based epoxy were used to make fiber-reinforced polymer (FRP) skins, and three types of corrugated board were used for the core [15].
Particularly on flax FRP facing, research has also emphasized the role of the thickness of this facing in enhancing mechanical performance. In a study conducted by Fu and Sadeghian, sandwich composites with honeycomb cores and flax FRP facings were manufactured. The authors demonstrated that increasing the thickness of the flax facing had a significant impact on the initial stiffness and an even more pronounced effect on the initial bending rigidity [16].
Betts et al. analyzed the performance of sandwich panels with FRP polymer faces and foam cores under impact loading. The study found that, regardless of the core type, face strain increased as the face thickness decreased, with this effect being more pronounced when transitioning from two layers to a single layer of flax. Furthermore, the study demonstrated that the impact resistance and stiffness of the composites increased with face thickness [17]. Fu and Sadeghian investigated small-scale sandwich beams consisting of hollow and foam-filled paper honeycomb cores with flax fiber composite skins under bending. The study found that as the skin thickness increased, the load capacity improved, and the failure mode shifted from tension rupture of the skin to shear failure of the core. Moreover, the impact of shear to the total deformation rose from an average of 17% to 50% with the increased skin thickness [18].
Another prominent research topic in the field of natural fiber-reinforced composite materials are wood polymer composites (WPCs). WPCs have been widely studied in recent years, with a focus on the factors that influence their properties, such as the size, weight percentage, orientation and type of wood fibers; the kind of polymer used in the composite matrix; and the combination of wood fibers with other synthetic or natural fibers to form hybrid composites. Several authors have used epoxy resins as matrices in WPCs, obtaining favorable results [19,20]. In addition, studies on the hybridization of wood fibers with other natural fibers, such as flax, have shown that adding a limited amount of this type of fiber can significantly improve the mechanical performance of composites [21,22].
One of these improvements is the increase in bending strength, which, in the combination of wood and flax fibers, is mainly provided by flax fibers, since they have a higher modulus of stiffness [21].
Although these findings have been established, further experimental studies and theoretical analyses of the bending performance of flax FRP in combination with WPCs under long-term loads are required to ensure the safety of its application in practical engineering [21]. For long-term applications subject to continuous loading, it is essential to analyze the stress relaxation and creep behavior of thermoplastic composites reinforced with wood fibers.
Wang et al. investigated the creep behavior of composites based on high-density polyethylene (HDPE) reinforced with four different sizes of wood fibers. At a constant load level, the composites made with larger wood fibers showed better creep resistance at room temperature (RT) and at the several temperatures studied. In addition, the creep properties of composites with smaller wood fibers were more dependent on temperature than those with larger fibers [23].
Georgiopoulos er al. studied the short-term creep deformation behavior in traction and simple bending mode of composites made from a biodegradable matrix, reinforced with three different types of wood fibers and with different concentrations, between 20 and 30 wt.%. The results showed that the creep deformation is significantly reduced with the incorporation of wood fibers into the matrix in all the cases considered, revealing a material with greater dimensional stability. Lignocel fibers provide the best reinforcement to the matrix and for a low quantity (20 wt.%), justified by the different nature of the fiber and/or its greater length, while at 30 wt.%, the traction creep behavior deteriorates due to particle aggregation. On the other hand, shorter Arbocel fibers provide greater creep stability in both traction and bending modes [24].
Among the natural materials with great potential for use as reinforcement in a polymer matrix, we highlight wood waste (as sawdust), whose main components are cellulose, hemicellulose and lignin. The main advantages of using sawdust residues are their abundance in sawmills and the possibility of working with a wide range of different particle sizes [8].
The valorization of industrial byproducts, such as wood waste, is a cornerstone of the circular economy, aiming to reduce landfill burden and the consumption of virgin resources. In material science, incorporating waste like sawdust into polymer composites is a well-established field. Similarly, the use of natural fibers like flax for reinforcing polymer skins in sandwich panels is an active area of research.
However, a specific gap exists in the literature concerning the combination of these two sustainable approaches into a singular composite structure. While some studies have developed sandwich panels with various eco-friendly cores and facings, there is a notable lack of data on the long-term structural performance of panels that specifically combine a wood-waste composite core with flax fiber-reinforced skins. For materials intended for practical engineering applications, understanding the viscoelastic behavior such as creep and stress relaxation is critical for safety and durability, a point highlighted as needing further investigation.
This work aims to develop a composite material with a core reinforced by industrial sawdust, incorporating natural flax fibers as a facing to form a sandwich panel. The polymer matrix used for both the core and the facing of the sandwich panel is a bio-based epoxy resin. This approach creates an opportunity to use industrial waste that would otherwise be landfilled. In addition to producing a new material with potential applications in the furniture industry, as a thermal and acoustic coating material in the construction industry or in the construction of secondary structures, this work promotes the recycling of industrial waste and the avoidance of landfills, thus promoting the circular economy.
2. Materials and Experimental Procedure
2.1. Materials
The waste wood was supplied by a service and production company focused on product design, merchandising and trade marketing solutions for the point of sale. The matrix used is based on SR GreenPoxy 56 resin with a percentage of biobased carbon content between 50 and 58% and SD Surf Clear hardener, supplied by Sicomin, and a twill flax fiber cloth woven fabric (with 195 g/m2).
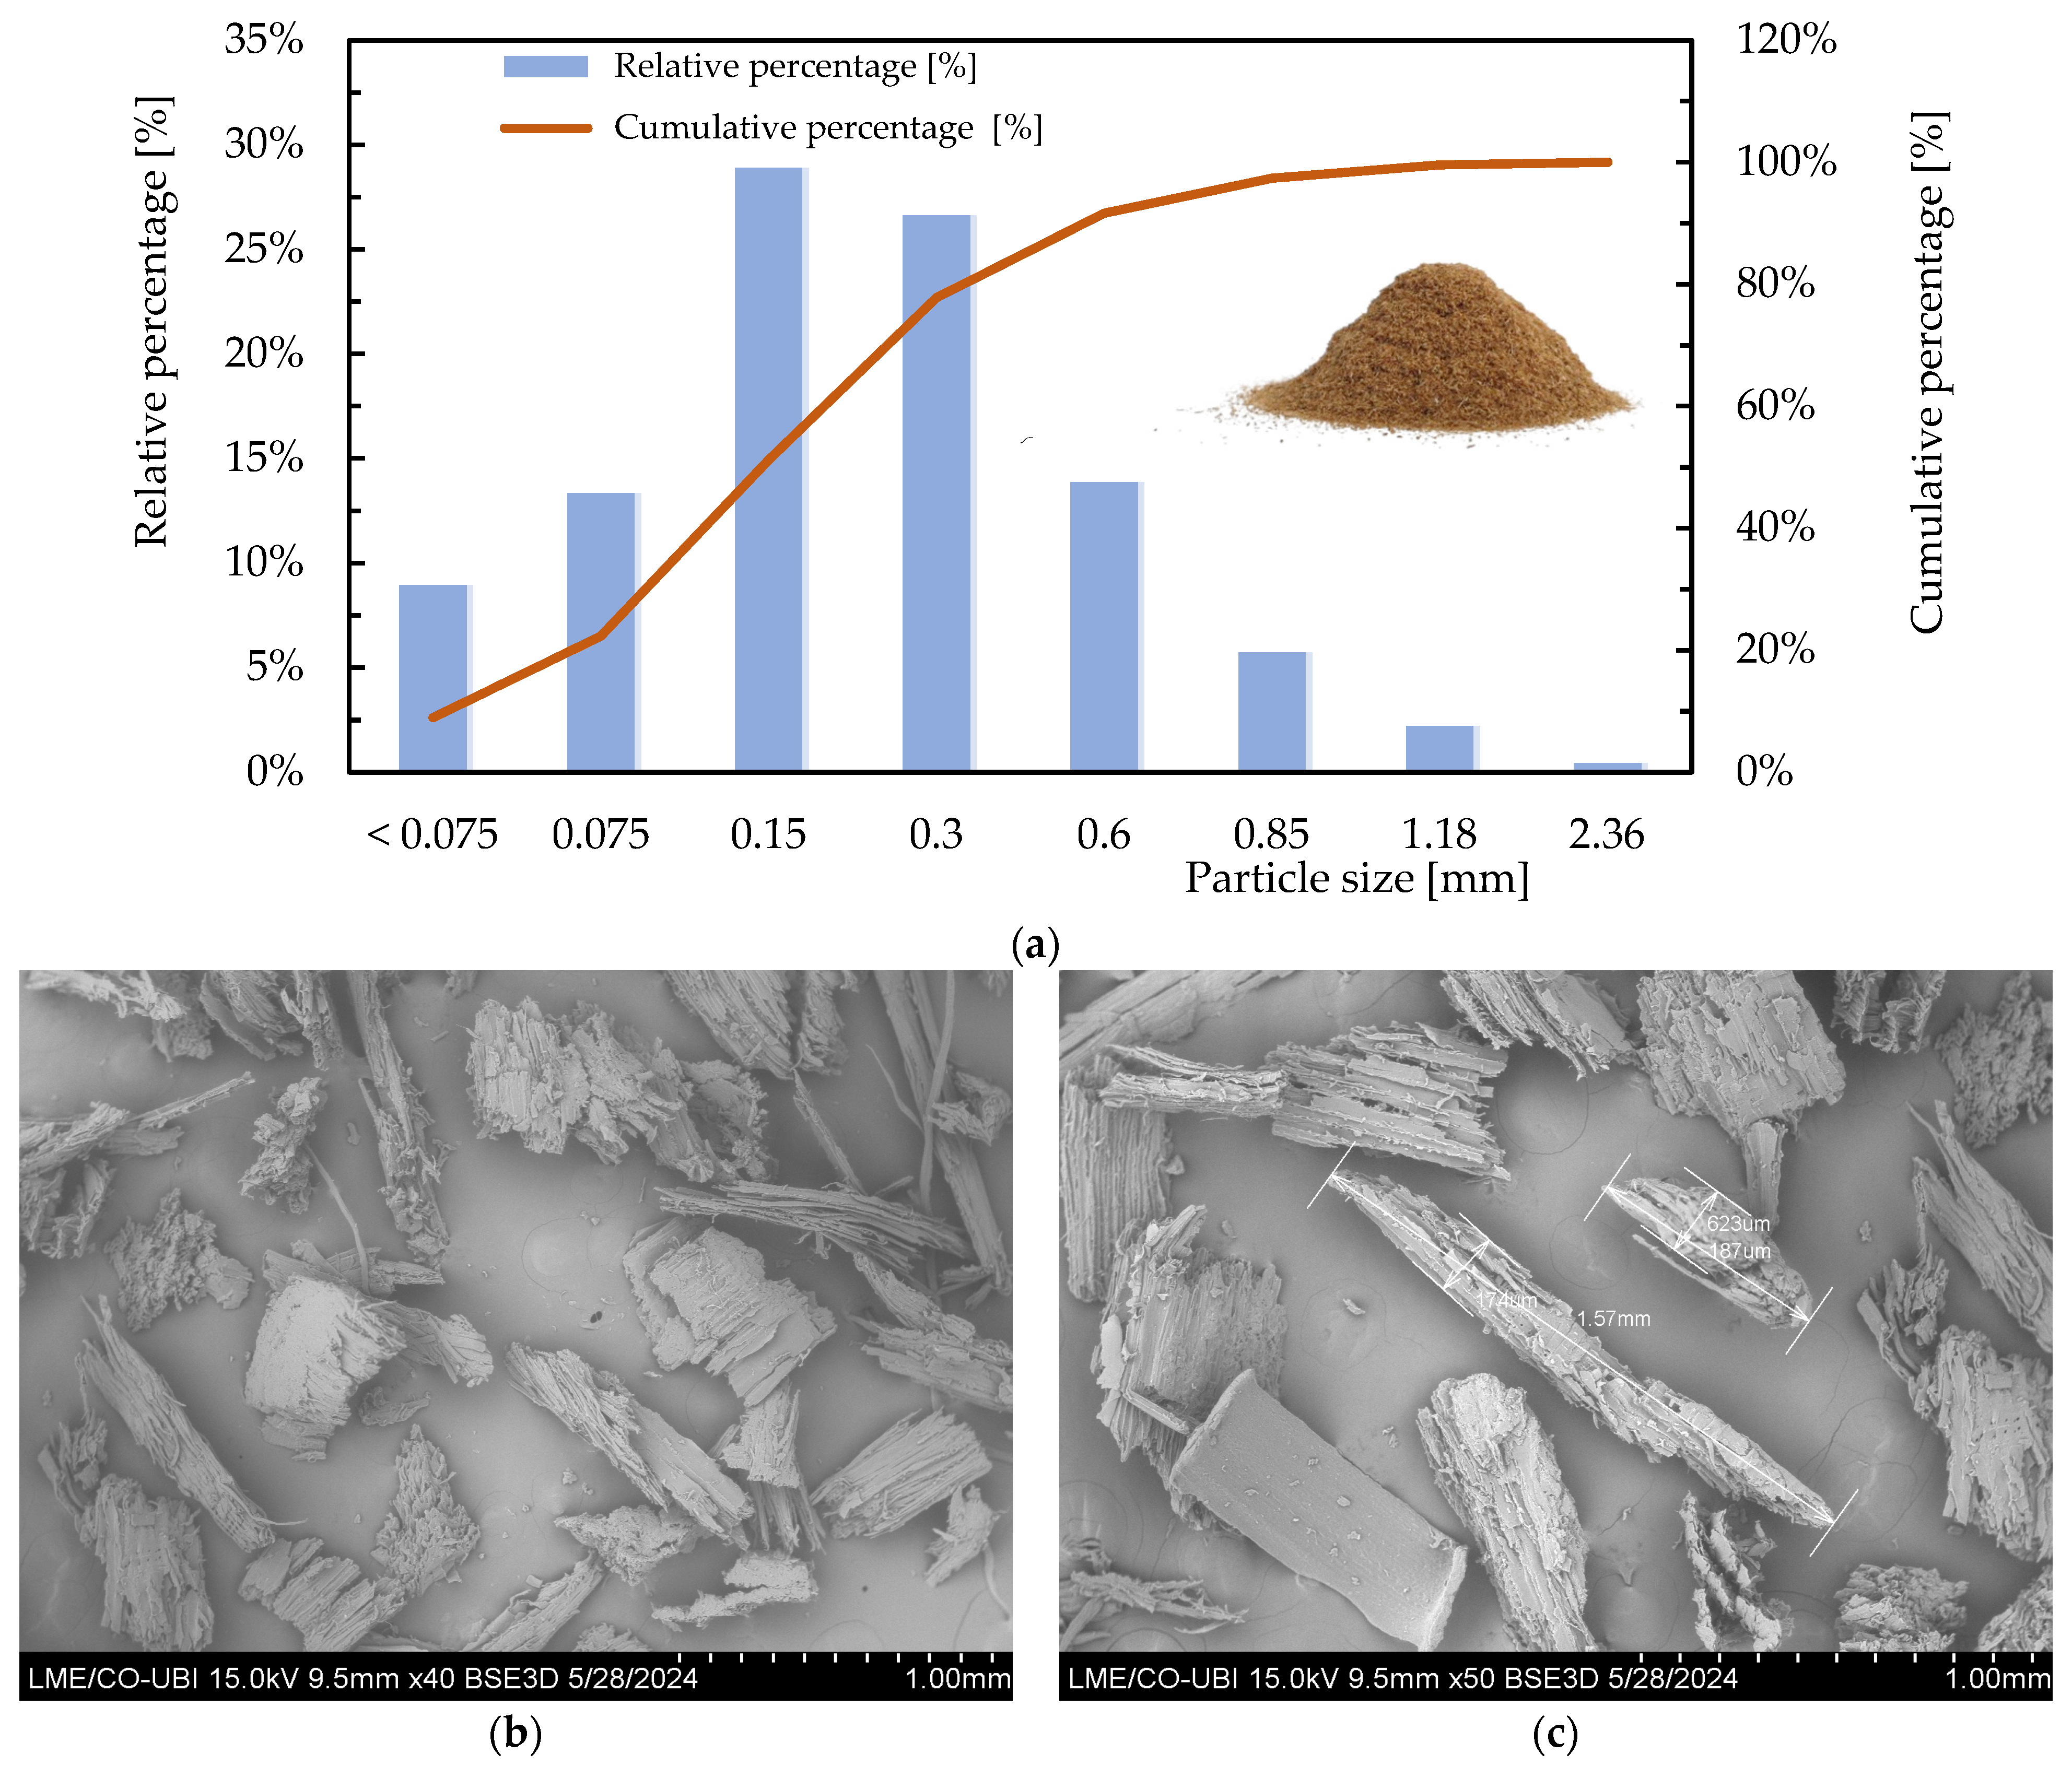
The waste wood was first subjected to particle size analysis by dry sieving. Sieves with openings of 2.36 mm, 1.18 mm, 0.85 mm, 0.60 mm, 0.30 mm, 0.15 mm and 0.075 mm were selected for the analysis, using a sieve shaker Retsch AS200, (Haan, Germany). The sample was sieved in 10 min cycles, repeated five times, ensuring that all the particles were correctly classified. After sieving, the fractions retained in each sieve were weighed, with emphasis on the 0.15 mm and 0.30 mm particles, which constituted the majority fractions.
The percentages of each fraction concerning to the total weight were calculated and a graph of the particle size distribution was constructed. The graph is shown in Figure 1a, displaying the relationship between particle sizes and their respective relative and cumulative percentages.
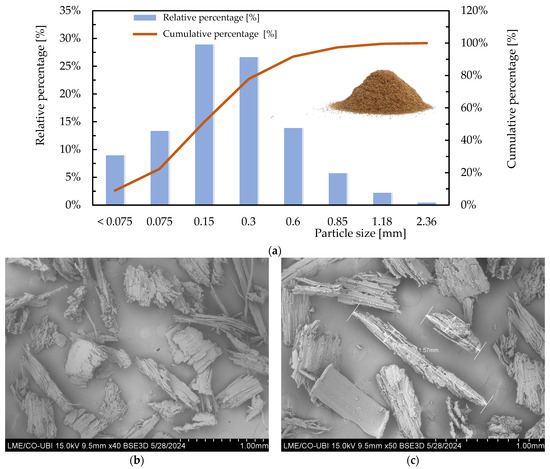
Figure 1.
Wood particles: (a) Graph of the particle size distribution of industrial wood waste; (b) overview of particle size geometry; (c) size of two specific particles.
For a more detailed analysis of the particles, scanning electron microscopy (SEM) was employed using the Hitachi S-3400N model S-3400N (manufactured by Hitachi, Ltd., Tokyo, Japan.), equipped with Quantax ESPRIT (version 1.9, Berlin, Germany) data acquisition and analysis software. Figure 1b illustrates that the particles under study exhibit significant variability in terms of size and geometry. For instance, Figure 1c demonstrates the dimensional variability of two specific particles where the length ranges from 0.623 mm to 1.57 mm, while the width varies from 0.174 mm to 0.187 mm.
To apply the greatest amount of wood particles, considering their size and optimizing the mechanical properties of the sandwich core, 14 composite materials were initially produced. The new materials were manufactured with percentages by weight (wt.%) of wood fibers of 20, 30 and 40 wt.%, with particle sizes varying between 0.075 mm and 0.150 mm and a combination of these two sizes and 0.300 mm, in addition to a material with 50 wt.% of particles with a size of 0.300 mm, and a neat matrix to compare the mechanical properties. The choice of particle size was determined according to the quantity available previously determined.
2.2. Manufacture and Experimental Procedure
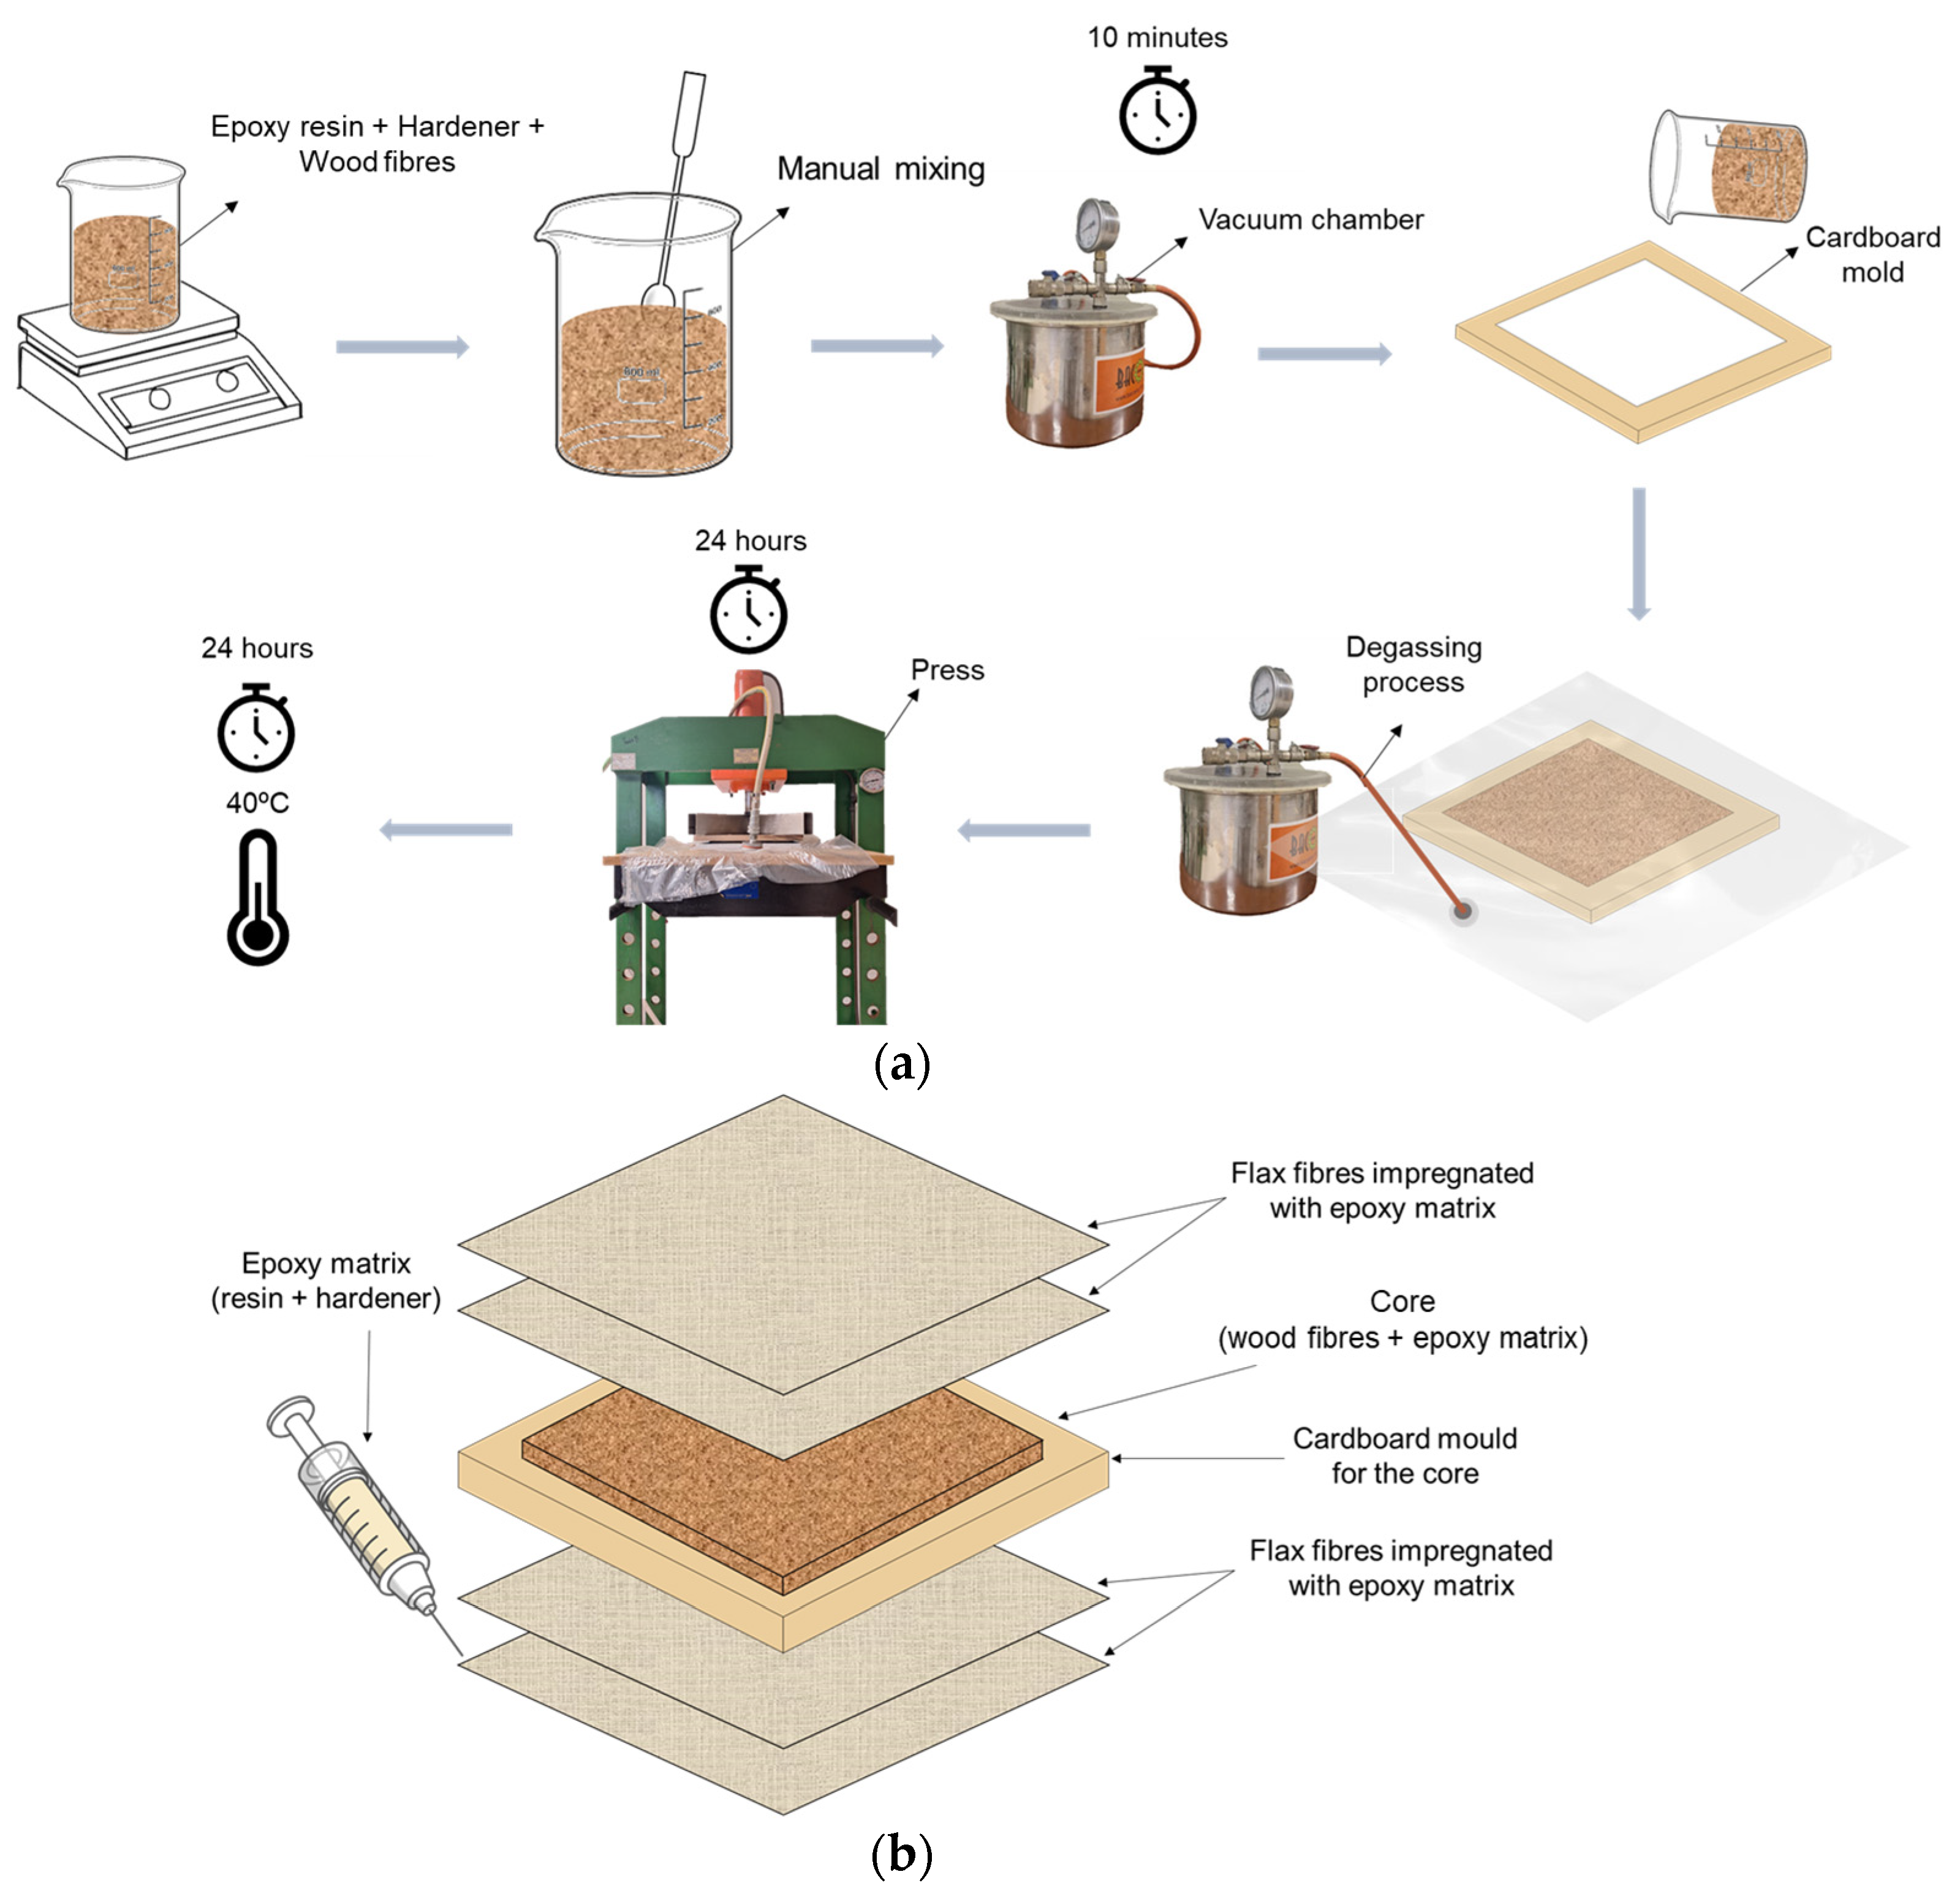
After the weighing process, the resulting composition was manually mixed with precision until the desired homogeneity was achieved. The mixture was then subjected to a degassing process in a vacuum chamber for a period of 10 min under a negative pressure of 0.9 ± 0.1 bar. Subsequently, the mixture was poured into a cardboard mold with dimensions 3 × 120 × 80 mm3 and underwent an initial degassing process for approximately 30 min, to extract air bubbles resulting from manual mixing and prevent the appearance of interior defects. The materials were then subjected to a curing process at RT in a press under a pressure of 2.5 kN for 24 h and simultaneously subjected to vacuum for the first hour. The post-curing process was conducted in an oven at 40 °C for 24 h to maximize mechanical properties, as shown in Figure 2a, according to the guidelines established by the manufacturer [25].

Figure 2.
Schematic illustrations: (a) manufacturing composites for the sandwich core; (b) sandwich panel assembly.
Production of the sandwich panel, by hand lay-up process, began with weighing and measuring the required quantities of epoxy resin, hardener and wood particles to manufacture the core and flax fiber to manufacture the faces. Once the core had been produced, the assembly process began with the sandwich panel (Figure 2b). A measured amount of matrix epoxy was applied over the release agent, followed by a layer of flax fibers impregnated with the matrix. This process was repeated for a second layer of flax fibers. A cardboard mold with dimensions 9 × 200 × 160 mm3 was then placed and the core mixture poured in (with 40 wt.% 0.300 mm wood particles and epoxy matrix). The process was repeated on the other side of the sandwich for two more layers of flax fiber.
The curing process consisted of placing the entire set in a vacuum bag, vacuum application and manually removing larger voids, followed by degassing of the sandwich structure for 30 min then curing at RT in a press under pressure of 2.5 kN for 24 h, followed by post-curing in an oven at 40 °C for a further 24 h.
To obtain the specimens according to the dimensions of the standards, the composite materials were cut using a Struers Accutom 2 cutting machine. A water-cooled diamond disc was used to prevent the composite from heating up. To characterize the different formulations for the core, three-point static bending (3PB) tests were carried out using a Shimadzu AGS-X universal testing machine (manufactured by Shimadzu Corporation, Kyoto, Japan), equipped with a 10 kN load cell. The data were recorded using Trapezium X software, version 1.4.0. The dimensions of the specimens—length 80 ± 2 mm, width 10 ± 0.2 mm and thickness 3 ± 0.1 mm—were determined in accordance with BS EN ISO 178:2019 standard [26].
For each condition, at least five specimens were tested at RT, with a displacement rate of 2 mm/min and a span of 60 mm. The main properties for bending strength, bending modulus and bending strain were obtained according to Equations (1) to (3), respectively.
where P is the load (N), L is the span length (mm), b is the width (mm), h is the thickness of the specimen (mm), I is the moment of inertia of the cross-section (kg × m2), ΔP and Δu are, respectively, the load range and bending displacement range in the middle span for an interval in the linear region of the load versus displacement plot and S is the deflection (mm). The error considered in all results is the standard deviation.
Analogous to the testing of the core, the static 3PB tests of the sandwich structure, with the optimized core, were performed using the same equipment.
The specimens, measuring 75 mm in width and 200 mm in length, were tested under RT. In accordance with the ASTM C393 standard, the span was set at 150 mm [27]. Five sandwich samples were tested at a displacement rate of 3 mm/min. The core shear stress and facing bending stress were determined as recommended by ASTM C393 standard, using the following Equations (4) and (5), respectively.
where is the core shear stress (MPa), P is the load (N), d is the sandwich thickness (mm), c is the core thickness (mm), b is the sandwich width (mm), is the facing bending stress (MPa), L is the span length (mm) and t is the facing thickness (mm).
The compression tests on the sandwich structure, both edgewise and flatwise, were performed using a Shimadzu AG-IC universal testing machine with a 50 kN load cell at RT. Load, displacement and stress and strain data were recorded using Trapezium X software.
In the edgewise tests, the specimens with 50 × 50 × 10 ± 0.2 mm were positioned vertically, and in the flatwise tests, the specimens with 20 × 20 × 10 ± 0.1 mm were positioned horizontally, both with a displacement rate of 0.5 mm/min, following the ASTM C-364 and ASTM C-365 standards, respectively, with four specimens tested in each case [28,29].
The stress relaxation and creep tests on the sandwich structure were carried out using the same apparatus of static 3PB tests, the Shimadzu AGS-X universal testing machine and the Trapezium X software. Time, load and displacement data were recorded.
The specimens, 75 mm wide and 200 mm long, were tested at RT in both tests. Relaxation tests were performed according to ASTM E328. A fixed strain corresponding to 12, 21, 27 and 33 MPa was applied and the stress was recorded during the loading time (180 min) [30]. Creep tests were carried out in accordance with ASTM D2990, where a fixed bending stress was applied (12, 21, 27 and 33 MPa) and the displacement was recorded during the same loading time [31]. The values employed in both tests, with a minimum of three specimens each, were chosen to ensure that all viscoelastic tests were conducted within the elastic regime.
All the tests conducted on the core and the sandwich panel, along with their respective dimensions and the number of specimens used, are shown in Table 1, which details the test matrix for this study.

Table 1.
Studies of different core and sandwich panel configurations, respective tests, dimensions and number of samples tested.
3. Results
3.1. Static Characterization
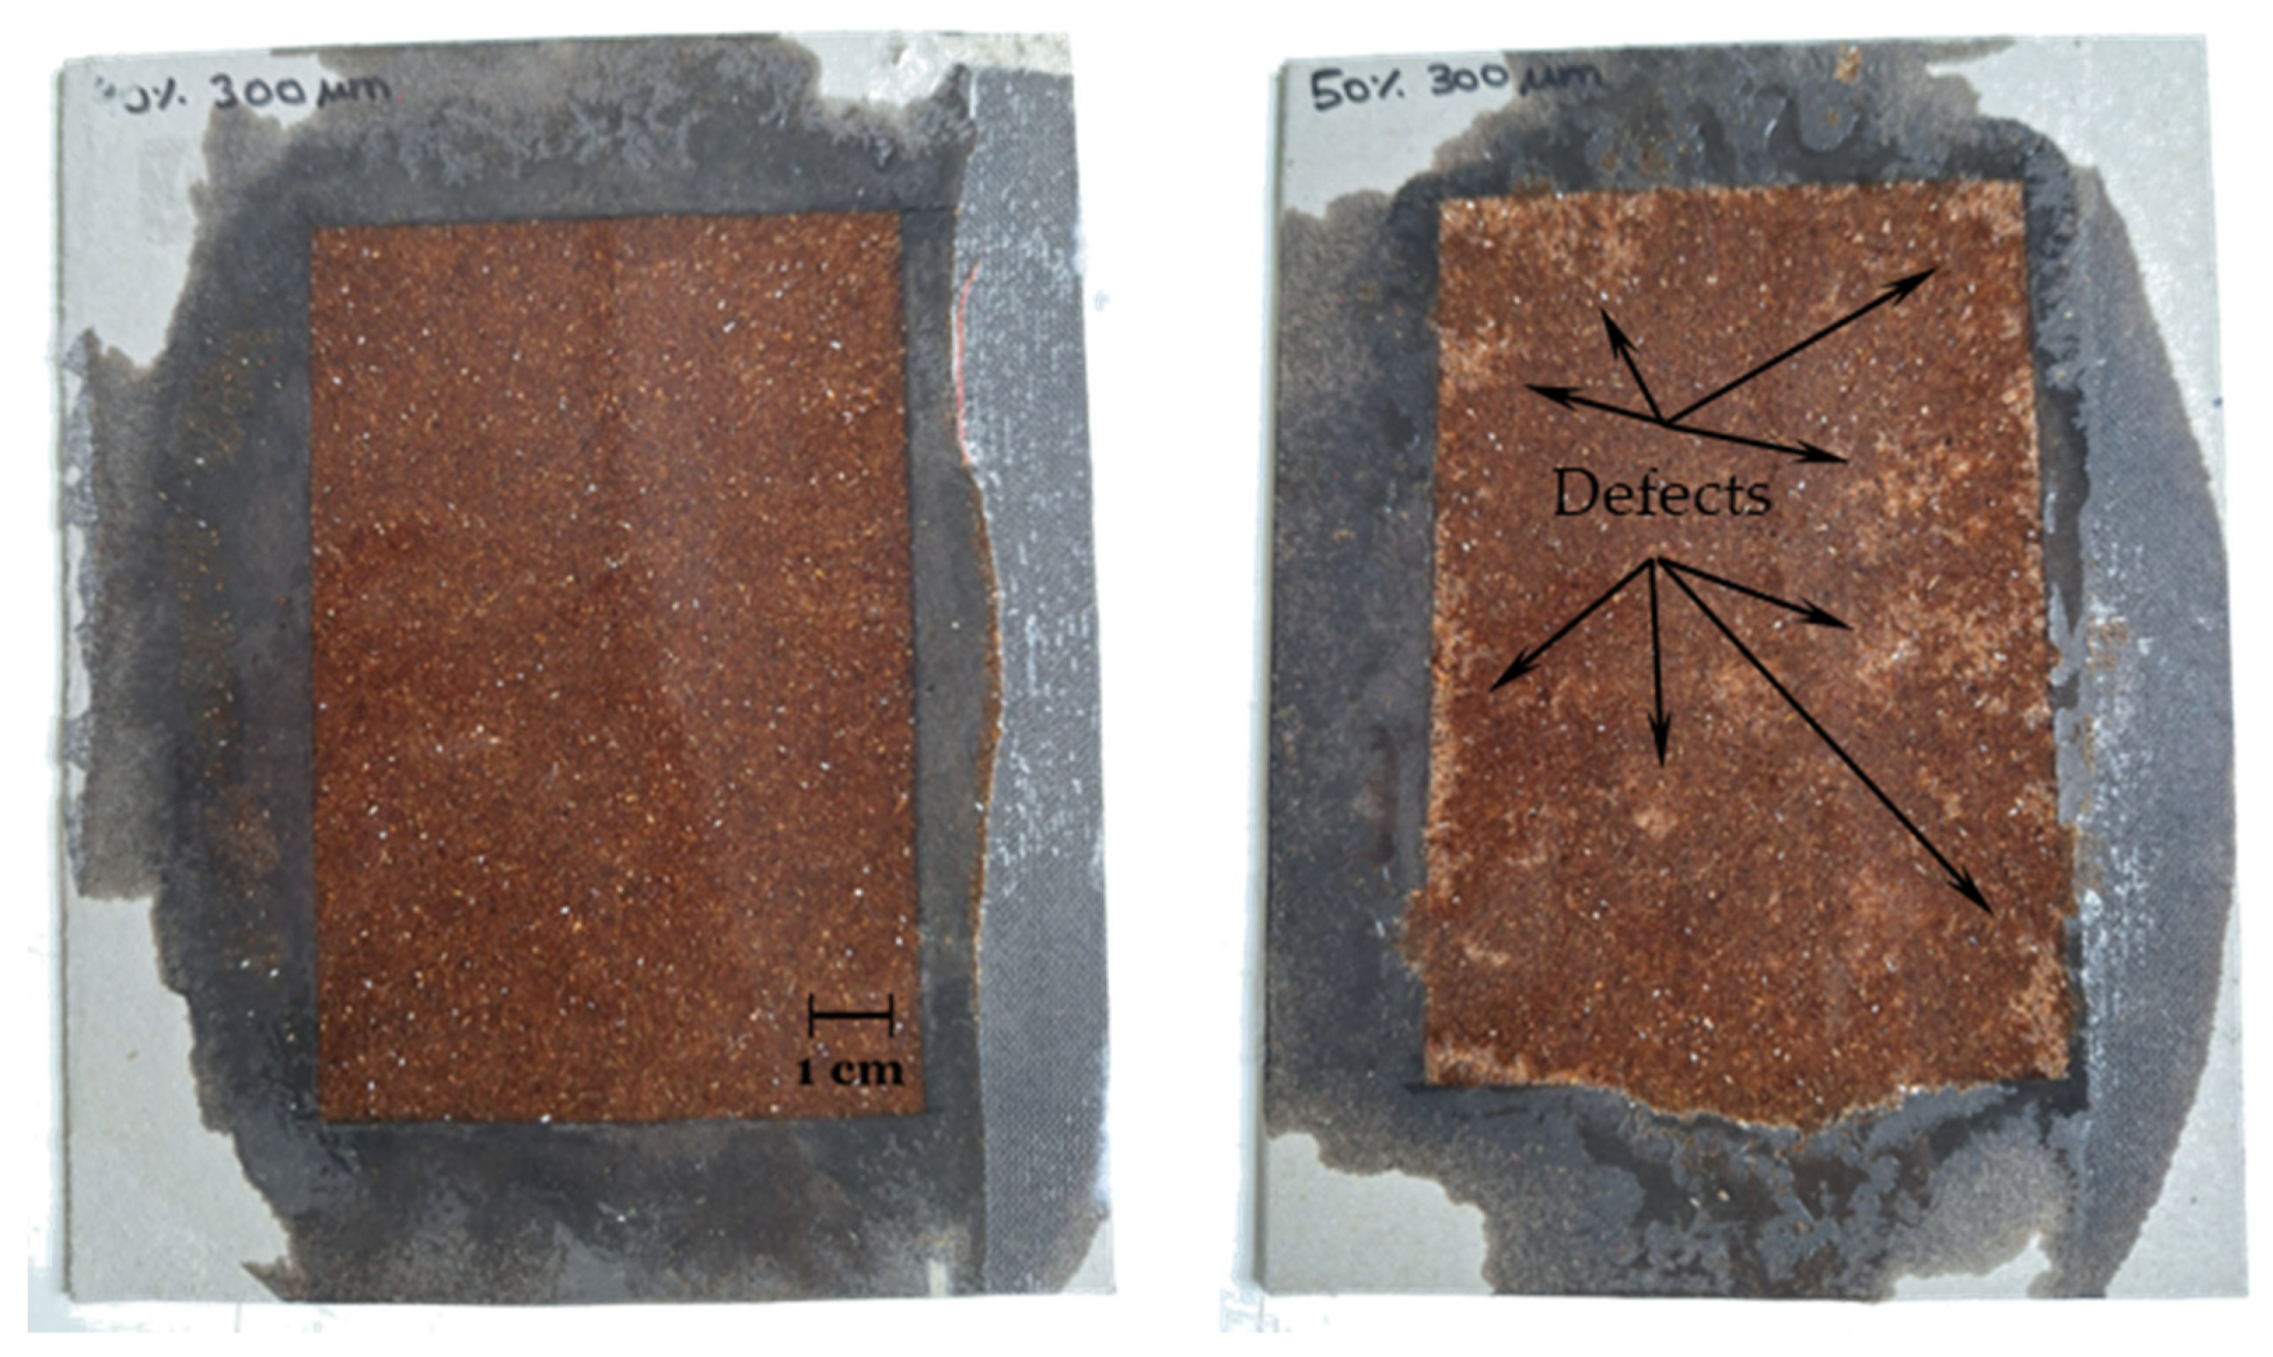
All composite cores produced were subjected to 3PB static tests to evaluate the effect of wood particle content and dimension on bending properties. Figure 3 shows two composites obtained with the same wood particle size, 0.300 mm, and different percentages, 40 wt.% and 50 wt.%. While the visual appearance of the composite with 40 wt.% is uniform and the wood particles have a homogeneous distribution, the opposite is visible in the composite with 50 wt.%. In this case, there is a noticeable non-uniform distribution and the appearance of interface defects between the wood fibers and the epoxy matrix (lighter areas), as well as a saturation of the amount of fibers, which culminates in a loss of mechanical properties.
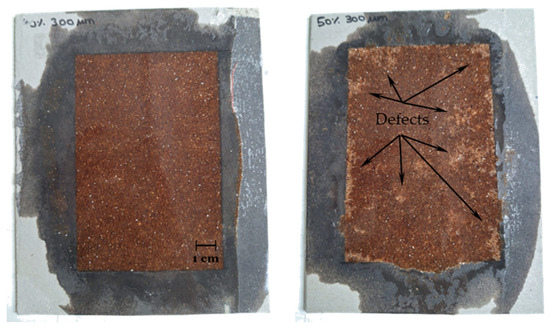
Figure 3.
Appearance of composites with 40 wt.% and 50 wt.% core with 0.300 mm wood fibers.
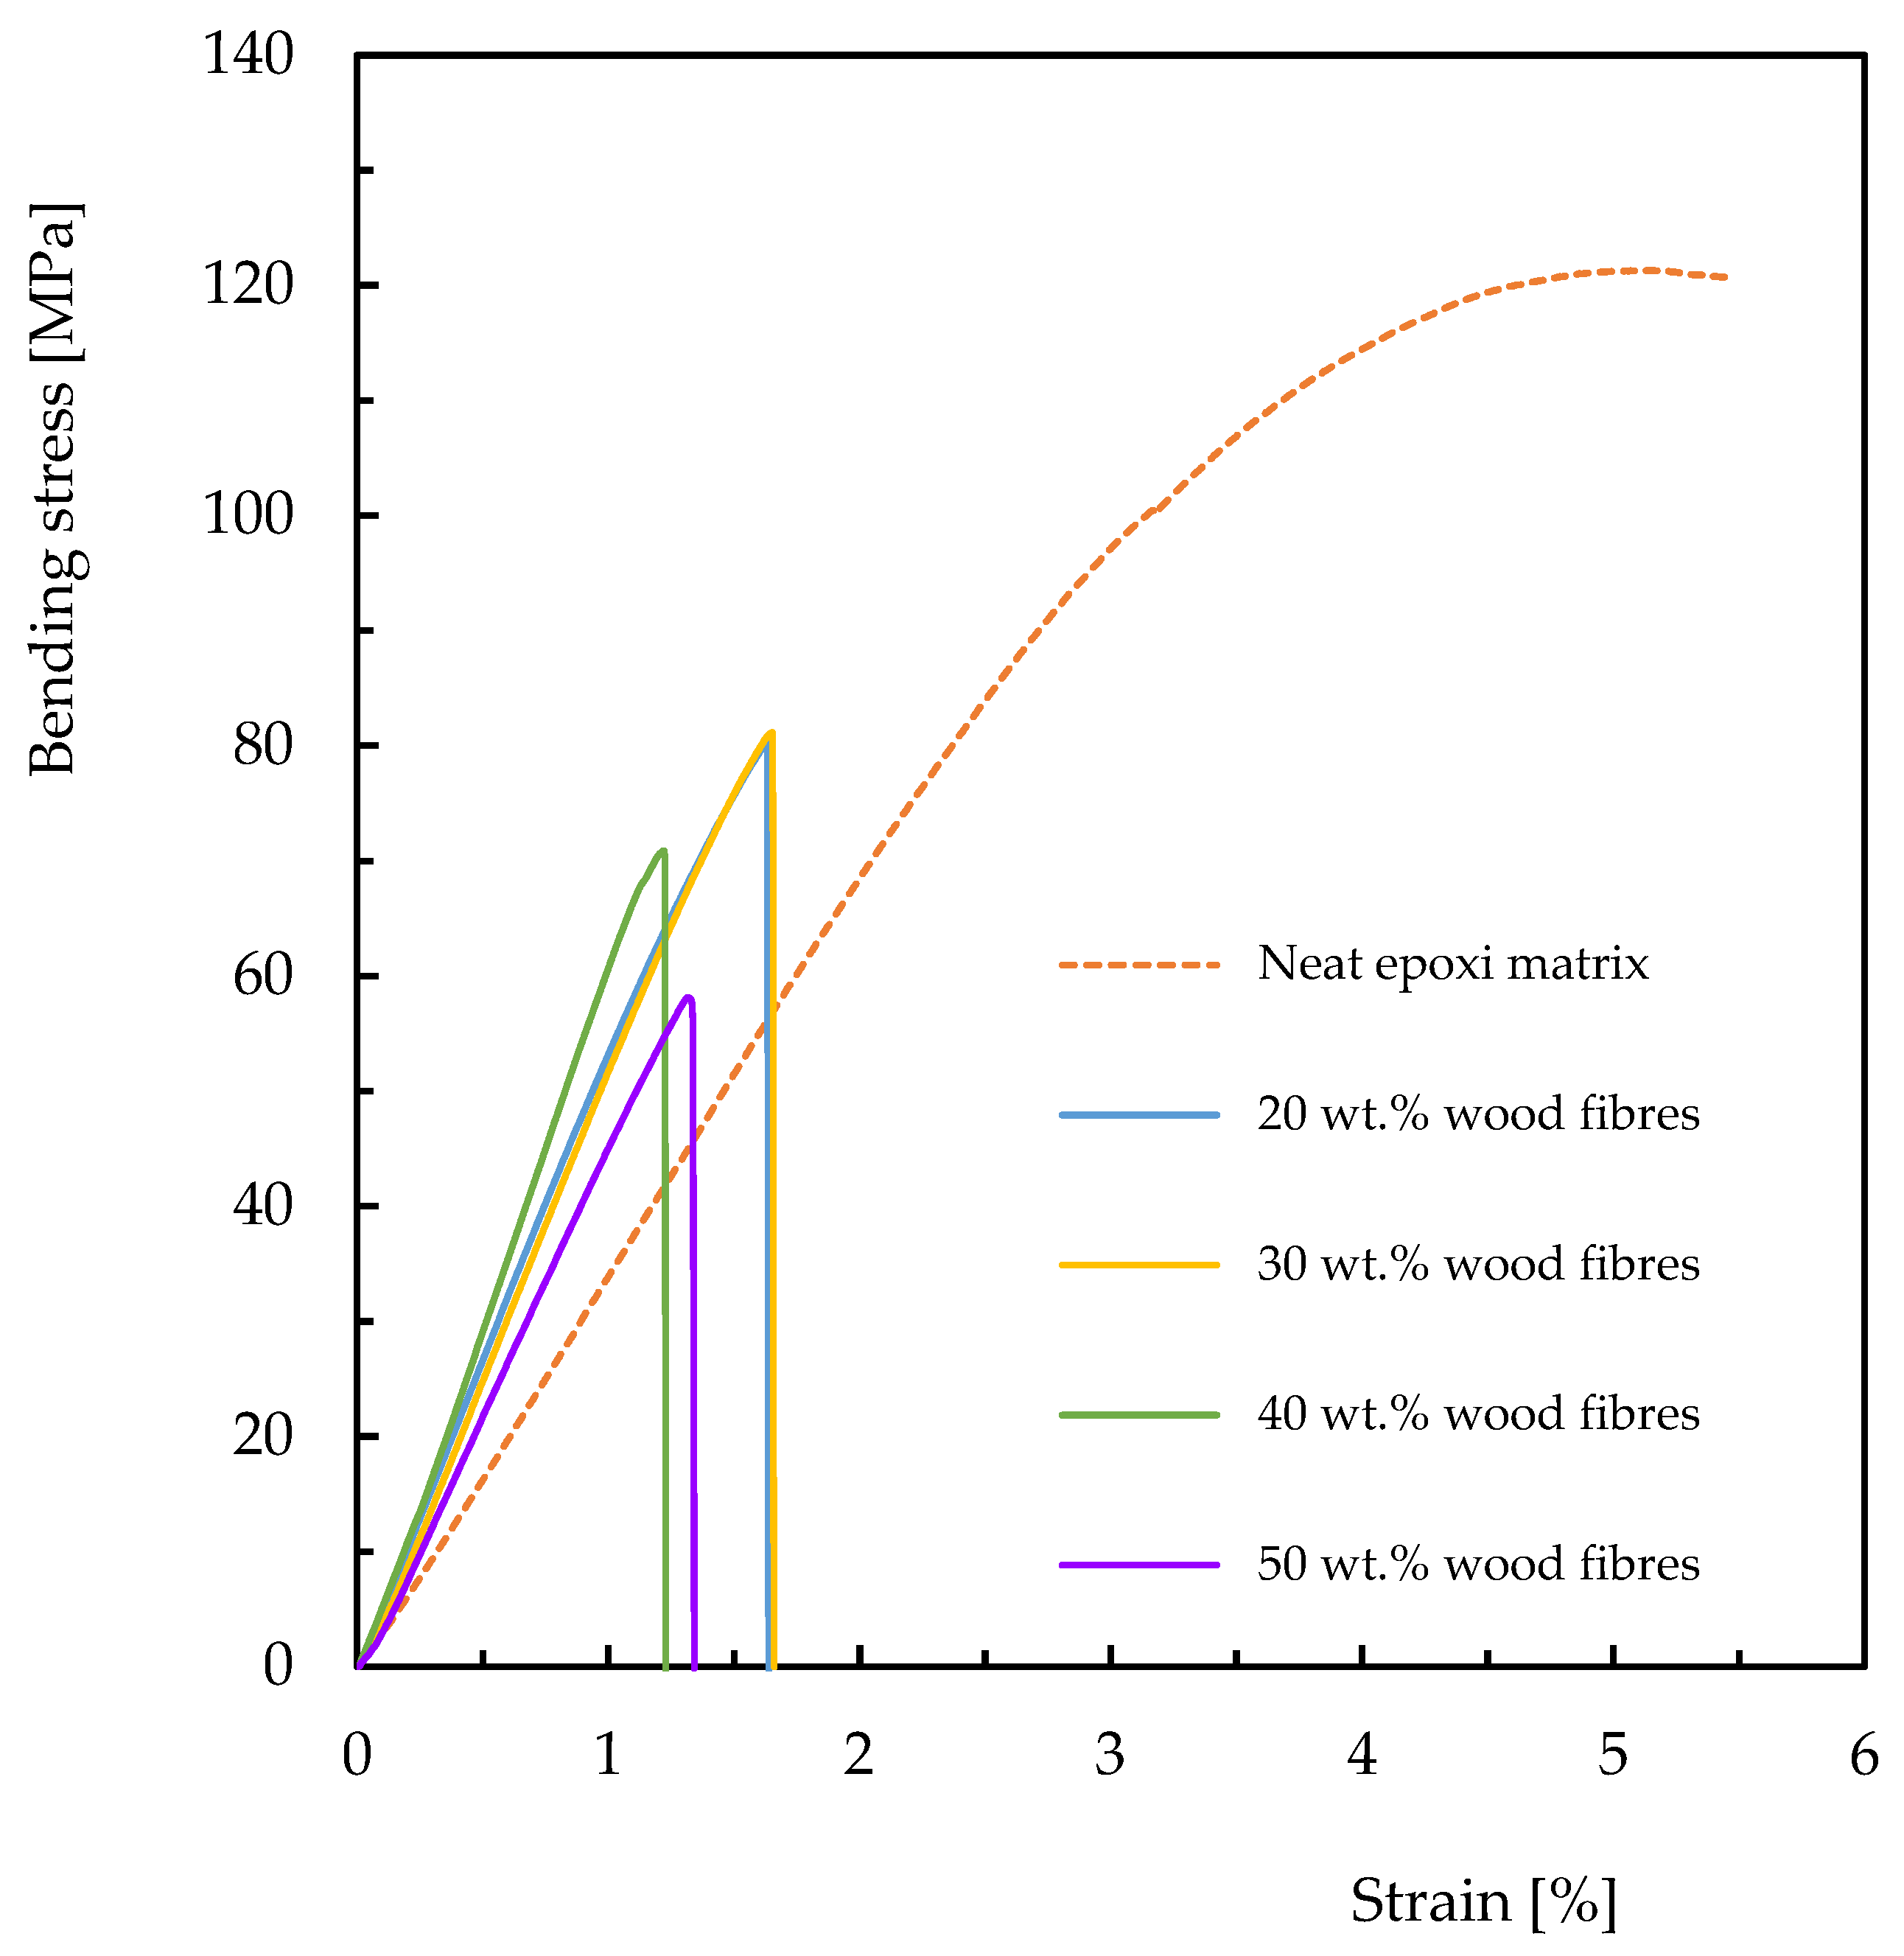
Representative bending stress–strain curves are shown in Figure 4, a comparison between the neat epoxy matrix and the composites reinforced with 20, 30, 40 and 50 wt.% of 0.300 mm wood fibers, as the samples reinforced with this particle size produce the most favorable results for the sandwich panel core.

Figure 4.
Comparison of bending stress–strain curves of neat matrix and composites with 0.300 mm wood fiber core.
For the neat epoxy matrix, there is evidence of a linear increase in bending stress with strain, followed by non-linear behavior where the maximum bending stress is reached. The bending stress decreases until imminent collapse occurs. Notably, the higher value of bending strength occurs for neat resin, which decreases with the weight content of wood particles. All curves with some wt.% of wood particles are characterized by a linear increase in bending stress with bending strain (linear elastic region) close to the maximum bending load, followed by an abrupt decrease due to the imminent collapse of the laminates [32].
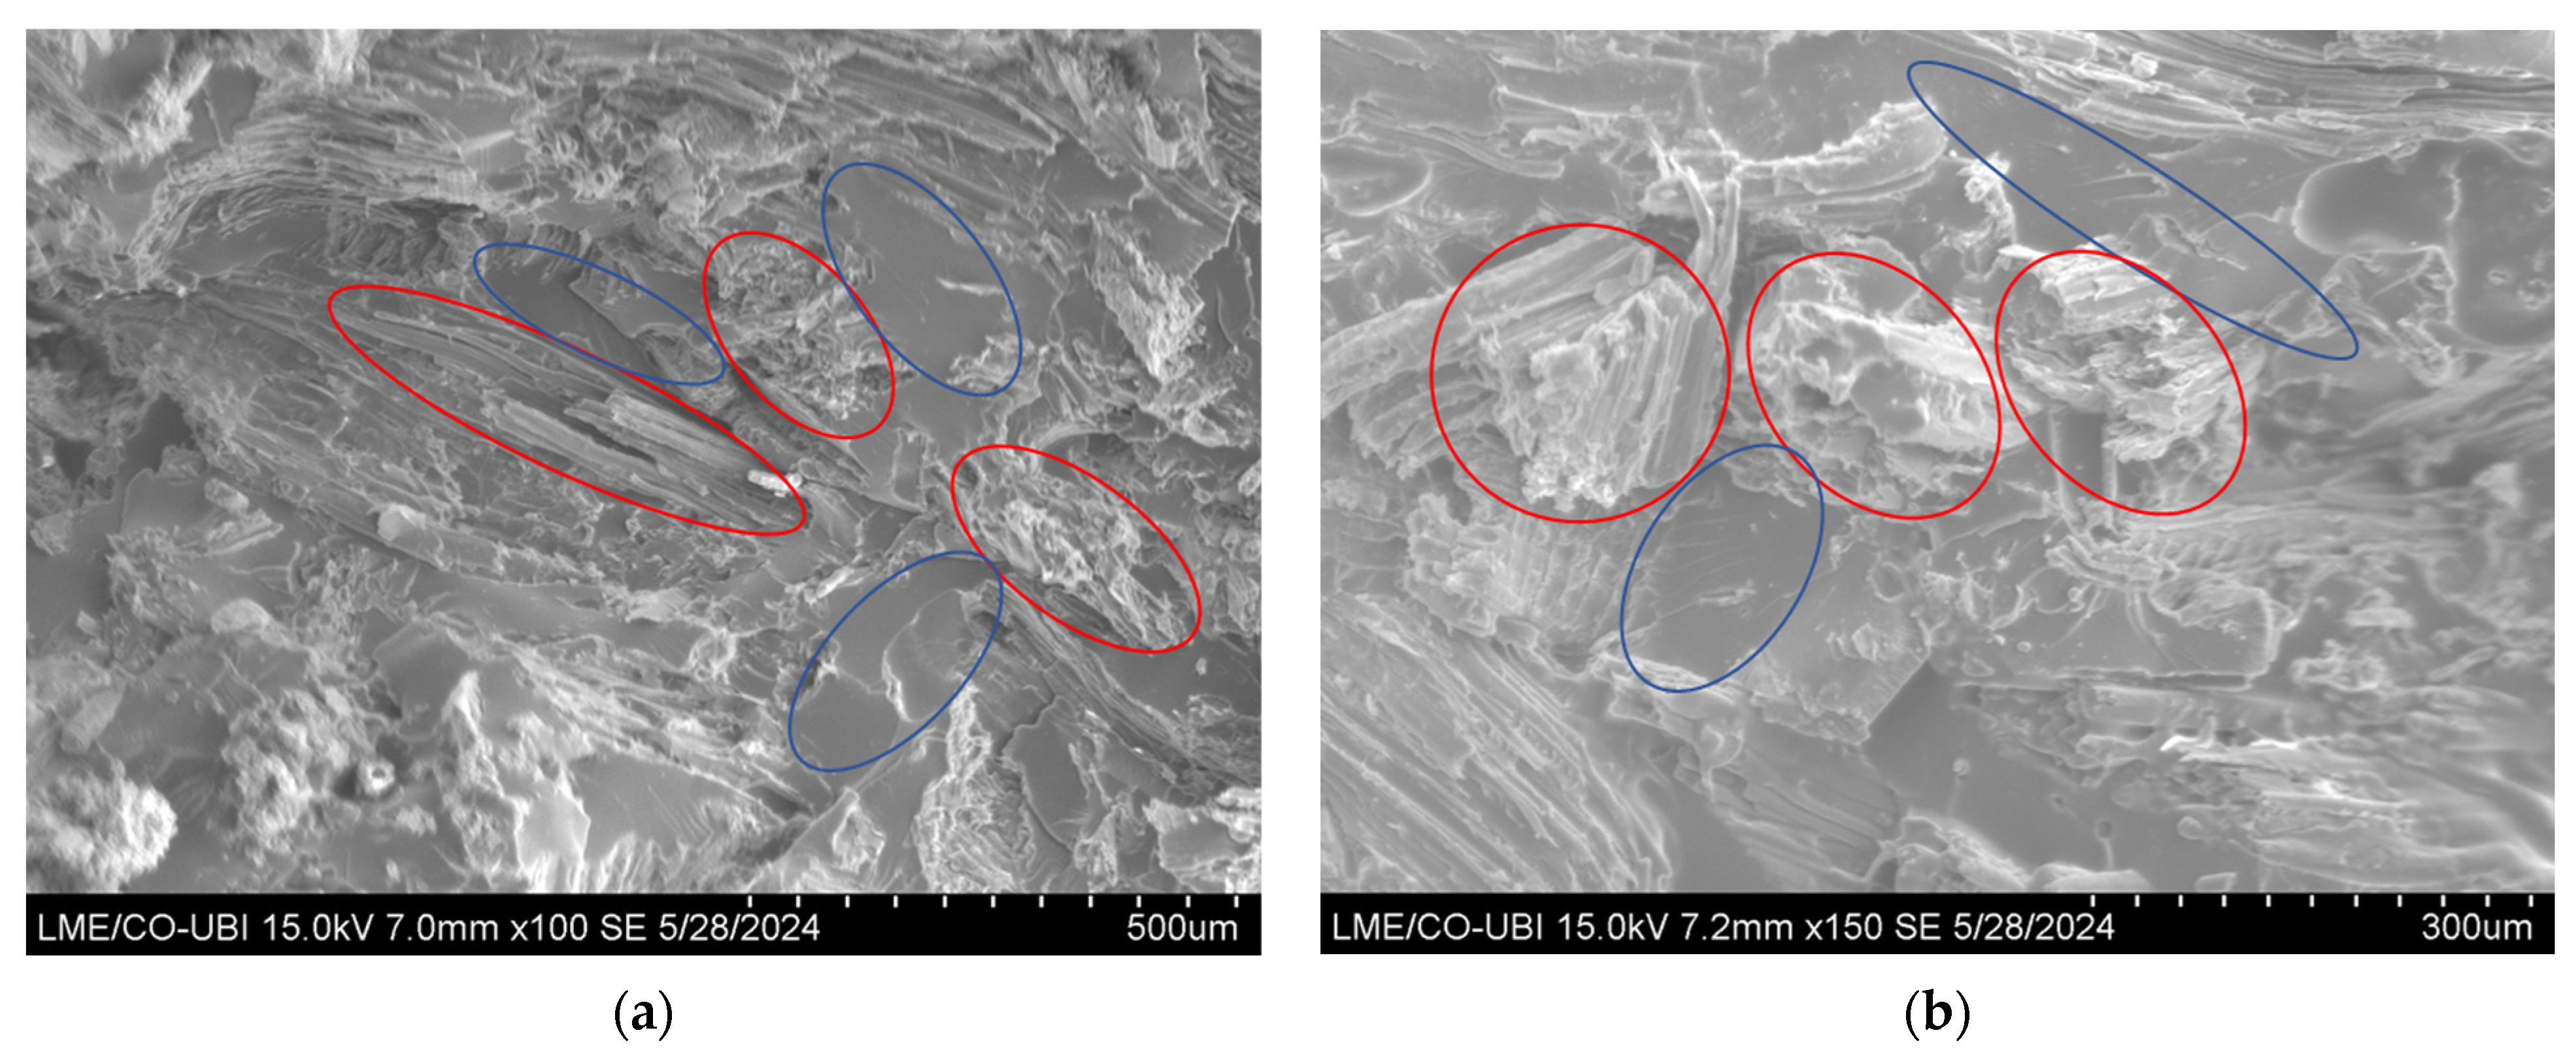
The SEM images shown in Figure 5a,b refer to the fracture area of the samples tested with the epoxy matrix containing 40 wt.% wood particles of size 0.300 mm, where the dispersion of the particles can be observed.

Figure 5.
Characterization of the core with 0.300 mm wood fibers: (a,b) SEM images of composite materials with 40 wt.% reinforcement at 100× and 150× magnification, respectively. The roughness and morphology of the wood fibers improve adhesion to the highly smooth matrix (blue marks). The red marked areas show the dispersion of the wood fibers in the epoxy matrix, suggesting good interfacial adhesion between the wood fibers and epoxy matrix, along with a uniform dispersion of the wood fibers throughout the cross-section of the samples.
Given that the strength and interfacial interactions determined the failure mode of the composite and the micromechanical deformation [33], the properties of the wood fiber epoxy composites are highly dependent on the dispersion and wt.% of wood fibers in the matrix and the interaction between the wood matrix and the epoxy matrix. The roughness and morphology of the wood fibers improve adhesion to the highly smooth matrix (blue marks). The red marked areas show the dispersion of the wood fibers in the epoxy matrix, suggesting good interfacial adhesion between the wood fibers and epoxy matrix, along with a uniform dispersion of the wood fibers throughout the cross-section of the samples.
In terms of maximum stress, the wood fiber-reinforced composites showed a reduction compared to the neat epoxy matrix, but this reduction was less pronounced in the composites with particle sizes of 0.075 mm and 0.300 mm. The results obtained show that the strength of polymer composites decreases with increasing reinforcement particle size, which is according to the bibliography [34,35]. Regarding stiffness, the results were more favorable, showing an increase in properties across for all composites compared to the neat matrix. Notably, the composites with 20 wt.% and 30 wt.% of 0.300 mm wood fibers exhibited an approximate 60% improvement in stiffness. Additionally, the strain percentage remained consistent across all wood fiber-reinforced materials.
The observation of improved bending properties with the use of larger wood fibers aligns with findings from previous studies in the literature [23].
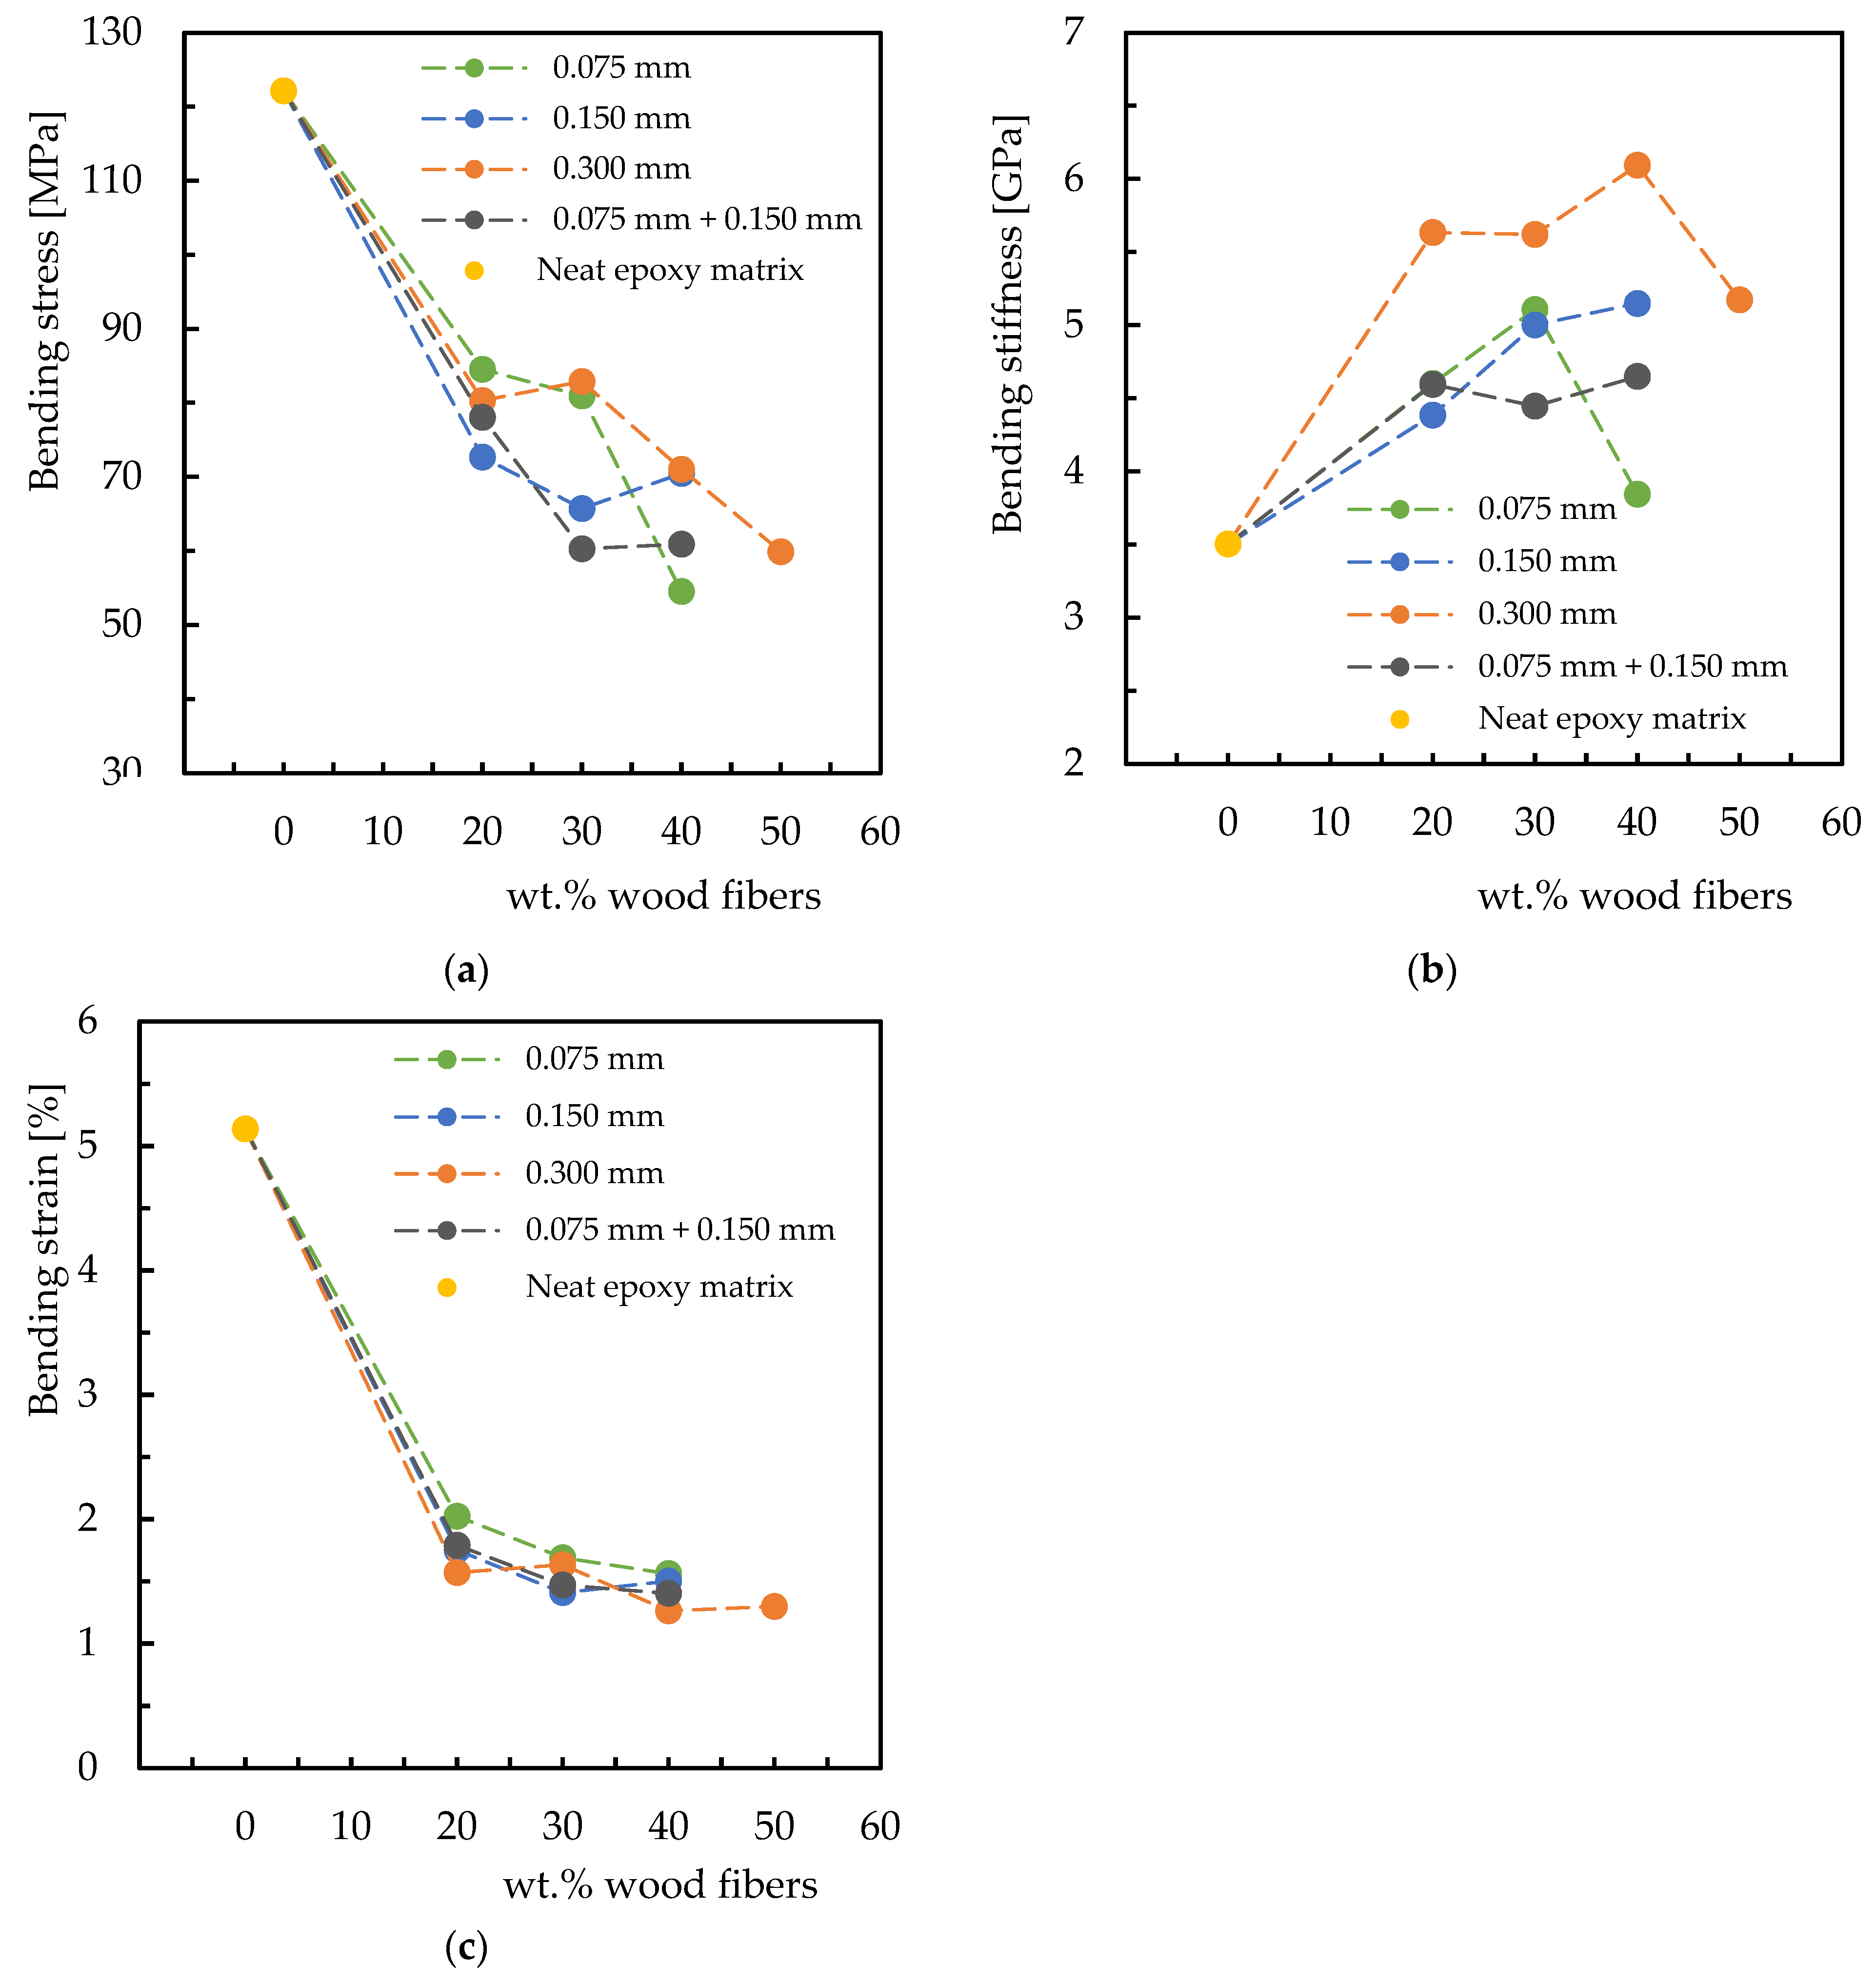
The mechanical properties—medium stress, stiffness and strain—of all the composites produced for the core of the sandwich panel were arranged in ascending order of wood fibers reinforcement percentage and are shown in Figure 6a–c, respectively.
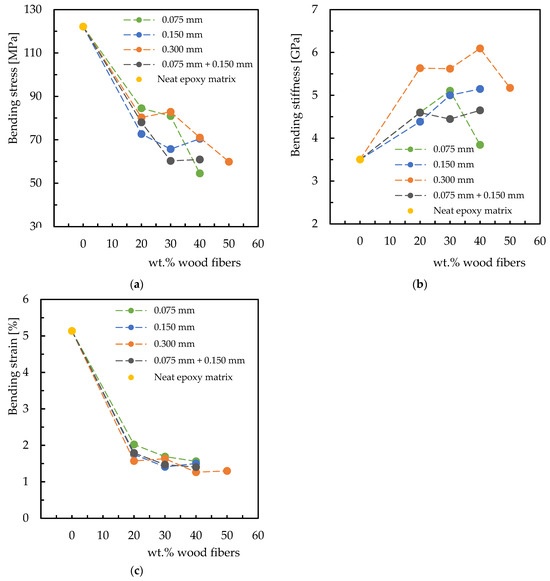
Figure 6.
Bending properties of composites: (a) bending stress; (b) bending stiffness; (c) bending strain.
The best results, particularly in stiffness, were observed with particles measuring equal to or more than 0.300 mm. Notably, the composite containing 40 wt.% of 0.300 mm wood fibers exhibited an average stiffness of 6.09 GPa, representing an approximate 74% increase compared to the neat epoxy resin. However, the composite with 50 wt.% of the same reinforcement showed lower performance across all three mechanical properties compared to the 40 wt.% composite. Studies show that agglomerated wood fibers can behave as isolated large particles [36]. This behavior occurs when wood fiber agglomerates due to insufficient dispersion during processing or the natural tendencies of the material. The presence of large agglomerates can create zones of stress concentration, affecting load transfer efficiency and failure mechanisms [37].
Although increasing the wood particle content is generally expected to enhance the stiffness of composites due to higher filler loading, the 50 wt.% wood fiber specimen showed inferior mechanical performance compared to the 40 wt.% counterpart. This can be attributed to the following factors. (i) Saturation of the matrix: At high filler content, there is insufficient matrix material to properly wet and bind the fibers, leading to weak interfacial bonding. (ii) Agglomeration: Excess particles tend to cluster together, forming agglomerates that act as stress concentrators and disrupt stress transfer throughout the matrix. (iii) Void formation and poor dispersion: Non-uniform distribution can lead to internal voids and defects that reduce mechanical integrity. (iv) Reduced toughness: The composite becomes more brittle at higher filler loads, making it more susceptible to crack initiation and propagation under stress.
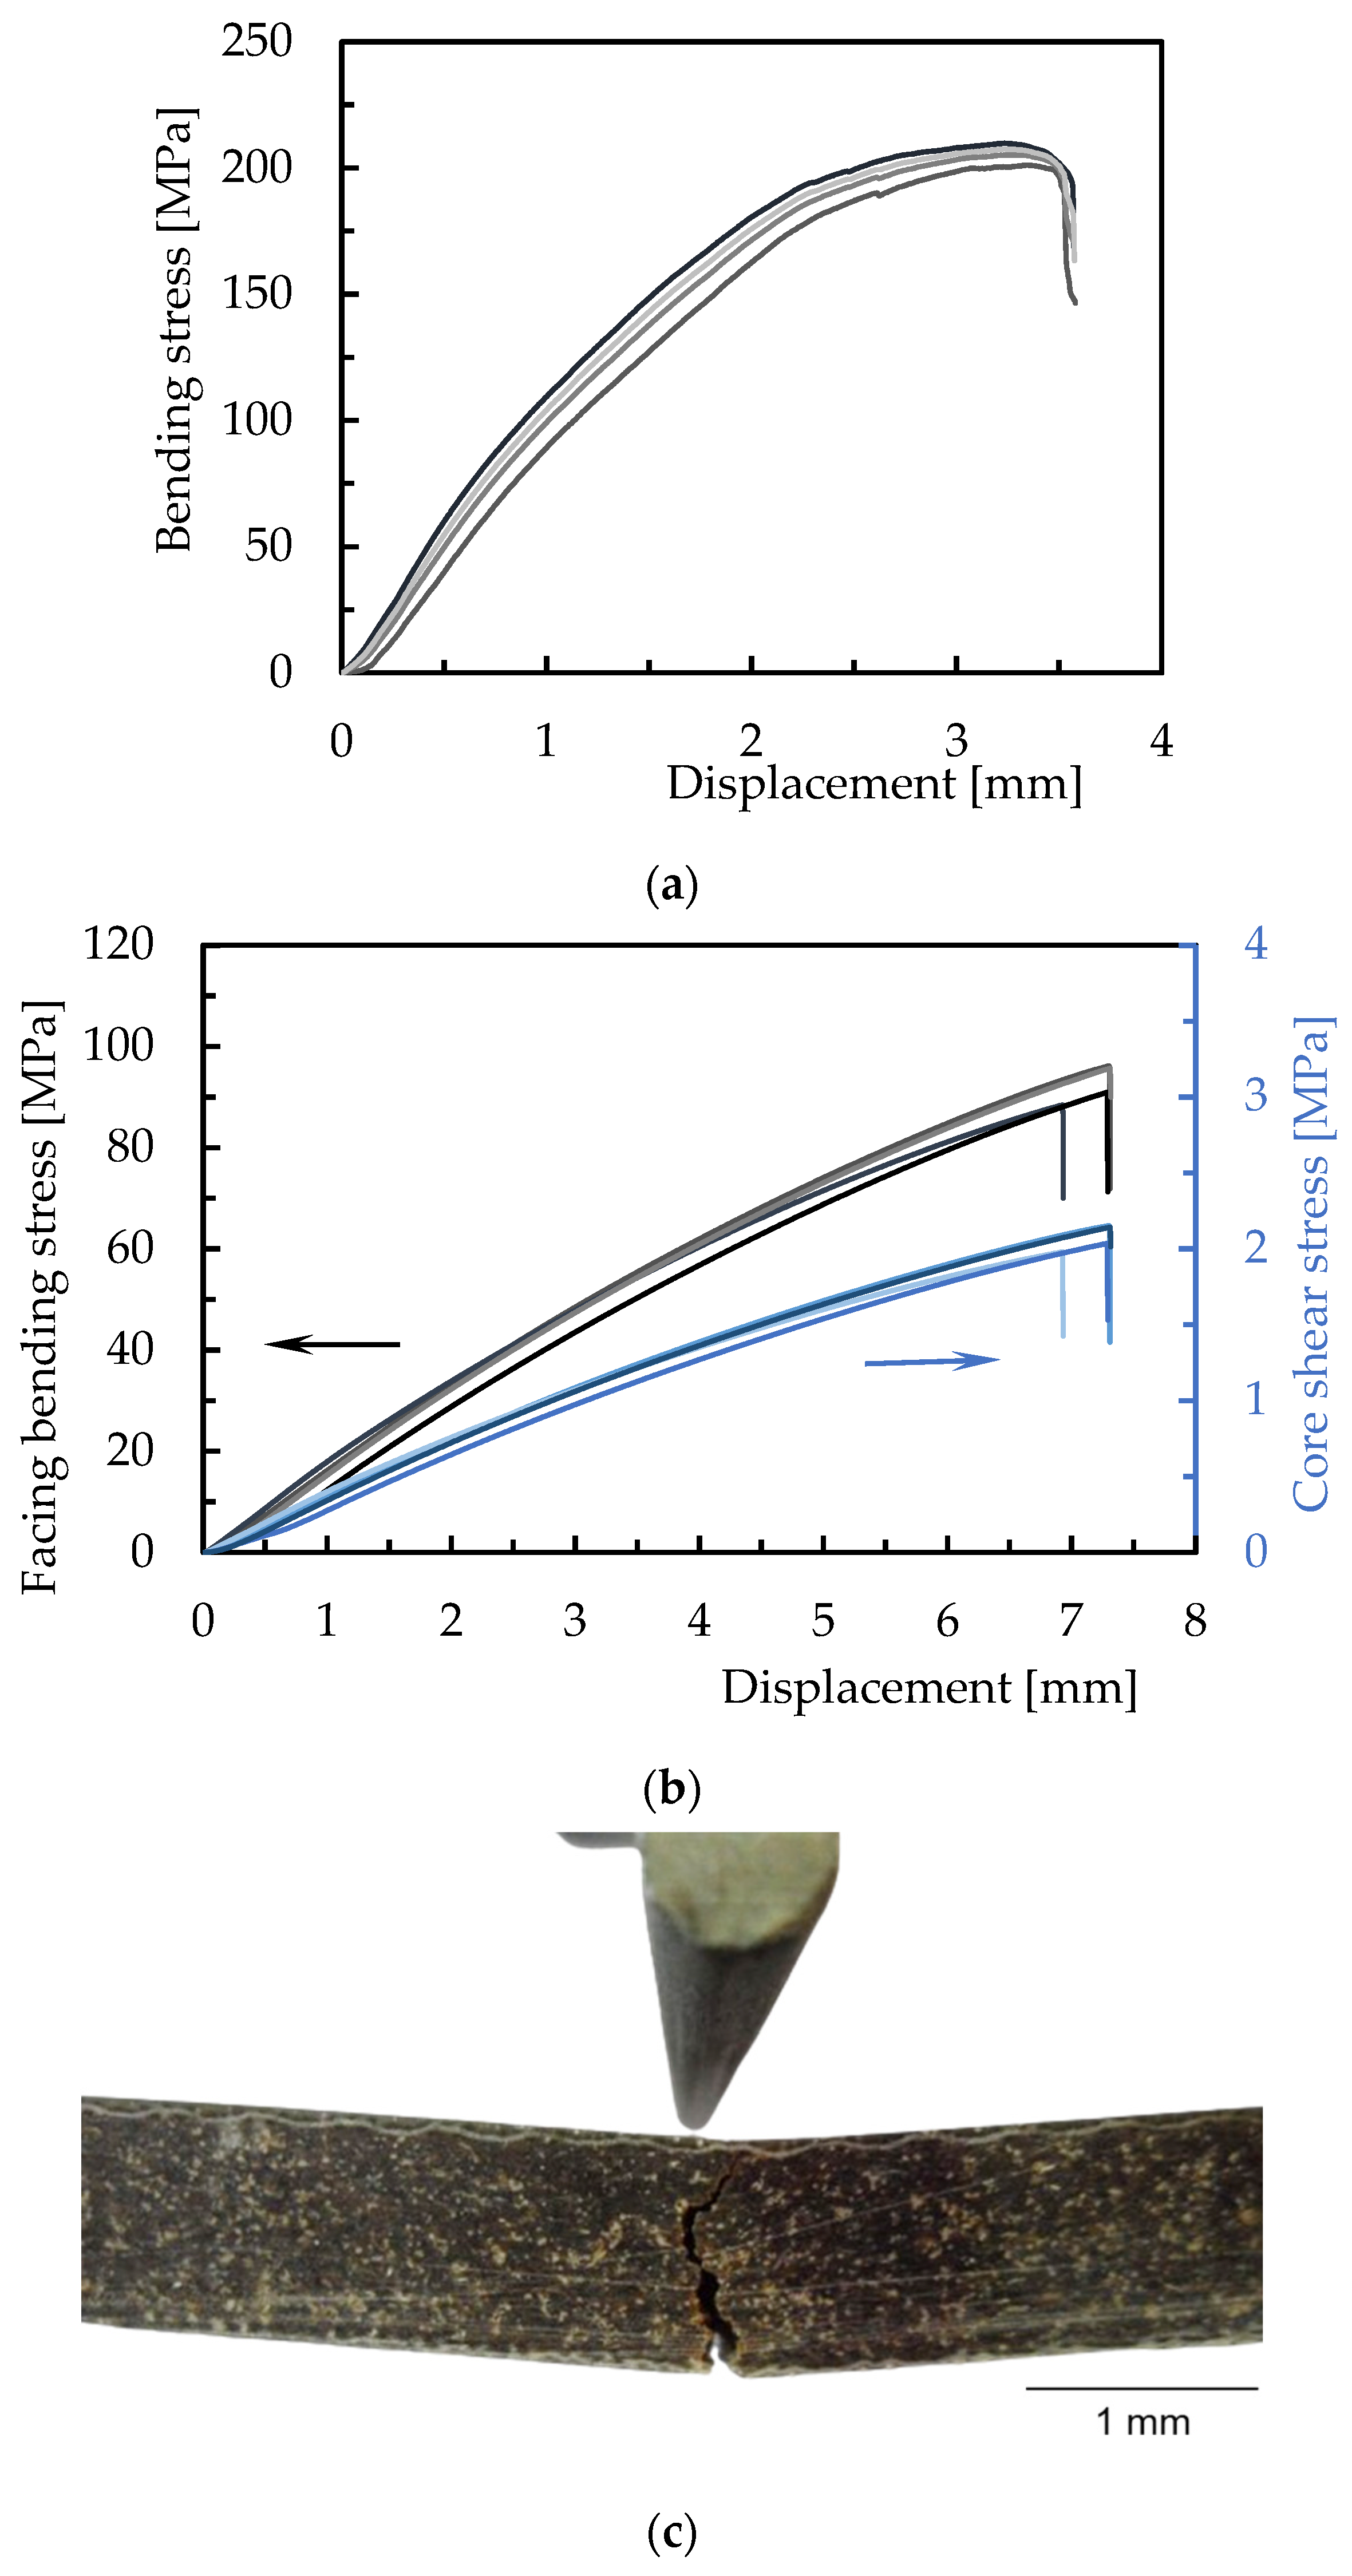
In order to evaluate the static properties of the wood and flax sandwich panel, 3PB static tests were conducted. Figure 7a shows the bending stress–displacement curve for the insulated facing, which shows a linear increase in bending stress with displacement (elastic region) up to approximately 100 MPa. This is followed by a transition to non-linear behavior until the maximum stress of 193.58 ± 14.83 MPa is reached, at which point the facing material fails, typical behavior of flax fiber laminates [38].

Figure 7.
Sandwich panel, representative curves: (a) bending stress vs. displacement for the isolated face in 3PB static tests; (b) face bending stress and core shear stress vs. displacement for the sandwich in 3PB static tests; (c) typical damage seen in three-point bending tests on the sandwich.
Figure 7b shows the bending stress–displacement curves for the face (in orange) and core shear stress–displacement curves (in blue) of the sandwich panel. Both the face bending stress and core shear stress exhibit nearly linear behavior until reaching the maximum stress of 92.79 ± 4.32 MPa. After this peak, both stresses decline sharply, indicating the failure of the sandwich composites. This behavior is consistent with the literature on wood core sandwich panels [39].
In conclusion, the selection of specific particle sizes and weight percentages is critical in composite manufacturing. These factors directly influence the final density, strength and integrity of the material by affecting how the particles are packed together and the quality of the interface between the reinforcement and the matrix [40,41,42].
The study’s choice of a core with 40 wt.% of 0.300 mm wood particles was based on a series of preliminary tests designed to find the optimal balance between maximizing the use of waste material and achieving superior mechanical properties.
Composites reinforced with the larger 0.300 mm particles exhibited more favorable results, particularly in terms of stiffness, compared to smaller particle sizes. Increasing the wood content enhanced stiffness up to a limit. The composite with 40 wt.% of 0.300 mm fibers yielded the highest stiffness, showing a 74% increase compared to the neat epoxy resin. A higher concentration of 50 wt.% was tested but resulted in a decrease in mechanical performance. This was attributed to poor particle distribution and interface defects, highlighting that 40 wt.% was the optimal content for this system.
It can be inferred that the flax fiber facing enhances the bending strength of the sandwich panel. The modulus of rigidity of the facing (8.82 ± 0.65 GPa) is higher than that of the wood fiber core (6.09 ± 0.62 GPa), leading to improved bending stress. This increase in strength aligns with findings reported in the literature [21]. Figure 7c shows the typical damage mechanism observed in all the sandwich specimens tested in bending, with notorious fractures of the fibers under tension, accompanied by crack propagation through the core with matrix fracture.
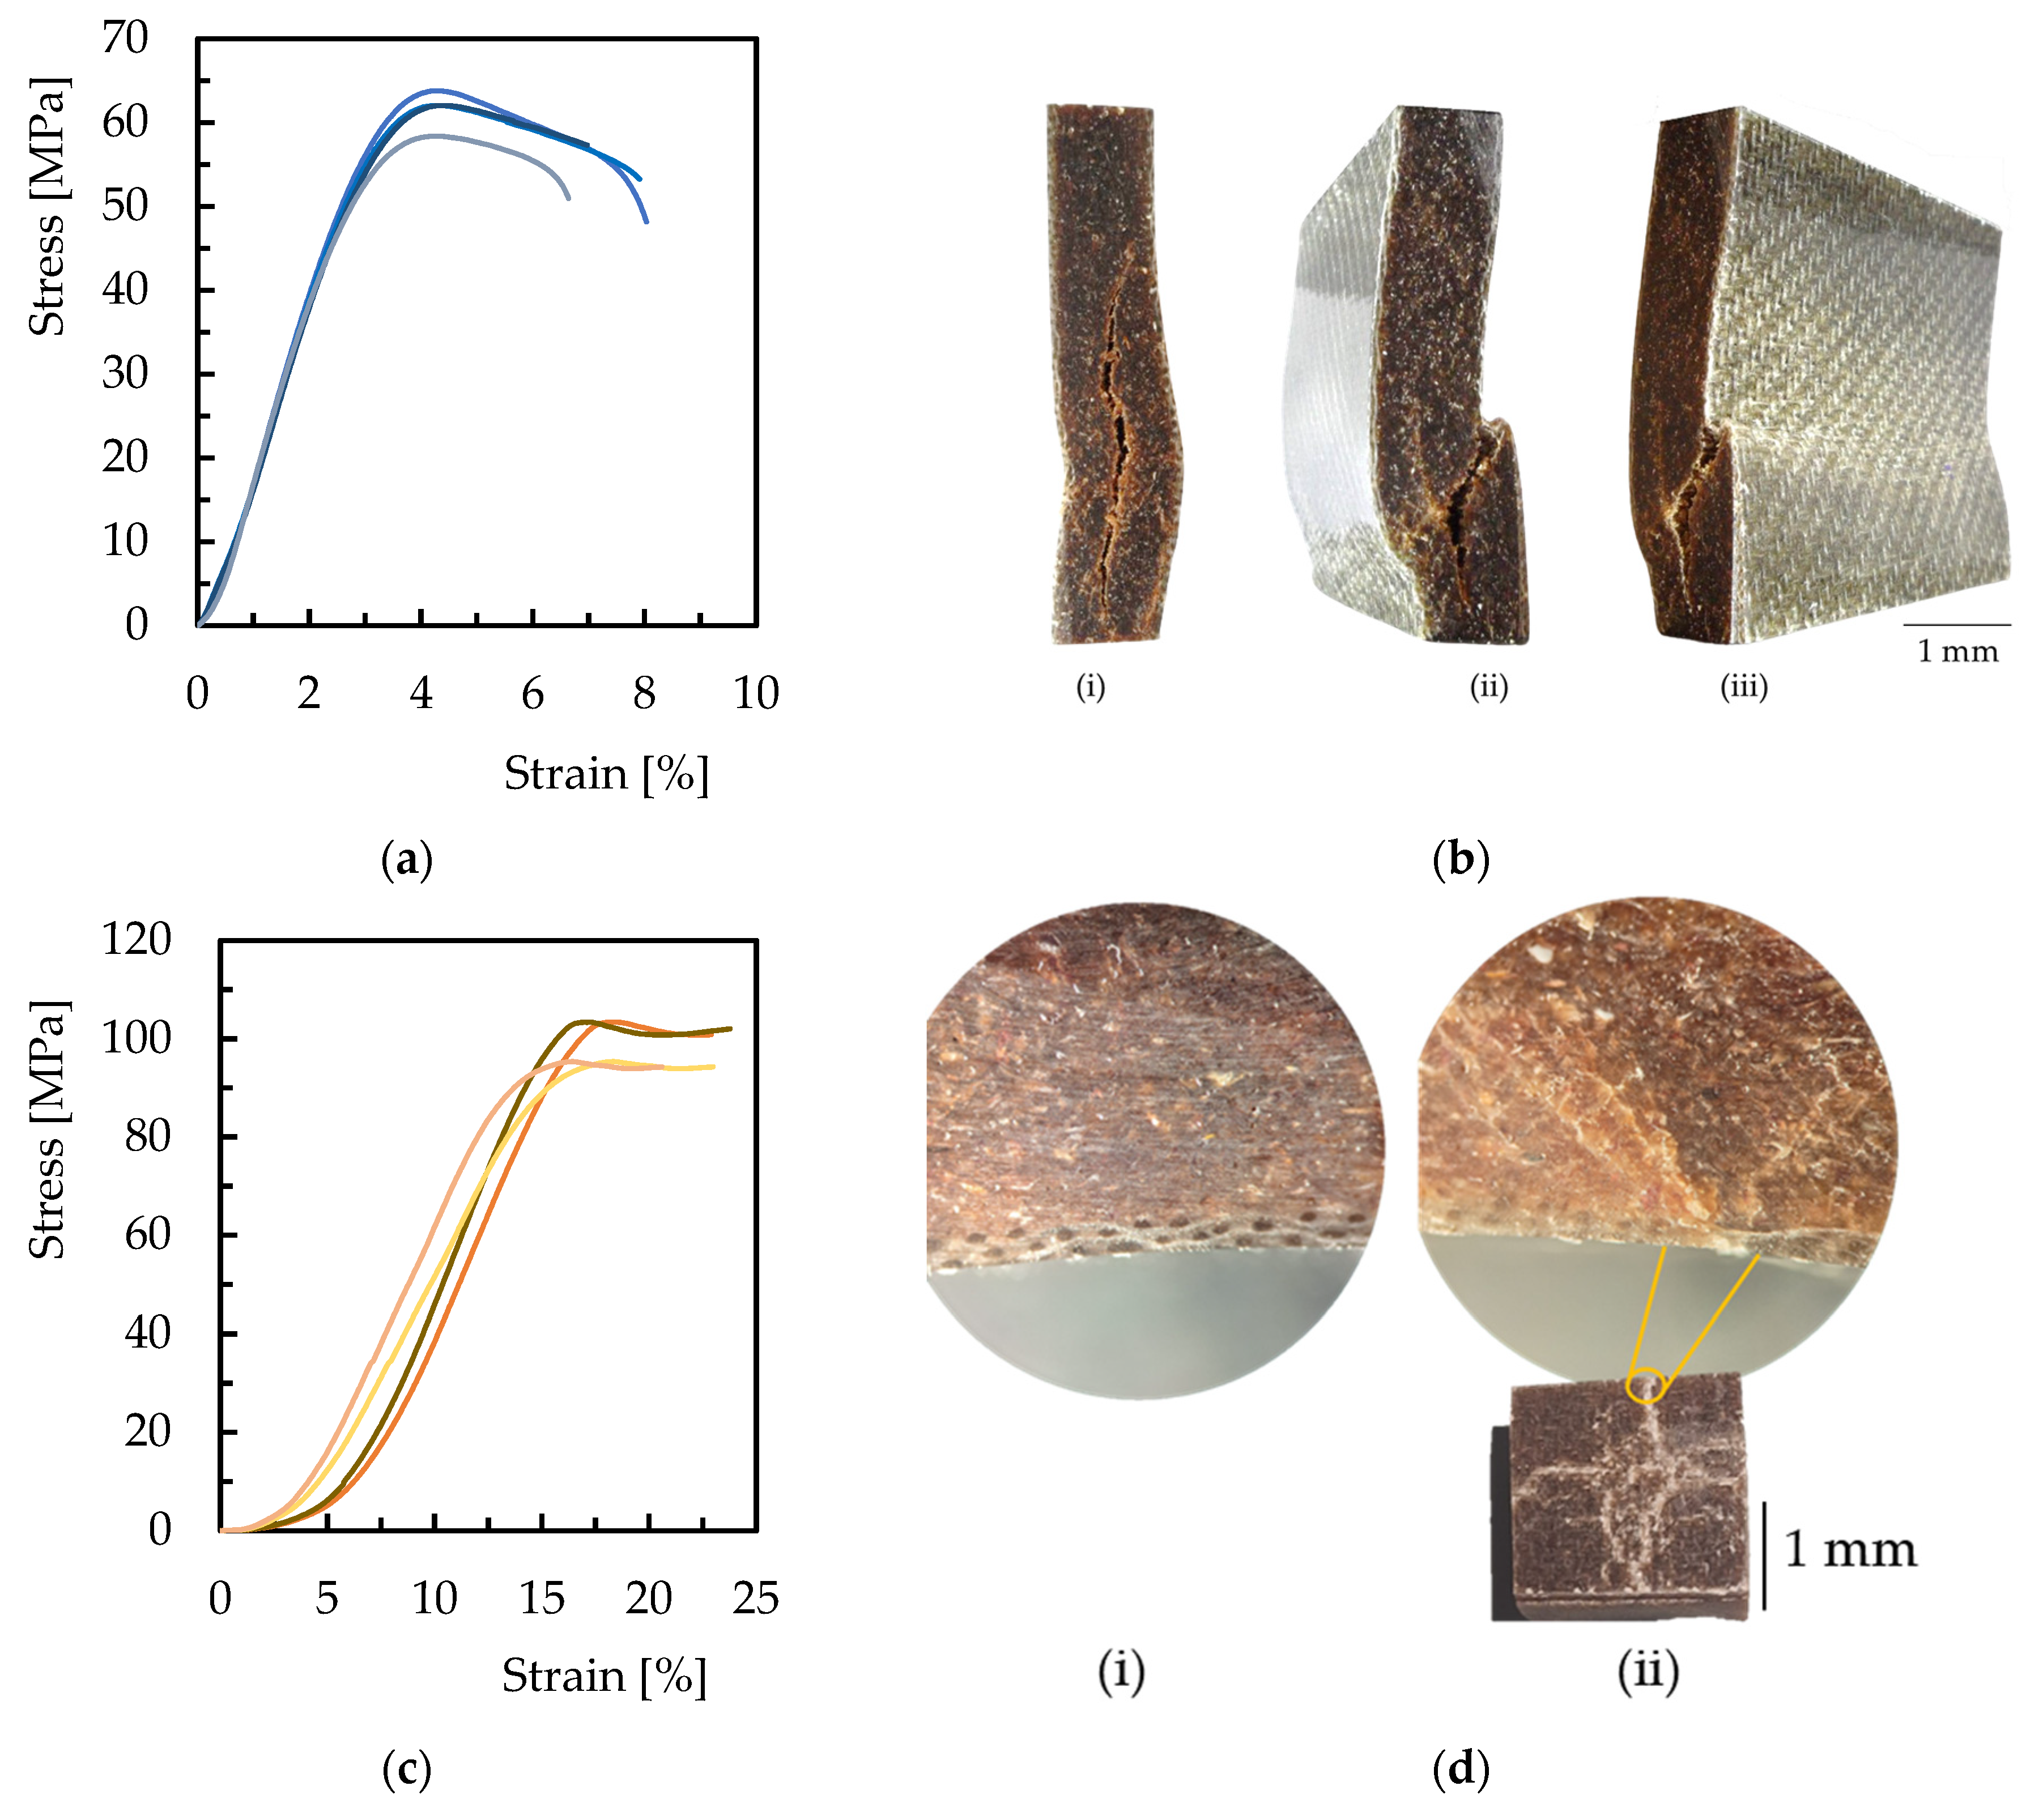
The edgewise and flatwise compression tests, shown in Figure 8a,c, respectively, were conducted on the sandwich panel to determine its ability to endure a compressive load in the vertical and horizontal position, as well as to analyze the damage resulting from these tests, shown in Figure 8b,d, respectively.

Figure 8.
Edgewise compression tests: (a) stress vs. strain curves; (b) different types of damage ((i) compression fracture when the core is cut; (ii) “shear crimping” of the skin and compression failure of the core; (iii) crushing of the skin and failure of the core). Flatwise compression tests: (c) stress vs. strain curves; (d) representative specimen ((i) before the test, seen under the microscope; (ii) after the test, seen with the naked eye and under the microscope).
In order to evaluate the reinforcing effect of flax fibers, the mechanical properties of the sandwich panels were compared both with and without the addition of fiber layers. The neat epoxy/wood core composite (without flax) and the full sandwich structure (with double-layer flax facings) were tested under identical conditions.
The results showed a clear improvement with the addition of flax fibers. Bending strength increased significantly, rising from around 61 MPa for the core-only composite to 193.58 ± 14.83 MPa for the fiber-reinforced sandwich panel. Bending stiffness also increased, with the flax fiber facing showing a modulus of 8.82 ± 0.65 GPa compared to 6.09 ± 0.62 GPa for the wood-filled core. These results confirm that flax fiber layers act as structural reinforcements, improving bending performance by providing surfaces with a high modulus and high strength that resist deformation and crack propagation.
This comparison demonstrates the synergistic effect of combining a stiff, sustainable core with natural fiber reinforcement to create a bio-composite structure with the mechanical properties required for load-bearing applications.
Figure 8a shows the curves illustrating the behavior of the sandwich panel during the edgewise compression tests, showing the strain as a function of the increase in stress. The stress–strain curve shows that the edgewise compressive strength of a composite is predominantly governed by the skin rather than the core, since the skin contributes most of the resistance during edgewise compression. The curve exhibits a linear relationship between stress and strain up to approximately 4% strain, indicating elastic behavior. Beyond this point, stress increases at minimal strain increments as the applied load intensifies. A sharp drop in the curve corresponds to the failure of the skin, which is subsequently followed by core shear failure in the test specimens. This sequence highlights the critical role of skin integrity in maintaining the compressive performance of the composite [43]. It is noteworthy that the average edgewise compressive strength of the sandwich panel is 61.39 ± 2.75 MPa, corresponding to a strain of 4.31 ± 0.04%.
The typical damage patterns and curve profiles observed are consistent with a previous study employing the same cladding but utilizing a different core material, cork. However, the sandwich panel developed in this work, which incorporates a wood core, exhibits significantly higher edgewise compressive strength—approximately four times greater than that of the panel with a cork core [43]. This superior performance can be attributed to the following factors. (i) The higher intrinsic strength of wood particles: Unlike cork, which has a cellular, elastic structure optimized for energy absorption rather than load-bearing, wood fibers (particularly in particulate form) offer higher stiffness and strength due to their denser lignocellulosic composition [44]. (ii) Improved stress distribution in the matrix: The irregular shapes and sizes of the wood particles enable more efficient mechanical interlocking with the epoxy matrix, resulting in better load transfer and fewer stress concentrations [45]. (iii) Tailorable reinforcement: The size and content of the wood fibers can be optimized (e.g., 40 wt.% at 0.300 mm), enabling a denser, stiffer core that surpasses the relatively fixed cellular structure of cork [46]. (iv) Less compressibility: Cork’s compressibility, while useful in damping applications, results in lower resistance to compressive loads. In contrast, the stiffer composite core resists deformation more effectively under edgewise loading [44].
Regarding the flatwise compression tests, the representative curve shown in Figure 8d illustrates the behavior of the sandwich panel, depicting strain as a function of increasing stress. The graph reveals an initial phase where stress increases gradually with strain, up to approximately 5%. This phase, characterized by a gentle slope, suggests that the sandwich panel is adjusting to the applied compression. Following this settling-in period, the curve displays a steeper slope, where stress increases linearly with strain. This linear behavior persists until the curve reaches a peak, indicating the panel’s maximum horizontal compressive capacity. Beyond this point, the curve demonstrates a reduction in stress with increasing strain, signifying that the panel has begun to fail or experience irreversible strain.
In terms of damage, internal cracks in the core can be seen in the transverse section of the sample, indicating a point of fragility, shown in Figure 8d. These cracks propagated along the skin by breaking the fiber, branching from the center to the ends. Again, too, in this characterization, the resistance to flatwise compression is determined by the properties of the skin rather than the core, as the skin provides the greatest resistance to flatwise compression. In quantitative terms, the average flatwise compressive strength of the sandwich panel is 96.66 ± 4.42 MPa, corresponding to a strain of 18.36 ± 5.71%.
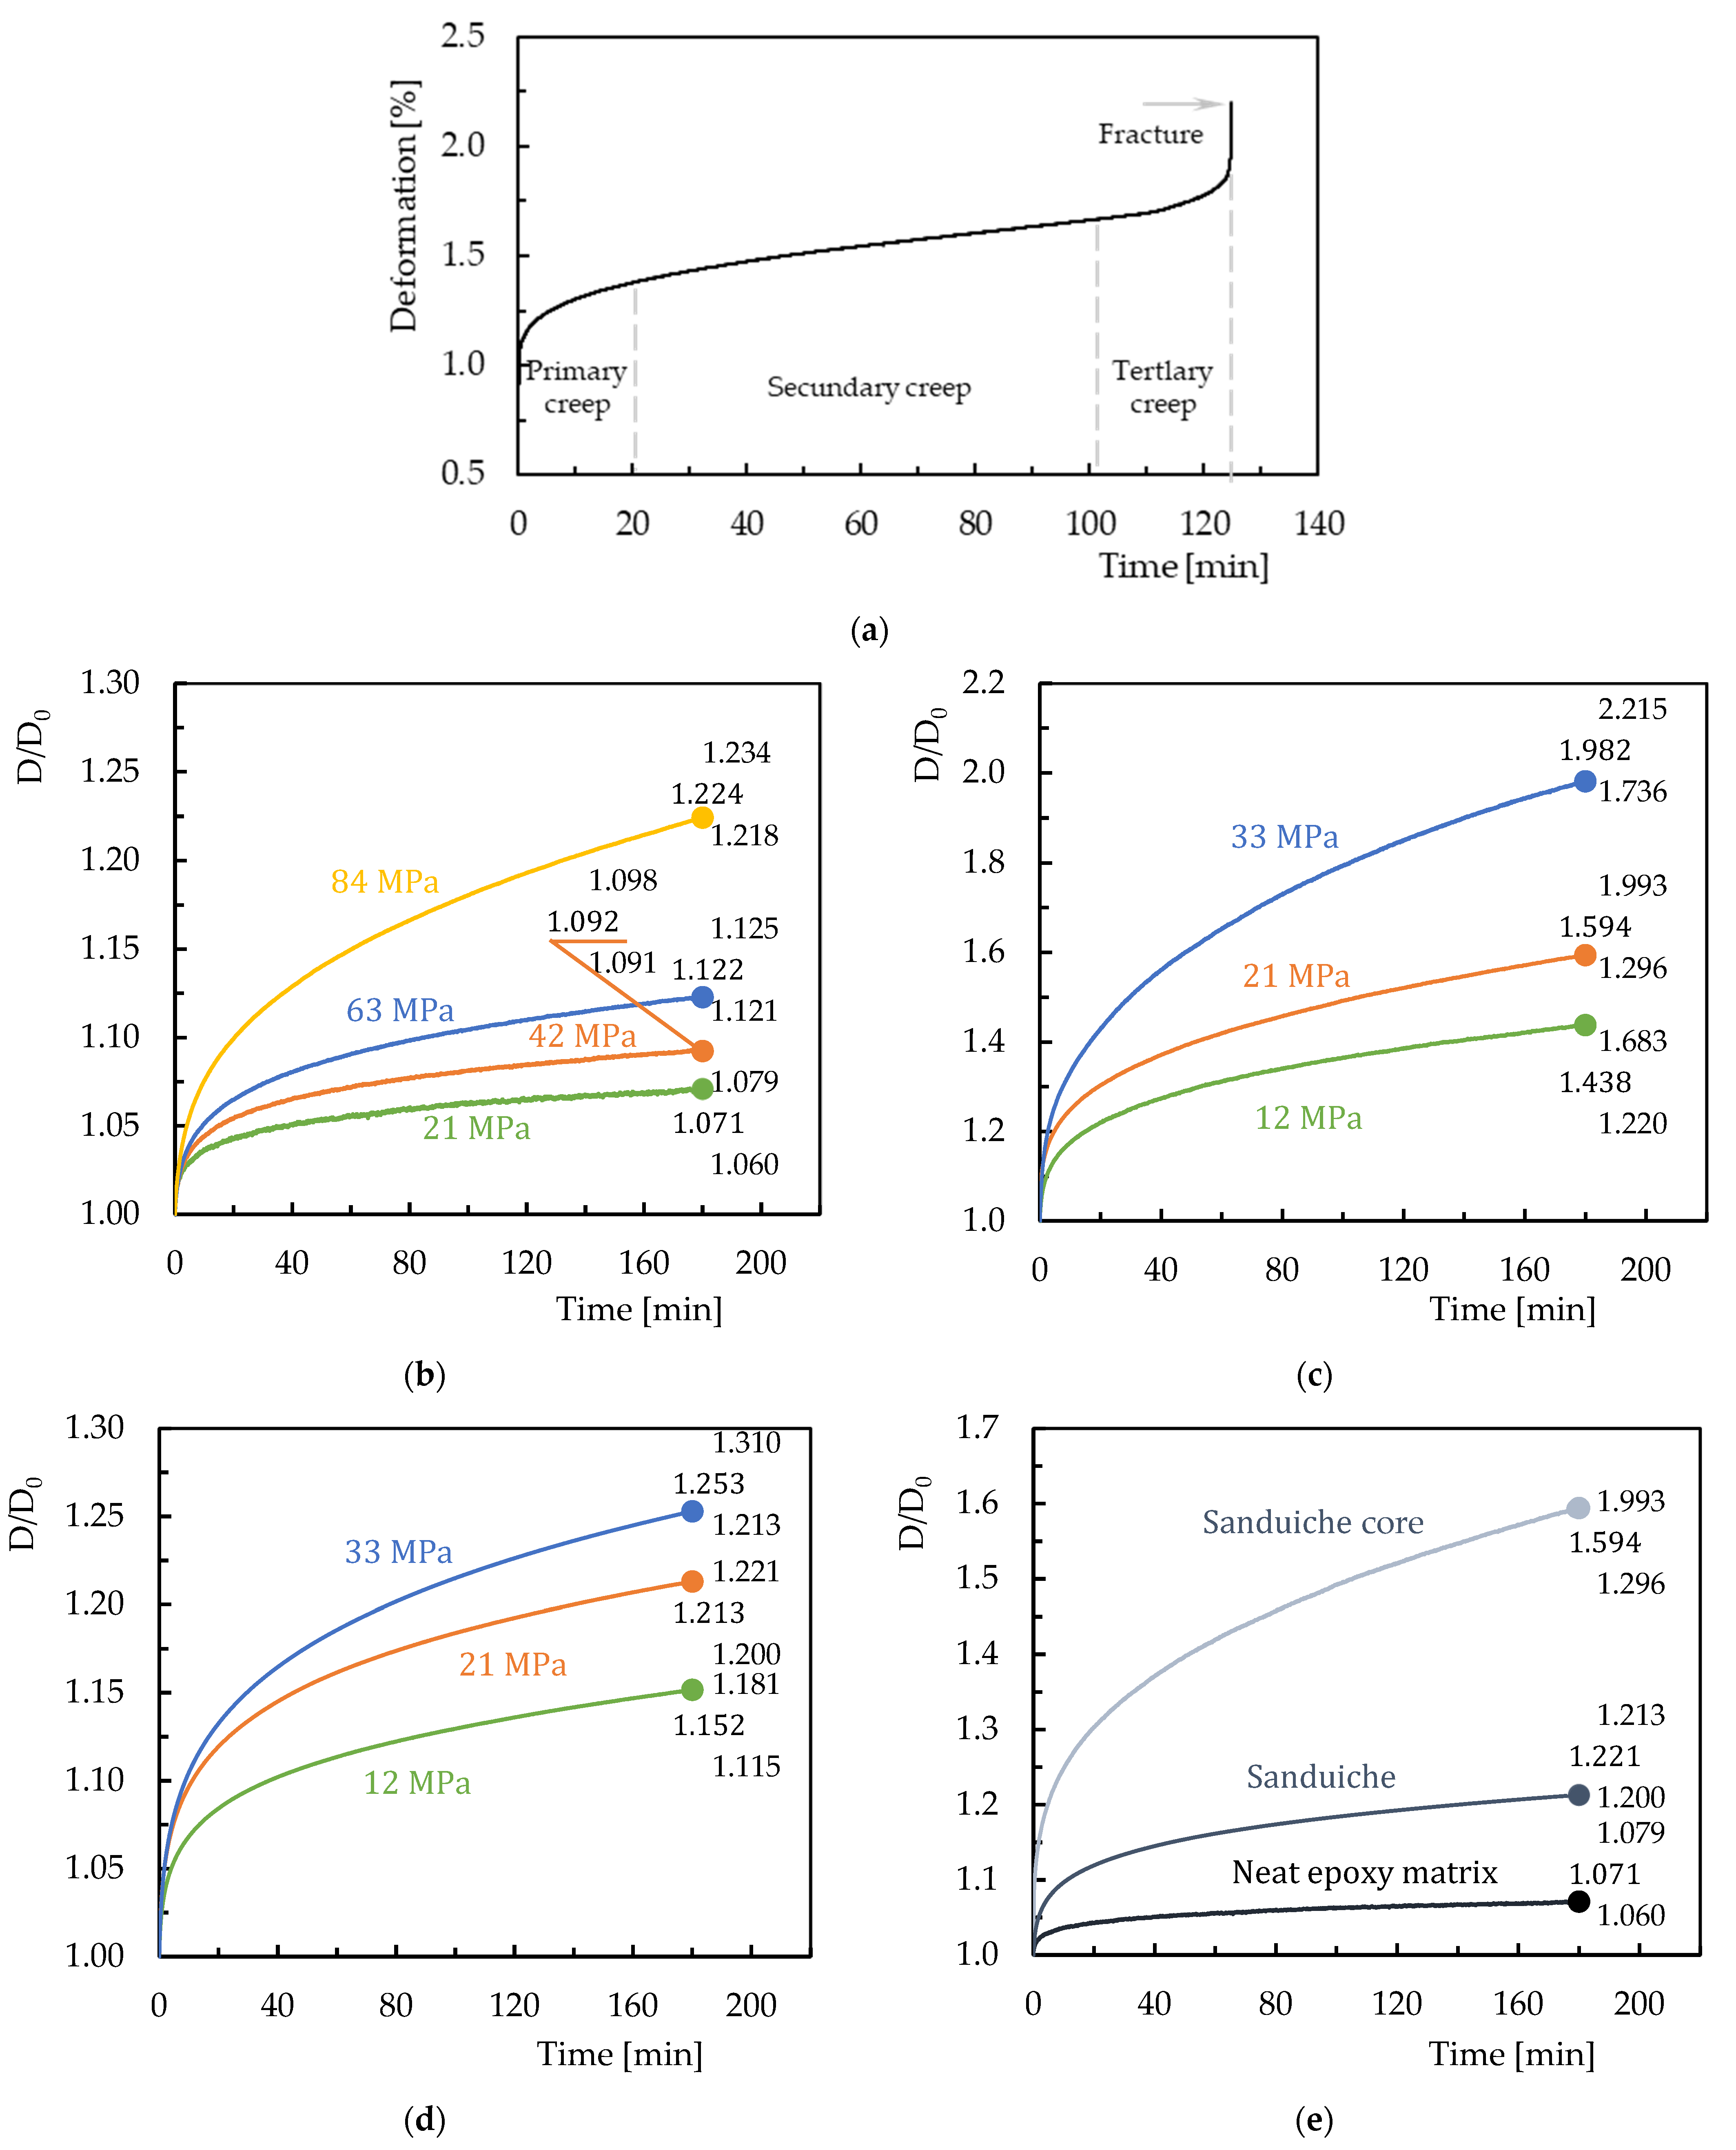
3.2. Creep
To analyze the viscoelastic behavior of both the core and the sandwich panel, creep and relaxation tests were carried out. To ensure that all the viscoelastic tests were performed in the elastic regime, a creep test was first performed on the core with a constant bending stress of 42 MPa. This stress was excessive and exceeded the elastic regime of the material, resulting in permanent damage, the typical curve of which is shown in Figure 9a [47,48].
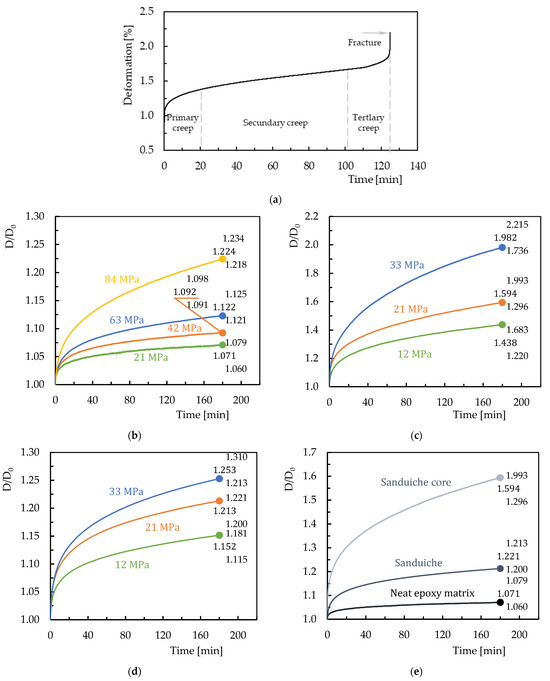
Figure 9.
Creep curves: (a) sandwich core for a bending stress of 42 MPa; (b) neat epoxy matrix; (c) sandwich core; (d) sandwich; (e) comparison of the behavior of the different materials for a stress of 21 MPa.
Firstly, to analyze the results of the creep tests carried out on both the neat epoxy matrix, the core and the sandwich structure, the curves shown in Figure 9b–d show the responses of the three materials in terms of creep stress during three hours of testing. Figure 9e compares the creep curves of the three materials for a bending stress of 21 MPa.
Figure 9b–e represent the displacement at any time during the test divided by its initial value (Do). For each condition analyzed, the end points of the curve represent the average values with their respective maximum and minimum values observed in each test/condition.
The curves show three distinct phases: instantaneous displacement, a primary creep phase and a secondary creep phase. The third phase appears only at higher stresses or over longer periods of time, depending on the stress levels applied, which, in this study, was not achieved. The primary creep phase shows a progressively decreasing displacement rate, while the secondary phase is characterized by a virtually constant displacement rate.
In all cases, the creep displacement increases with time and with the applied bending stress. Analysis of the first condition (Figure 9b) tested in the control matrix (21 MPa), shows an increase of 7.09% with respect to the initial displacement value. The percentage increase becomes progressively greater for bending stresses of 42 MPa, 63 MPa and 84 MPa, resulting in increases of 9.24%, 12.28% and 22.43%, respectively. The results obtained are consistent with the characteristic behavior observed in this class of materials. In polymers, this phenomenon occurs even at RT and low stress levels due to the inherent molecular motion within the polymer backbone structure. This molecular mobility facilitates rearrangements in the polymer chains that influence the creep behavior. Such behavior underscores the sensitivity of polymer materials to both temperature and applied stress, which are critical factors in determining their performance in several applications [49].
In the sandwich core (Figure 9c), for stresses of 12 MPa, 21 MPa and 33 MPa, there is a progressive increase in displacement, with increases of 43.79%, 59.40% and 98.15% with respect to the initial values. In the sandwich panel (Figure 9d), for the same stresses of 12 MPa, 21 MPa and 33 MPa, the displacement also increases continuously, reaching increases of 15.16%, 21.30% and 25.29% with respect to the initial values. The fact that the percentage increase is significantly greater at higher stresses is characteristic of polymer composites subjected to short-term creep, where the test still ends in the secondary creep region, with a stable strain rate [23,50].
Comparing the three materials, Figure 9e, the neat epoxy matrix is the less susceptible to creep (greater relative deformation over time). In the case of the core, the deformation initially increases rapidly (primary phase) then gradually increases and tends towards a constant value (secondary phase). The sandwich has a higher creep resistance compared to the core, due to the combination of the properties of the core and the outer flax fiber layers, making it most suitable for applications where creep resistance is required. After three hours and at a stress of 21 MPa, the displacement was significantly greater for the core (59.40%), followed by the sandwich (21.30%) and finally the epoxy matrix (7.09%).
This behavior of the different materials concerns the nature of the wood particles, their size and them not being subjected to any type of surface treatment, contributing to the breaking of the bonds and their uncontrolled propagation. On the other hand, the presence of linen fibers retards the creep behavior by simultaneously retarding the elastic deformation and the viscous flow. Inevitably, the fiber/matrix interface turns out to be very important because the breakage of bonds and their propagation control the creep displacement [51].
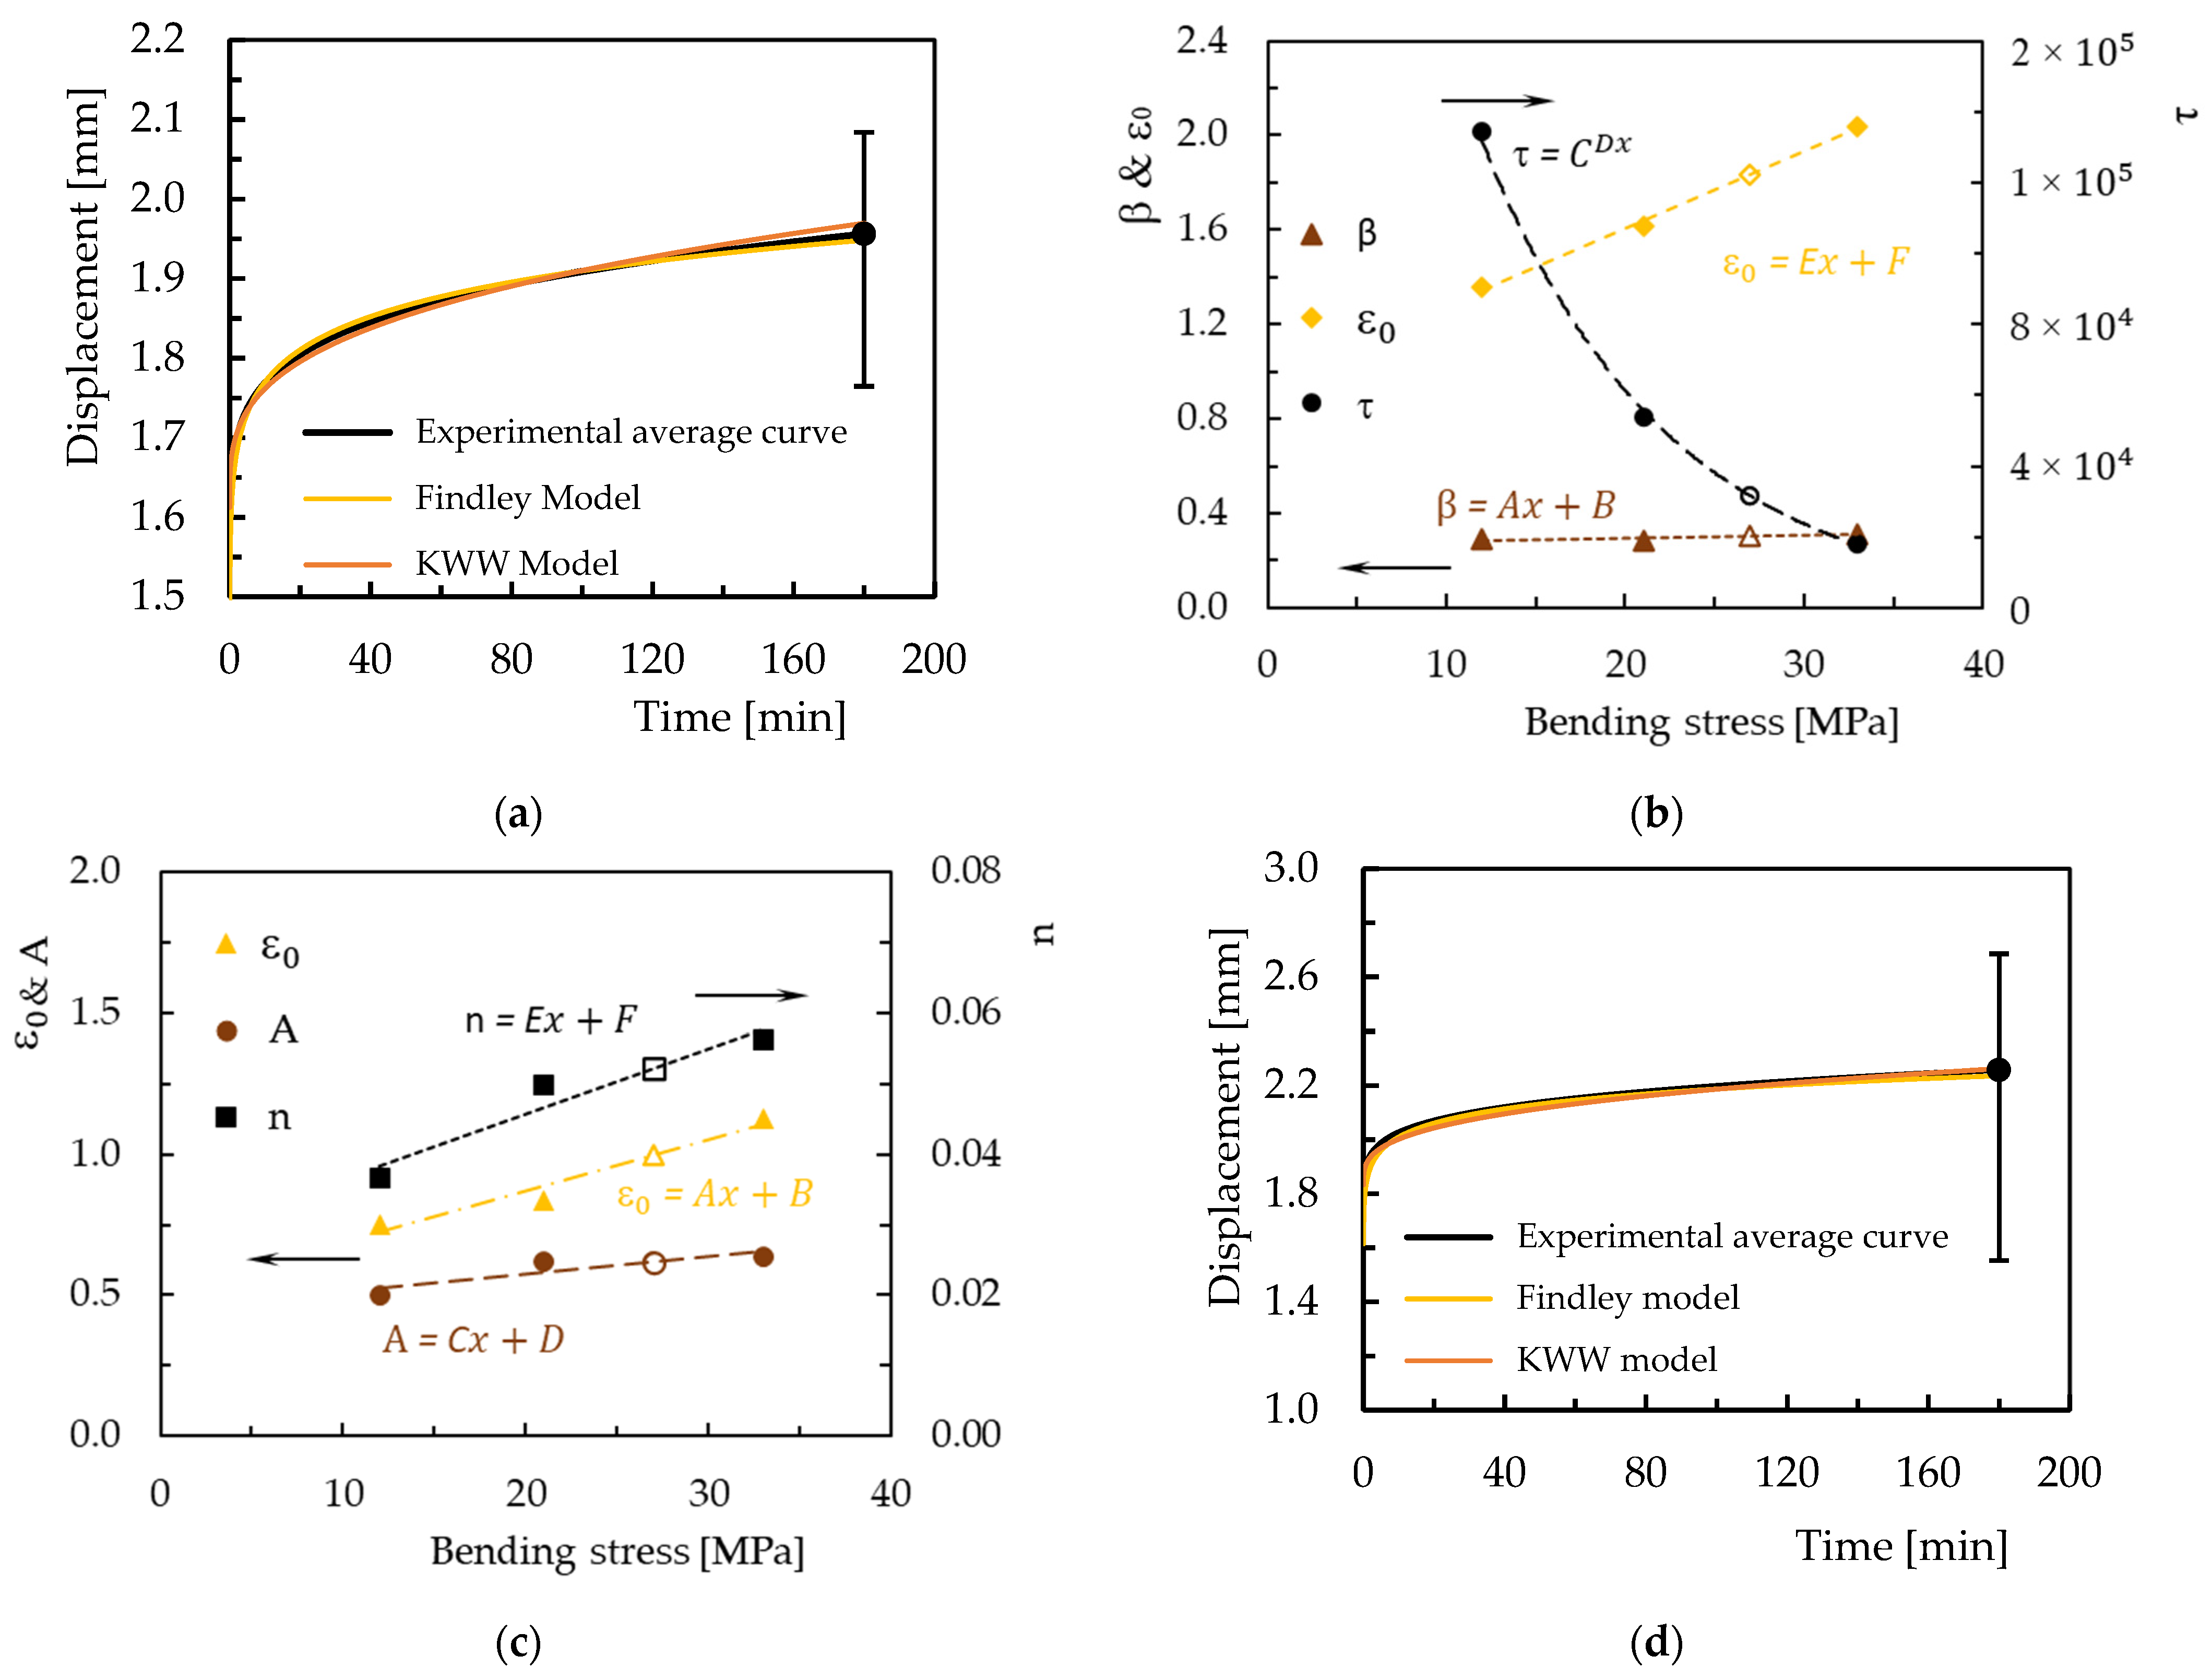
In the context of creep, several models have been applied to describe the viscoelastic behavior of fiber-reinforced polymer composites. Among these, the Findley power law model is one of the most widely adopted, and it is even recommended by the American Society of Civil Engineers Structural Plastics Design Manual for long-term strength analysis and design. However, there are also studies in the literature that apply the Findley power law to short-term creep data [38,50,52,53]. The mathematical formulation of the Findley power law is expressed by the equation
where is the creep displacement at time t, is the instantaneous or time-independent elastic displacement, A is the time-dependent creep amplitude and n is a constant that is independent of stress and is generally less than one [52]. In addition to the Findley model, based on studies found in the literature, the KWW model was also applied to obtain a better accuracy between the experimental and theoretical values [50,54,55]. The KWW function is given by
where represents the displacement, t is the time, is the initial displacement when a constant stress is applied, the parameter β corresponds to the distribution factor related to the amplitude of the distribution of creep times and τ refers to the mean creep time.
Figure 10 shows the analyses of both models on the sandwich, where the comparison of experimental and theoretical results for a stress of 21 MPa, a test condition common to all three materials, is shown in Figure 10a. Figure 10b,c show the parameters of the KWW and Findley models, respectively, in relation to the bending stress of the face, to predict the effect of stress on creep behavior. To validate the model, the intermediate bending stress of 27 MPa was used to calculate the parameters of both models, corresponding to the unfilled markers in Figure 10b,c. Finally, Figure 10d compares the curve estimated by the KWW model and the Findley model with the average curve obtained experimentally.
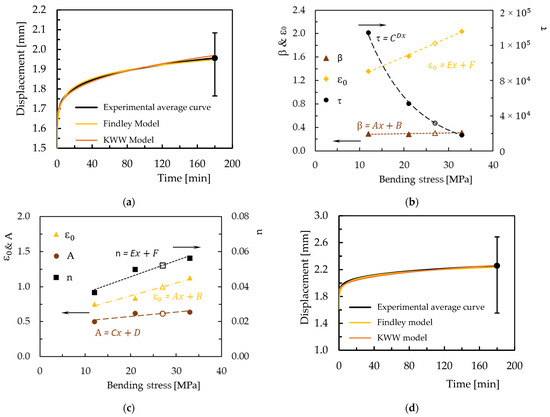
Figure 10.
Comparison between the average experimental curve and that predicted by the KWW model and the Findley model for the sandwich: (a) bending stress of 27 MPa; (b) parameters of the KWW model versus bending stress; (c) parameters of the Findley model versus bending stress; (d) bending stress of 27 MPa.
The KWW model provides a more accurate estimate of the effect of bending stress on the panel face of the panel in terms of creep behavior when compared to the Findley model. The curve generated by the KWW model shows greater similarity to the average experimental curve, thus reflecting a greater ability to replicate the real behavior of materials under prolonged stress. After three hours of testing, the maximum error obtained with the KWW model is 0.200%, overestimating the creep response, while it is 0.977% for the Findley model.
Table 2 shows the KWW and Findley model parameters for all the conditions tested in the three materials studied. In addition, the experimental values and the values predicted by the models for the displacement after three hours are shown, together with their respective errors.
Table 2.
KWW and Findley model parameters and accuracy for stress creep.
The top of Table 3, which refers to the KWW model, shows the coefficients and constants of the equations e as well as the coefficient and exponent of the equation . Correlation coefficients are also provided for both equations. The lower part of Table 3 has been prepared for Findley’s model and shows the coefficients, the constants of the following equations and their correlation coefficients: and .
Table 3.
Parameters of the equations that fit the KWW and Findley models.
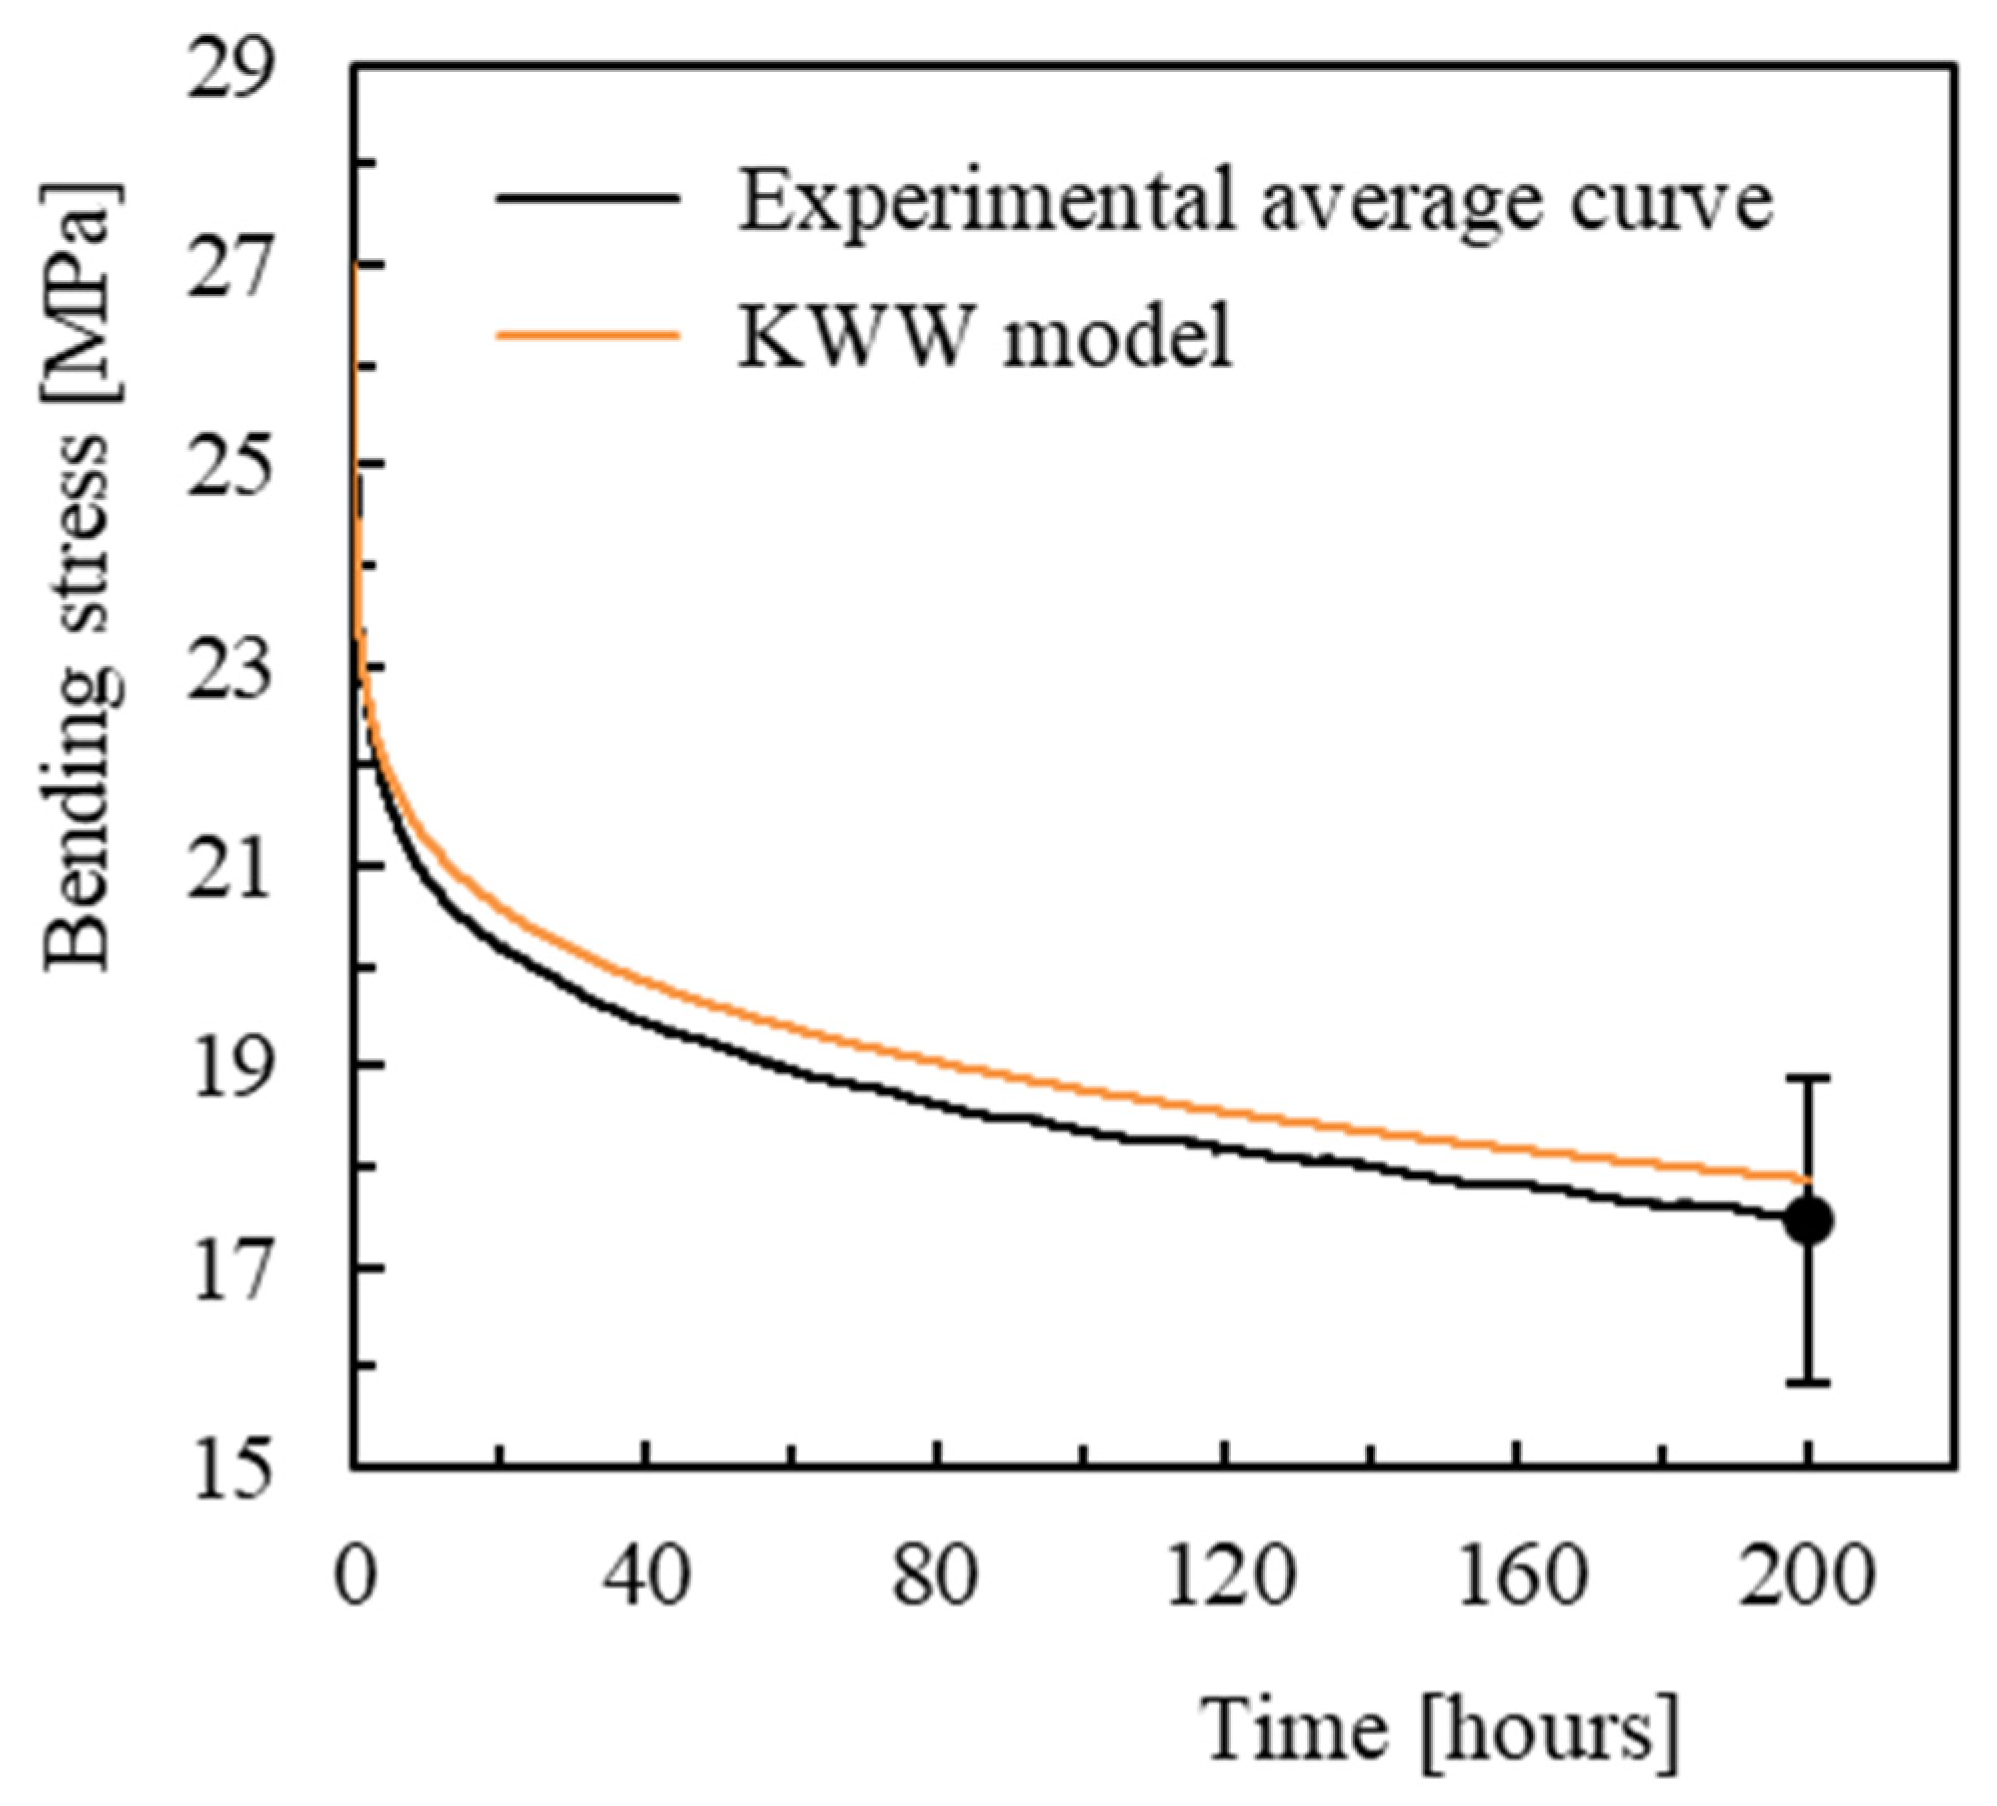
The suitability of these models for predicting the long-term creep behavior of the sandwich structure in relation to creep was assessed. The quality of the fit was analyzed and is shown in Figure 11, considering a bending stress of 27 MPa and a test period of 200 h (approximately 66.7 times longer than that used in the short-term tests.
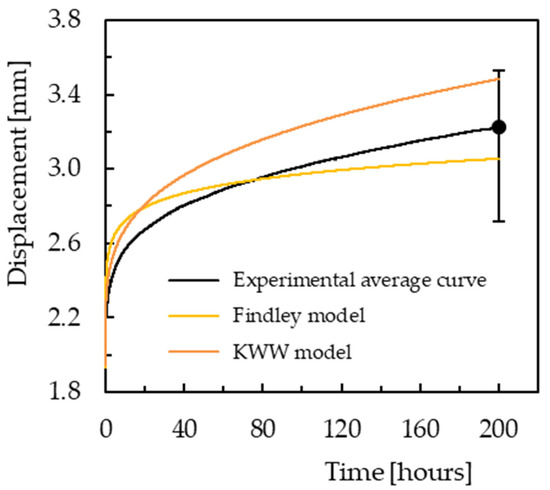
Figure 11.
Validation of the models for 200 h and for the sandwich at a bending stress of 27 MPa.
Both models show good accuracy in predicting the response to creep response at 200 h, as the theoretical results obtained are within the dispersion band of the experimental tests. The errors obtained are in the order of 6.7% for the KWW model and 1.3% for the Findley model after 100 h and 7.4% for the KWW model and 5.6% for the Findley model after 200 h. It should be noted that the KWW model overestimates the experimental results while the Findley model underestimates them. Findley’s model is, therefore, more conservative and appears to be more accurate in relation to experimental results for longer lifetimes.
In both scenarios, the theoretical values agree well with the range of experimental scatter, indicating that the proposed methodology is effective in estimating the effect of bending stress on creep response over extended periods with reasonable accuracy. Additional investigations over longer time periods are essential to validate and improve the robustness of the predictive models. Such studies would provide a broader understanding of the applicability and loading conditions of the methodology.
Using untreated wood fibers in the core composite significantly affects its viscoelastic behavior, particularly with regard to creep. Unlike chemically treated fibers, untreated wood lacks the surface modifications that enhance its compatibility with polymer matrices, resulting in several drawbacks. Without surface treatment (e.g., silane or alkaline treatment), the wood particles have a polar, hydrophilic surface that does not adhere well to the relatively non-polar epoxy matrix. This results in limited stress transfer and higher local strain at the interface under long-term loading [56]. If left untreated, wood fibers will readily absorb moisture. This can cause the matrix near the interface to become plasticized, accelerate creep deformation and, potentially, lead to swelling or debonding over time [57]. Weak interfacial adhesion contributes to interfacial debonding under sustained stress. This facilitates the initiation of microcracks and amplifies time-dependent deformation [58]. As observed in the study, the core composite exhibited higher displacement rates, particularly during the initial loading stages (increased primary and secondary creep), due to rapid fiber displacement and interfacial slip, which are both indicators of inadequate bonding.
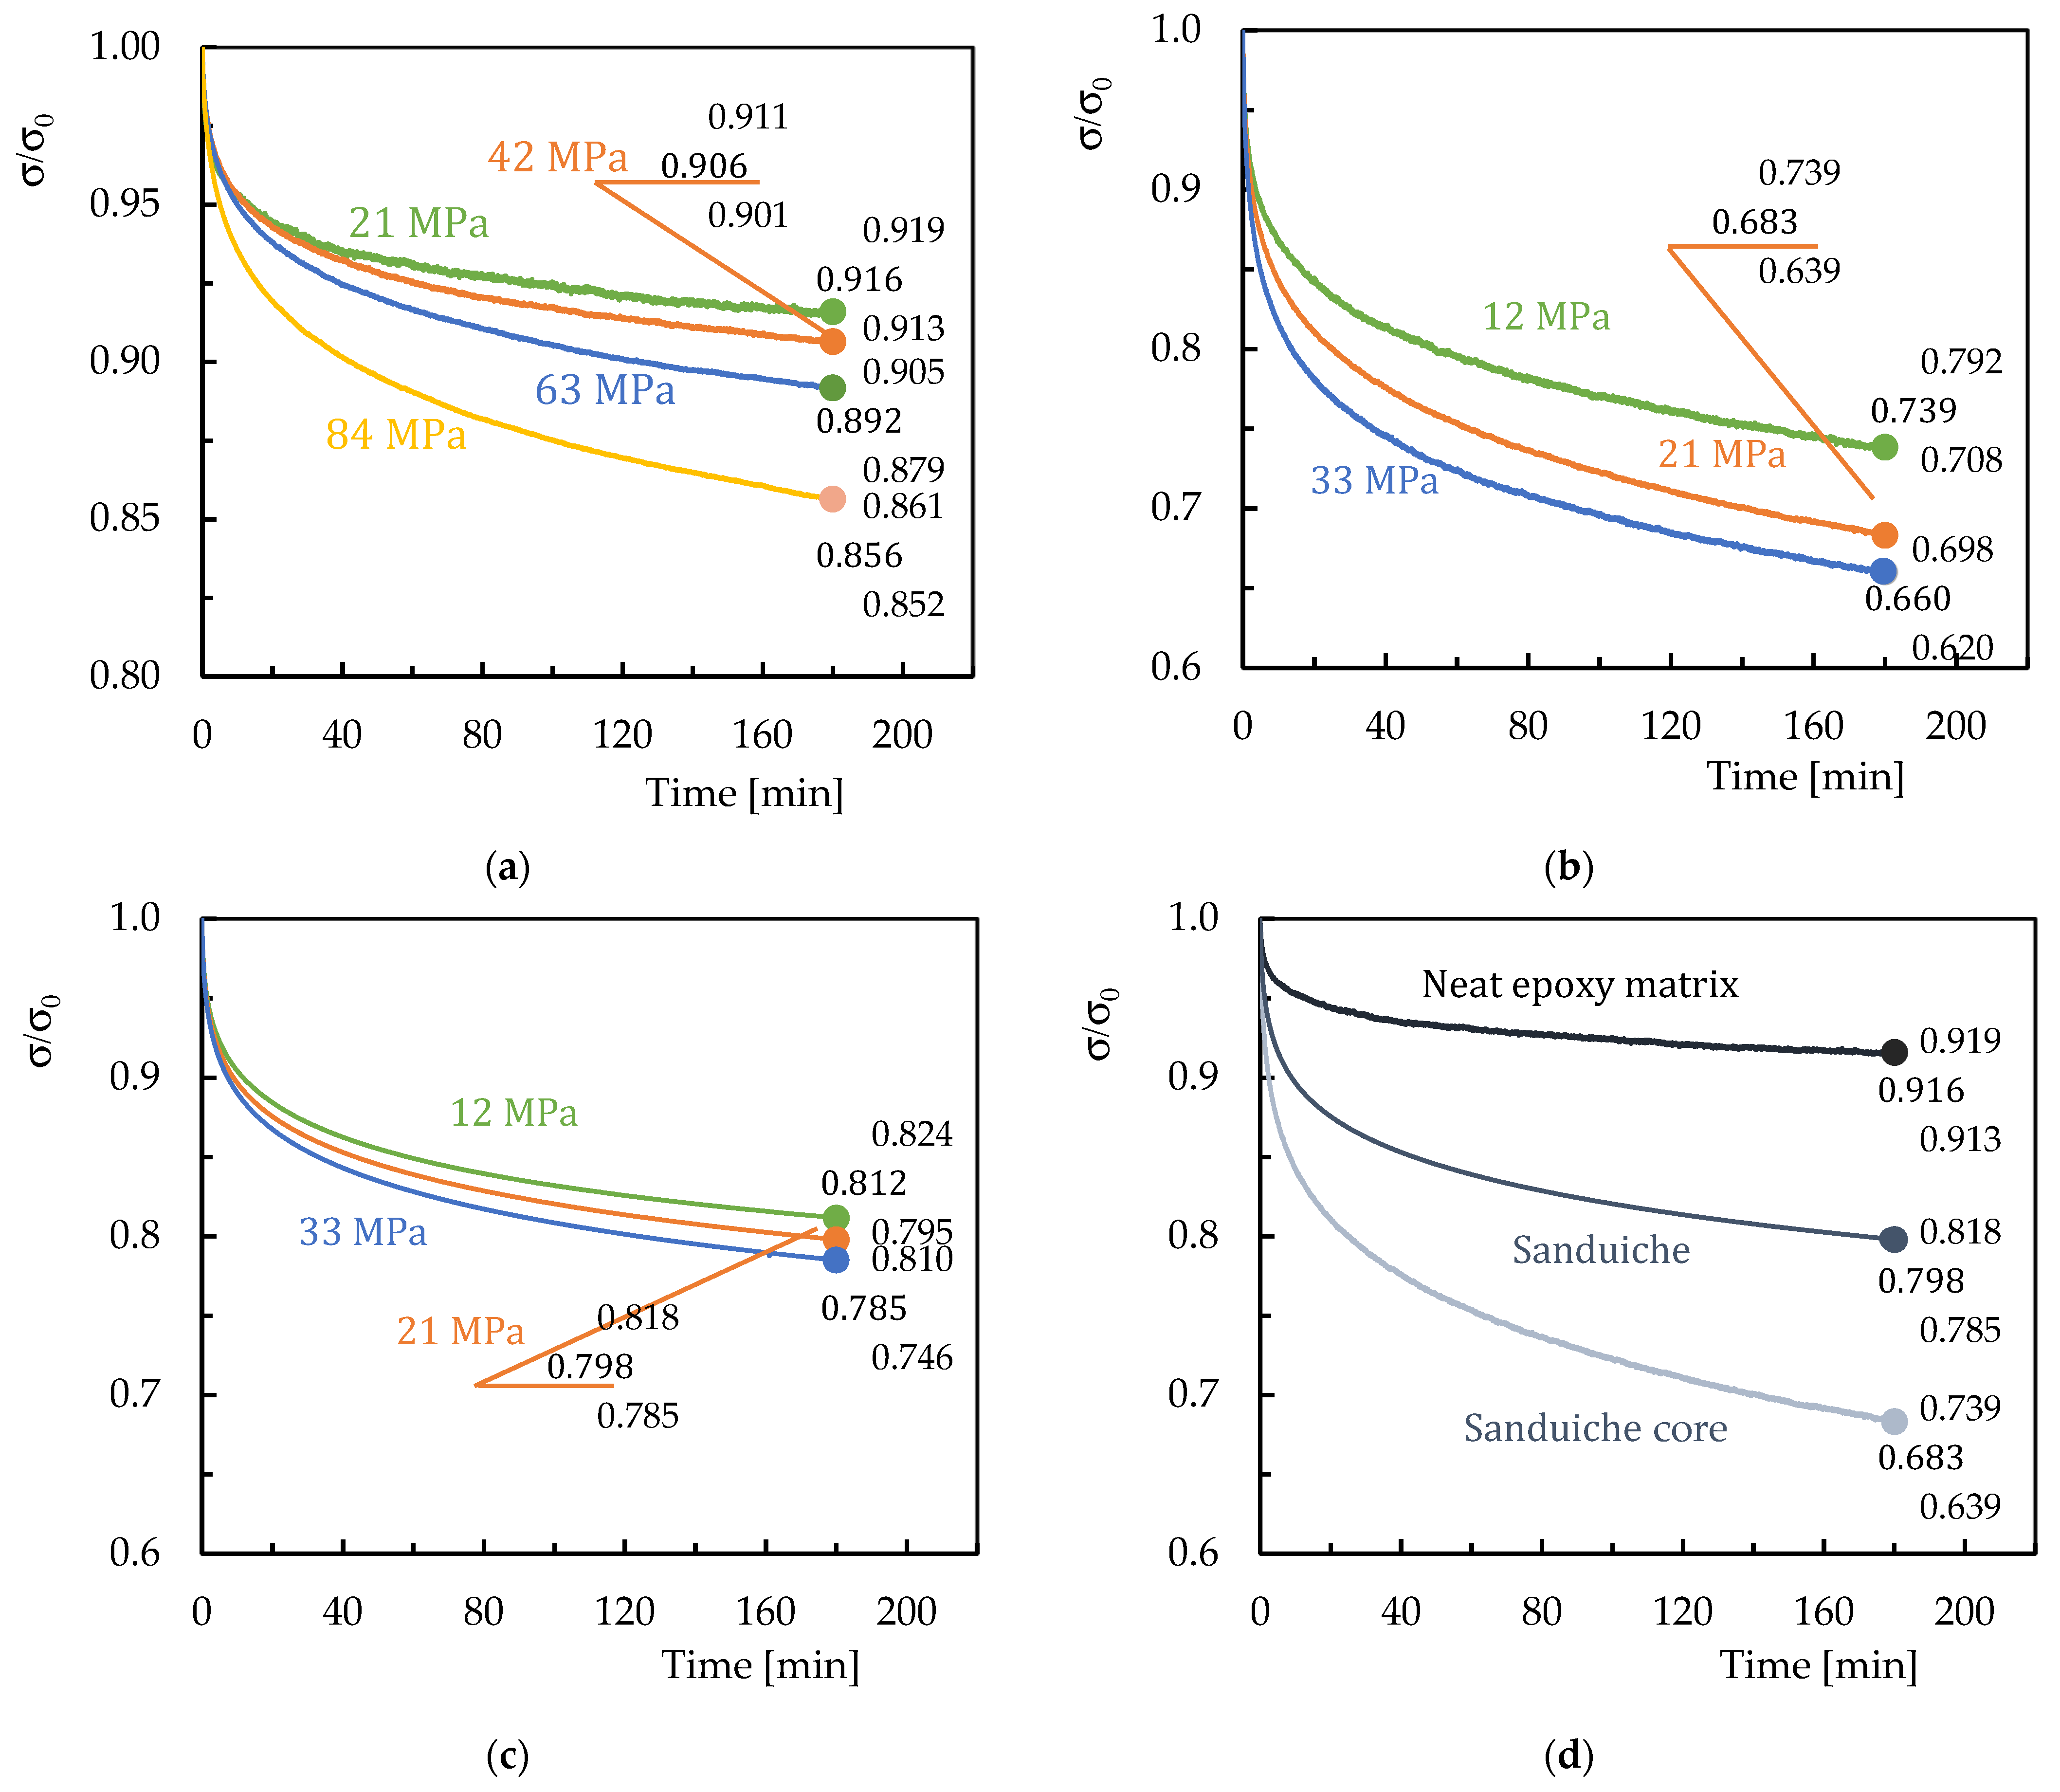
3.3. Stress Relaxation
Proceeding with the analysis of the stress relaxation results and tests carried out on the neat epoxy matrix, the core and the sandwich structure, the curves shown in Figure 12a–c show the stress relaxation responses of the three materials. In addition, a comparative graph between the three materials is presented, showing the curves for a bending stress of 21 MPa (shown in Figure 12d). Figure 12 shows the average bending stress over time. For each condition analyzed, and the end points of the curves represent average values along with their respective maximum and minimum values observed in each test/condition.

Figure 12.
Stress relaxation curves: (a) neat epoxy matrix; (b) sandwich core; (c) sandwich; (d) different materials for a bending stress of 21 MPa.
For all materials studied, the stress decreases over time, starting from an initial stress value (σ0) and moving toward an expected stable final value (σ∞). This trend becomes more pronounced as the bending stress applied in the experiment increases. The stable end value is not visible in the curves presented because the study focuses on short-term testing, which has been shown to be an effective, fast and reliable method for predicting the long-term behavior of materials [50]. As reported in the literature, it is also noted that there is an initial period where the decrease in bending stress is higher compared to the remaining time [50,59].
A detailed analysis of the neat epoxy matrix (Figure 12a) shows that for a strain corresponding to 21 MPa, the stress decreases continuously, reaching values 8.4% lower than the initial stress. This percentage reduction increases progressively for strains corresponding to 42 MPa, 63 MPa and 84 MPa, resulting in reductions of 9.4%, 10.8% and 14.4%, respectively.
Stress relaxation in polymer systems results from underlying physical and/or chemical processes, even at RT. In the case of physical processes, stress relaxation is driven by molecular rearrangements that involve minimal formation or the rupture of primary bonds, such as chain mobility and segmental motion within the polymer matrix. Conversely, chemical processes involve more substantial transformations, including chain scission, cross-link scission or the formation of new cross-links [60,61,62].
Regarding the sandwich core (Figure 12b), for strains of 12 MPa, 21 MPa and 33 MPa, a continuous stress reduction is observed, reaching values 26.1%, 31.7% and 34.0% lower than the initial values at the end of three hours. Finally, in the sandwich structure (Figure 12c), for strains of 12 MPa, 21 MPa and 33 MPa, the stress decreases continuously, reaching values 18.8%, 20.2% and 21.5% lower than the initial values.
Comparing the behavior of the three materials (neat epoxy resin, core and sandwich) (Figure 10d) under the same conditions, with a strain corresponding to 21 MPa, the stress reduction from the initial point to the end of three hours was significantly greater for the core (31.7%), followed by the sandwich structure (20.2%) and, finally, the neat epoxy matrix (8.4%).
Figure 12d shows that the sandwich core has much higher stress relaxation values than those observed for the neat epoxy matrix. This can be attributed to the poor adhesion of the wood fiber/epoxy matrix, as it has not been subjected to any surface treatment, the nature of the particles and different physical interactions resulting from the non-identical polarity of the epoxy matrix. With the addition of flax fibers, the molecular flow in the relaxation process is delayed. The interfacial properties are very relevant because relaxation processes can occur due to bond breakage and propagation [63]. In this case, and as reported in the bibliography, the stress relaxation phenomenon in composites is a consequence of two mechanisms: matrix phase relaxation and fiber/matrix debonding zones with corresponding crack propagation [62].
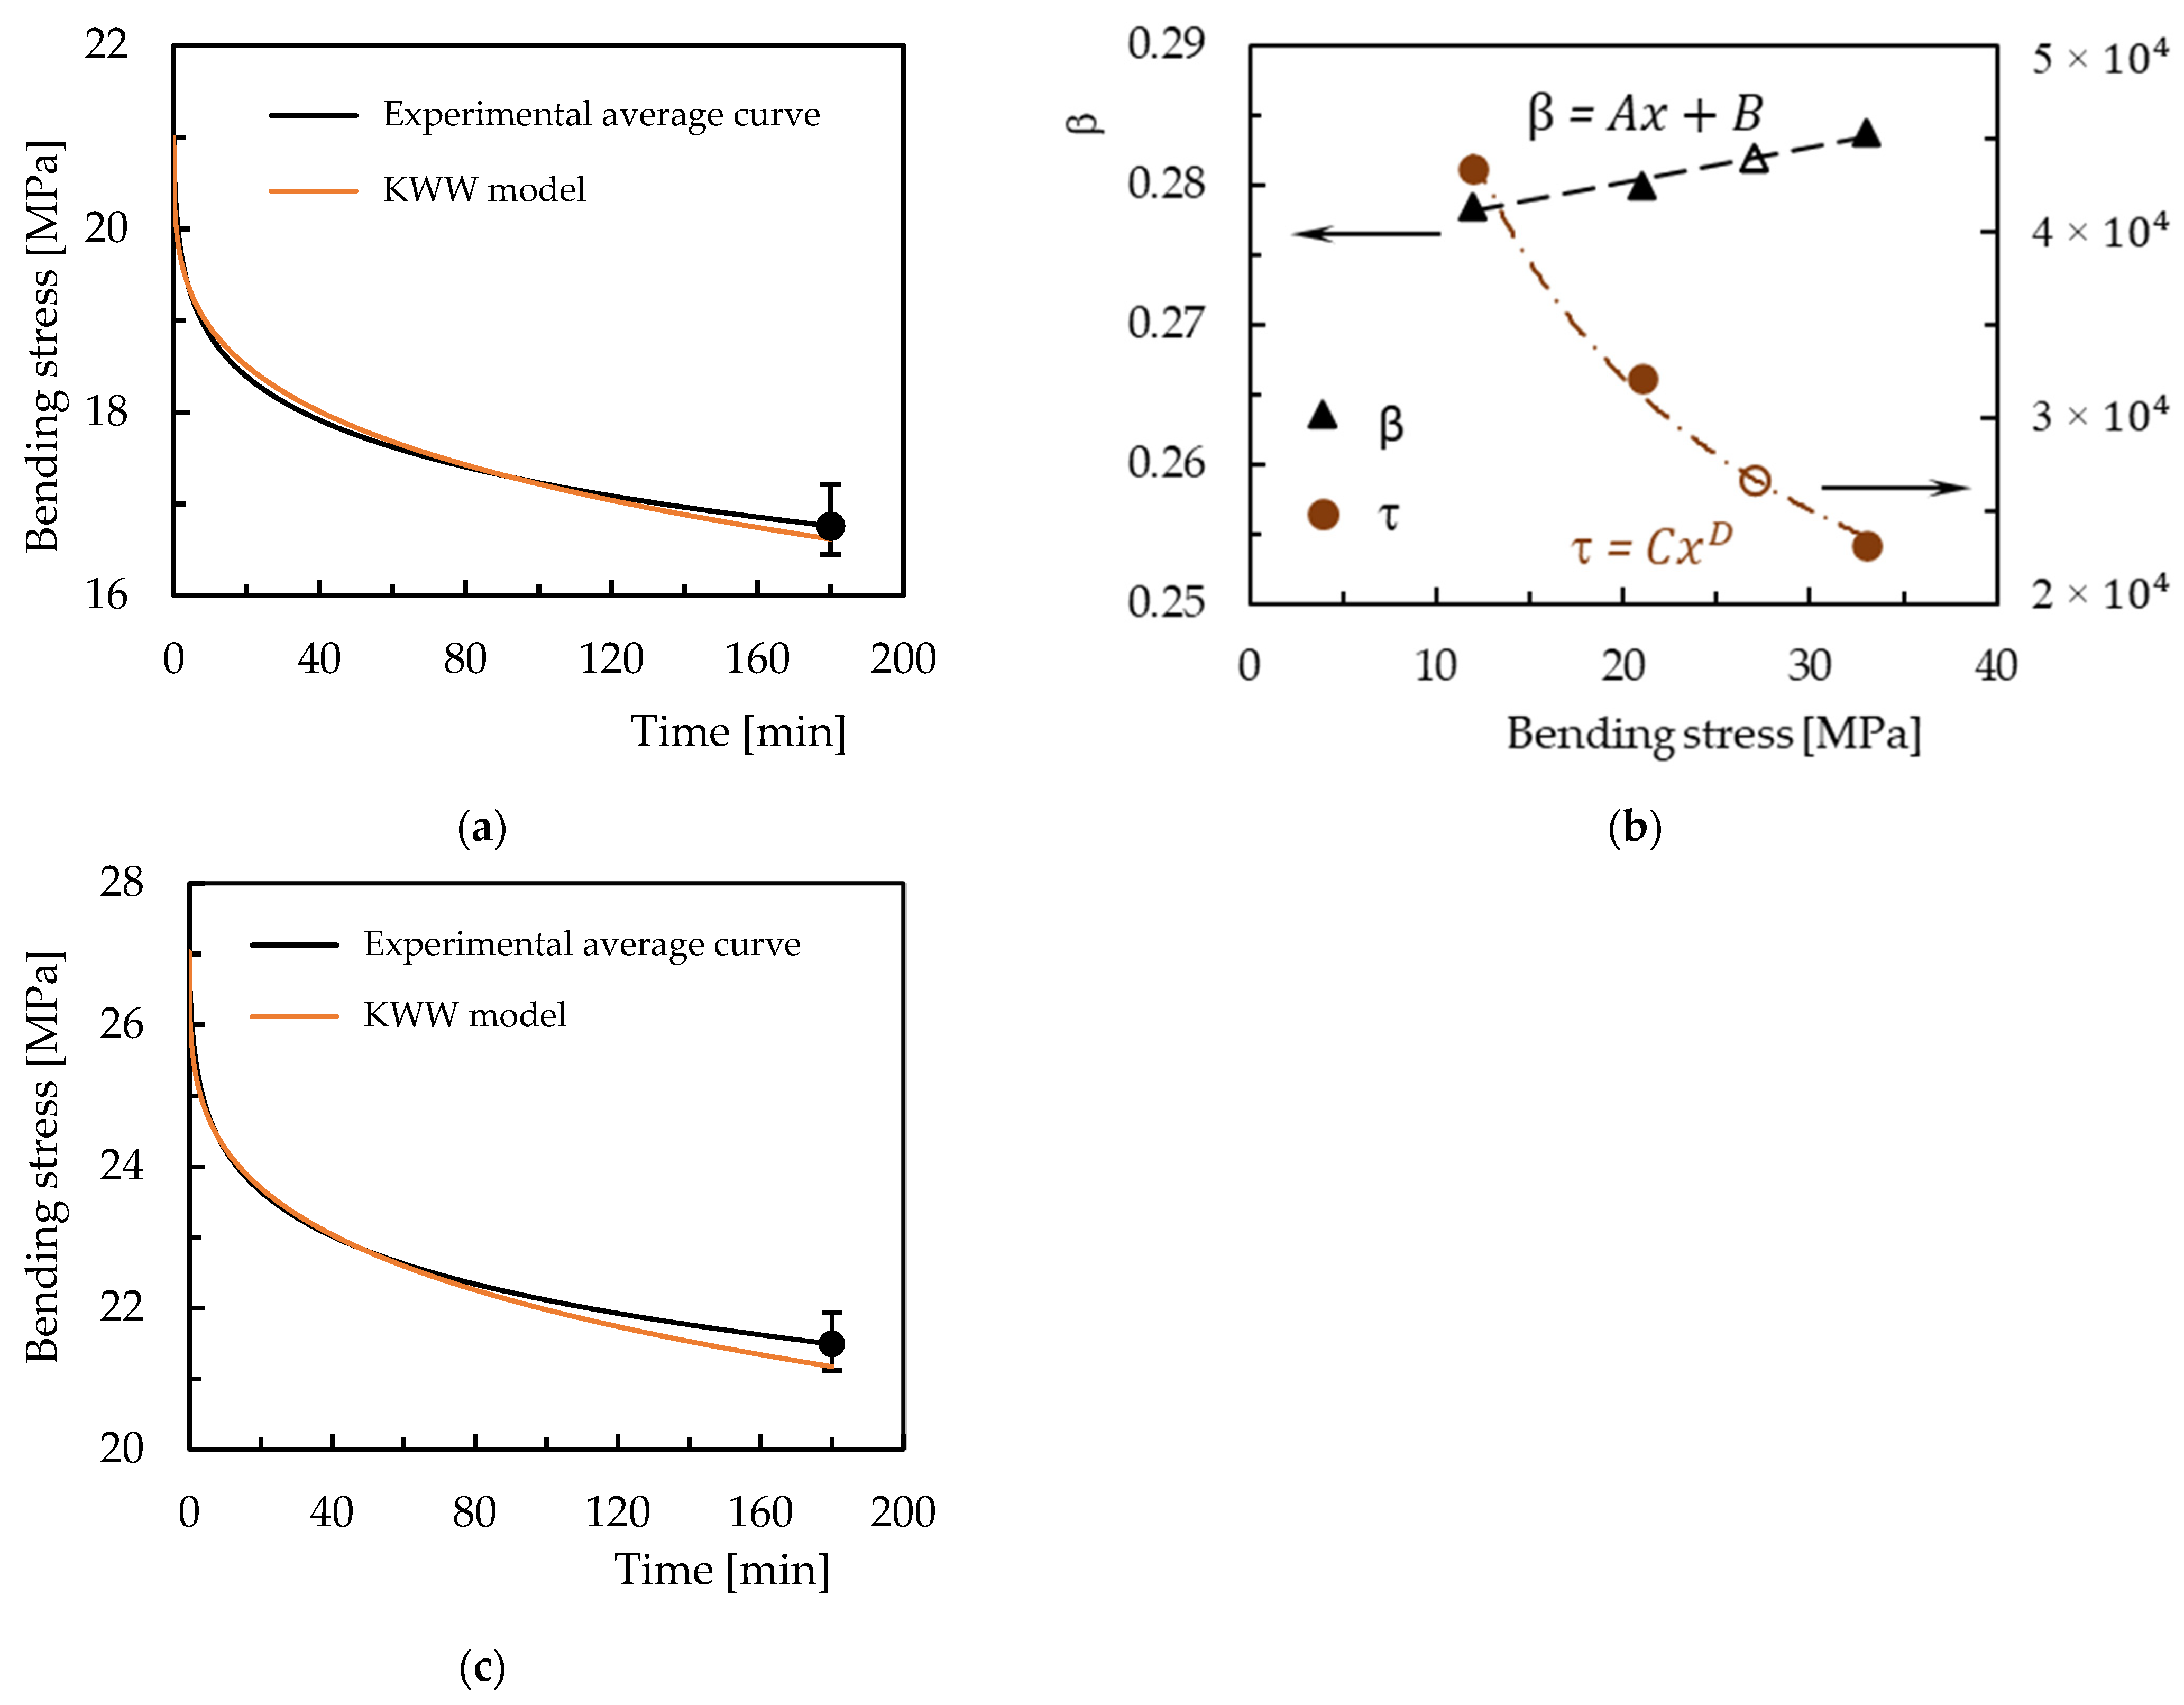
The ability to model the mechanical response of a material is crucial for predicting its long-term structural behavior. With regard to stress relaxation, several models have been presented in the literature, with the Kohlrausch–Williams–Watts (KWW) function proving to be the most suitable for modelling relaxation processes [50,53,64]. According to this model, the relaxation function as a function of time is given by
where and represent the stress at time t and at t = 0, is a fractional power exponent (non-exponential factor) and is the KWW relaxation time.
Figure 13a shows a comparison between the experimental and theoretical results, according to the KWW model, for the sandwich panel at a stress of 21 MPa (a test condition common to all three materials). To predict the effect of bending stress on stress relaxation, Figure 13b presents the KWW model parameters as a function of bending stress. To validate the model, the intermediate bending stress of 27 MPa was used to calculate the parameters and , corresponding to the unfilled markers in Figure 13b. Finally, Figure 13c compares the theoretical data with the experimental results, and the band at the end of three hours shows the dispersion of the experimental results. It should be noted that the error between the two results after three hours is 1.4%, 3% and 1.5% for the neat epoxy matrix, core and the sandwich panel, respectively.
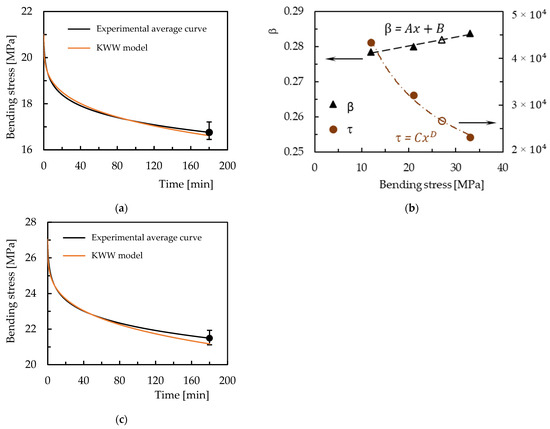
Figure 13.
Comparison between the average experimental curve and the one constructed by the KWW model for the sandwich: (a) bending stress of 21 MPa; (b) KWW parameters versus bending stress; (c) bending stress of 27 MPa.
Table 4 shows all the parameters of the KWW model for all the conditions tested in the three materials analyzed. In addition, the experimental and model predicted values for the bending stress after three hours are given, along with their respective errors.
Table 4.
KWW model parameters and accuracy for stress relaxation.
Table 5 shows the coefficients and constant of the equation , and as well as the coefficient and exponent of the equation . The correlation coefficients are also provided for both equations.
Table 5.
Values of the equations that fit the KWW model.
The ability of the model to predict long-term structural behavior with respect to stress relaxation was also evaluated. For this purpose, the quality of fit is shown in Figure 14, considering a bending stress in the face of 27 MPa and a test time of 200 h.
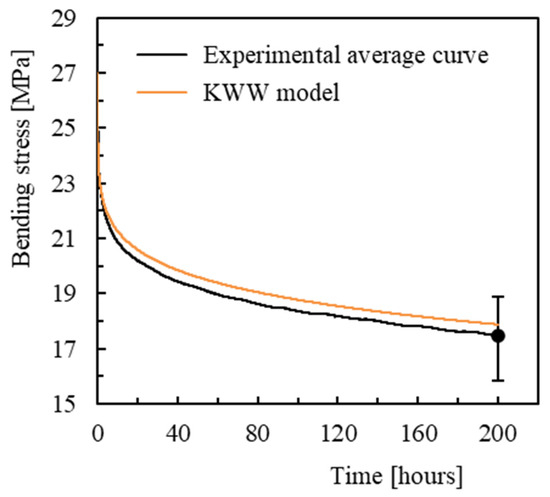
Figure 14.
Validation of the model for 200 h and for the sandwich at a bending stress of 27 MPa.
Analyzing the results, the error between the experimental and theoretical values is only 2.2% after 100 h and 2.4% after 200 h. In addition, the predicted values after 200 h of testing are within the dispersion bands, which represent the respective maximum and minimum values obtained in the experimental tests. Therefore, it can be concluded that the model predicts the stress relaxation response of the material quite accurately and can be applied with good accuracy.
The methodology based on the KWW model presented in this study has proved effective in predicting the viscoelastic response of sandwich composites in long-term structural and component applications under sustained loads. Its applicability under a variety of conditions highlights its potential as a robust tool for the design and evaluation of composite structures intended for extended service life.
However, while the Findley and KWW models provided accurate predictions of short-term viscoelastic behavior under controlled laboratory conditions, there are several limitations to their application in real-world scenarios. (i) Simplified loading conditions: Both models assume constant stress or strain, whereas actual structural components often experience variable, cyclic or multi-axial loads. (ii) Environmental variability: The models do not account for external factors such as humidity, UV exposure or temperature fluctuations, all of which significantly affect the creep and relaxation behavior of natural fiber composites [65]. (iii) Material heterogeneity: The presence of defects or inconsistencies in fiber distribution or interfacial debonding may lead to deviations from ideal model predictions, especially in large-scale or long-term use [66]. (iv) Nonlinear long-term behavior: While the KWW model captures short-term relaxation well and the Findley model suits long-term creep, neither can fully capture the transition to tertiary creep or failure modes without modification. (v) Scaling effects: Results obtained from small specimens under laboratory conditions may not be directly extrapolated to full-sized components used in industrial or architectural settings.
3.4. Production Costs
Beyond the mechanical performance of the developed sandwich panel, a thorough evaluation of its manufacturing cost is essential to assess its feasibility for practical and sustainable applications within a circular economy framework.
The panel is composed of just four main components: bio-based epoxy resin, hardener, flax fibers and wood waste in the form of sawdust. Notably, the wood waste was sourced at no cost, as it was an industrial by-product designated for reuse—a core principle of circular economy practices.
However, a significant portion of the total production cost is attributed to the SR GreenPoxy 56 resin and SD Surf Clear hardener. Despite the environmental advantages of this bio-based system, its cost is higher than that of conventional petroleum-based epoxies. These two components account for approximately 99.52% of the total material cost. Additionally, energy consumption during manufacturing—especially the post-curing stage in the oven—was considered. Although minor compared to material costs, this energy use should be minimized to enhance overall sustainability.
This analysis highlights a critical trade-off: While the use of recycled wood waste and natural fibers supports sustainability and resource circularity, the eco-resin system currently limits cost competitiveness. Future research could explore alternative bio-resins or hybrid matrices, cost optimization via bulk processing and life cycle assessment to balance ecological and economic performance.
4. Conclusions
This case study was unique in its attempt to incorporate ecological components into the overall composition of the developed material. The polymer matrix used was SR GreenPoxy 56, which is not only more environmentally friendly than other fully synthetic options but also provides a significant improvement in the properties of the material. The reinforcements, wood particles and flax fiber, are also sustainable materials whose synergy has been shown to improve the mechanical properties of the materials in which they are incorporated. Based on the test results, the following conclusions were drawn.
The amount of wood particles incorporated in the core was set at 40 wt.%, with a dimension greater than or equal to 0.300 mm. This choice was carefully made after evaluating the bending properties of several percentages and dimensions, with two important factors in mind: maximizing the use of wood waste and maintaining good mechanical properties. The 3PB static tests carried out on the sandwich panel show that the flax fiber facing contributes to the bending strength of the material, as it has a higher stiffness modulus than the core at 44.8%. In compression tests, the developed sandwich panel has an average edgewise compressive strength of approximately 61 MPa, withstanding a compressive load of approximately 32 kN to failure. In addition, the material has a horizontal compressive strength of approximately 97 MPa, withstanding a load of approximately 42 kN.
In the creep tests, an increase in displacement with time was observed and, comparing the two estimation methods used, the experimental results were better fitted by the KWW model than by the Findley model. However, although the KWW model is more suitable for short-term predictions, the opposite trend was observed for long-term predictions. In contrast, the stress relaxation tests showed a decrease in stress with time in the three materials evaluated (neat epoxy matrix, core and sandwich), with an increasing trend towards higher initial bending stress values. The KWW equation was used to fit the experimental data and proved to be an effective prediction method with good accuracy for both short- and long-term predictions.
Importantly, using wood waste as a core reinforcement material contributes to mechanical performance and plays a key role in supporting the circular economy. This approach demonstrates a viable pathway towards waste valorization, resource efficiency and eco-friendly product development by diverting industrial sawdust from landfills and reintroducing it as a high-value engineering material.
Future research should explore surface treatments for wood fibers to improve interfacial bonding and reduce time-dependent deformation further, as well as assessing life cycle impacts to quantify the environmental benefits.
Author Contributions
Conceptualization, T.M.L. and P.S.; methodology, T.M.L. and P.S.; validation, T.M.L. and P.S.; formal analysis, T.M.L. and P.S.; investigation, S.G. and P.S.; resources, P.S.; data curation, S.G.; writing—original draft preparation, S.G.; writing—review and editing, T.M.L. and P.S.; visualization, P.S.; supervision, T.M.L. and P.S. All authors have read and agreed to the published version of the manuscript.
Funding
This work was supported in part by the Fundação para a Ciência e Tecnologia (FCT) and C-MAST (Center for Mechanical and Aerospace Science and Technologies) under project UIDB/00151/2020 (DOI: 10.54499/UIDB/00151/2020) and UIDP/00151/2020 (DOI: 10.54499/UIDP/00151/2020).
Institutional Review Board Statement
Not applicable.
Informed Consent Statement
Not applicable.
Data Availability Statement
The original contributions presented in this study are included in the article. Further inquiries can be directed to the corresponding author.
Conflicts of Interest
The authors declare no conflicts of interest.
References
- Kuhlman, T.; Farrington, J. What Is Sustainability? Sustainability 2010, 2, 3436–3448. [Google Scholar] [CrossRef]
- Ellen MacArthur Foundation Towards a Circular Economy: Business Rationale for an Accelerated Transition. 2015. Available online: https://content.ellenmacarthurfoundation.org/m/4384c08da576329c/original/Towards-a-circular-economy-Business-rationale-for-an-accelerated-transition.pdf (accessed on 19 June 2023).
- European Parliament Research Service Circular Economy: Definition, Importance and Benefits. Available online: https://www.europarl.europa.eu/news/en/headlines/economy/20151201STO05603/circular-economy-definition-importance-and-benefits (accessed on 19 June 2023).
- Bocken, N.M.P.; de Pauw, I.; Bakker, C.; van der Grinten, B. Product Design and Business Model Strategies for a Circular Economy. J. Ind. Prod. Eng. 2016, 33, 308–320. [Google Scholar] [CrossRef]
- Ho, O.T.-K.; Gajanayake, A.; Iyer-Raniga, U. Transitioning to a State-Wide Circular Economy: Major Stakeholder Interviews. Resour. Conserv. Recycl. Adv. 2023, 19, 200163. [Google Scholar] [CrossRef]
- Le Moigne, R. Waste Watchers. 2021. Available online: https://www.ellenmacarthurfoundation.org/articles/waste-watchers (accessed on 19 June 2023).
- Siva, R.; Valarmathi, T.N.; Palanikumar, K.; Samrot, A.V. Study on a Novel Natural Cellulosic Fiber from Kigelia Africana Fruit: Characterization and Analysis. Carbohydr. Polym. 2020, 244, 116494. [Google Scholar] [CrossRef]
- Mendes, C.P.; Fleming, R.; Goncalves, A.-M.B.; da Silva, M.J.; Prataviera, R.; Cena, C. Mechanical and Microstructural Characterization of Epoxy/Sawdust (Pinus elliottii) Composites. Polym. Polym. Compos. 2021, 29, 1135–1142. [Google Scholar] [CrossRef]
- Siva, R.; Mobithis, M.; Ravichandran, R.; Valarmathi, T.; Jeya Jeevahan, J.; Sangeetha, M. Characterization of Mechanical, Chemical Properties and Microstructure of Untreated and Treated Cissus Quadrangularis Fiber. Mater. Today Proc. 2021, 47, 4479–4483. [Google Scholar] [CrossRef]
- Kumar, N.; Grewal, J.S.; Kumar, S.; Kumar, N.; Kashyap, K. Mechanical and Thermal Properties of NaOH Treated Sisal Natural Fiber Reinforced Polymer Composites: Barium Sulphate Used as Filler. Mater. Today Proc. 2021, 45, 5575–5578. [Google Scholar] [CrossRef]
- Owen, M.M.; Achukwu, E.O.; Romli, A.Z.; Bin Abdullah, A.H.; Ramlee, M.H.; Bin Shuib, S. Thermal and Mechanical Characterization of Composite Materials from Industrial Plastic Wastes and Recycled Nylon Fibers for Floor Paving Tiles Application. Waste Manag. 2023, 166, 25–34. [Google Scholar] [CrossRef] [PubMed]
- Oliveira, P.R.; dos Santos, J.C.; Ribeiro Filho, S.L.M.; Torres Ferreira, B.; Panzera, T.H.; Scarpa, F. Eco-Friendly Sandwich Panel Based on Recycled Bottle Caps Core and Natural Fibre Composite Facings. Fibers Polym. 2020, 21, 1798–1807. [Google Scholar] [CrossRef]
- Oliveira, P.R.; May, M.; Panzera, T.H.; Scarpa, F.; Hiermaier, S. Improved Sustainable Sandwich Panels Based on Bottle Caps Core. Compos. Part B Eng. 2020, 199, 108165. [Google Scholar] [CrossRef]
- Oliveira, P.R.; Virgen, G.P.G.; Imbert, M.; Beisel, S.; May, M.; Panzera, T.H.; Hiermaier, S.; Balle, F. Ultrasonically Welded Eco-Friendly Sandwich Panels Based on Upcycled Thermoplastic Core: An Eco-Mechanical Characterisation. Resour. Conserv. Recycl. Adv. 2023, 20, 200187. [Google Scholar] [CrossRef]
- McCracken, A.; Sadeghian, P. Corrugated Cardboard Core Sandwich Beams with Bio-Based Flax Fiber Composite Skins. J. Build. Eng. 2018, 20, 114–122. [Google Scholar] [CrossRef]
- Fu, Y.; Sadeghian, P. Bio-Based Sandwich Beams Made of Paper Honeycomb Cores and Flax FRP Facings: Flexural and Shear Characteristics. Structures 2023, 54, 446–460. [Google Scholar] [CrossRef]
- Betts, D.; Sadeghian, P.; Fam, A. Experiments and Nonlinear Analysis of the Impact Behaviour of Sandwich Panels Constructed with Flax Fibre-Reinforced Polymer Faces and Foam Cores. J. Sandw. Struct. Mater. 2021, 23, 3139–3163. [Google Scholar] [CrossRef]
- Fu, Y.; Sadeghian, P. Flexural and Shear Characteristics of Bio-Based Sandwich Beams Made of Hollow and Foam-Filled Paper Honeycomb Cores and Flax Fiber Composite Skins. Thin-Walled Struct. 2020, 153, 106834. [Google Scholar] [CrossRef]
- Dinesh, S.; Kumaran, P.; Mohanamurugan, S.; Vijay, R.; Singaravelu, D.L.; Vinod, A.; Sanjay, M.R.; Siengchin, S.; Bhat, K.S. Influence of Wood Dust Fillers on the Mechanical, Thermal, Water Absorption and Biodegradation Characteristics of Jute Fiber Epoxy Composites. J. Polym. Res. 2020, 27, 9. [Google Scholar] [CrossRef]
- Chauhan, S.S.; Maurya, N.K.; Dwivedi, S.P. Effect of Particle Size and Weight Percent of Different Wood Dust on the Tensile Strength of Glass Fiber Epoxy/Saw Dust Composite Using RSM. Mater. Today Proc. 2021, 47, 3936–3942. [Google Scholar] [CrossRef]
- Zhang, J.; Wang, H.; Ou, R.; Wang, Q. The Properties of Flax Fiber Reinforced Wood Flour/High Density Polyethylene Composites. J. For. Res. 2018, 29, 533–540. [Google Scholar] [CrossRef]
- Di, J.; Zuo, H.; Li, Y. Flexural Performance of Glulam Strengthened with Flax-Fiber Reinforced Polymer Composites. Wood Mater. Sci. Eng. 2023, 18, 1014–1023. [Google Scholar] [CrossRef]
- Wang, W.-H.; Huang, H.-B.; Du, H.-H.; Wang, H. Effects of Fiber Size on Short-Term Creep Behavior of Wood Fiber/HDPE Composites. Polym. Eng. Sci. 2015, 55, 693–700. [Google Scholar] [CrossRef]
- Georgiopoulos, P.; Kontou, E.; Christopoulos, A. Short-Term Creep Behavior of a Biodegradable Polymer Reinforced with Wood-Fibers. Compos. Part B Eng. 2015, 80, 134–144. [Google Scholar] [CrossRef]
- Sicomin, S.R. GreenPoxy 56: Système Epoxy Translucide; GreenPoxy: Chateauneuf-les-Martigues, France, 2016; pp. 1–7. [Google Scholar]
- BS EN ISO 178:2003; Plastics—Determination of Flexural Properties. ISO: Geneva, Switzerland, 2003; ISBN 0 580 41324 1.
- C393/C393M-20; ASTM Standard Test Method for Core Shear Properties of Sandwich Constructions by Beam Flexure. ASTM: Washington, DC, USA, 2020.
- C 364/C 364M-07; ASTM Standard Test Method for Edgewise Compressive Strength of Sandwich. ASTM: Washington, DC, USA, 2007; pp. 1–8.
- C 365/C 365M-05; ASTM Standard Test Method for Flatwise Compressive Properties of Sandwich Cores. ASTM: Washington, DC, USA, 2005.
- E328-20; ASTM Standard Test Methods for Stress Relaxation for Materials and Structures. ASTM: Washington, DC, USA, 2020.
- D2990-17; ASTM Standard Test Methods for Tensile, Compressive, and Flexural Creep and Creep-Rupture of Plastics. ASTM: Washington, DC, USA, 2017; p. 8.
- Liu, Y.; Lu, C.; Bian, S.; Hu, K.; Zheng, K.; Sun, Q. Reversible Photo-Responsive Smart Wood with Resistant to Extreme Weather. J. Mater. Sci. 2022, 57, 3337–3347. [Google Scholar] [CrossRef]
- Renner, K.; Móczó, J.; Pukánszky, B. Deformation and Failure of PP Composites Reinforced with Lignocellulosic Fibers: Effect of Inherent Strength of the Particles. Compos. Sci. Technol. 2009, 69, 1653–1659. [Google Scholar] [CrossRef]
- Cho, J.; Joshi, M.S.; Sun, C.T. Effect of Inclusion Size on Mechanical Properties of Polymeric Composites with Micro and Nano Particles. Compos. Sci. Technol. 2006, 66, 1941–1952. [Google Scholar] [CrossRef]
- Fu, S.-Y.; Feng, X.-Q.; Lauke, B.; Mai, Y.-W. Effects of Particle Size, Particle/Matrix Interface Adhesion and Particle Loading on Mechanical Properties of Particulate–Polymer Composites. Compos. Part B Eng. 2008, 39, 933–961. [Google Scholar] [CrossRef]
- Ku, H.; Donald, M.; Cardona, F.; Trada, M. Flexural Properties of Sawdust-Reinforced Epoxy Composites Post-Cured in Microwaves. J. Compos. Mater. 2012, 46, 2879–2890. [Google Scholar] [CrossRef]
- Sombatsompop, N.; Chaochanchaikul, K.; Phromchirasuk, C.; Thongsang, S. Effect of Wood Sawdust Content on Rheological and Structural Changes, and Thermo-mechanical Properties of PVC/Sawdust Composites. Polym. Int. 2003, 52, 1847–1855. [Google Scholar] [CrossRef]
- Santos, P.; Parente, J.P.; Valvez, S.; Silva, M.P.; Reis, P.N.B. Hybridization Effect on the Bending Properties of Flax Composites. Procedia Struct. Integr. 2020, 25, 370–377. [Google Scholar] [CrossRef]
- Benzidane, M.A.; Benzidane, R.; Hamamousse, K.; Adjal, Y.; Sereir, Z.; Poilâne, C. Valorization of Date Palm Wastes as Sandwich Panels Using Short Rachis Fibers in Skin and Petiole “wood” as Core. Ind. Crops Prod. 2022, 177, 114436. [Google Scholar] [CrossRef]
- Kumar, R.; Jha, K.; Sharma, S.; Kumar, V.; Li, C.; Eldin, E.M.T.; Rajkumar, S.; Królczyk, G. Effect of Particle Size and Weight Fraction of SiC on the Mechanical, Tribological, Morphological, and Structural Properties of Al-5.6Zn-2.2Mg-1.3Cu Composites Using RSM: Fabrication, Characterization, and Modelling. Heliyon 2022, 8, e10602. [Google Scholar] [CrossRef]
- Cai, Y.; Liu, Z.; Gong, K.; Zhang, Y. The Effect of Reinforcement Particle Size on the Mechanical and Fracture Properties of Glass Matrix Composites. Heliyon 2023, 9, e21895. [Google Scholar] [CrossRef] [PubMed]
- Phiri, R.; Mavinkere Rangappa, S.; Siengchin, S.; Oladijo, O.P.; Ozbakkaloglu, T. Advances in Lightweight Composite Structures and Manufacturing Technologies: A Comprehensive Review. Heliyon 2024, 10, e39661. [Google Scholar] [CrossRef] [PubMed]
- Sivalingam, P.; Vijayan, K.; Mouleeswaran, S.; Vellingiri, V.; Mayilswamy, S. On the Tensile and Compressive Behavior of a Sandwich Panel Made of Flax Fiber and Agglomerated Cork. Proc. Inst. Mech. Eng. Part L J. Mater. Des. Appl. 2022, 236, 180–189. [Google Scholar] [CrossRef]
- Fu, Z.; Lu, Y.; Wu, G.; Bai, L.; Barker-Rothschild, D.; Lyu, J.; Liu, S.; Rojas, O.J. Wood Elasticity and Compressible Wood-Based Materials: Functional Design and Applications. Prog. Mater. Sci. 2025, 147, 101354. [Google Scholar] [CrossRef]
- Huang, S.; Fu, Q.; Yan, L.; Kasal, B. Characterization of Interfacial Properties between Fibre and Polymer Matrix in Composite Materials—A Critical Review. J. Mater. Res. Technol. 2021, 13, 1441–1484. [Google Scholar] [CrossRef]
- Matuana, L.M.; Stark, N.M. The Use of Wood Fibers as Reinforcements in Composites; Biofiber Reinforcements in Composite Materials; Woodhead Publishing: Cambridge, UK, 2015; ISBN 9781782421276. [Google Scholar]
- Yin, W.; Zhao, Z.; Lin, H.; Ma, P. Advances in Creep Behaviors of Textile Composites. Appl. Compos. Mater. 2023, 30, 1949–1978. [Google Scholar] [CrossRef]
- Li, X.; Liu, W.; Fang, H.; Huo, R.; Wu, P. Flexural Creep Behavior and Life Prediction of GFRP-Balsa Sandwich Beams. Compos. Struct. 2019, 224, 111009. [Google Scholar] [CrossRef]
- Houshyar, S.; Shanks, R.A.; Hodzic, A. Tensile Creep Behaviour of Polypropylene Fibre Reinforced Polypropylene Composites. Polym. Test. 2005, 24, 257–264. [Google Scholar] [CrossRef]
- Reis, P.N.B.; Silva, M.P.; Santos, P.; Parente, J.M.; Valvez, S.; Bezazi, A. Mechanical Performance of an Optimized Cork Agglomerate Core-Glass Fibre Sandwich Panel. Compos. Struct. 2020, 245, 112375. [Google Scholar] [CrossRef]
- Park, B.; Balatinecz, J.J. Short Term Flexural Creep Behavior of Wood-fiber/Polypropylene Composites. Polym. Compos. 1998, 19, 377–382. [Google Scholar] [CrossRef]
- Almeida, J.H.S.; Ornaghi, H.L.; Lorandi, N.P.; Bregolin, B.P.; Amico, S.C. Creep and Interfacial Behavior of Carbon Fiber Reinforced Epoxy Filament Wound Laminates. Polym. Compos. 2018, 39, E2199–E2206. [Google Scholar] [CrossRef]
- Reis, P.N.B.; Silva, M.P.; Santos, P.; Parente, J.M.; Bezazi, A. Viscoelastic Behaviour of Composites with Epoxy Matrix Filled by Cork Powder. Compos. Struct. 2020, 234, 111669. [Google Scholar] [CrossRef]
- Janeiro-Arocas, J.; Tarrío-Saavedra, J.; López-Beceiro, J.; Naya, S.; López-Canosa, A.; Heredia-García, N.; Artiaga, R. Creep Analysis of Silicone for Podiatry Applications. J. Mech. Behav. Biomed. Mater. 2016, 63, 456–469. [Google Scholar] [CrossRef]
- Gomes, A.S.; Fiadeiro, P.T.; Vieira, A.C.; Vieira, J.C. Viability Study of Serra Da Estrela Dog Wool to Produce Green Composites. Polymers 2024, 16, 718. [Google Scholar] [CrossRef] [PubMed]
- Mohammed, M.; Rahman, R.; Mohammed, A.M.; Adam, T.; Betar, B.O.; Osman, A.F.; Dahham, O.S. Surface Treatment to Improve Water Repellence and Compatibility of Natural Fiber with Polymer Matrix: Recent Advancement. Polym. Test. 2022, 115, 107707. [Google Scholar] [CrossRef]
- Mohammed, M.; Ja’afar Mohamad Jawad, A.; Mohammed, A.M.; Oleiwi, J.K.; Adam, T.; Osman, A.F.; Dahham, O.S.; Betar, B.O.; Gopinath, S.C.B.; Jaafar, M. Challenges and Advancement in Water Absorption of Natural Fiber-Reinforced Polymer Composites. Polym. Test. 2023, 124, 108083. [Google Scholar] [CrossRef]
- Ayrilmis, N.; Jarusombuti, S.; Fueangvivat, V.; Bauchongkol, P. Effect of Thermal-Treatment of Wood Fibres on Properties of Flat-Pressed Wood Plastic Composites. Polym. Degrad. Stab. 2011, 96, 818–822. [Google Scholar] [CrossRef]
- Monticeli, F.M.; Ornaghi, H.L.; Neves, R.M.; Odila Hilário Cioffi, M. Creep/Recovery and Stress-Relaxation Tests Applied in a Standardized Carbon Fiber/Epoxy Composite: Design of Experiment Approach. J. Strain Anal. Eng. Des. 2020, 55, 109–117. [Google Scholar] [CrossRef]
- Varghese, S.; Kuriakose, B.; Thomas, S. Stress Relaxation in Short Sisal-fiber-reinforced Natural Rubber Composites. J. Appl. Polym. Sci. 1994, 53, 1051–1060. [Google Scholar] [CrossRef]
- George, J.; Sreekala, M.S.; Thomas, S.; Bhagawan, S.S.; Neelakantan, N.R. Stress Relaxation Behavior of Short Pineapple Fiber Reinforced Polyethylene Composites. J. Reinf. Plast. Compos. 1998, 17, 651–672. [Google Scholar] [CrossRef]
- Sreekala, M.S.; Kumaran, M.G.; Joseph, R.; Thomas, S. Stress-Relaxation Behaviour in Composites Based on Short Oil-Palm Fibres and Phenol Formaldehyde Resin. Compos. Sci. Technol. 2001, 61, 1175–1188. [Google Scholar] [CrossRef]
- Obaid, N.; Kortschot, M.T.; Sain, M. Understanding the Stress Relaxation Behavior of Polymers Reinforced with Short Elastic Fibers. Materials 2017, 10, 472. [Google Scholar] [CrossRef] [PubMed]
- Vaidyanathan, T.K.; Vaidyanathan, J. Validity of Predictive Models of Stress Relaxation in Selected Dental Polymers. Dent. Mater. 2015, 31, 799–806. [Google Scholar] [CrossRef] [PubMed]
- Sethi, S.; Ray, B.C. Environmental Effects on Fibre Reinforced Polymeric Composites: Evolving Reasons and Remarks on Interfacial Strength and Stability. Adv. Colloid Interface Sci. 2015, 217, 43–67. [Google Scholar] [CrossRef]
- Okolie, O.; Latto, J.; Faisal, N.; Jamieson, H.; Mukherji, A.; Njuguna, J. Manufacturing Defects in Thermoplastic Composite Pipes and Their Effect on the In-Situ Performance of Thermoplastic Composite Pipes in Oil and Gas Applications; Springer: Dordrecht, The Netherlands, 2023; Volume 30, ISBN 0123456789. [Google Scholar]

Disclaimer/Publisher’s Note: The statements, opinions and data contained in all publications are solely those of the individual author(s) and contributor(s) and not of MDPI and/or the editor(s). MDPI and/or the editor(s) disclaim responsibility for any injury to people or property resulting from any ideas, methods, instructions or products referred to in the content. |
© 2025 by the authors. Licensee MDPI, Basel, Switzerland. This article is an open access article distributed under the terms and conditions of the Creative Commons Attribution (CC BY) license (https://creativecommons.org/licenses/by/4.0/).