Article

Sustainable Mobile Phone Waste Management: Behavioral Insights and Educational Interventions Through a University-Wide Survey

by
Silvia Serranti
1,*,
Riccardo Gasbarrone
2,
Roberta Palmieri
1 and
Giuseppe Bonifazi
1
1
Department of Chemical Engineering, Materials and Environment, Sapienza University of Rome, via Eudossiana 18, 00184 Rome, Italy
2
Research and Service Center for Sustainable Technological Innovation (Ce.R.S.I.Te.S.), Sapienza University of Rome, 04100 Latina, Italy
*
Author to whom correspondence should be addressed.
Recycling 2025, 10(4), 129; https://doi.org/10.3390/recycling10040129
Submission received: 21 May 2025 / Revised: 25 June 2025 / Accepted: 27 June 2025 / Published: 1 July 2025

Abstract

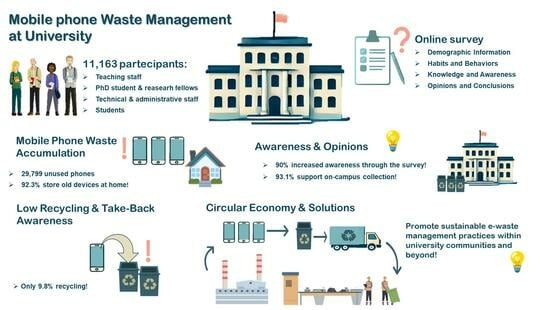
Mobile phone waste management is a growing environmental challenge, with improper disposal contributing to resource depletion, pollution and missed opportunities for material recovery. This study presents the findings of a dual-purpose survey (11,163 respondents) conducted in a wide academic context in Italy, aimed at both assessing mobile phones disposal behaviors and knowledge and raising awareness through structured educational prompts about sustainable e-waste management. The results reveal significant behavioral patterns and knowledge gaps across demographic groups. While most respondents (90.6%) own one phone, males tend to have more than females. Phones are replaced every 3–5 years by 48.8% of users and every 1–3 years by 36.7%, with students tending to replace them earlier. Only 20.2% replace their phone when irreparable while 46% replace them due to high repair costs. A large majority (92.3%) store old devices at home, forming an estimated urban mine of 29,799 unused phones. The awareness of hazardous components is higher than that of critical raw materials, with males more informed than females and students in scientific fields displaying greater awareness than those in humanities and health disciplines. The awareness of official take-back programs is particularly low, especially among younger generations. Notably, 90% reported increased awareness from the educational survey and 93.1% expressed willingness to use an on-campus e-waste collection system. These results highlight the role of universities as catalysts for sustainable behavior, supporting the design of targeted educational strategies and policy actions in line with circular economy principles and Sustainable Development Goal 12 “Responsible consumption and production”.

Graphical Abstract

1. Introduction

1.1. The Growing Challenge of Mobile Phone Waste: Environmental, Economic and Policy Perspectives

The digital revolution has transformed communication, education and industry, making mobile phones (MPs) an indispensable part of daily life. Due to the rapid evolution of technology, coupled with market pressures on consumers, MP ownership has surged, with 112 subscriptions per 100 inhabitants, and 4 out of 5 people aged 10 years or older owning an MP [1,2]. However, this growth has led to significant challenges, especially concerning the generation of a huge quantity of electronic waste (e-waste) and its sustainable management [3,4].
In 2022, e-waste generation reached 62 billion kg, with projections indicating an increase to 82 billion kg by 2030 [5]. Among e-waste, the small IT and telecommunication equipment category, including MPs, accounted for 4.6 billion kg, but only 1 billion kg (22%) was collected for recycling. The collection rate for MPs is even lower, being estimated at 15% in Europe [6,7], highlighting the urgent need for better disposal and recycling strategies [8].
E-waste contains up to 60 distinct chemical elements, including both hazardous and valuable ones [9,10]. Despite their small size, MPs are among the most environmentally and economically significant categories of e-waste. They contain hazardous components like brominated flame retardants, lead and other toxic elements, which pose significant environmental and health risks. Improper disposal can lead to soil, water and air contamination, impacting both ecosystems and human health [11,12]. At the same time, MPs contain valuable resources, such as most of the strategic and critical raw materials (CRMs) identified by the European Union (EU), including rare earth elements (REEs), as essential for sustainable technological development [13]. Such CRMs, which are economically important and subject to high supply risk, come from non-renewable resources often concentrated in geopolitically unstable regions (e.g., cobalt from the Democratic Republic of Congo) or dominated by a few countries (i.e., China for REEs). Furthermore, MPs contain also precious metals, such as gold, whose grade is usually five to ten times more than that of gold ores [14]. Thus, recycling MPs is not only fundamental to reduce environmental impact but also to enhance resource efficiency and economic resilience [15,16], aligning with the United Nations’ Sustainable Development Goals (SDGs) and the European Green Deal, which emphasize circular economy principles and responsible consumption [17].
In response to these challenges, governments and international organizations have introduced regulatory measures to improve e-waste management [18]. In Europe, the Waste Electrical and Electronic Equipment (WEEE) directive (Directive 2012/19/EU) aims to enhance e-waste collection and recycling, while the Circular Economy Action Plan focuses on resource recovery, particularly for CRMs [13]. However, a key barrier to effective e-waste management is low consumer awareness and participation in recycling programs [19,20].
Educational campaigns play a critical role in fostering responsible e-waste behavior among consumers, addressing knowledge gaps and encouraging sustainable habits. Effective recycling practices are particularly important, given the influence of consumer behavior [21], specifically how individuals choose to dispose of their old devices rather than storing them at home due to their small size [22,23].

1.2. Universities as Key Drivers in Promoting Sustainable E-Waste Management: The Survey as an Educational Tool

Universities have a fundamental role in promoting sustainable practices and responsible e-waste management within their communities and beyond [24,25,26]. As microcosms of society, universities bring together students, teaching and technical–administrative staff from different disciplines and backgrounds, making them ideal contexts for studying environmental attitudes and awareness and fostering sustainable behaviors [27].
Higher education institutions can drive behavioral change by integrating e-waste awareness campaigns, take-back programs and circular economy principles into their curricula and campus infrastructure [28]. By educating the academic community on the importance of proper e-waste disposal, universities can help shape behaviors that extend beyond the campus and influence the wider public. Additionally, universities have the potential to establish collection infrastructure that enables efficient e-waste recycling and resource recovery.
This study presents the findings of a survey titled “End-of-life mobile phones management”, carried out at Sapienza University of Rome (Italy), one of the largest and oldest educational institutions in Europe.
The survey had a dual objective: (1) to assess behaviors and knowledge levels related to the management of spent MPs and (2) to educate and raise awareness by providing information on MPs characteristics, including the environmental risks of improper disposal, the presence of valuable recyclable materials and sustainable disposal methods.
Unlike traditional surveys that solely collect data on behaviors and knowledge, this study was also designed as an educational tool. Respondents were provided with key information throughout the questionnaire and were asked for feedback on whether the survey had increased their awareness, allowing an assessment of its effectiveness. This dual role of the survey was intended not only to highlight the environmental risks of improper mobile phone disposal but also to encourage engagement by emphasizing the potential for meaningful individual action within a circular economy framework.
Several surveys on mobile phone waste management have been performed in many different countries [24,29]; to the best of our knowledge, this is the largest survey conducted in Italy on MP waste management, with over 11,000 responses. Existing studies on mobile phone waste behavior in this country have typically examined smaller sample sizes or broader WEEE categories [8,19], often focusing on specific behavioral aspects, making this study a benchmark for large-scale research in this field. Furthermore, the findings of this study have been compared with those from previous research to provide a broader context for interpreting the results.
The results offer valuable insights into e-waste attitudes, behavioral trends and knowledge gaps, contributing to the development of a more environmentally conscious academic community. Furthermore, these findings serve as a foundation for targeted educational campaigns and policy interventions, supporting improved e-waste management beyond the academic community, aligning with the United Nations’ SDGs, particularly SDG12: “Responsible consumption and production”.

1.3. The Structure of the Paper

This paper is organized as follows. Section 2 presents and discusses the results of the survey in light of the existing literature, focusing on mobile phone end-of-life behaviors, levels of awareness and attitudes across different segments of the academic population, including gender, age and disciplinary background. This section also highlights key statistical findings and behavioral trends relevant to sustainable mobile phone management.
Section 3 outlines the methodological framework of the study, detailing the survey design, distribution and data collection. It also describes the statistical analyses performed and their relevance for interpreting the data.
Section 4 outlines the conclusions, providing a summary of the main findings and discussing their implications for environmental education and policy. It offers targeted recommendations for institutional decision-makers and outlines the role that universities can play as catalysts for responsible e-waste management, aligning with broader United Nations’ SDGs.

2. Results and Discussion

2.1. General Information (GI)

The main demographic information of the participants is shown in Table 1. Additional details on faculty and program affiliation are reported in the Supplementary Materials.
The survey had 11,163 participants in total.
The studied population was categorized into four groups: (1) teaching staff; (2) PhD student and research fellow; (3) student; and (4) technical–administrative staff.
These groups include individuals with diverse ages, educational backgrounds and societal roles and a balanced gender distribution, making them a representative microcosm of the broader population. More specifically, the sample offers a strong level of representativeness within the academic and urban context, particularly among younger and educated demographics, while also providing valuable insights applicable for similar environments. Furthermore, since universities are recognized as drivers of behavioral change and innovation, this community represents a relevant and strategic setting to explore e-waste management behaviors and awareness and to develop targeted educational and policy interventions.
The survey respondents were primarily students (81.73%), followed by technical–administrative staff (6.81%), teaching staff (6.47%), and PhD students and research fellows (4.98%). Females (61.1%) participated slightly more than males (38.6%), reflecting Sapienza’s gender distribution. Most respondents were 20–29 years old (69.3%), with students dominating this age group (82.3%). Teaching and administrative staff mainly fell within the 40–70 age range, while PhD students and research fellows were mostly 20–39 years old.
The teaching staff was composed mainly of associate professors (39.97%), followed by assistant professors (20.61%) and full professors (18.52%). The PhD student and research fellow group was led by PhD students and medical residents (66.91%), followed by research fellows (17.90%).

2.2. Habits and Behaviors (HBs) Towards EOL Mobile Phone Management

2.2.1. Mobile Phone Ownership and Replacement Frequency

The results for questions HB01, “How many mobile phones do you own?”, and HB02, “How often do you replace your mobile phone?”, are reported in Figure 1. Most survey respondents (90.6%) own one MP, whereas 7.3% possess two MPs, 1.1% three MPs and 1.0% more than three, with just 0.1% declaring they do not possess an MP (Figure 1a). An interesting result was observed in terms of respondents’ gender and role in the university (Figure 1b,c, respectively): males (13.7%) tend to own more than one MP than females (6.59%), as highlighted by the performed Chi-Square test (X2 = 158.49, Degree of Freedom DoF = 1, p < 0.05). This is also true when considering the roles investigated (X2 = 231.056, DoF = 14, p < 0.05). A similar behavior was also observed by [30] in an exploratory survey on the consumption and recycling of smartphones and tablets carried out in Portugal.
Regarding the frequency of MP replacement (Figure 1d,e), most respondents (48.81%) change their MPs every 3–5 years, highlighting a balanced approach between tech adoption and keeping the device for a reasonable duration (Figure 1d). However, a large portion of the respondents (36.75%) replace their phones within relatively short intervals (i.e., every 1–3 years), and a small fraction of the participants (0.56%) replace their phones within the first year. These data are consistent with some previous surveys elaborating on how the replacement of smartphones was on average 21 months [31] or 2–3 years [24]. In fact, a drastic reduction in the average lifespan of MPs has been observed [32], decreasing from around 5 years during the 2000s [33] to 2–3 years in the last decade [29,34].
Among the analyzed population (Figure 1e), the “student” category, followed by the “PhD students and research fellow category”, appears to exhibit a stronger inclination to replace their discarded phones earlier than “teaching staff” and “technical and administrative staff” (X2 = 241.58, DoF = 12, p < 0.05). This is in line with previous studies, in which it was evaluated that young individuals tend to change their MP earlier [24], usually within 2 years [35,36]. This trend is likely linked to the younger age of individuals in these roles, as younger people tend to adopt new technology more quickly and may have a higher preference for staying updated with the latest MP models.

2.2.2. Reasons for Mobile Phone Replacement and Technical Conditions

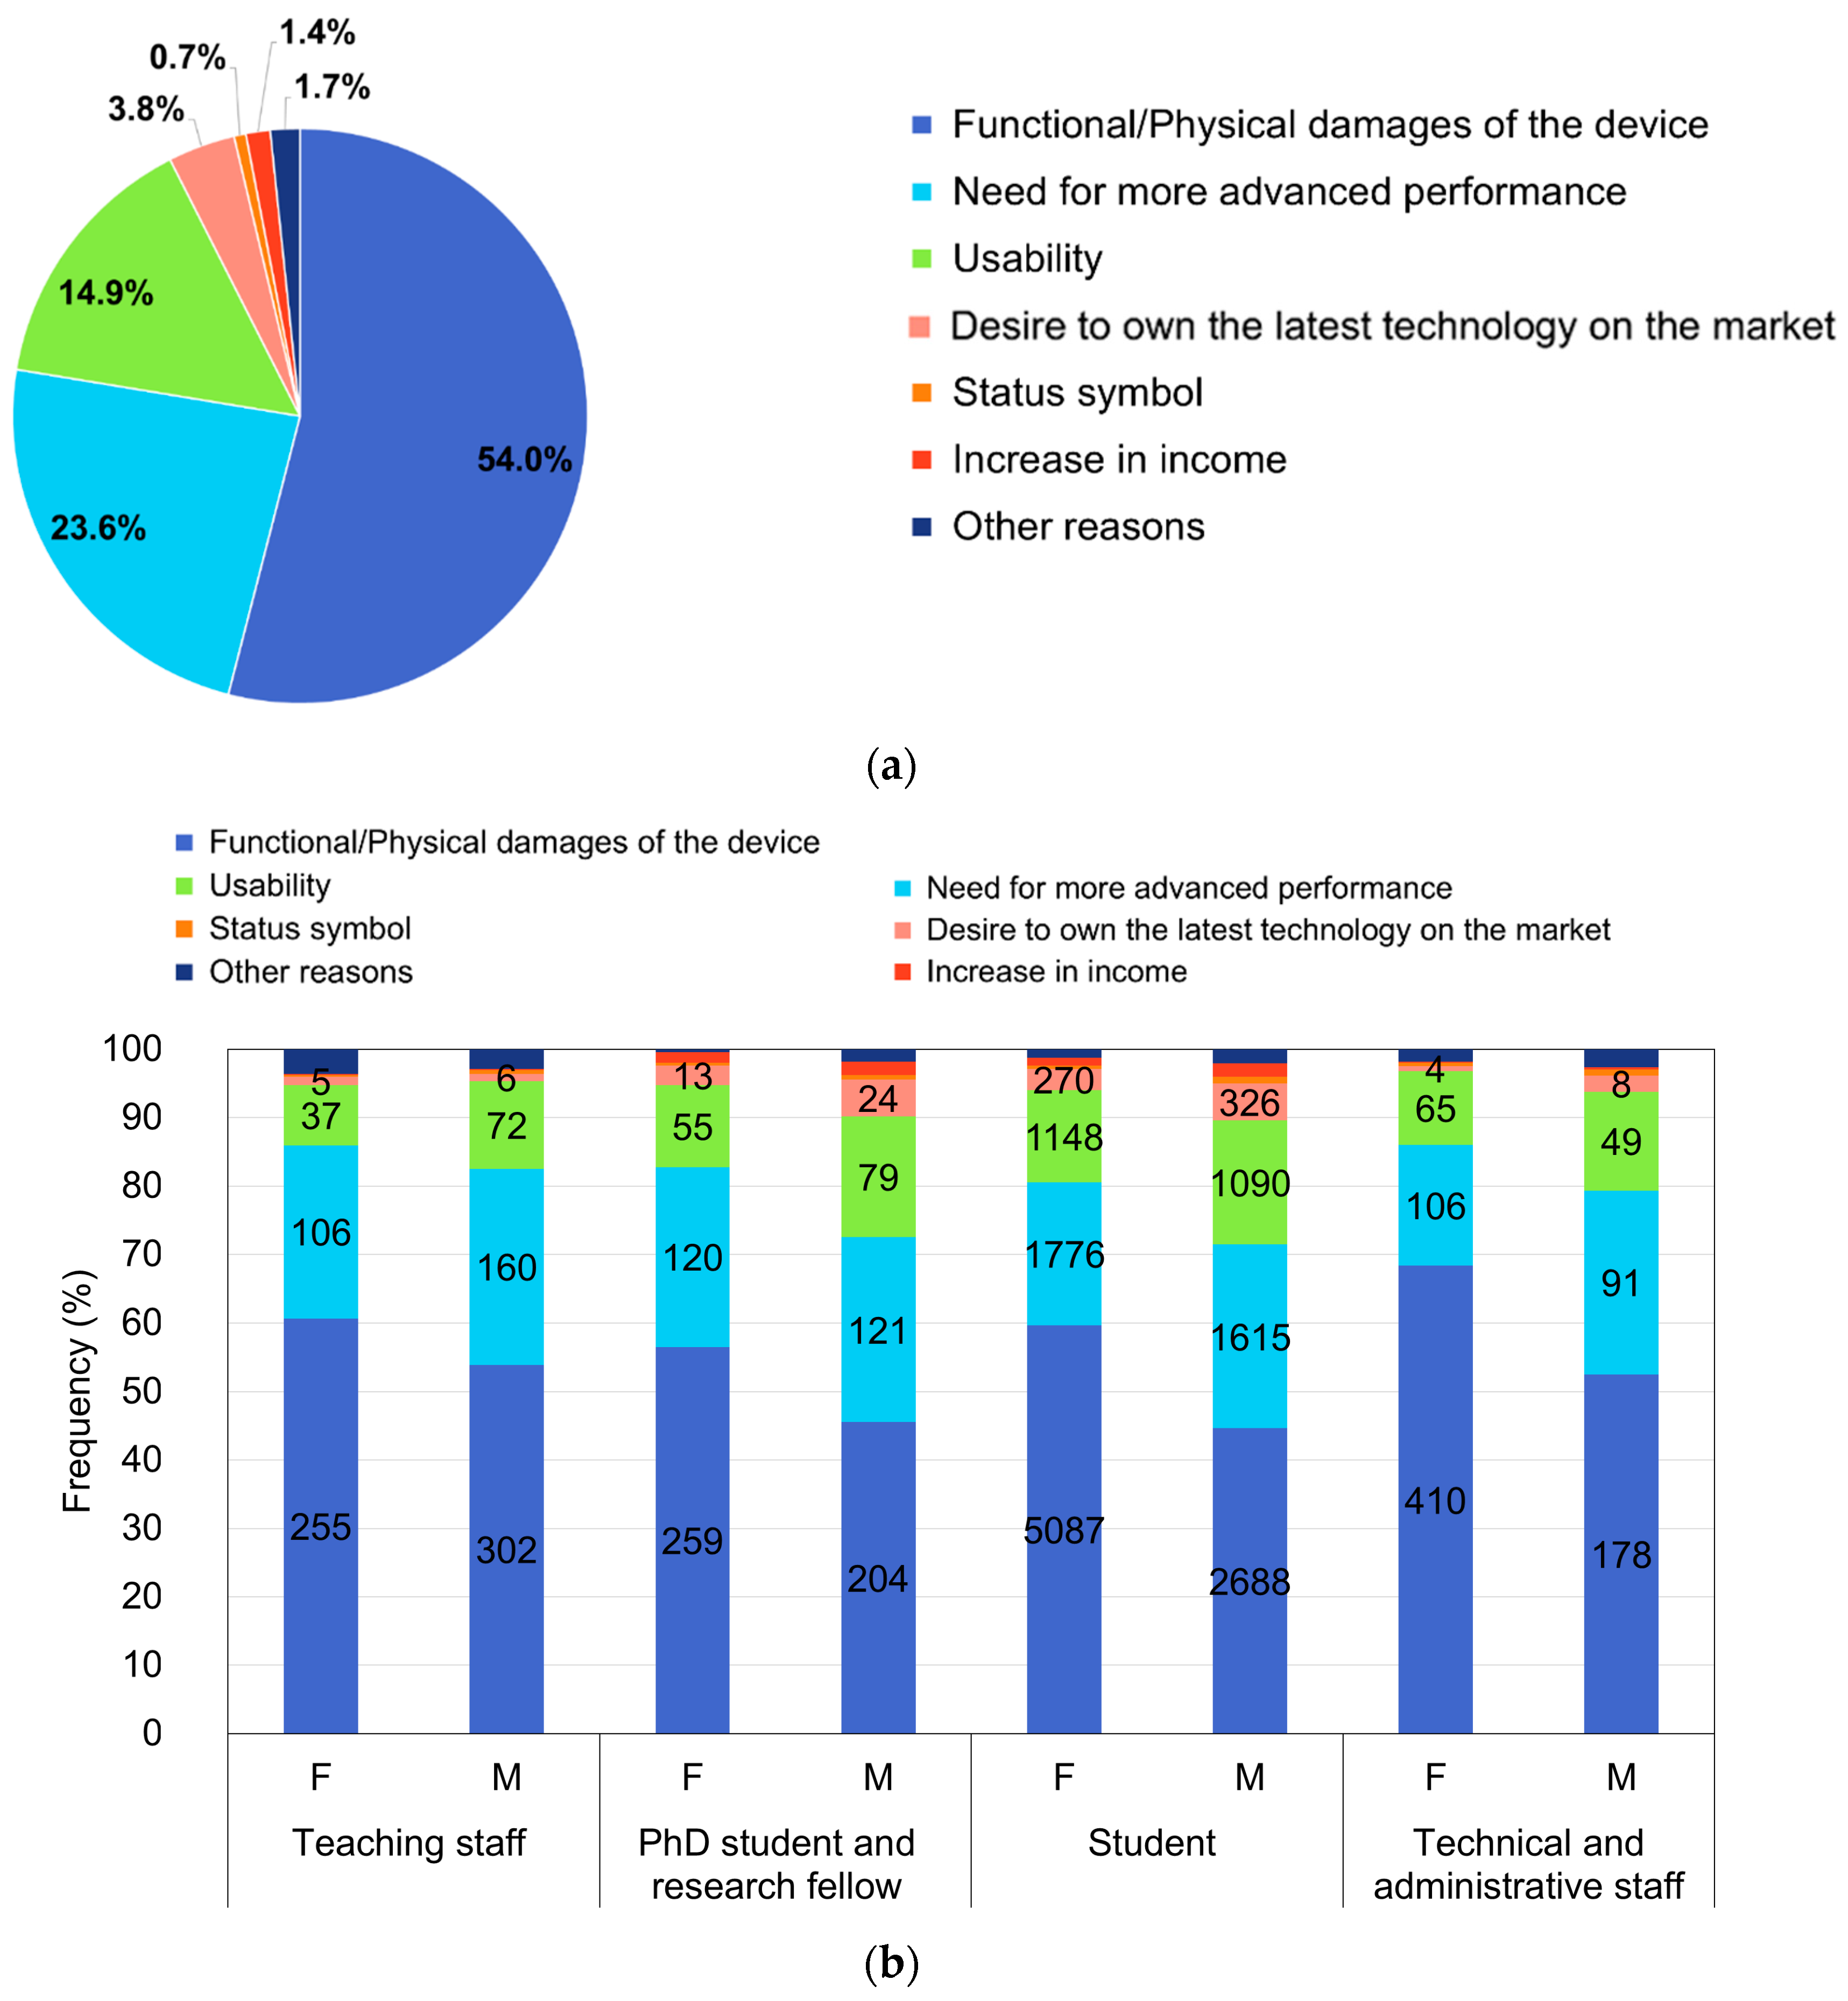
Regarding the reasons for MP replacement (Figure 2a), the results show that “Functional/Physical damages of the device” is by far the most common response (54.0%), in agreement with other studies [24,29,30,37], followed by “Need for more advanced performance” (23.6%) and “Usability” (14.9%). A small number of people replace their MP for the “Desire to own the latest technology” (5.0%), “Increase in income” (1.4%), “Status symbol” (0.7%) and “Other reasons” (1.7%).
Considering the distribution of answers among the different roles of respondents subdivided in males and females (Figure 2b), it can be noticed as females, across all roles, tend to replace their MPs more frequently due to “Functional/Physical damage of the device” compared to males (F(1,48) = 13.469, p < 0.05). Conversely, males show a higher tendency to replace their phones for reasons such as “Need for more advanced performances”, “Usability”, “Desire to own the latest technology on the market” and “Status symbol”. Furthermore, the answer “Increase in income” is selected more by students and PhD and research fellows (younger people) than the other categories (F(3,48) = 8.154, p < 0.05), probably for reasons related to their lower economic availability.
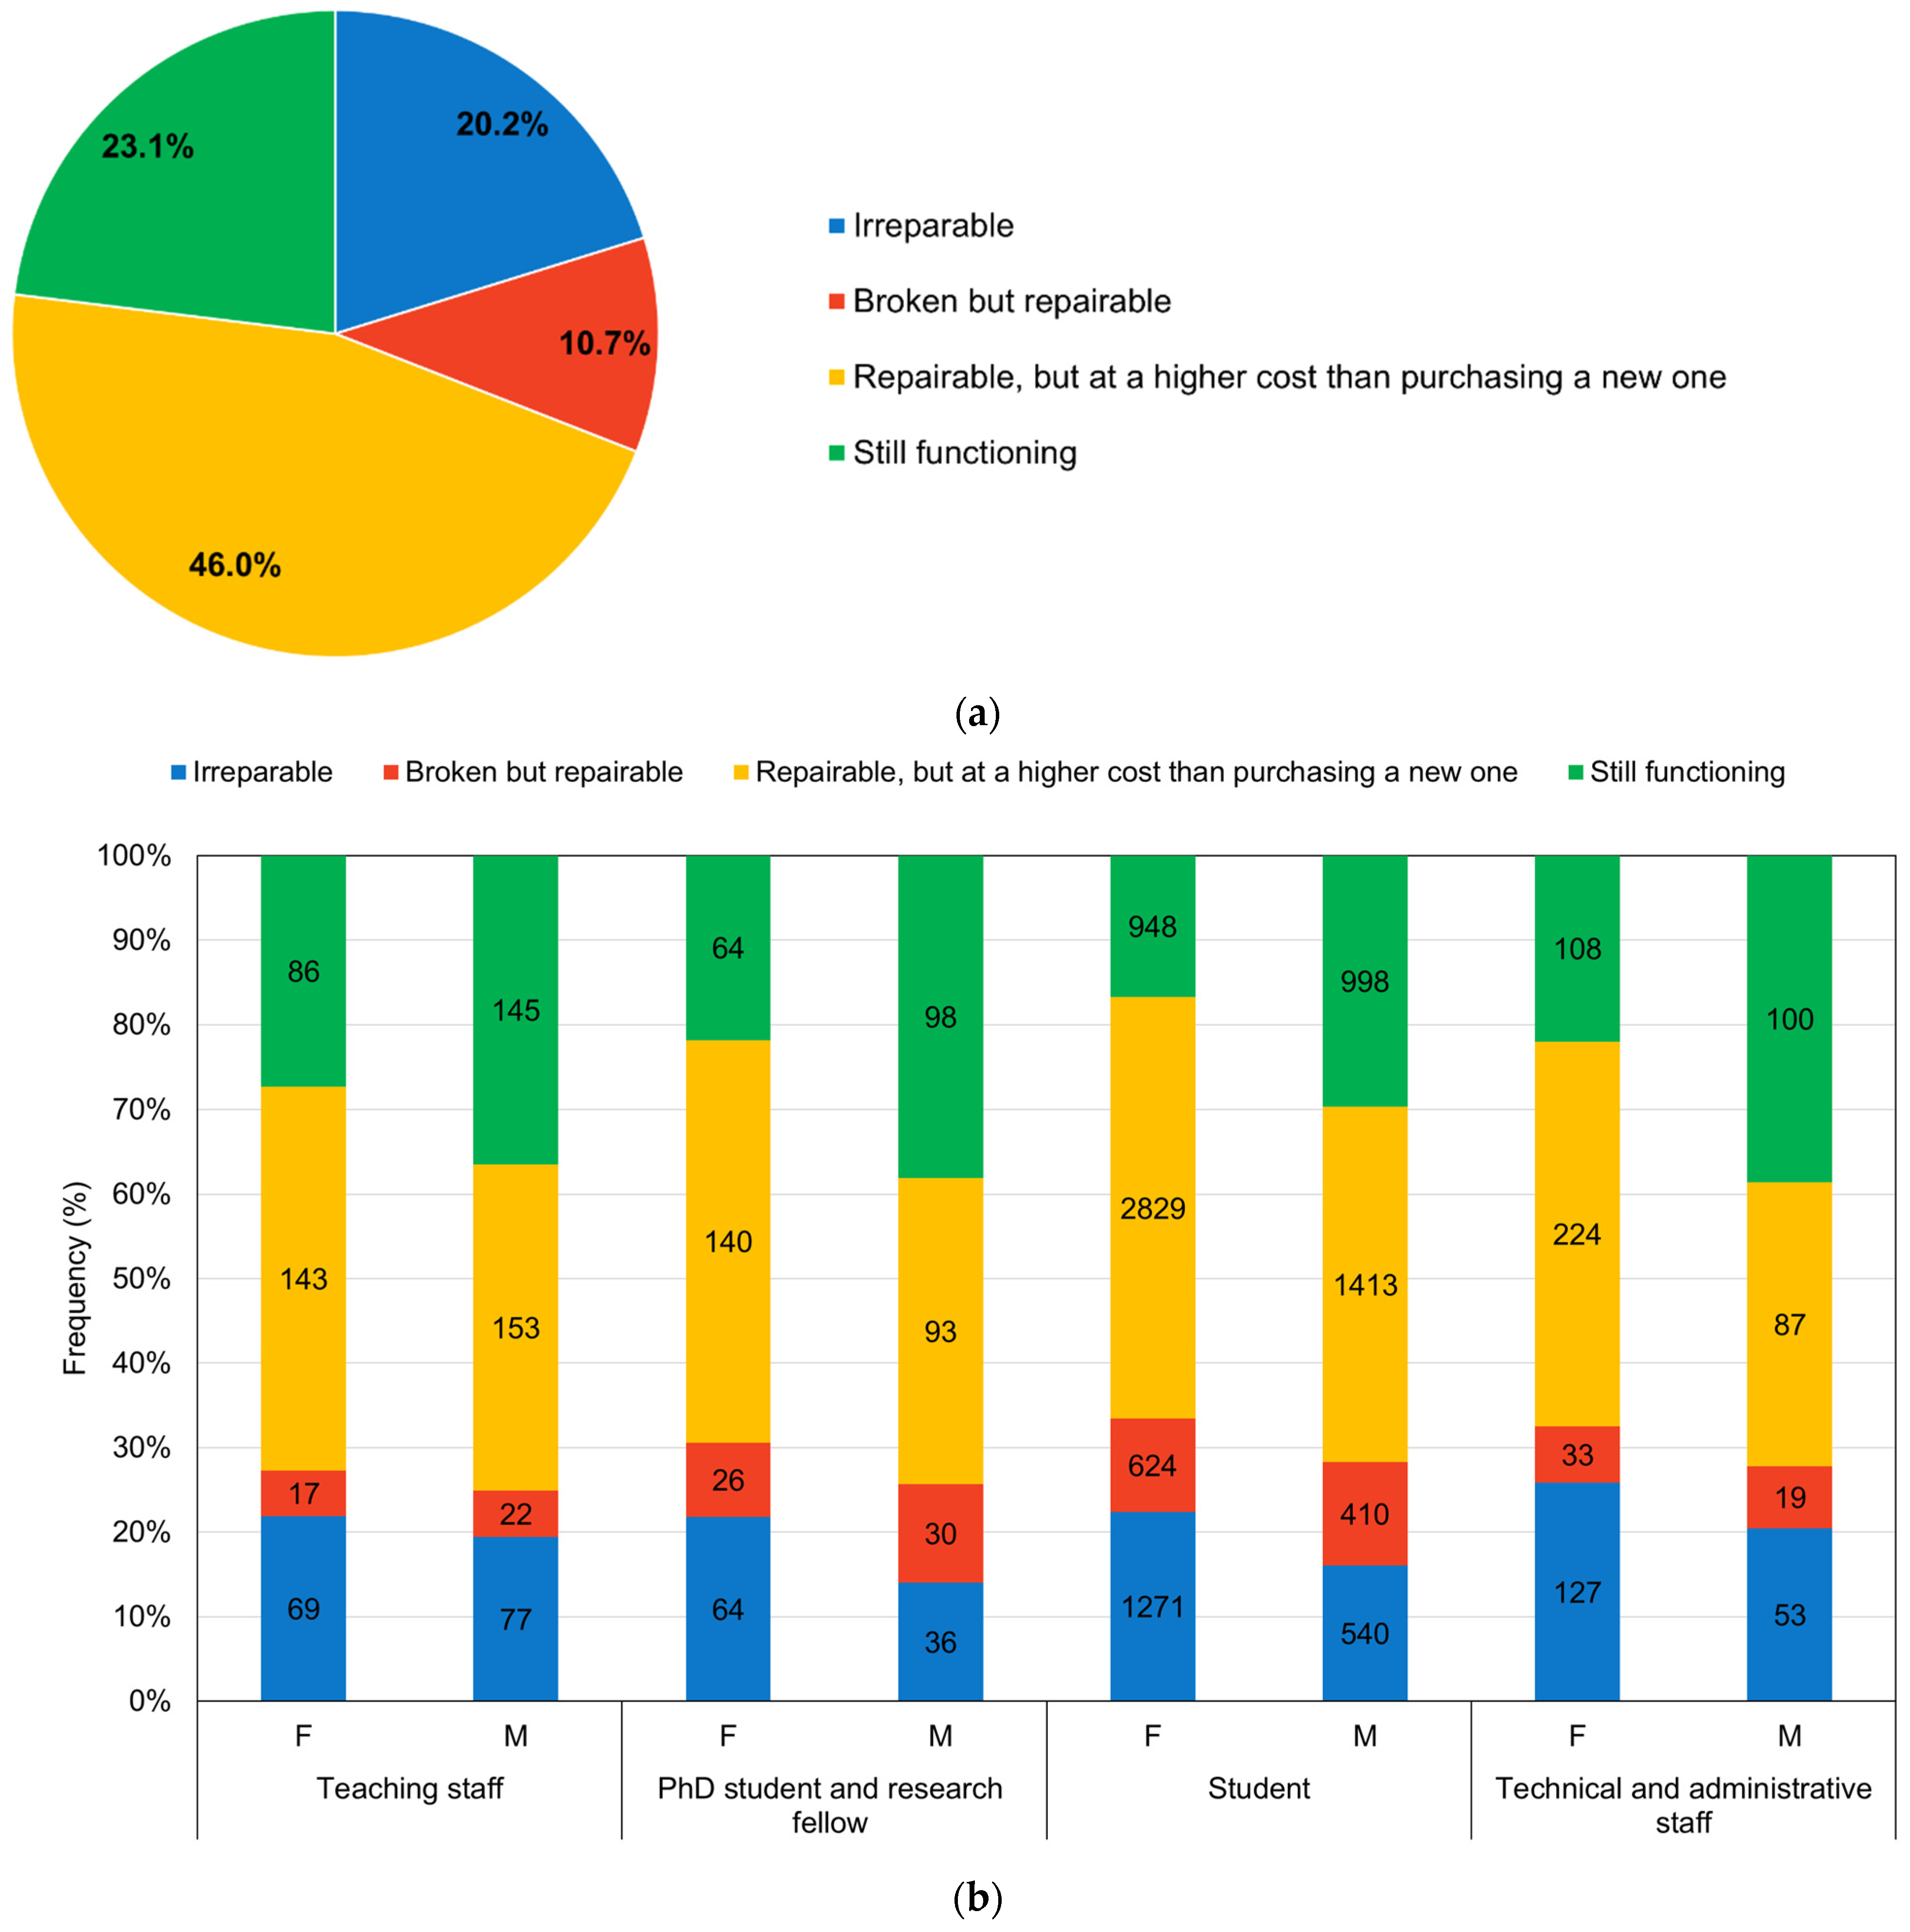
The distribution of answers to the question “What condition is your MP in when you decide to replace it?” (Figure 3) shows that only 20.2% of respondents replace an irreparable MP, which is surprisingly even less than the % for “Still functioning” (23.1%) (Figure 3a). The most selected answer was “Repairable, but at a higher cost than purchasing a new one” (46.0%), whereas the least selected answer was “Broken but repairable” (10.7%). Such results confirm what was found in the previous question concerning the reasons for buying a new MP and are in agreement with previous studies [24,37].
However, the fact that the most frequently chosen response is “Repairable, but at a higher cost than purchasing a new one” suggests a significant opportunity for enhancing the sustainability of MP usage. If more affordable repair options were available, users might be more inclined to repair their existing devices rather than replacing them with new ones. This shift could lead to a more environmentally sustainable approach.
Concerning the distribution of answers among academic roles subdivided by gender (Figure 3b), the data reveal a distinct gender difference in the conditions of the replaced MP. In fact, for all roles, the percentage of females who replace their phone when it is irreparable is higher than that of males (X2 = 60.101, DoF = 1, p < 0.05). In contrast, the percentage of males for all roles is higher for the response “Still functioning,” than that of females (X2 = 271.992, DoF = 1, p < 0.05). Such a result agrees with the findings of [30]. This difference could reflect varying attitudes toward technology and device management between genders, with males possibly placing greater emphasis on upgrading to newer models or maintaining up-to-date technology, while females may be less interested in the latest technology or more aware about sustainability issues.
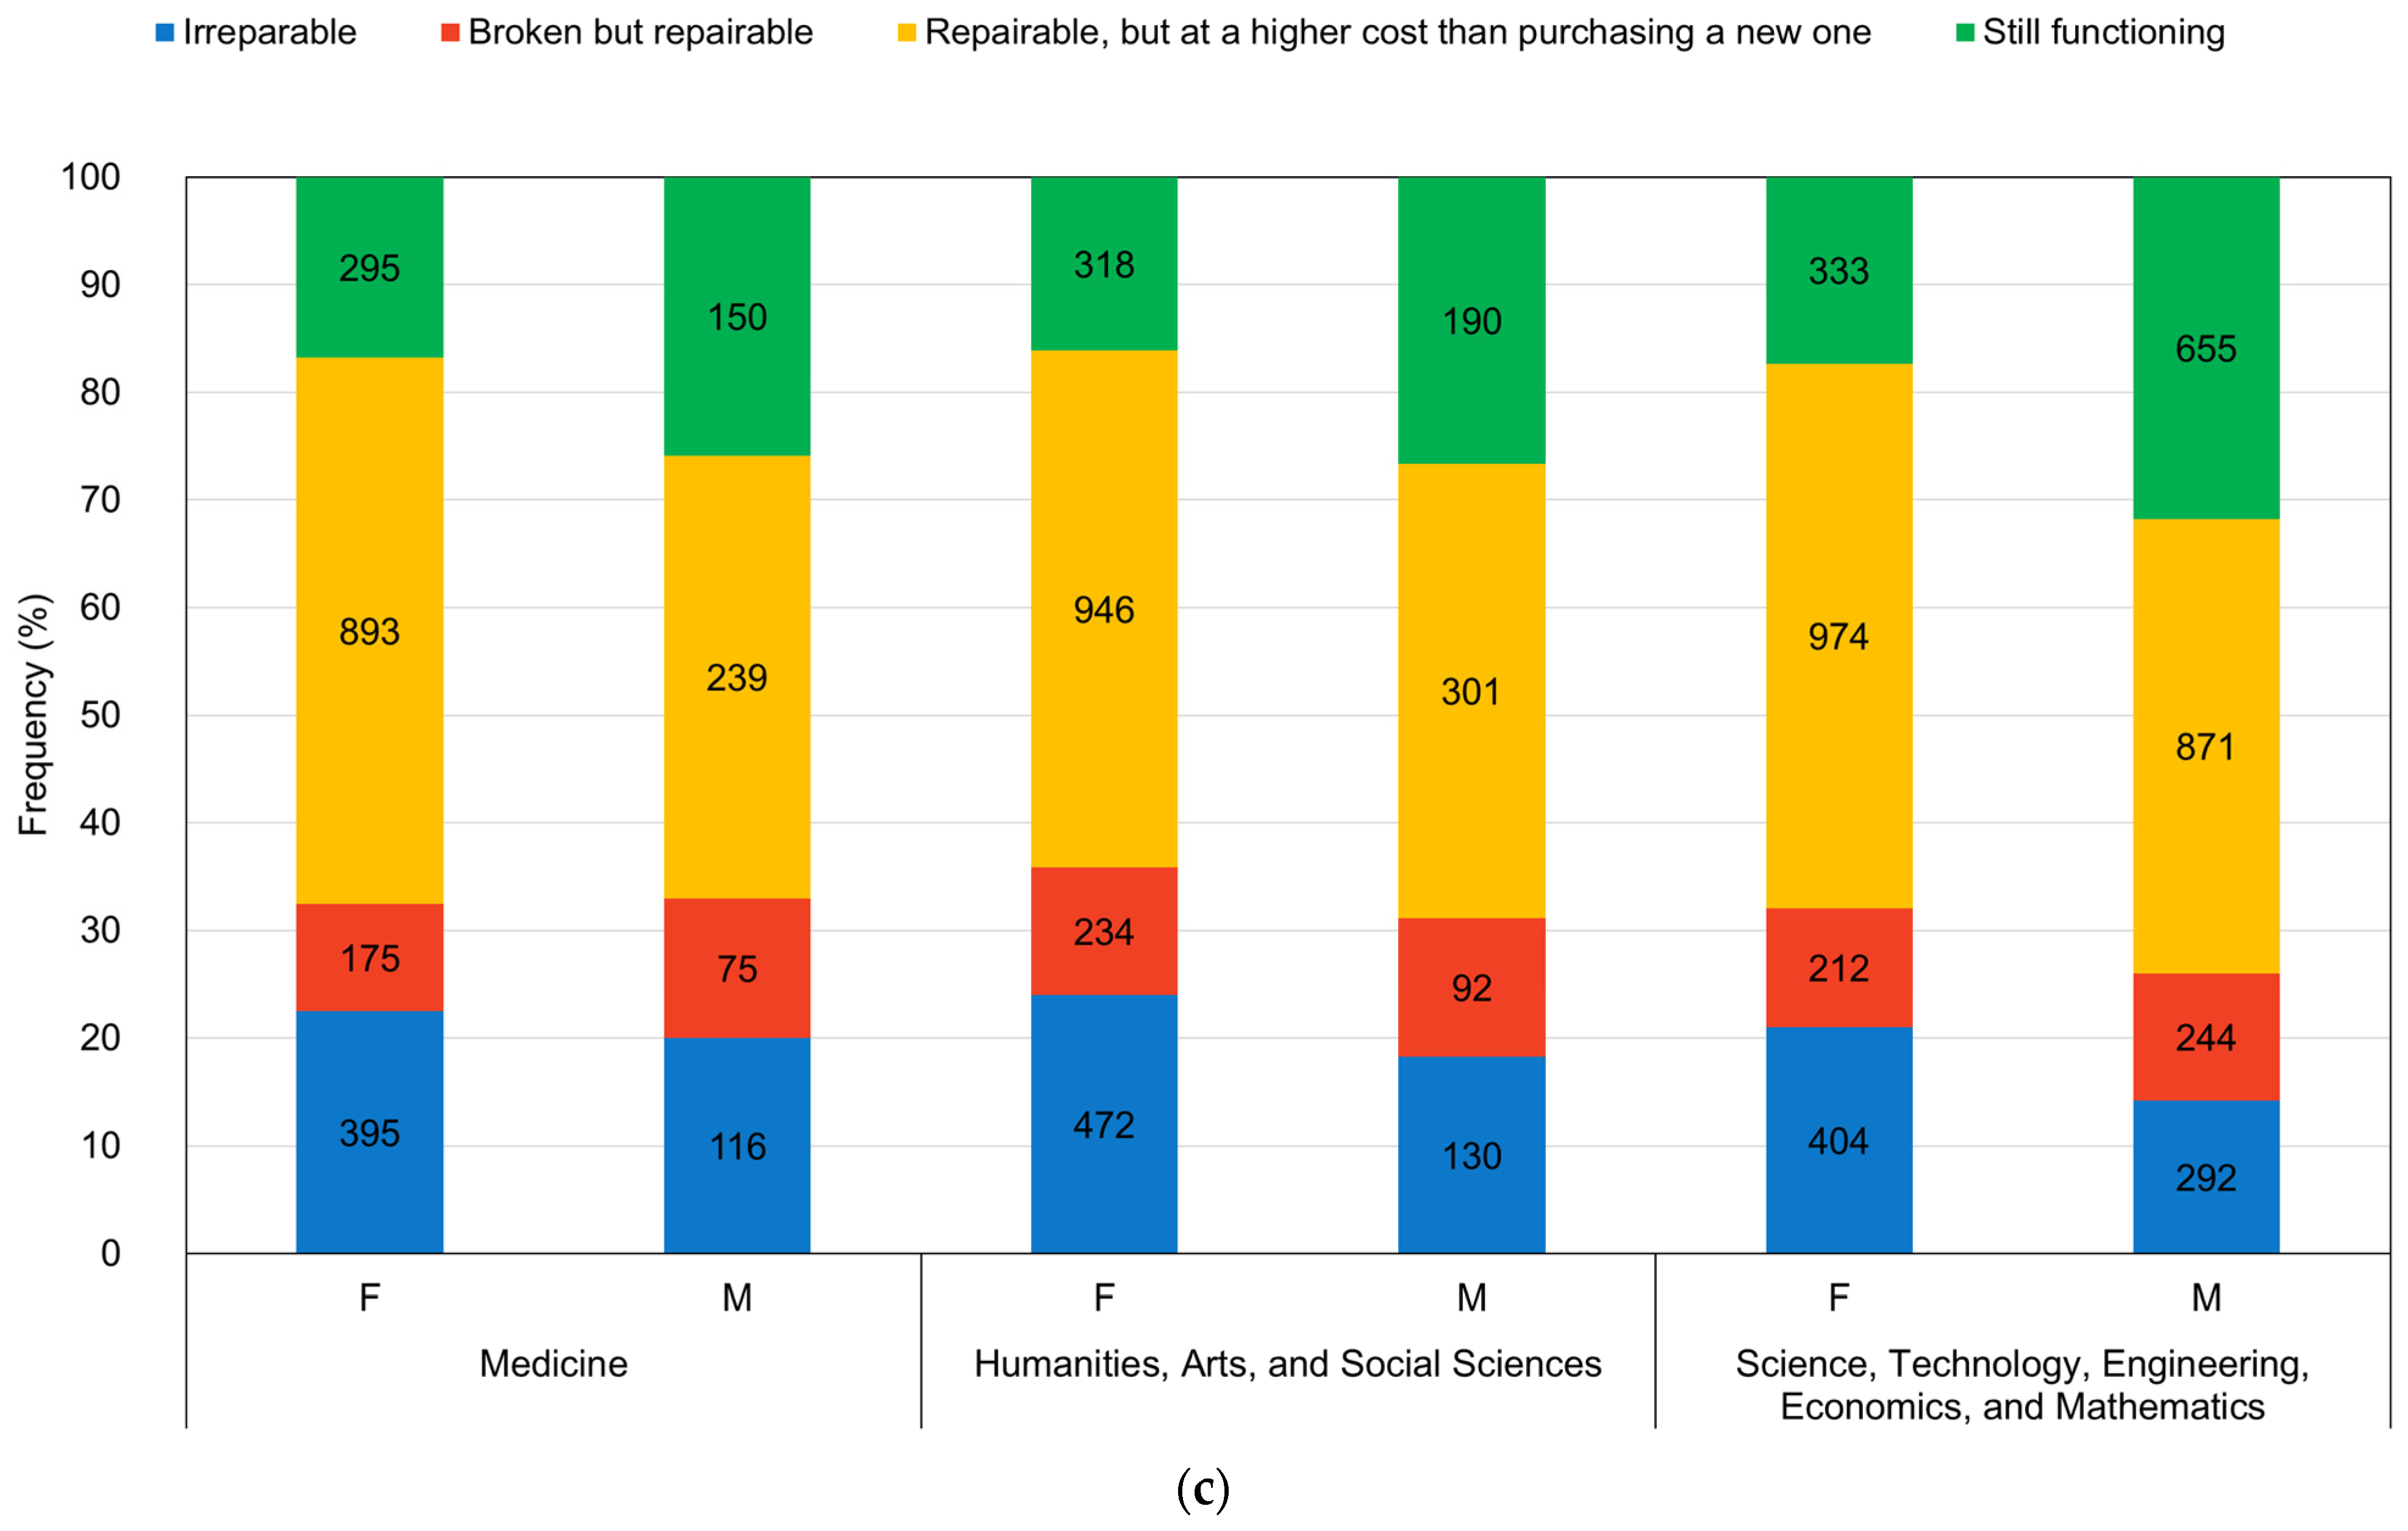
Even when considering the student population divided by macro areas of study (Figure 3c), males (as a percentage) are more likely to discard their MPs when they are still functioning (X2 = 207.742, DoF = 1, p < 0.05) and females when they are irreparable (X2 = 54.659, DoF = 1, p < 0.05).

2.2.3. Handling and Disposal of Unused Mobile Phones

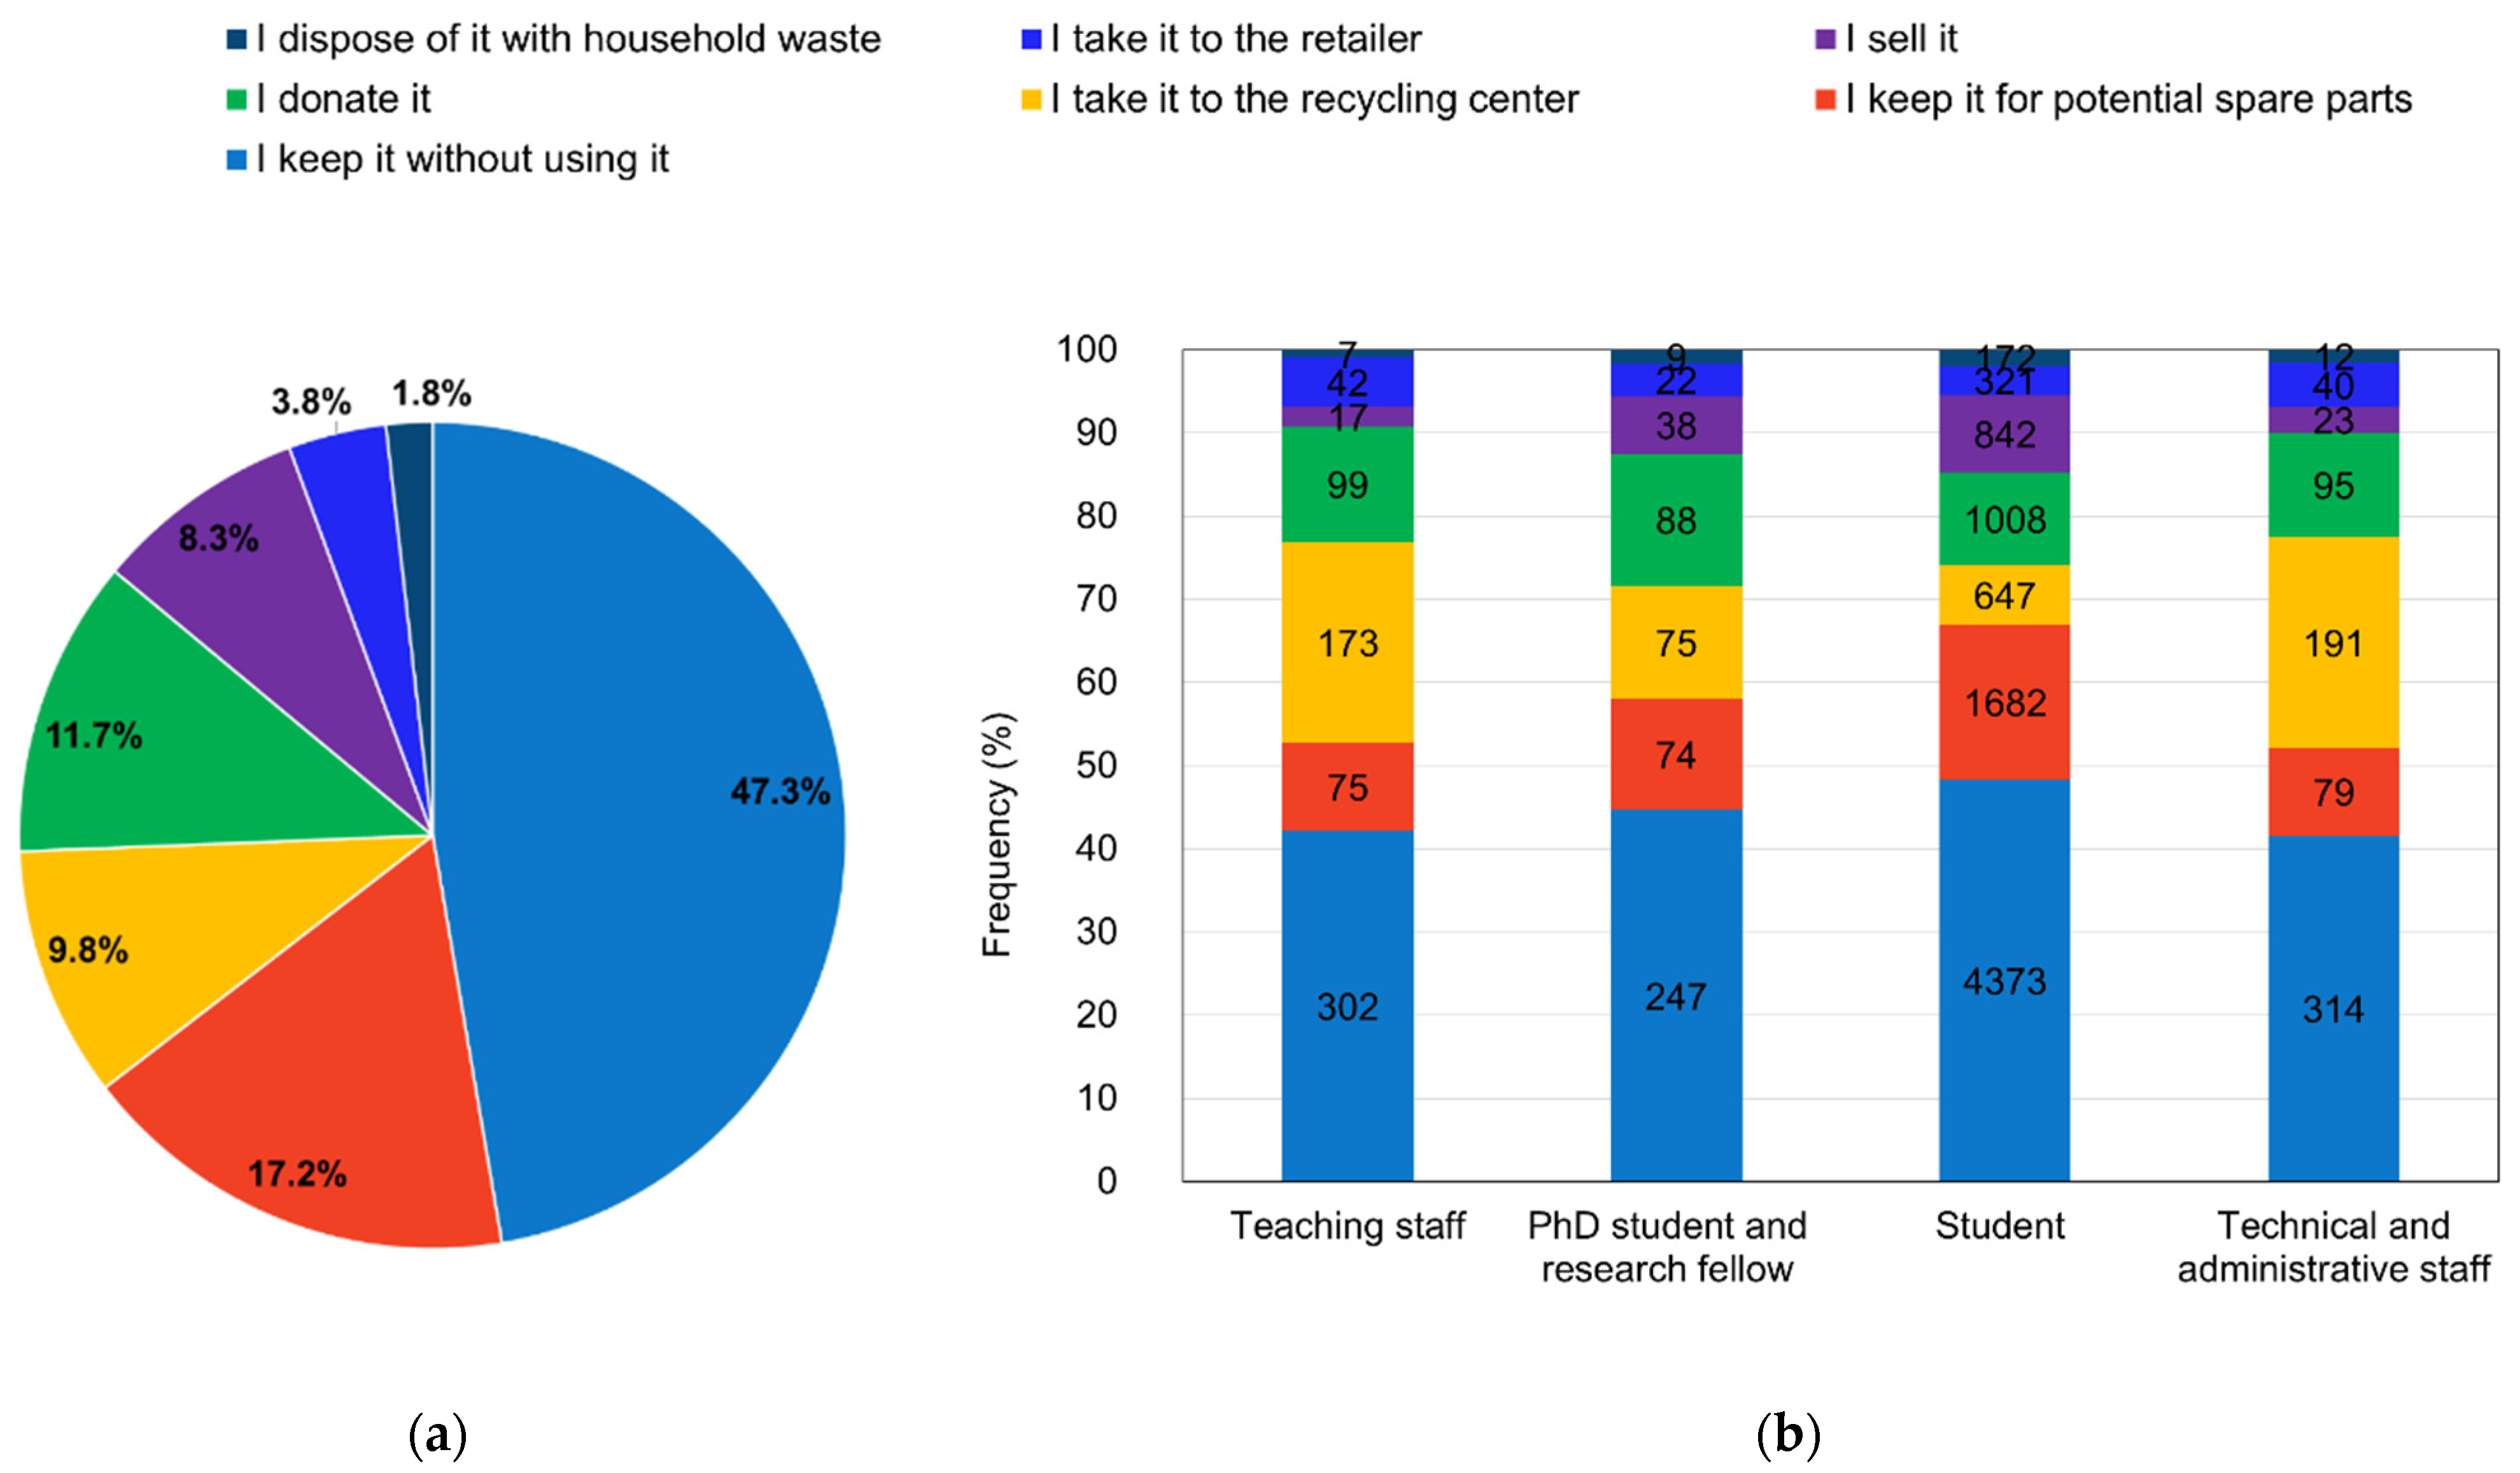
The distribution of answers to the question “What do you do (or would you do) with a mobile phone you no longer use?” is reported in Figure 4. As shown in Figure 4a, the majority (47.3%) opt to keep the devices they no longer use without utilizing them, in line with data reported in the literature [6,29,38] suggesting a common reluctance to part with their old MPs, perhaps due to sentimental value and concerns about data security or even laziness and a lack of concern [39]. This behavior indicates a missed opportunity for more sustainable practices, as these unused devices could be reused or recycled.
Another significant portion (17.2%) keep their old phones for potential spare parts, reflecting a practical approach to resource management. However, the effectiveness of this strategy may be limited, as many consumers may never actually benefit from these parts, also leading, in this case, to a loss of potential useful resources.
The third most common choice (11.7%) is to donate old or unused devices. This is a positive trend, as it allows one to extend the life of the devices and supports their reuse, which is beneficial from both an environmental and social perspective.
Only 9.8% take their end-of-life (EOL) MPs to a recycling center, demonstrating responsible e-waste management practices. The awareness and accessibility of recycling programs could be thus improved, encouraging more users to choose this environmentally friendly option. Furthermore, 8.3% resell their old devices, which is another sustainable option promoting reuse and reducing e-waste. Meanwhile, 3.8% return their phones to the retailer, which could be part of a take-back program, but it is less commonly chosen. This response indicates that more informational campaigns about take-back programs are needed to encourage the wider adoption of this disposal practice.
Concerningly, 1.8% dispose of their old MPs with household waste, which is environmentally harmful and indicates a need for greater awareness and education about proper e-waste disposal methods. This small but significant percentage highlights an area where targeted interventions could prevent improper disposal and its associated environmental impacts.
Regarding the distribution of answers based on the different roles (Figure 4b), it is confirmed that “I keep it without using it” is the prevalent choice (i.e., >47.3%) independently from the specific role. These data are in line with a previous survey carried out in five UK Universities where 55.7% of respondents their discarded MPs keep at home [40]. However, different behavior is observed between the younger categories (i.e., students and PhD students and research fellows) and the teaching, technical and administrative staff, concerning how they manage their old MPs. In fact, students are more likely to keep their old devices for potential spare parts, followed by PhD students and research fellows, in comparison to the different staff members (X2 = 64.371, DoF = 3, p < 0.05). Similarly, students show a higher tendency to sell their old phones, followed by PhD students and research fellows, than the different staff categories (X2 = 73.725, DoF = 3, p < 0.05). This behavior might reflect a practical mindset among younger individuals who see the value in keeping their old devices for future use or in reselling them, perhaps due to budget considerations or a more dynamic approach to managing their technology.
On the other hand, concerning the environmentally responsible disposal practices, such as taking spent phones to a recycling center or to the retailer, students, followed by PhD students and research fellows, are less likely to choose these options compared to teaching and technical and administrative staff. This difference could be attributed to a lack of awareness of recycling programs among younger respondents or perhaps a lower prioritization of environmental concerns in this group. These findings indicate the need for targeted awareness campaigns and educational initiatives that promote sustainable disposal practices, particularly among younger populations, as also suggested by Islam et al., 2020 [24].

2.2.4. Stockpiled Discarded Mobile Phones at Home: Estimation of Recoverable Precious and Critical Raw Materials

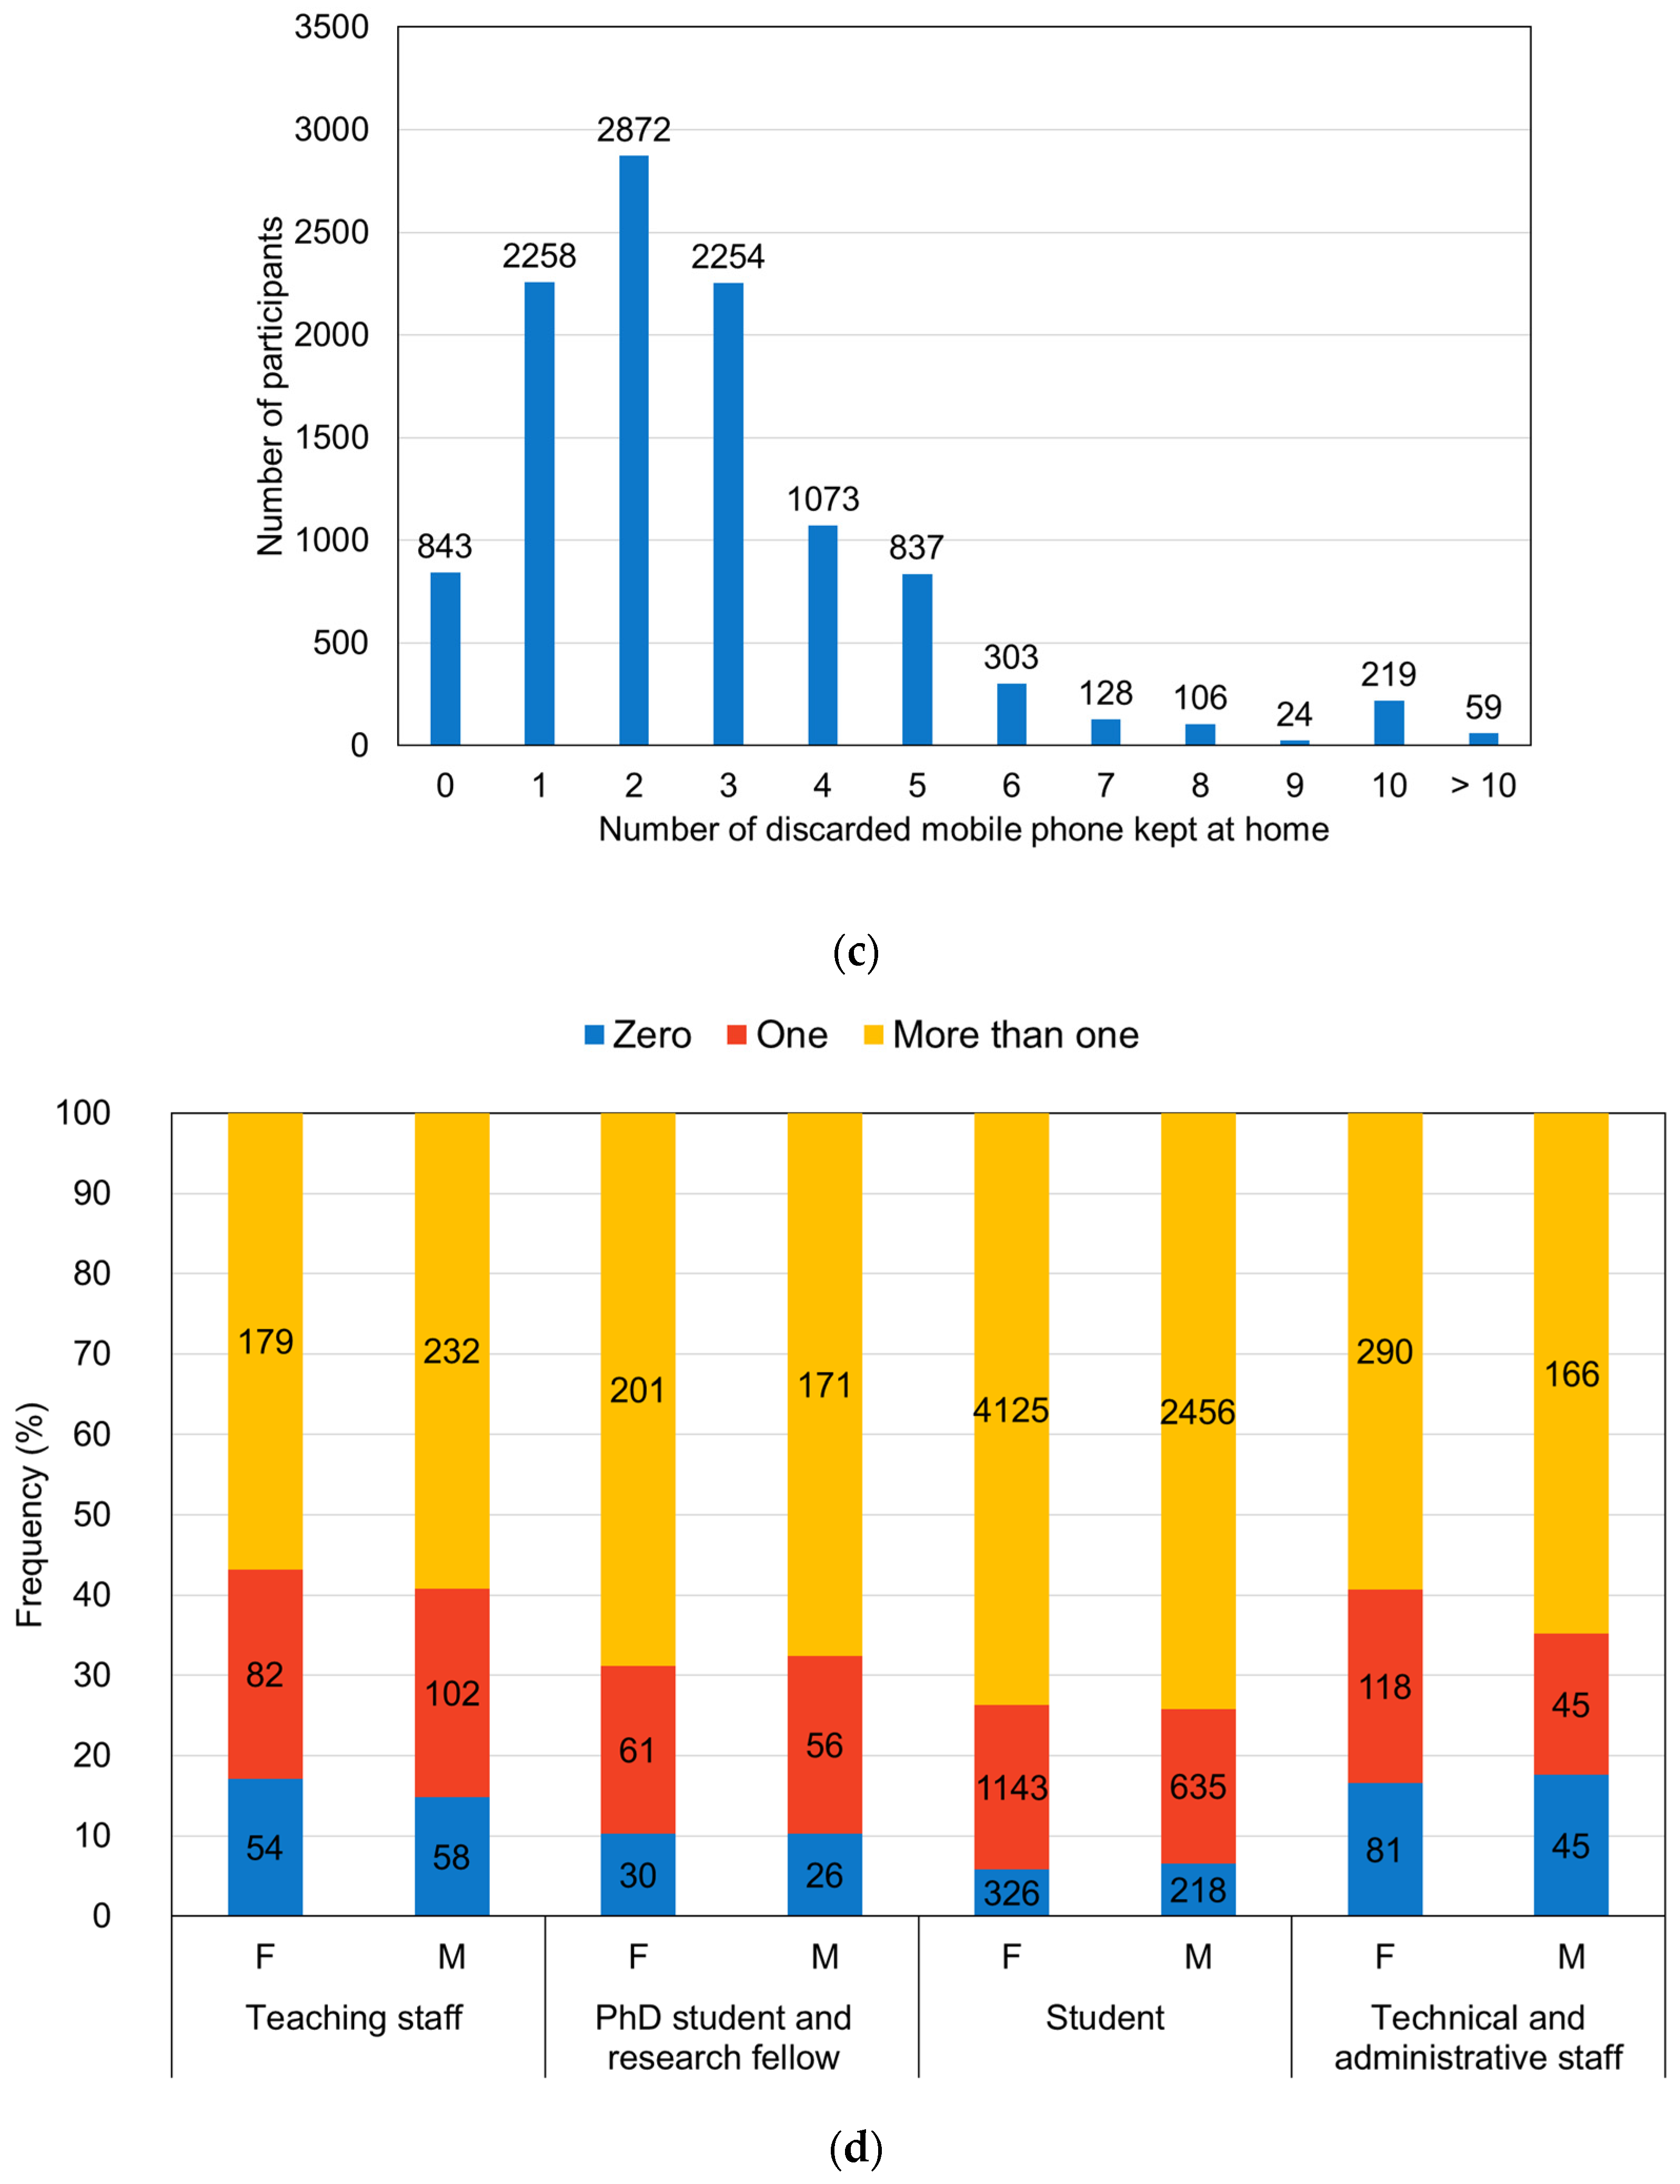
A significant trend and common behavior among participants are revealed when asking about the number of MPs kept at home, as shown in Figure 4c. Most of participants (92.3%) keep at least one unused/discarded MP at home, whereas only 7.7% declared that they do not keep any discarded MPs at home. Most participants keep one to three spent devices (67.3%), with the number of people holding into more than three phones progressively decreasing. However, a notable minority (0.54%) declared they keep more than 10 devices, which highlights the extent to which some individuals accumulate outdated technology. Based on these responses, it can be estimated that within the surveyed population, there are 29,799 unused or discarded MPs being stored at home, corresponding on average to 3 spent MPs per individual.
This result underscores the significant stockpile of potentially recyclable materials that are currently not being put back into circulation and that could help to reduce the consumption of non-renewable raw materials. The large number of stored phones also suggests that there is a need for greater awareness and more accessible recycling programs to encourage people to part with these unused devices in an environmentally responsible manner.
To provide a meaningful estimation of the CRMs and other valuable components that could be recovered from 29,799 MPs, the average composition and weight of a typical MP has been considered. Usually, an MP is composed of plastics (40%), metals (35%) and ceramics and glass (25%), constituting the different components, such as the printed circuit board (PCB), screen, casing, battery, others (buttons, keyboard, etc.) [32,39]. Assuming an average weight of 150 g for an MP, it varies depending on the model, brand, year of production, etc. [6], and the total weight of 29,799 MPs is around 5216 kg. Considering the average composition of the MP, there is around 2086 kg of plastics, 1825 kg of metals and 1304 kg of ceramics and glass potentially recyclable. Among these materials, metals are considered the richest ones, including precious (i.e., gold, silver), critical (i.e., aluminum, niobium, tantalum) and strategic (i.e., copper, cobalt, lithium, platinum, palladium, REEs) raw materials, constituting mainly the PCB and battery components. Assuming that 1 ton of MPs contains approximately 53 kg of copper (Cu), 141 g of gold (Au), 270 g of silver (Ag), 10 g of platinum (Pt), 18 g of palladium (Pd), and 3.3 kg of rare earth elements (REEs), alongside with other valuable metals [32], it can be estimated that the 29,799 MPs constituting the “urban mine” of the surveyed Sapienza population contain around 276.4 kg of Cu, 735.3 g of Au, 1.4 kg of Ag, 52.1 g of Pt, 93.9 g of Pd and 17.2 kg of REEs. These elements are often discovered to be at least twice as concentrated as found in their natural ores, and sometimes, their concentration in MP waste can exceed natural ore concentrations by up to 600 times [41].
Figure 4d shows the frequency with which MPs are discarded relative to the role and gender of survey participants. Across all roles, most respondents, regardless of gender, tend to keep more than one discarded MP at home. This indicates a general tendency among the surveyed population to hold onto old devices. While the data show some variation between genders, with males slightly more inclined to keep one discarded phone and females more likely to keep zero, the overall pattern of retaining more than one phone is consistent across both genders and roles. Students, PhD students and research fellows have the tendency to keep more than one discarded MP, in comparison to the other roles (X2 = 129.447, DoF = 3, p < 0.05), indicating the need to increase awareness on sustainable e-waste practices, especially among younger generations.

2.3. Knowledge and Awareness (KA) About EOL Mobile Phone Management

2.3.1. Hazardous Elements in Mobile Phones and the Risks of Improper Disposal

Most Sapienza respondents are aware that MPs contain hazardous elements (KA01, 92.6%) and that their improper disposal can release toxic substances (KA02, 84.1%).
An in-depth analysis of the distribution of answers among the different roles subdivided by gender at the university (Figure 5a,b) reveals slight differences in awareness among the different categories of respondents for KA01 (X2 = 724.665, DoF = 6, p < 0.05) and KA02 (X2 = 769.456, DoF = 3, p < 0.05): teaching staff show the highest levels of awareness, followed by technical and administrative staff, while the younger categories, including students and PhD students, display lower levels of awareness. These results may be attributed to the different levels of education, knowledge and exposure to information, which are also related to the different ages of the participants. Furthermore, a gender difference emerges across all categories, with males always demonstrating slightly greater awareness than females, in agreement with similar findings of a previous study [30].

2.3.2. Precious and Rare Metals in Mobile Phones

Regarding the positive presence of precious and rare metals inside MPs (KA03), the overall level of awareness of the population is still high (65.2%) but lower in comparison to that demonstrated for the presence of hazardous elements. This means that respondents are more conscious of the environmental risks posed by MPs, such as the release of toxic elements, than of the potential economic and resource value of the rare and precious metals that can be potentially recycled if correctly disposed of at the end of their life. A similar result was obtained by Chiappetta Jabbour et al., 2023a [8], suggesting that efforts to promote e-waste recycling have largely focused on preventing environmental harm rather than emphasizing the benefits of resource recovery. Raising awareness about the valuable components within MPs could incentivize more responsible disposal and recycling behaviors.
The gender difference in the awareness is also observed in this context (Figure 5c), with males always more conscious than females for all the investigated roles (the awareness of females from 54.3% to 67.5%a and awareness of males from 79.4% to 89.9%), confirming the findings of the previous question (X2 = 11,041, DoF = 1, p < 0.05).
Furthermore, the distribution of answers across students of the different disciplines (Figure 5d) reveals that STEEM students (61.88% to 82.71%) have higher levels of awareness compared to those in HASS (51.24% to 73.69%) and Medicine (49.66% to 74.44%) (X2 = 249.859, DoF = 2, p < 0.05). Such results suggest that students from STEEM disciplines are generally more informed about issues related to technology and environmental aspects, likely due to their educational background and interest, in comparison to HASS and Medicine students.

2.3.3. Critical and Strategic Raw Materials in Mobile Phones

The results of the answers to the four specific questions (Figure 6a–d) related to the awareness of the concentration of precious and critical elements in MPs and their economic and supply importance highlight a significant gap in knowledge among the surveyed population regarding these aspects, particularly related to the presence of CRMs identified by the EU [13,42].
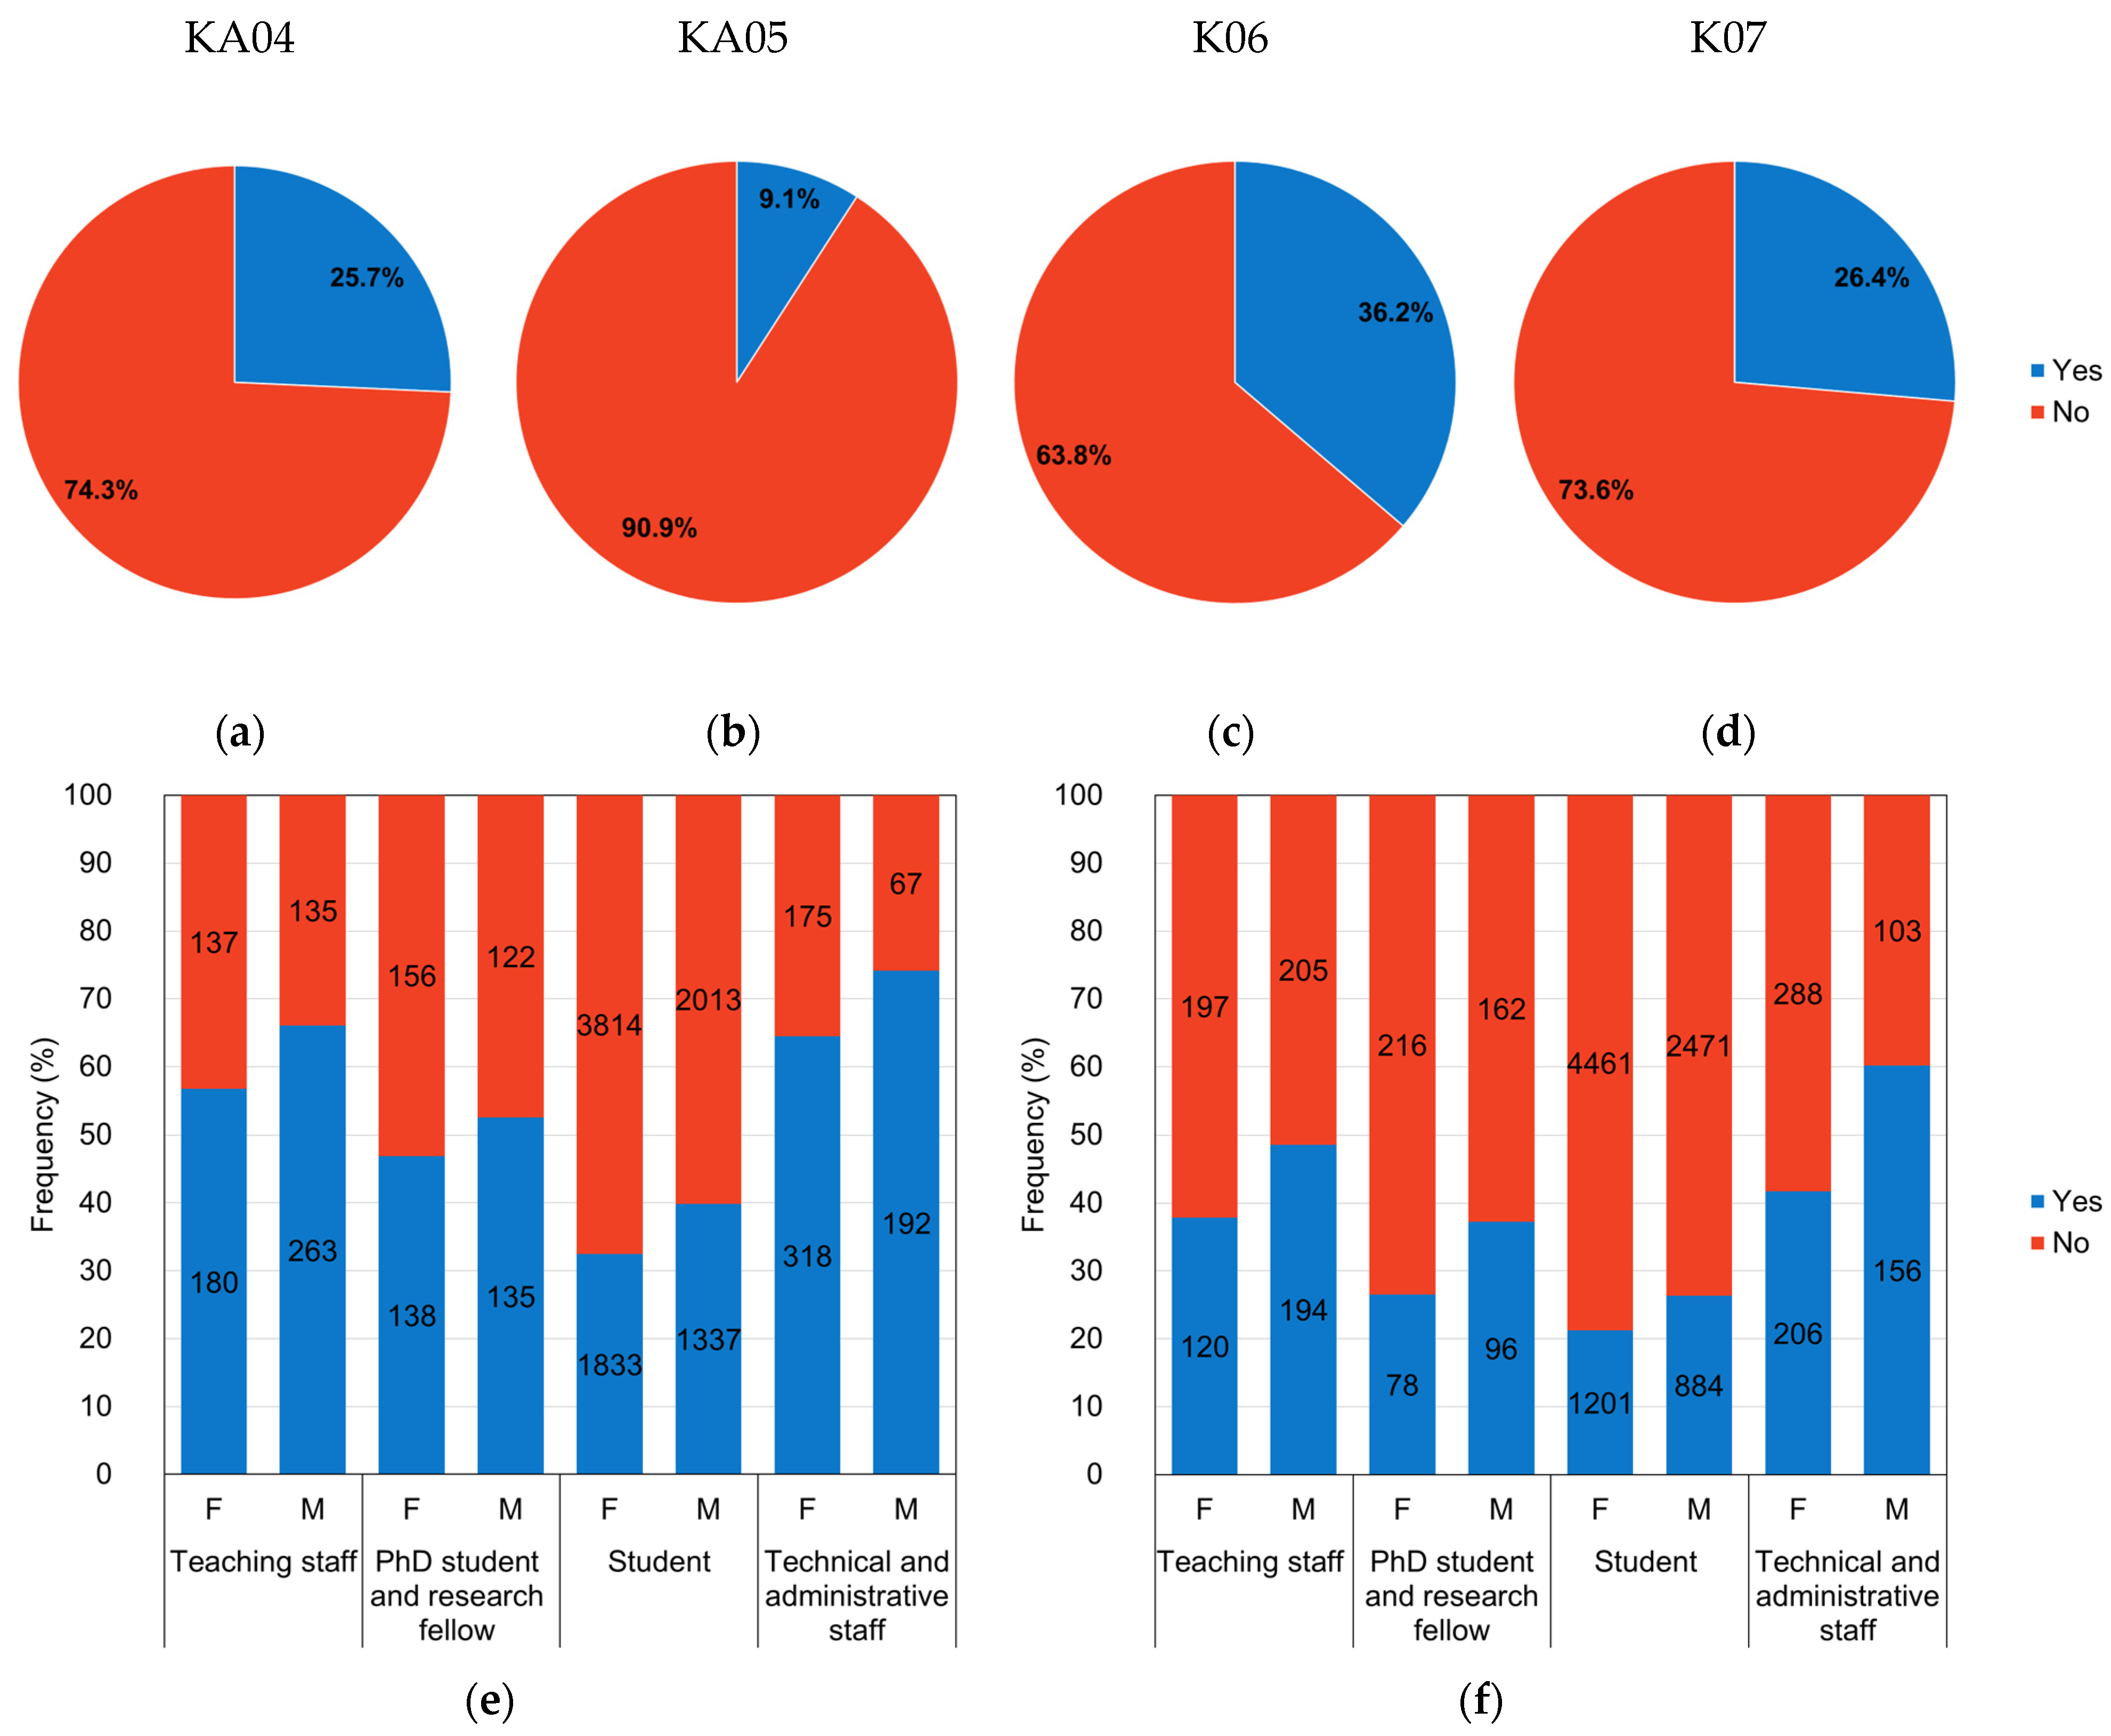
The situation is the opposite of the previous questions, with 74.3% of respondents being unaware concerning the high grades of strategic elements inside MPs, even higher than those found in ore mines (Figure 6a). Furthermore, 90.9% (Figure 6b) lacked knowledge about the number of CRMs identified by the EU, 63.8% do not know that some specific CRMs, like rare earths, tantalum and indium, are used in MPs (Figure 6c) and, finally, 73.6% were unaware of Coltan (i.e., a metallic mineral combination of columbite (Fe,Mn)Nb2O6 and tantalite (Fe,Mn)Ta2O6), a strategic raw material mainly extracted in the Congo that is used in the manufacturing of MPs (Figure 6d). These findings confirm that the surveyed population is more aware of the negative environmental impacts of the hazardous elements contained in MPs than of the positive aspects related to their richness in critical and strategic metals, potentially recyclables and that could contribute to reduce the extraction and consumption of non-renewable raw materials.
It is important to highlight that these questions of the survey were designed to increase the knowledge and awareness of the respondents, playing a dual role in both gathering data and enhancing the public understanding of important issues related to sustainability and resource management.

2.3.4. WEEE Take-Back Programs

A high percentage of respondents (60.1%) do not know what WEEE stands for (KA08). The analysis of the knowledge gap across roles and genders (Figure 6e) revealed that younger individuals are less familiar (student: 35.2%; PhD student and research fellow: 49.5%) with the meaning of WEEE compared to the older categories of staff (teaching staff: 62.0%; technical and administrative staff: 67.8%), suggesting that upon increasing age and experience, there may be a greater engagement with information about e-waste and their management (X2 = 492.544, DoF = 3; p < 0.05). Furthermore, across all roles, females are less aware of the meaning of WEEE than males (X2 = 421.822, DoF = 3; p < 0.05). The latter result is consistent with the broader trends in the survey, where males generally demonstrate a higher awareness of technical and environmental issues related to MPs.
Concerning the awareness on take-back programs (KA09a), the overall results reveal a significant lack of awareness of the “one-for-one” WEEE take-back service, with 73.3% of respondents not aware of the obligation for sellers of electrical and electronic equipment to accept WEEE free of charge when a customer purchases a new equivalent product. This indicates that despite the regulation being in place for 15 years, public knowledge of this service remains low. The lack of awareness is higher than that found in previous studies from Australia [24], Portugal [30], the UK [40] and China [43]. Awareness (Figure 6f) was higher among teaching (43.9%) and technical and administrative staff (48.1%) compared to students (23.1%) and PhD students and research fellows (31.5%), suggesting that older members are slightly more informed about such a service than the younger individuals (X2 = 555.928, DoF = 7, p < 0.05). This result is in agreement with the findings of other studies showing that the willingness to recycle e-waste increases with the age of respondents [44,45]. Additionally, we confirmed an observed trend with males appearing to have slightly higher awareness than females in all categories (i.e., 26.3–60.2% for males and 21.2–41.7% for males). Female students, in fact, have the lowest level of awareness across all groups (21.2%). Furthermore, in terms of actual usage of the “one-for-one” program (K09b), most respondents (83.5%) have never used the service, which aligns with the high percentage of those unaware of it. Only 9.1% have used the service once and 7.4% have used it more than once. This low utilization rate highlights a missed opportunity for promoting the proper recycling and disposal of electronic waste.
Regarding the awareness about the service called “one-for-zero operation” (KA10a) which allows customers to return small WEEE (≤25 cm) to large electronics retailers without making a purchase, the situation is even worse than for the “one-for-one” take-back service. In fact, 88.3% are unaware of this option, confirming a significant gap of public knowledge about e-waste disposal regulations. Luckily, the perception of the service is largely positive (KA10b), with most respondents rating the service as useful and effective (70.8% and 21.3%, respectively), suggesting that they could benefit from the service in the future, while a small portion consider the service complicated or even useless (6.6% and 1.3%, respectively).
The lack of awareness of a university population group, which can be considered more educated and engaged in current issues, suggests that more effective communication and outreach efforts are needed to inform consumers about their rights and the availability of these take-back services and contribute to the proper management of EOL MPs with economic and environmental benefits.

2.4. Opinions and Conclusions (OCs)

2.4.1. Reasons for the Importance of WEEE Separate Collection: Respondents’ Perceptions

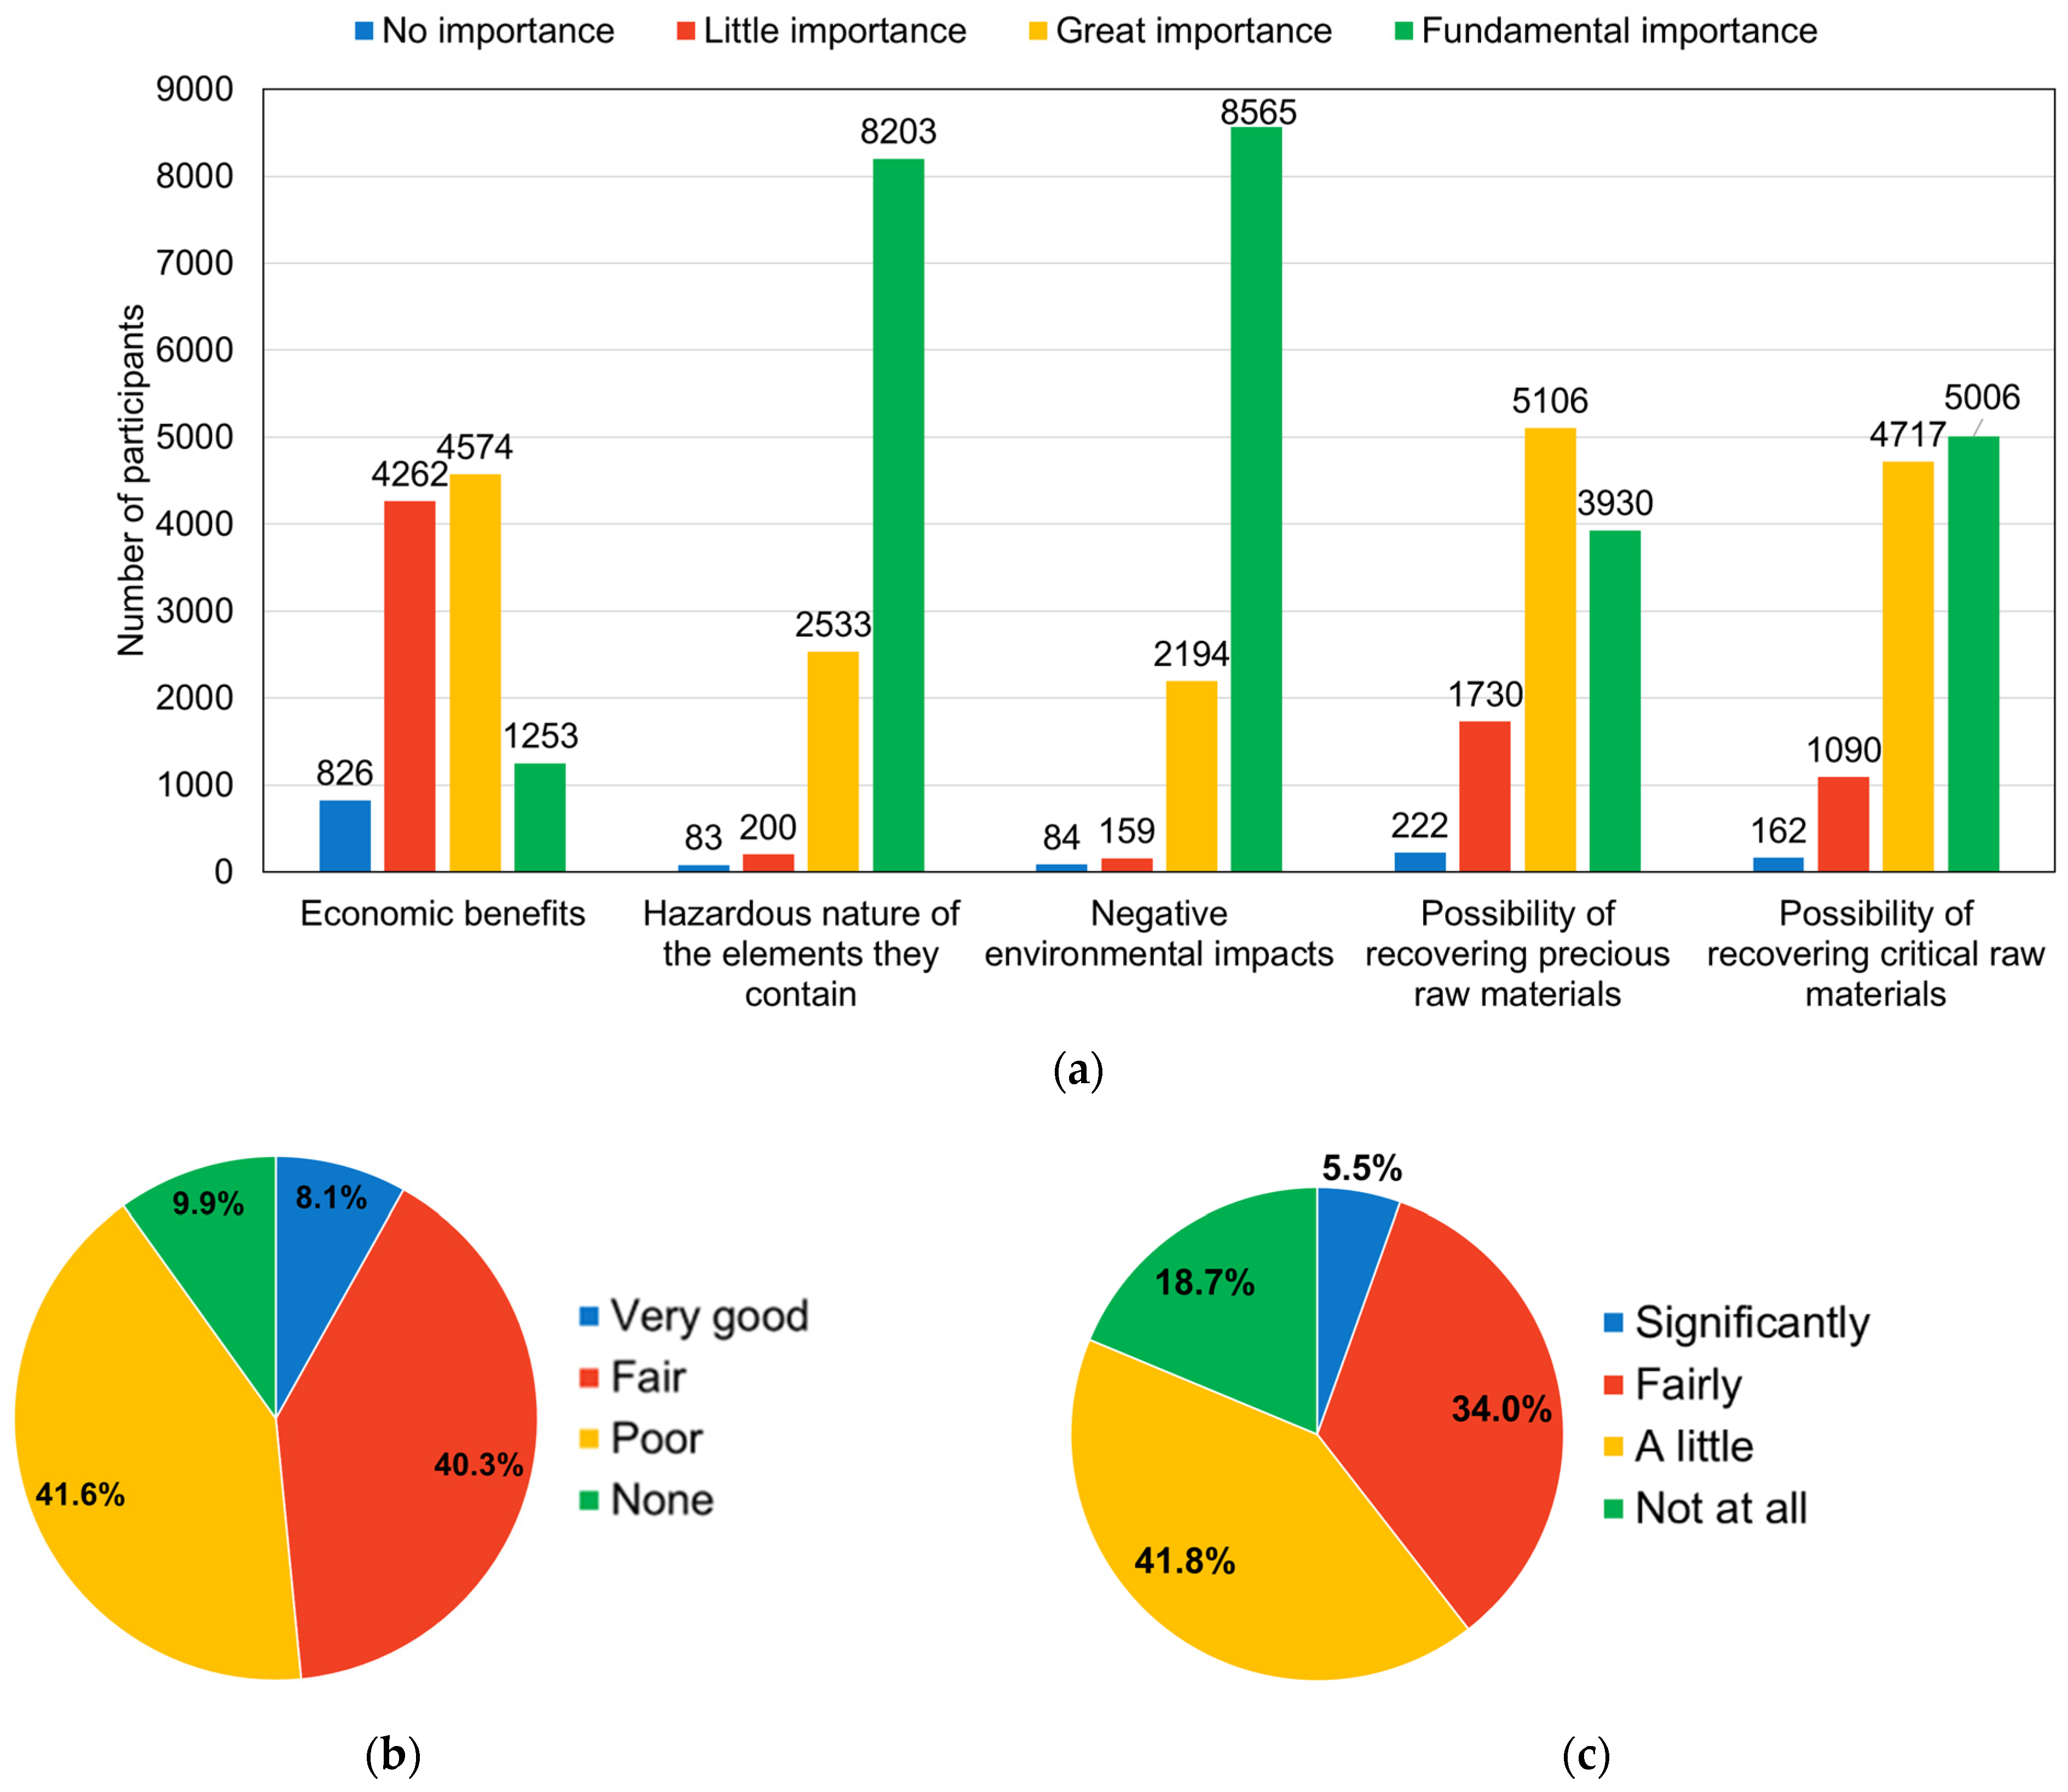
The results concerning the question “In your opinion, why is the separate collection of this type of waste important?” are shown in Figure 7a. The perception of economic benefits as a motivation for separate collection of this kind of waste shows a moderate level of importance among respondents. In fact, economic benefits are considered of great importance by about 41.9% of survey participants, of little importance by 39%, fundamental by 11.5% and not important at all by 8%. On the contrary, the hazard of contained elements and negative environmental impacts is considered as fundamental motivation for most respondents (74.4% and 77.8%, respectively) with a very small portion considering the environmental concerns of little importance (1.8% and 1.4%, respectively) and not important at all (0.8% in both cases). The possibility of recovering precious raw materials is considered of fundamental importance by 35.8% of respondents, of great importance by 46.5%, of little importance by 15.7% and not important at all by 2%. A similar pattern is observed for the possibility of recovering CRMs contained within this waste. In more detail, the possibility of recovering CRMs is viewed as fundamentally important by 45.6% of great importance by 43.0%, of little importance by 9.9% and not important at all by 1.5%.
These findings align with earlier results, suggesting that while the university participants show a strong awareness of the environmental consequences of improper waste disposal, there is a comparatively slightly lower awareness of the importance of the recovery of precious and critical raw materials. This could suggest that future educational campaigns within the university context should emphasize the dual benefits of e-waste collection, both in reducing environmental harm and in reclaiming scarce resources, highlighting the role of recycling in mitigating these issues.

2.4.2. Self-Assessment of Knowledge and Responsibility in WEEE Management

Most of the surveyed population rate their knowledge regarding the proper disposal of MPs (Figure 7b) as “poor” (41.5%) or “fair” (40.3%), and a smaller portion (9.9%) admit to having no knowledge, whereas only 8.1% considers their knowledge as “very good”. In a similar way (Figure 7c), most respondents believe they are either “a little” (41.8%) or fairly (34.0%) responsible and informed consumers about WEEE, 18.7% of respondents think they are “not at all” responsible or informed and only a small percentage (5.5%) feel significantly responsible.
These findings reveal that, while most respondents view themselves as at least somewhat responsible and informed consumers regarding WEEE, there is still a significant gap in both perceived responsibility and actual knowledge, suggesting once again the need to increase educational initiatives and campaigns on this topic.
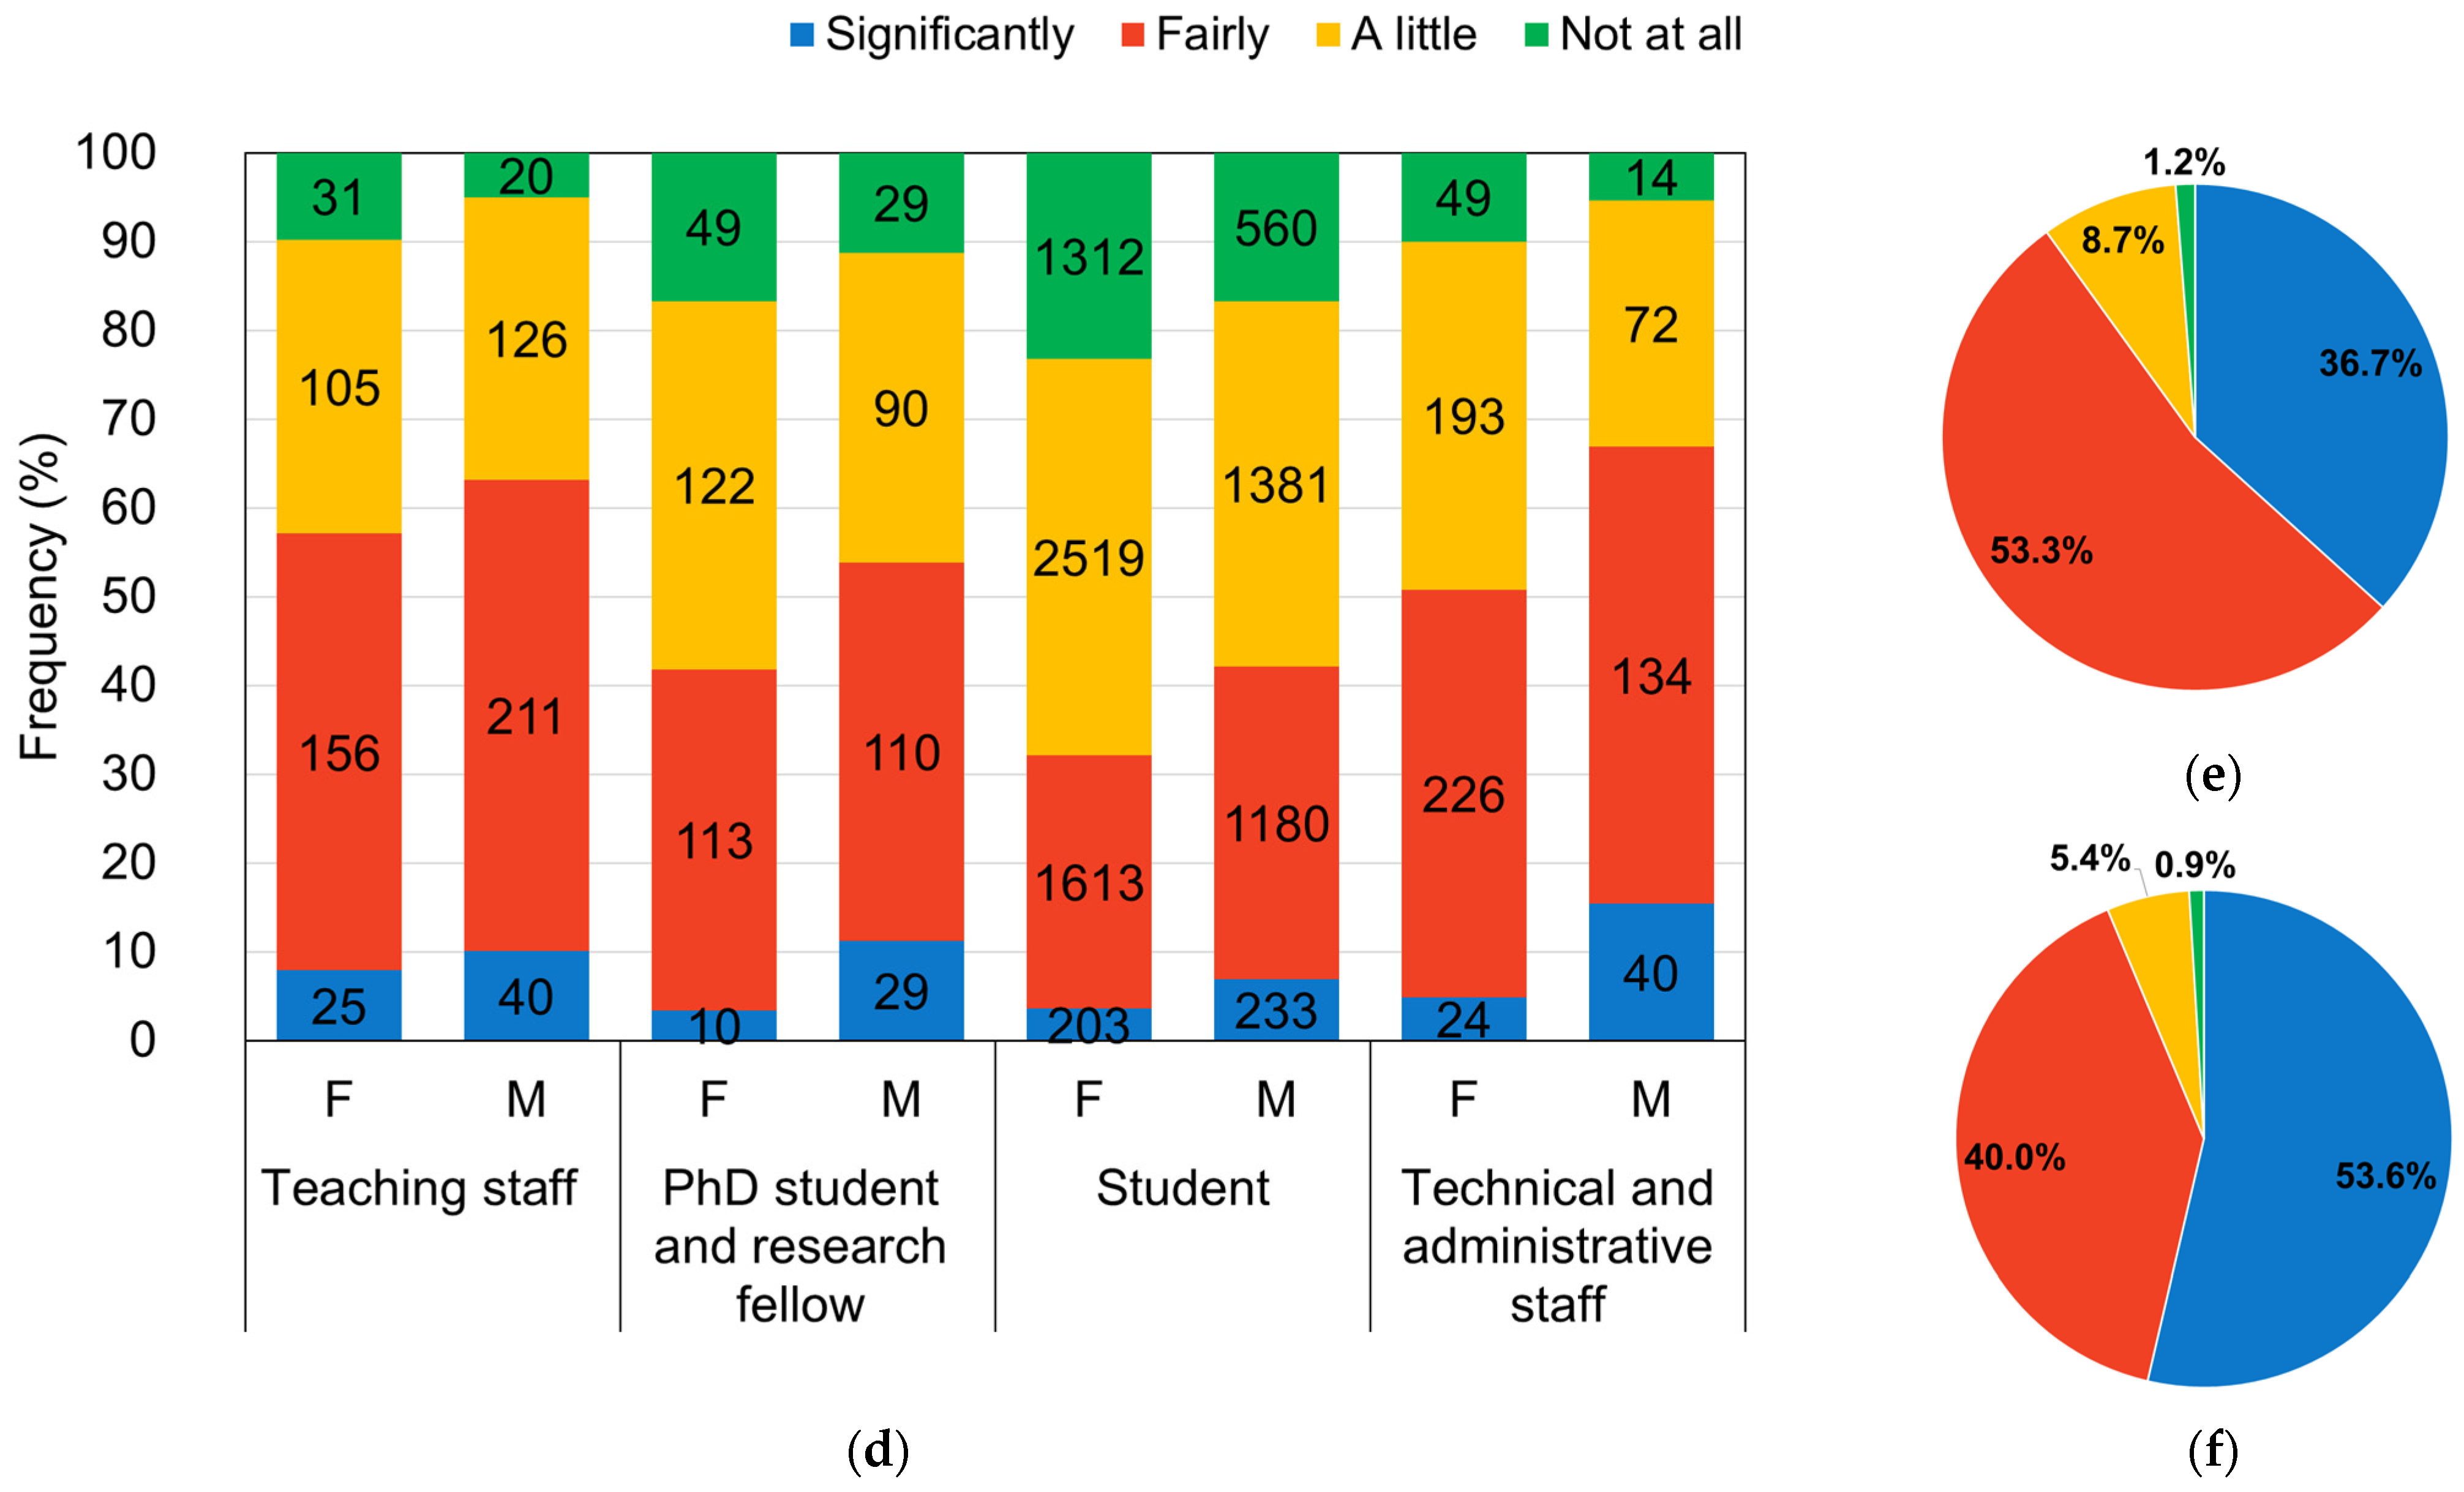
Looking at the distribution of answers to question OC03 across the different roles and genders (Figure 7d), it appears that younger generations (students and PhD students and research fellows) have a slightly lower perception about their information and knowledge on WEEE management (14.1% to 43.3% rate their knowledge as either “not at all” or “a little” informed) compared to the older staff personnel, showing a higher confidence in their knowledge, with 7.1% to 35.2% giving similar low ratings (X2 = 51.180, DoF = 3, p < 0.05). This suggests that while younger generations may be more digitally native, they might not be as aware of proper WEEE disposal practices. This could be due to lower engagement with WEEE management. Older staff, who might have had more life experience and potentially more opportunities to interact with WEEE disposal systems, appear to have a slightly higher perception of their knowledge. Furthermore, females tend to perceive themselves as less informed about WEEE management than males across all the different roles. In fact, a higher percentage of females (9.8% to 44.6%) believe they are “not at all” or “a little” informed, while the corresponding percentage for males is slightly lower (5.0% to 41.1%). This difference in perception may reflect broader trends in gender awareness and confidence in these technical topics.

2.4.3. The Survey as an Educational Tool: Impact on Awareness and Knowledge Sharing

Encouraging results were found regarding the impact of the questionnaire on raising awareness about small WEEE management and the importance of knowledge sharing. The results suggest that the questionnaire was highly effective in educating participants about WEEE (Figure 7e), with 90% of the respondents acknowledging that it had either significantly or fairly increased their awareness. This indicates that engaging with such surveys can play a crucial role in filling knowledge gaps and promoting environmentally responsible behaviors. Furthermore, another positive outcome (Figure 7f) is that over 93.7% of respondents believe it is either significantly or fairly important to disseminate this information. This highlights the questionnaire’s role not only in personal education but also in promoting wider community engagement.

2.4.4. Potential for a University-Based Small WEEE Collection System: Willingness to Participate

The final question of the survey (OC06) was related to the willingness to use a collection system for small WEEE inside the university premises if it could be realized. The results showed that 93.1% of respondents expressed their willingness to use such a system if it were made available. This high level of interest indicates that such a system, providing an easier way to properly dispose of waste items [46], could be highly effective in increasing the proper disposal of small electronic waste, potentially reducing environmental impact and improving recycling rates. To maximize effectiveness, the implementation of the small WEEE collection system should be accompanied by awareness campaigns, clear disposal guidelines and potential incentives to encourage active participation.
The results of the study are synthesized in Table 2, which includes systematic comparisons with the existing literature, highlighting similarities, differences and novel insights in relation to previous research studies. They revealed several common behavioral patterns and knowledge gaps in MP waste management and e-waste awareness while also revealing substantial opportunities for promoting sustainable practices.

3. Methods

3.1. Survey Design and Distribution

A 31-question survey titled “End-of-life mobile phones management”, which does not involve ethical issues, was developed and distributed to the academic community of the Sapienza University of Rome (Italy). Established in 1303, Sapienza University is among the oldest and largest in Europe. Its population is composed of 3660 academic staff, 3554 administrative staff and 125,596 enrolled students (https://www.uniroma1.it/en/documento/facts-and-figures-sapienza-glance, Sapienza at a Glance, 2024–2025; accessed on 10 February 2025).
The survey was created using Google Forms, a web-based application for survey design and data collection (docs.google.com/forms; Googleplex, Mountain View, CA, USA). It was distributed to the Sapienza University community starting in May 2020 via university-affiliated email addresses and the institution official website. The answers were collected until December 2022. The questionnaire included closed-ended, multiple-choice and ranking questions.
The survey structure (detailed in Table 3), is subdivided into four Sections, designed to collect specific insights, including both behavioral data and self-assessed awareness: (1) General Information (GI)—7 questions on demographics (gender, age, role, Faculty, etc.); (2) Habits and Behaviors (HB)—6 questions on MP waste management (i.e., the number of owned devices, timing and reasons for replacement and disposal practices); (3) Knowledge and Awareness (KA)—12 questions on the presence of hazardous elements and CRMs in MPs and on take-back programs; and (4) “Opinions and Conclusions” (OC)—6 questions on separate collection importance, the level of information on WEEE and willingness to use a collection service for small WEEE on campus. Section 3 also included educational tips to inform respondents and enhance their understanding of these issues, and Section 4 also gathered feedback on whether the questionnaire effectively increased respondents’ awareness and their intention to share information with others.
The methodological approach offers several strengths: the large sample size supports robust quantitative analysis; the inclusion of diverse respondent groups (i.e., students, academic staff and administrative staff, with different ages and backgrounds) provides a comprehensive and multifaceted understanding of sustainability-related perceptions and behaviors; the educational structure of the survey allows for real-time awareness-raising. However, limitations include potential self-selection bias due to voluntary participation and the fact that data are limited to a single university context, even if the survey model could be effectively replicated in other institutional or academic environments.

3.2. Data Aggregation and Analysis

The analysis involved frequency analysis to highlight differences or similarities among survey respondent categories. An one-way ANOVA was used to assess significant differences between groups (i.e., university roles). The chi-square test of independence was adopted to assess whether there was a significant association between two categorical variables (e.g., gender and phone ownership). A significance level of 0.05 was applied for the statistical tests [47,48].

4. Conclusions and Future Perspectives

This study provides a comprehensive analysis of MP waste management within a university setting, serving both as a research tool and an educational intervention. To the best of our knowledge, this represents the largest study of its kind conducted in Italy.
The results revealed several general trends in MP waste management and e-waste awareness. Most respondents (90.6%) own only one MP, with 48.8% replacing it every 3–5 years and 36.7% within 1–3 years. Although 54.0% replace their devices due to functional or physical damage, only 20.2% wait until they are irreparable. Notably, 46.0% replace devices because repairs are considered too expensive, highlighting a valuable opportunity to encourage a repair culture and support longer product lifespans.
Concerning disposal options, despite some participants engaging in responsible practices, such as recycling (9.8%) or donating (11.7%), a large number still hold onto their old devices without using them (47.3%) and 1.8% dispose of them improperly. In total, 92.3% of respondents keep at least one discarded MP at home, leading to an estimated stockpile of 29,799 unused devices stored within the university community. These stored devices represent a significant untapped source of recoverable materials, including large quantities of CRMs, with implications for both sustainability and circular economy strategies.
Respondents demonstrated a higher awareness of hazardous substances in MPs (92.6%) and the environmental risks of improper disposal (84.1%) compared to their awareness of valuable and CRMs (65.2%). Knowledge gaps were particularly evident regarding the strategic importance of e-waste, with 74.3% of respondents unaware that MPs contain higher concentrations of strategic elements than mineral deposits, 90.9% unaware of the EU’s CRM list and 73.6% unfamiliar with Coltan. Furthermore, this study revealed a very low awareness of take-back programs for MPs, with 73.3% of respondents unaware of the “One-for-One” program and 88.3% unaware of the “One-for-Zero” program, with percentages notably lower than those reported in previous studies conducted in other countries, underscoring the need for improved outreach and communication.
Beyond these general findings, this study revealed key differences in behaviors and awareness across gender, age and academic background. Concerning behaviors, males are more likely than females to own multiple devices and to consider, in addition to replacing an MP due to damage, upgrading for technological advancements or status reasons. Concerning awareness, males are generally more conscious of hazardous elements and valuable materials in MPs than females and of available take-back programs. Furthermore, females perceive themselves as less informed about WEEE management.
Younger respondents (students) showed a stronger inclination to replace MPs earlier than teaching and technical–administrative staff and were more likely to keep old MPs at home for spare parts or resale. They also displayed lower awareness levels of proper disposal methods, hazardous components and official take-back programs compared to older participants.
Differences were also evident across academic disciplines, with STEEM students exhibiting higher awareness of CRMs compared to HASS and Medicine students.
The educational value of the survey was demonstrated by a very high percentage of respondents (90%) reporting an increased awareness of e-waste issues after completing the survey. Additionally, 93.7% of respondents recognized the importance of knowledge sharing. Finally, the strong willingness (93.1%) to use an on-campus collection system underscores the universities’ potential as catalysts for sustainable behavioral change.
The results suggest that universities should implement broad, inclusive educational campaigns to increase the awareness of the proper management of MP waste, with a particular focus on addressing demographic-specific knowledge gaps by designing targeted initiatives for younger individuals, female students and those in non-STEEM disciplines.
Given the diversity of products within the e-waste stream, a “one-size-fits-all” approach to management can be considered insufficient. Stronger regulatory and governance measures could significantly enhance the effectiveness of mobile phone waste management [49,50]. For example, a more visible and enforced implementation of take-back schemes (e.g., “One-for-One”, “One-for-Zero”) is needed. Local and national authorities should promote partnerships with universities to support dedicated on-campus e-waste collection points. Implementing visible and accessible collection infrastructure can unlock the untapped resource potential of stored devices and reduce the environmental footprint of e-waste. Moreover, policy instruments should incentivize repairability and product longevity and foster the integration of circular economy principles into educational curricula. Since MPs contain high concentrations of valuable and strategic materials, they merit dedicated policy tools. In this regard, financial deposit–refund systems (e.g., where consumers pay a deposit at purchase, refundable upon returning an old device) could serve as an effective mechanism to increase collection rates and proper disposal. Such schemes can positively influence consumer behavior by providing direct economic incentives and better revenues in recycling [51] and could complement existing take-back programs, particularly in educational environments.
Fostering awareness and behavioral change, supported by the implementation of recycling initiatives, represents a transformative path toward sustainable resource use. Such actions align with circular economy principles and directly contribute to SDG12 on responsible consumption and production.

Supplementary Materials

The following supporting information can be downloaded at https://www.mdpi.com/article/10.3390/recycling10040129/s1. Table S1. Affiliation of survey participants according to the categories: teaching staff, PhD students and research fellows and technical and administrative staff; Table S2. Faculty of affiliation for enrolled students participating in the survey; Figure S1. Age ranges of survey participants by gender (a), pie chart of the role inside the University divided by the four main categories of the survey participants (b) and age ranges by role (c); Figure S2. Pie chart of the student’s program (%) (a) and pie chart of program year of students (%) (b).

Author Contributions

Conceptualization: S.S.; methodology: S.S., R.P. and R.G.; software: R.P. and R.G.; validation: G.B., R.P., R.G. and S.S.; formal analysis: S.S., R.P. and R.G.; investigation: R.P., R.G. and S.S.; resources: G.B. and S.S.; data curation: R.P., S.S. and R.G.; writing—original draft preparation: R.P., R.G. and S.S.; writing—review and editing: S.S. and G.B.; supervision: S.S. All authors have read and agreed to the published version of the manuscript.

Funding

No funding was received for this work.

Data Availability Statement

The data presented in this study are available from the corresponding authors upon reasonable request.

Acknowledgments

We sincerely thank Michela Chiadroni from the administrative staff of the Sapienza University of Rome for her support in setting up the questionnaire in Google Forms and coordinating with university offices for its dissemination. This work was carried out as part of the initiatives of the RUS—Resources and Waste Working Group at Sapienza University—under the patronage of the Italian “RUS—Network of Universities for Sustainable Development” (https://reterus.it/en; link accessed the 1 March 2025).

Conflicts of Interest

The authors declare that they have no known competing financial interests or personal relationships that could have appeared to influence the work reported in this paper.

References

  1. Appolloni, A.; Chiappetta Jabbour, C.J.; D’Adamo, I.; Gastaldi, M.; Settembre-Blundo, D. Green recovery in the mature manufacturing industry: The role of the green-circular premium and sustainability certification in innovative efforts. Ecol. Econ. 2022, 193, 107311. [Google Scholar] [CrossRef]
  2. I.T.U. Measuring Digital Development: Facts and Figures; ITU: Geneva, Switzerland, 2024; pp. 1–42. [Google Scholar]
  3. Aboelmaged, M. E-waste recycling behaviour: An integration of recycling habits into the theory of planned behaviour. J. Clean. Prod. 2021, 278, 124182. [Google Scholar] [CrossRef]
  4. Tutton, C.G.; Young, S.B.; Habib, K. Pre-processing of e-waste in Canada: Case of a facility responding to changing material composition. Resour. Environ. Sustain. 2022, 9, 100069. [Google Scholar] [CrossRef]
  5. Baldé, C.P.; Kuehr, R.; Yamamoto, T.; McDonald, R.; Althaf, S.; Bel, G.; Deubzer, O.; Fernandez-Cubillo, E.; Forti, V.; Gray, V.; et al. The Global E-Waste Monitor 2024; International Telecommunication Union (ITU) and United Nations Institute for Training and Research (UNITAR): Geneva, Switzerland, 2024. [Google Scholar]
  6. Romagnoli, V.; de Bruijne, E.; Drapeau, P.; Ollion, L.; Anaëlle, C. Study on Options for Return Schemes of Mobile Phones, Tablets and Other Small Electrical and Electronic Equipment in the EU; Publications Office of the European Union: Luxembourg, 2022. [Google Scholar]
  7. Colasante, A.; D’Adamo, I.; Morone, P.; Rosa, P. Assessing the circularity performance in a European cross-country comparison. Environ. Impact Assess. Rev. 2022, 93, 106730. [Google Scholar] [CrossRef]
  8. Jabbour, C.J.C.; Colasante, A.; D’Adamo, I.; Rosa, P.; Sassanelli, C. Comprehending e-waste limited collection and recycling issues in Europe: A comparison of causes. J. Clean. Prod. 2023, 427, 139257. [Google Scholar] [CrossRef]
  9. Arain, A.; Pummill, R.; Adu-Brimpong, J.; Becker, S.; Green, M.; Ilardi, M.; Van Dam, E.; Neitzel, R. Analysis of e-waste recycling behavior based on survey at a Midwestern US University. Waste Manag. 2020, 105, 119–127. [Google Scholar] [CrossRef]
  10. Wang, F.; Huisman, J.; Meskers, C.E.M.; Schluep, M.; Stevels, A.; Hagelüken, C. The Best-of-2-Worlds philosophy: Developing local dismantling and global infrastructure network for sustainable e-waste treatment in emerging economies. Waste Manag. 2012, 32, 2134–2146. [Google Scholar] [CrossRef] [PubMed]
  11. Zhang, Y.; Wu, S.; Rasheed, M.I. Conscientiousness and smartphone recycling intention: The moderating effect of risk perception. Waste Manag. 2020, 101, 116–125. [Google Scholar] [CrossRef]
  12. Cheshmeh, Z.A.; Bigverdi, Z.; Eqbalpour, M.; Kowsari, E.; Ramakrishna, S.; Gheibi, M. A comprehensive review of used electrical and electronic equipment management with a focus on the circular economy-based policy-making. J. Clean. Prod. 2023, 389, 136132. [Google Scholar] [CrossRef]
  13. Grohol, M.; Veeh, C. Study on the Critical Raw Materials for the EU 2023—Final Report; Directorate General for Internal Market, Industry, Entrepreneurship and SMEs; European Commission: Brussels, Belgium, 2023. [Google Scholar]
  14. Chakraborty, S.C.; Qamruzzaman, M.; Zaman, M.W.U.; Alam, M.M.; Hossain, M.D.; Pramanik, B.K.; Nguyen, L.N.; Nghiem, L.D.; Ahmed, M.F.; Zhou, J.L.; et al. Metals in e-waste: Occurrence, fate, impacts and remediation technologies. Process Saf. Environ. Prot. 2022, 162, 230–252. [Google Scholar] [CrossRef]
  15. Dhir, A.; Malodia, S.; Awan, U.; Sakashita, M.; Kaur, P. Extended valence theory perspective on consumers’e-waste recycling intentions in Japan. J. Clean. Prod. 2021, 312, 127443. [Google Scholar] [CrossRef]
  16. Debnath, B.; Das, A.; Das, S. Studies on Security Threats in Waste Mobile Phone Recycling Supply Chain in India. In Proceedings of the 2020 IEEE Calcutta Conference (CALCON), Kolkata, India, 28–29 February 2020. [Google Scholar]
  17. Bai, H.; Wang, J.; Zeng, A.Z. Exploring Chinese consumers’ attitude and behavior toward smartphone recycling. J. Clean. Prod. 2018, 188, 227–236. [Google Scholar] [CrossRef]
  18. Parajuly, K.; Fitzpatrick, C.; Muldoon, O.; Kuehr, R. Behavioral change for the circular economy: A review with focus on electronic waste management in the EU. Resour. Conserv. Recycl. X 2020, 6, 100035. [Google Scholar] [CrossRef]
  19. Jabbour, C.J.C.; Colasante, A.; D’Adamo, I.; Rosa, P.; Sassanelli, C. Customer attitudes toward circular economy in the E-waste context: A survey assessing sustainable consumption dynamics. IEEE Eng. Manag. Rev. 2023, 51, 28–45. [Google Scholar] [CrossRef]
  20. Koshta, N.; Patra, S.; Singh, S.P. Sharing economic responsibility: Assessing end user’s willingness to support E-waste reverse logistics for circular economy. J. Clean. Prod. 2022, 332, 130057. [Google Scholar] [CrossRef]
  21. Corsini, F.; Gusmerotti, N.M.; Frey, M. Consumer’s circular behaviors in relation to the purchase, extension of life, and end of life management of electrical and electronic products: A review. Sustainability 2020, 12, 10443. [Google Scholar] [CrossRef]
  22. Islam, M.T.; Huda, N. Reshaping WEEE management in Australia: An investigation on the untapped WEEE products. J. Clean. Prod. 2020, 250, 119496. [Google Scholar]
  23. Thukral, S.; Shree, D.; Singhal, S. Consumer behaviour towards storage, disposal and recycling of e-waste: Systematic review and future research prospects. Benchmarking Int. J. 2023, 30, 1021–1072. [Google Scholar]
  24. Islam, M.T.; Dias, P.; Huda, N. Waste mobile phones: A survey and analysis of the awareness, consumption and disposal behavior of consumers in Australia. J. Environ. Manag. 2020, 275, 111111. [Google Scholar] [CrossRef] [PubMed]
  25. Liu, J.; Bai, H.; Zhang, Q.; Jing, Q.; Xu, H. Why are obsolete mobile phones difficult to recycle in China? Resour. Conserv. Recycl. 2019, 141, 200–210. [Google Scholar] [CrossRef]
  26. Yin, J.; Gao, Y.; Xu, H. Survey and analysis of consumers’ behaviour of waste mobile phone recycling in China. J. Clean. Prod. 2014, 65, 517–525. [Google Scholar] [CrossRef]
  27. Subhaprada, C.S.; Kalyani, P. Study on awareness of e-waste management among medical students. Int. J. Community Med. Public Health 2017, 4, 506–510. [Google Scholar] [CrossRef]
  28. Boiocchi, R.; Adami, L.; Rada, E.C.; Schiavon, M. Towards context-independent indicators for an unbiased assessment of environmental sustainability in higher education: An application to Italian universities. J. Environ. Manag. 2024, 366, 121658. [Google Scholar] [CrossRef] [PubMed]
  29. Prabhu, N.S.; Majhi, R. Disposal of obsolete mobile phones: A review on replacement, disposal methods, in-use lifespan, reuse and recycling. Waste Manag. Res. 2023, 41, 18–36. [Google Scholar] [CrossRef] [PubMed]
  30. Martinho, G.; Magalhães, D.; Pires, A. Consumer behavior with respect to the consumption and recycling of smartphones and tablets: An exploratory study in Portugal. J. Clean. Prod. 2017, 156, 147–158. [Google Scholar] [CrossRef]
  31. Cordella, M.; Alfieri, F.; Clemm, C.; Berwald, A. Durability of smartphones: A technical analysis of reliability and repairability aspects. J. Clean. Prod. 2021, 286, 125388. [Google Scholar] [CrossRef]
  32. Gómez, M.; Grimes, S.; Qian, Y.; Feng, Y.; Fowler, G. Critical and strategic metals in mobile phones: A detailed characterisation of multigenerational waste mobile phones and the economic drivers for recovery of metal value. J. Clean. Prod. 2023, 419, 138099. [Google Scholar] [CrossRef]
  33. Tansel, B. From electronic consumer products to e-wastes: Global outlook, waste quantities, recycling challenges. Environ. Int. 2017, 98, 35–45. [Google Scholar] [CrossRef]
  34. Vats, M.; Singh, S. Assessment of gold and silver in assorted mobile phone printed circuit boards (PCBs). Waste Manag. 2015, 45, 280–288. [Google Scholar] [CrossRef]
  35. Oraee, A.; Pohl, L.; Geurts, D.; Reichel, M. Overcoming premature smartphone obsolescence amongst young adults. Clean. Responsible Consum. 2024, 12, 100174. [Google Scholar]
  36. Calafell, G.; Banqué, N.; Viciana, S. Purchase and Use of New Technologies among Young People: Guidelines for Sustainable Consumption Education. Sustainability 2019, 11, 1541. [Google Scholar] [CrossRef]
  37. Li, A.; Li, B.; Liu, X.; Zhang, Y.; Zhang, H.; Lei, X.; Hou, S.; Lu, B. Characteristics and dynamics of university students’ awareness of retired mobile phones in China. Sustainability 2022, 14, 10587. [Google Scholar] [CrossRef]
  38. Zhang, L.; Ran, W.; Jiang, S.; Wu, H.; Yuan, Z. Understanding consumers’ behavior intention of recycling mobile phone through formal channels in China: The effect of privacy concern. Resour. Environ. Sustain. 2021, 5, 100027. [Google Scholar] [CrossRef]
  39. Palmieri, R.; Bonifazi, G.; Serranti, S. Recycling-oriented characterization of plastic frames and printed circuit boards from mobile phones by electronic and chemical imaging. Waste Manag. 2014, 34, 2120–2130. [Google Scholar] [CrossRef]
  40. Ongondo, F.; Williams, I. Mobile phone collection, reuse and recycling in the UK. Waste Manag. 2011, 31, 1307–1315. [Google Scholar] [CrossRef]
  41. Hagelüken, C.; Corti, C.W. Recycling of gold from electronics: Cost-effective use through ‘Design for Recycling’. Gold Bull. 2010, 43, 209–220. [Google Scholar] [CrossRef]
  42. Ragonnaud, G. Critical Raw Materials Act; EPRS, European Parliament: Bruxelles, Belgium, 2023.
  43. Ylä-Mella, J.; Keiski, R.L.; Pongrácz, E. Electronic waste recovery in Finland: Consumers’ perceptions towards recycling and re-use of mobile phones. Waste Manag. 2015, 45, 374–384. [Google Scholar] [CrossRef]
  44. Borthakur, A.; Govind, M. Computer and mobile phone waste in urban India: An analysis from the perspectives of public perception, consumption and disposal behaviour. J. Environ. Plan. Manag. 2019, 62, 717–740. [Google Scholar] [CrossRef]
  45. Saphores, J.-D.M.; Ogunseitan, O.A.; Shapiro, A.A. Willingness to engage in a pro-environmental behavior: An analysis of e-waste recycling based on a national survey of US households. Resour. Conserv. Recycl. 2012, 60, 49–63. [Google Scholar] [CrossRef]
  46. Sochnikoff, I.; Lange, F. How to promote mobile phone recovery? Evaluation of a collection campaign in Belgian schools. Clean. Responsible Consum. 2024, 15, 100231. [Google Scholar] [CrossRef]
  47. Montgomery, D.C.; Runger, G.C.; Hubele, N.F. Engineering Statistics; John Wiley & Sons: Hoboken, NJ, USA, 2009. [Google Scholar]
  48. Kendall, M.G. The Advanced Theory of Statistics, 2nd ed.; Oxford University Press: Oxford, UK, 1946. [Google Scholar]
  49. Pinto, F.S.; Simões, P.; Marques, R.C. Raising the bar: The role of governance in performance assessments. Util. Policy 2017, 49, 38–47. [Google Scholar] [CrossRef]
  50. Novais, A.F.; Tavares, A.F. Governance models and performance in municipal solid waste management: Evidence from local authorities. J. Environ. Manag. 2025, 386, 125829. [Google Scholar] [CrossRef] [PubMed]
  51. Cucchiella, F.; D’Adamo, I.; Koh, S.L.; Rosa, P. Recycling of WEEEs: An economic assessment of present and future e-waste streams. Renew. Sustain. Energy Rev. 2015, 51, 263–272. [Google Scholar] [CrossRef]
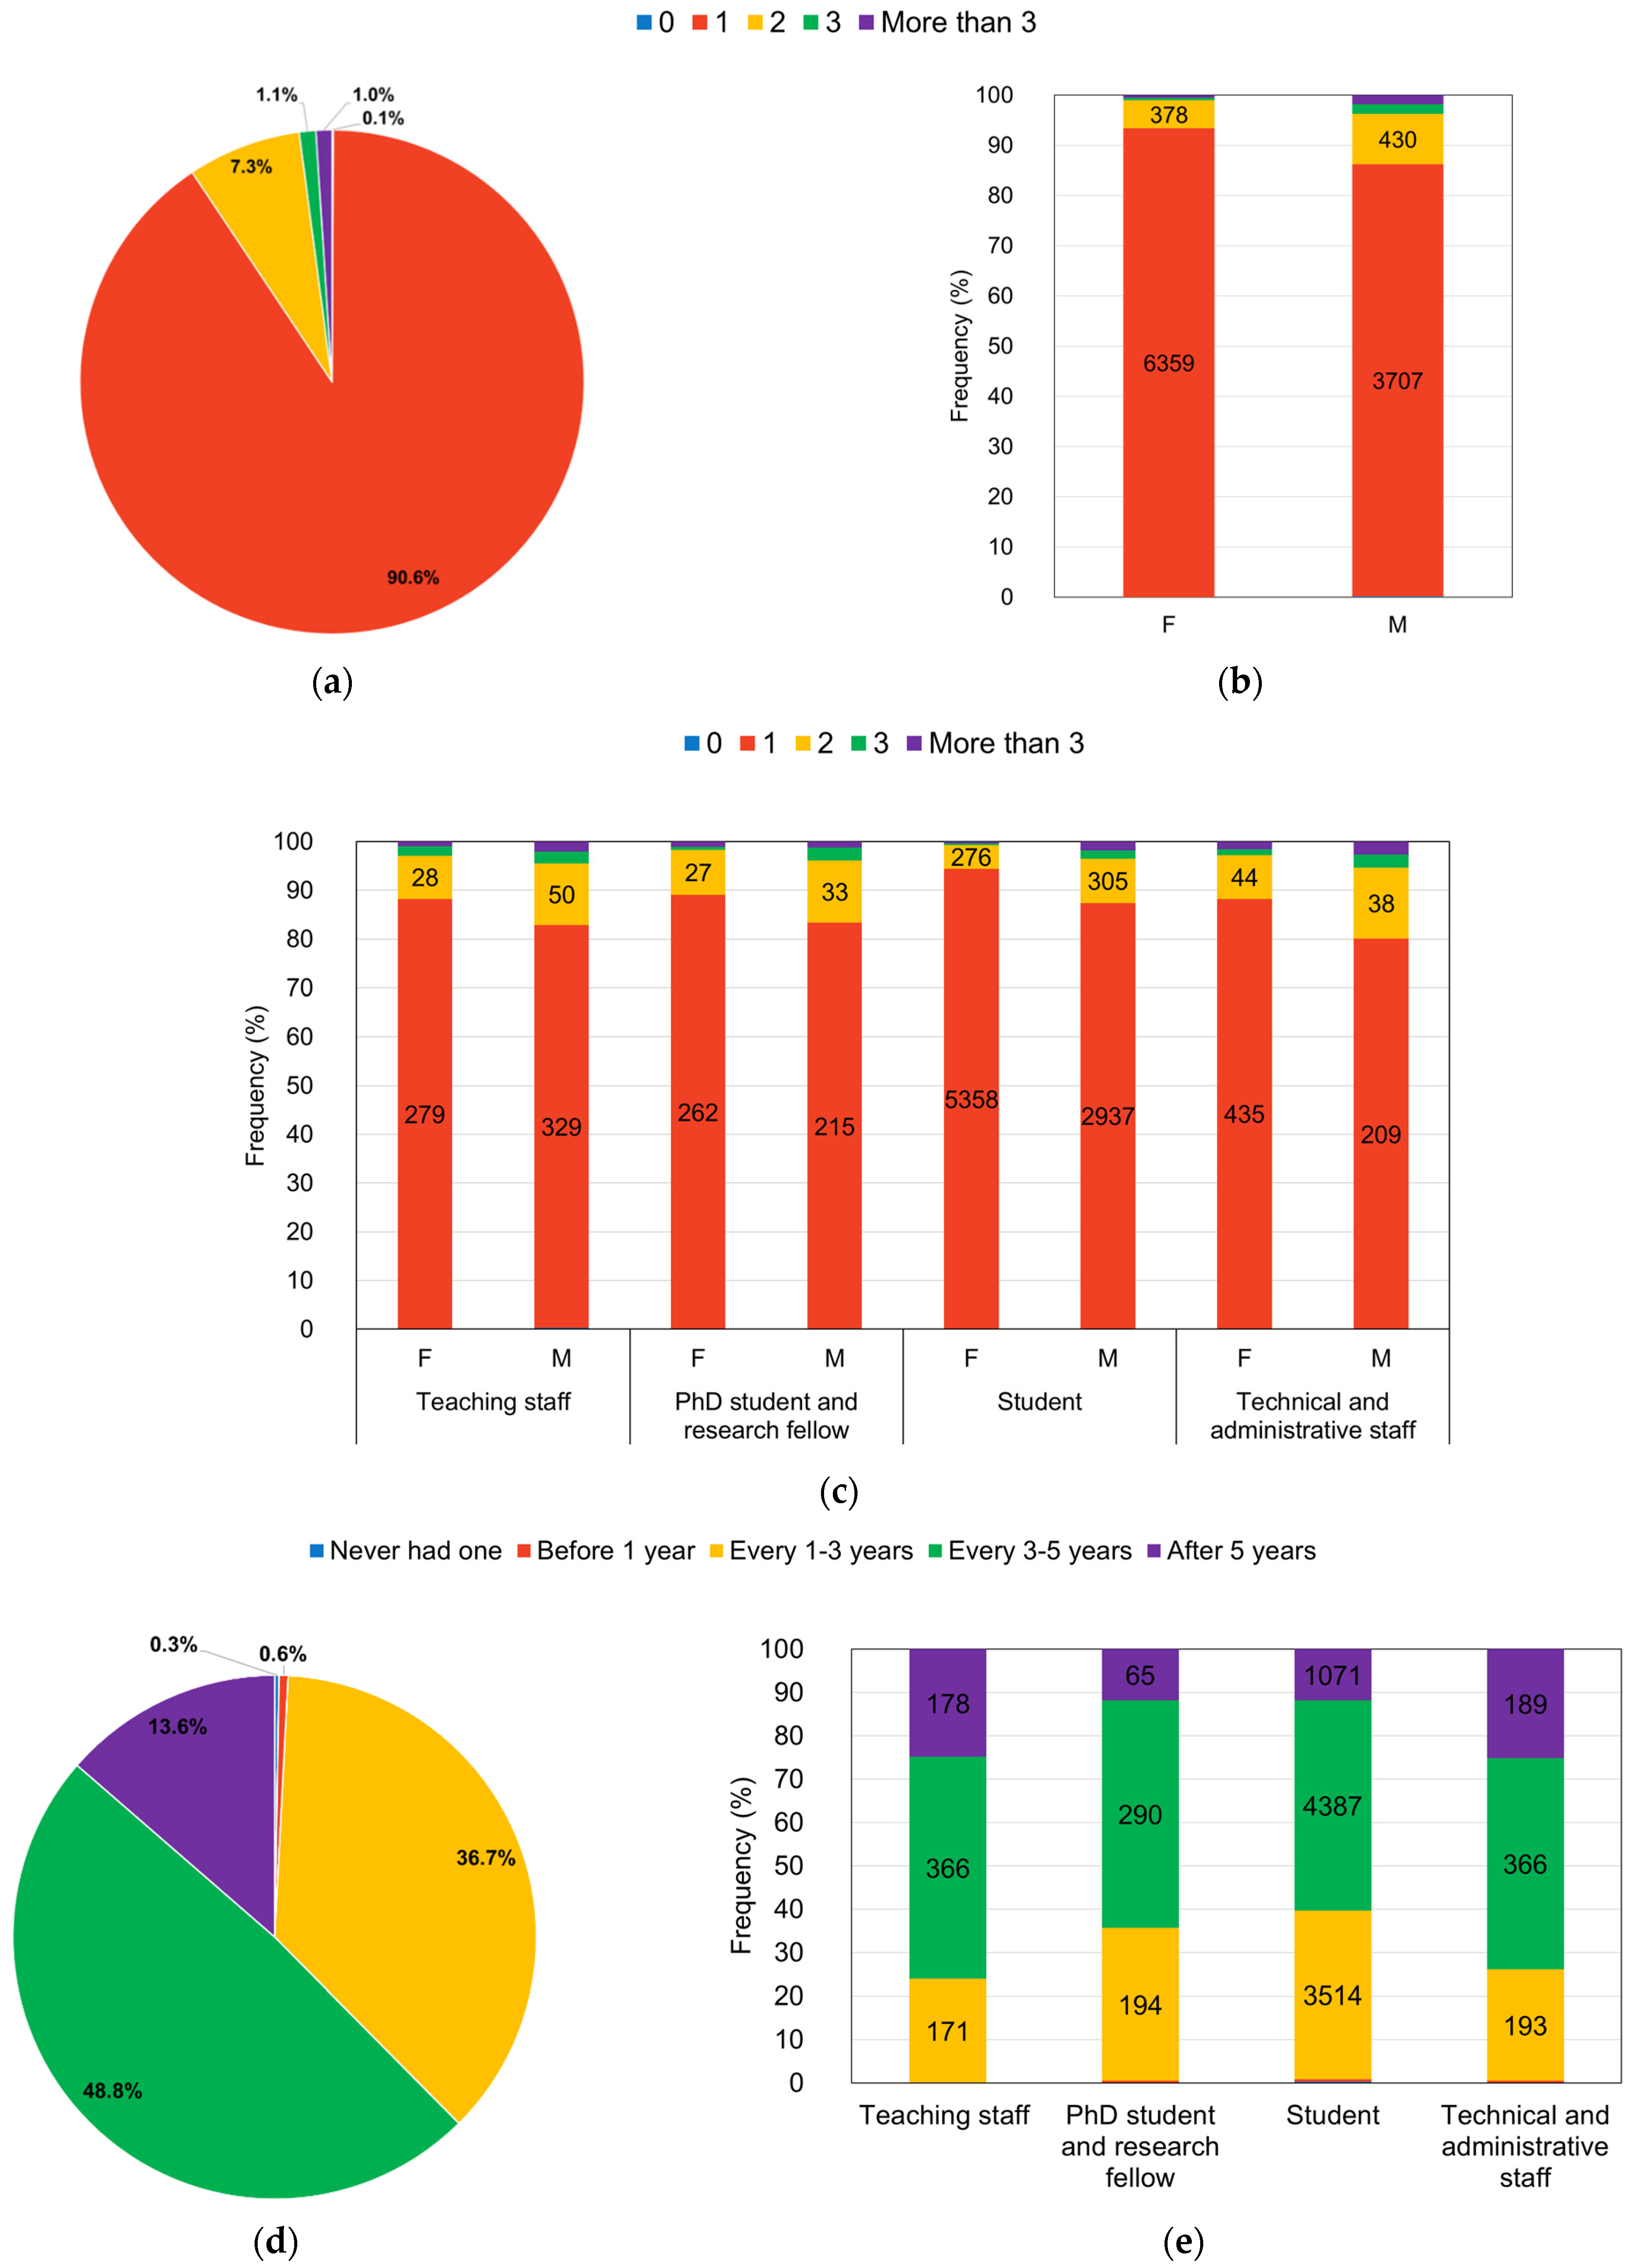
Figure 1. HB01: “How many mobile phones do you own?” A pie chart of responses to the question (a), frequency distribution of owned mobile phones by gender (b) and distribution of the number of mobile phones owned by respondents across different roles (c). Female: F, Male: M. HB02: “How often do you replace your mobile phone?” A pie chart of responses to the question (d) and distribution of respondents according to their role (e). In (b,c,e), data labels for each bar represent the number of participants.
Recycling 10 00129 g001
Figure 2. A pie chart of responses to the question HB03 “What reasons lead you or would lead you to buy a new mobile phone to replace the previous one?” (a) and comparison between the different roles subdivided in males and females (b). Data labels for each bar represent the number of participants.
Recycling 10 00129 g002
Figure 3. Question HB04: “What conditions is your mobile phone when you decide to replace it?” Pie chart of responses (a), frequency of male and female respondents, divided into roles (b) and frequency of male and female student respondents, divided into disciplines (c). In (b,c), data labels for each bar represent the number of participants.
Recycling 10 00129 g003aRecycling 10 00129 g003b
Figure 4. Question HB05: “What do you do (or would you do) with a mobile phone you no longer use?” A pie chart of responses to the question (a) and frequency of respondents by role (b). Question HB06: “How many discarded mobile phones do you keep at home?”: number of participants vs. number of discarded mobile phones kept at home (c), and frequency of female and male respondents, divided into role categories (d). In (b,c,d), data labels for each bar represent the number of participants. In (d), for the “More than one” group, the included answers are the following: 2, 3, 4, 5, 6, 7, 8, 9, 10 and >10.
Recycling 10 00129 g004aRecycling 10 00129 g004b
Figure 5. Frequency distribution of responses divided by roles and gender to the questions KA01 “Do you know that mobile phones contain hazardous elements for the health and the environment?” (a), KA02 “Do you know that, if not properly disposed of, mobile phones can release hazardous elements such as lead, bromine, chromium, arsenic and antimony?” (b), and KA03 “Do you know that mobile phones contain precious and rare metals such as silver, gold, platinum and rare earths?” (c) and frequency of male and female student respondents, divided into disciplines (d). Data labels for each bar represent the number of participants.
Recycling 10 00129 g005
Figure 6. Response to questions KA04 “Do you know that the concentrations of copper, gold, silver and other strategic chemical elements present in mobile phones are much higher than those found in a mineral deposit?” (a), KA05 “Critical raw materials (CRMs) are identified by the European Commission based on two factors: economic importance and supply risk for European industry. Do you know that there are currently 27 (now 34) critical raw materials identified by the European Union?” (b), KA06 “Do you know that critical raw materials such as rare earths, tantalum and indium are used in the manufacturing of mobile phones?” (c), and KA07 “Are you aware of the existence off a particular strategic raw material, called Coltan, mainly extracted in Congo that is used in the construction of mobile phones?” (d). Frequency distribution of responses related to role and gender to questions KA08: “Do you know that the acronym WEEE stands for Waste from Electrical and Electronic Equipment?” (e) and KA09a: “One-for-one operation. Since June 2010, there has been a ‘one-for-one’ WEEE take-back obligation: sellers of electrical and electronic equipment are required to take back WEEE free of charge when the customer purchases a new equivalent product. Were you aware of this?” (f). Data labels for each bar represent the number of participants.
Recycling 10 00129 g006
Figure 7. Response to question OC01 ‘‘In your opinion, why is the separate collection of this type of waste important?”. Responses in terms of number of participants (a); OC02 “What do you consider to be your level knowledge regarding the proper disposal of mobile phones?” (b); OC03 “How much do you think you are a responsible and generally informed consumer/user regarding WEEE?”, overall answers (c) and distribution across roles and genders (d); OC04 “How much do you think this questionnaire has helped you increase your knowledge and awareness about WEEE in general?” (e); and OC05 “Do you think it is important to share this knowledge and information with your colleagues, friends and family?” (f). Data labels for each bar in (d) represent the number of participants.
Recycling 10 00129 g007aRecycling 10 00129 g007b
Table 1. General information about gender, age and role of survey respondents. NA: Not Answered.
Gendern%
Female682161.29
Male430838.71
NA340.30
Tot.11,163100
Age [Years]n%
<20 6085.45
20–29772469.33
30–3910229.16
40–495995.37
50–597006.27
60–704173.74
>70480.44
NA270.24
Tot.11,136100.00
Rolen%
Teaching staff7186.47
  Full professor1331.20
  Assistant professor1481.33
  Associate professor2872.59
  Adjunct professor870.78
  Fixed-term researcher type A380.34
  Fixed-term researcher type B250.23
PhD student and research fellow5534.98
  PhD student and medical resident3703.33
  Collaborator600.54
  Research fellow990.89
  Research grant holder240.22
Student906981.73
Technical and administrative staff7566.81
  Technical and administrative staff (non-Managerial Staff)7276.55
  Manager290.26
Tot.11,096100.00
Note: The totals differ slightly among categories because some respondents did not answer the questions about age (n = 27) or role (n = 67), although they completed the other sections of the survey. These missing values were not considered in the breakdown of the “Role” category.
Table 2. Main results of the survey study.
CategoryKey FindingsStatistical NotesComparison with the Literature
Phone ownership90.6% own one phone Descriptive statistics Similar trends observed in Portugal [30]
Males more likely to own >1 phoneChi-square test,
p < 0.001
Replacement frequency48.8% replace every 3–5 years; 36.7% every 1–3 yearsDescriptive statisticsSimilar findings in [24,31]
Students replace more oftenChi-square test,
p < 0.001
Similar findings in [24,35,36]
Reasons for replacement54% due to damage, 46% due to high repair cost; only 20.2% wait until irreparable.Descriptive statistics Similar findings in [24,29,30,37]
Females more likely to replace due to damage than malesChi-square test,
p < 0.05
Novel insights
Conditions at replacement20.2% irreparable, 23.1% still functioning, 46.0% repairable at higher cost, broken but repairable 10.7%Descriptive statisticsSimilar findings in [24,37]
Females more likely to replace when irreparable than males, males more likely when it is still functioningChi-square test,
p < 0.05
Similar findings in [30]
Handling of unused MBs47.3% keep at home, 17.2% keep for potential spare parts, 11.7% donate, only 9.8% recycleDescriptive statisticsSimilar findings in [6,29,38,39,40]
Students more likely to keep for spare parts or to resell than staff categories and less likely to take to the recycling center or retailerChi-square test,
p < 0.05
Novel insights
Urban mine estimate92.3% store at least one old phone at homeDescriptive statisticsNovel insights
Students more likely to keep more than one discarded MP than other rolesChi-square test,
p < 0.05
Novel insights
Estimated 29,799 unused phones storedExtrapolated from survey responsesNovel insights
Awareness: hazardous components92.6% aware Descriptive statisticsNovel insights
Males more aware than femalesChi-square test,
p < 0.001
Similar findings in [30]
Awareness: precious and rare metals65.2% aware Descriptive statistics
Similar findings in [8]
Males more aware than femalesChi-square test,
p < 0.05
Novel insights
STEEM students more informed than HASS and Medicine studentsChi-square test,
p < 0.05
Novel insights
Awareness of critical raw materials74.3% unaware MPs contain CRMs, 90.9% unaware of EU CRM list, 73.6% do not know ColtanDescriptive statisticsNovel insights
Awareness: take-back programs73.3% unaware of “One-for-One”; 88.3% unaware of “One-for-Zero”Descriptive statisticsLow take-back awareness compared to other countries [24,30,40,43]
Younger groups less awareChi-square test,
p < 0.001
Similar findings in [44,45]
Self-assessment WEEE knowledge41.5% poor, 40.3% fair, only 8.1% very goodDescriptive statisticsNovel insights
Students and females perceived themselves as being less informedChi-square test,
p < 0.05
Novel insights
Educational impact of survey90% reported increased awareness after the surveyDescriptive statisticsNovel insights
Support for collection system93.1% support implementation of on-campus WEEE collection systemDescriptive statisticsNovel insights
Table 3. The structure of the questionnaire on “End-of-life mobile phones management”, subdivided in four sections.
SectionQuestions
Section 1. General Information (GI)GI01. Please choose your gender (Multiple choice with single answer)
GI02. Please choose your age (Multiple choice with single answer)
GI03. Please choose your current position (role) at the University (Multiple choice with single answer)
GI04. If you are a staff member, which is the structure you belong to? (Multiple choice with single answer)
GI05. If you are a student, what is your Faculty of affiliation? (Multiple choice with single answer)
GI06. If you are a student, which is your program? (Multiple choice with single answer)
GI07. If you are a student, which is your program year? (Multiple choice with single answer)
Section 2. Habits and Behaviors (HB) towards EoL mobile phones managementHB01. How many mobile phones do you own? (Multiple choice with single answer)
HB02. How often do you replace your mobile phone? (Multiple choice with single answer)
HB03. What reasons lead you or would lead you to buy a new mobile phone to replace the previous one? (Multiple choice with single answer)
HB04. What condition is your mobile phone in when you decide to replace it? (Multiple choice with single answer)
HB05. What do you do (or would you do) with a mobile phone you no longer use? (Multiple choice with single answer)
HB06. How many discarded mobile phones do you keep at home? Indicate a number (e.g., 0, 1, 2, etc.). (Open-ended answer)
Section 3. Knowledge and Awareness (KA) about EoL mobile phones managementKA01. Do you know that mobile phones contain hazardous elements for the health and the environment? (Yes/No answer)
KA02. Do you know that, if not properly disposed of, mobile phones can release hazardous elements such as lead, bromine, chromium, arsenic and antimony? (Yes/No answer)
KA03. Do you know that mobile phones contain precious and rare metals such as silver, gold, platinum and rare earths? (Yes/No answer)
KA04. Do you know that the concentrations of copper, gold, silver and other strategic chemical elements present in mobile phones are much higher than those found in a mineral deposit?” (Yes/No answer)
KA05. Critical raw materials (CRMs) are identified by the European Commission based on two factors: economic importance and supply risk for European industry. Do you know that there are currently 27 * critical raw materials identified by the European Union? (Yes/No answer)
KA06. Do you know that critical raw materials such as rare earths, tantalum and indium are used in the manufacturing of mobile phones? (Yes/No answer)
KA07. Are you aware of the existence of a particular strategic raw material, called Coltan, mainly extracted in Congo, that is used in the construction of mobile phones? (Yes/No answer)
KA08. Do you know that the acronym WEEE stands for Waste from Electrical and Electronic Equipment? (Yes/No answer)
KA09a: “One-for-one operation. Since June 2010, there has been a ‘one-for-one’ WEEE take-back obligation: sellers of electrical and electronic equipment are required to take back WEEE free of charge when the customer purchases a new equivalent product. Were you aware of this?” (Yes/No answer)
KO09b: “How many times have you used this service?” (Multiple choice with single answer)
KA10a: “One-for-Zero Operation. Since April 2014, the ‘one-for-zero’ take-back obligation has also been introduced: stores selling electrical and electronic equipment with a sales area larger than 400 square meters are required to accept ‘very small WEEE’ (maximum size 25 cm) free of charge, even when the customer does not purchase a new product. Were you aware of this service?” (Yes/No answer)
KA10b: “How do you rate this service?” (Multiple choice with single answer)
Section 4. Opinions and Conclusions (OC)OC01. In your opinion, why is the separate collection of this type of waste important? (Multiple choice with single answer for 5 different motivations: 4-level scale from “No importance” to “Fundamental importance”)
OC02. What do you consider to be your level of knowledge regarding the proper disposal of mobile phones? (Multiple choice with single answer: 4-level scale from none to very good)
OC03. How much do you think you are a responsible and generally informed consum-er/user regarding WEEE? (Multiple choice with single answer: 4-level scale from “not at all” to “significantly”)
OC04. How much do you think this questionnaire has helped you to increase your knowledge and awareness about WEEE in general? (Multiple choice with single answer: 4-level scale from “not at all” to “significantly”)
OC05. Do you think it is important to share this knowledge and information with your colleagues, friends and family? (Multiple choice with single answer: 4-level scale from “not at all” to “significantly”)
OC06. If there were a collection system for small WEEE at Sapienza, would you use it? (Yes/No answer)
(*) In 2017 the list of CRMs for the EU was composed of 27 raw materials, while the current list (updated in 2023) includes 34 raw materials [13].
Disclaimer/Publisher’s Note: The statements, opinions and data contained in all publications are solely those of the individual author(s) and contributor(s) and not of MDPI and/or the editor(s). MDPI and/or the editor(s) disclaim responsibility for any injury to people or property resulting from any ideas, methods, instructions or products referred to in the content.