Article

From Waste to Product: New Circularity by Recovering Polypropylene from Mixed Commercial Waste

1
Chair of Waste Processing Technology and Waste Management, Montanuniversitaet Leoben, Franz-Josef-Strasse 18, 8700 Leoben, Austria
2
Institute of Materials Science and Technology, Faculty of Mechanical and Industrial Engineering, TU Wien, Gumpendorferstrasse 7, Object 8, 1060 Vienna, Austria
3
Chair of Process Technology and Industrial Environmental Protection, Department of Environmental and Energy Process Engineering, Montanuniversitaet Leoben, Franz-Josef-Strasse 18, 8700 Leoben, Austria
*
Author to whom correspondence should be addressed.
Recycling 2025, 10(4), 128; https://doi.org/10.3390/recycling10040128
Submission received: 26 May 2025 / Revised: 17 June 2025 / Accepted: 26 June 2025 / Published: 27 June 2025

Abstract

To meet the EU’s ambitious recycling targets, it is crucial to expand mechanical recycling to include currently underutilized waste streams, such as mixed commercial waste (MCW), which today achieves a recycling rate of only 3–5%. This study addresses the challenge of recovering polypropylene (PP) from MCW and demonstrates a viable process to do so. The goal was to develop and test industrial-scale process concepts to extract PP and transform it into high-quality recyclate. Two process concepts were developed and tested at industrial scale to extract PP as a pre-concentrate. The recovered material was further sorted, shredded, washed, and granulated, ultimately reaching End-of-Waste status. Material analysis confirmed that the resulting PP granulate meets all relevant quality standards. A total of 456.8 kg of this recyclate was processed into market-ready products. To the best of the authors’ knowledge, this is the first demonstration of plastic products made entirely from MCW. By covering the full value chain—from waste to final product—this study highlights a viable and scalable approach for integrating complex waste streams into high-quality material cycles, thereby contributing to circular economy strategies.

1. Introduction

The European Union (EU) has set ambitious recycling targets as part of its Circular Economy Action Plan, aiming to recycle 65% of municipal waste and 55% of plastic packaging waste by 2030 [1]. Austria achieved a recycling rate of 62.5% for municipal waste in 2021 [2]. However, only 25% of plastic packaging was recycled in the same year in Austria [3]. As a result, the waste management sector faces significant challenges in meeting recycling targets across the entire value chain.
According to Austria’s federal waste management plan [3], “the volume of plastics in primary waste in 2021 amounted to approximately 1.05 million tonnes. The majority of this (around 81%) was found in mixed waste streams, while only about 19% was accounted for separately collected (mono-material) plastic waste”. This indicates a substantial untapped potential for increasing plastic recycling rates, particularly through the recovery of plastics from mixed commercial waste (MCW) and mixed municipal waste (MMW).
This study focuses on MCW, defined as unsorted, non-hazardous residual solid waste originating from non-municipal sources, such as offices, construction sites, and production facilities, that is not segregated into specific material streams. In Austria, MCW is classified under waste catalogue code 91101, “municipal and similar commercial waste” [4]. The lack of specific legal provisions and clear definitions leads to overlaps with MMW, which, in turn, limits the availability of reliable data on MCW.
In Austria, MCW is commonly processed in waste treatment plants (WTPs) into solid recovered fuels (SRF) of varying qualities [5,6,7,8], which can be used as secondary fuel in co-incineration plants, such as in the cement industry [9,10,11,12]. According to Pomberger [13], metals are currently the only recyclable fraction separated and recovered in this process, which results in a recycling rate of just 3 to 5% for MCW in Austria [14]. To increase this rate, it is essential to go beyond energy recovery and identify additional recyclable fractions within MCW.
Several studies have already focused on recycling from MMW [15,16,17,18,19,20,21,22], but few have yet explored the potential in MCW [14,23,24]. While existing research indicates the presence of recoverable materials within MCW, no study to date has demonstrated that recyclable fractions can be extracted in substantial quantities. Addressing this gap, the present work aims to show that fractions suitable for mechanical recycling can be recovered from MCW in relevant amounts, thus unlocking the untapped potential of this waste stream.
To identify new potentially recyclable fractions, a particle size-dependent material analysis of a representative sample of MCW, carried out by Enengel et al. [24], was used and the materials were categorized into five classes: (i) already recycled—materials currently recycled from MCW in state-of-the-art WTPs; (ii) no established recycling market—materials extracted from MCW that lack a viable recycling market due to the quality of the recovered material; (iii) not technically sortable—materials that cannot be effectively sorted using sensor-based sorting (SBS) technologies commonly used in WTPs for MSW (e.g., two-dimensional materials or black and gray fractions); (iv) no sufficient quantities—materials that account for less than 1% of the total mass; (v) potentially recyclable fractions—materials that exhibit characteristics suitable for future recycling efforts.
In most WTPs, the first processing step is screening, separating the material stream into a fine fraction (<60 mm) that is not processed further [25], and a material stream (>60 mm), which is considered for further processing. Therefore, the fractions <60 mm were not considered further. The classification of materials (>60 mm), including the categorization of the materials into their respective categories, can be found in Appendix A. It is important to note that MCW shows considerable variability in its composition, as reflected by the substantial discrepancies in composition data reported in different studies [14,23,24,26,27,28,29].
According to this classification, fractions of polypropylene (PP), polyethylene (PE), polyethylene terephthalate (PET), paper/paperboard/cardboard (PPC), and wood are identified as potentially recyclable materials in MCW. The PPC and wood fractions are not a focus of the current investigation as they would require adaptations to sorting machines not available. In Austria, a deposit return system was introduced in 2025 [30], which is expected to reduce the share of PET bottles within the MCW fraction. A recoverable amount of PET is still likely to remain in the MCW stream. Nevertheless, this study focuses on the mechanical recycling of polyolefins (PE and PP) recovered from MCW, with particular emphasis on PP. PET recovery is recommended as a focus for future research.
Contrary to common assumptions that MMW and MCW are too contaminated or heterogeneous for recycling, recent research by Möllnitz et al. [31] demonstrates that materials of sufficient quality for mechanical recycling can be recovered from such waste streams. This study demonstrates that plastics from MCW can not only be recovered but also processed into recyclates that meet regulatory and market requirements.
To that end, the goal of this work is to unlock the recycling potential of MCW by recovering plastics and following the value chain through to the production of a market-ready product, reaching End-of-Waste status as defined by Article 6(1) of the EU Waste Framework Directive [32].
The current recycling rate for MCW remains in single digits, with most materials being energetically recovered rather than materially recycled. This is largely due to the heterogeneity and contamination of this waste stream, which complicates the extraction of high-quality recyclates. Among the various plastic types present in MCW, polyolefins—particularly polypropylene (PP)—are present in significant quantities and offer favorable mechanical properties for recycling. To the best of current knowledge, this study is the first to recover significant volumes of plastics from MCW and to systematically follow the entire recycling process through to the production of a compliant, market-ready product. It includes detailed recyclate and product characterization to ensure compliance with regulatory and quality standards for reintegration into the material cycle. By demonstrating the feasibility of high-quality mechanical recycling from complex waste streams, this work contributes to advancing circular economy principles and reducing dependence on primary resources and waste incineration.

2. Results

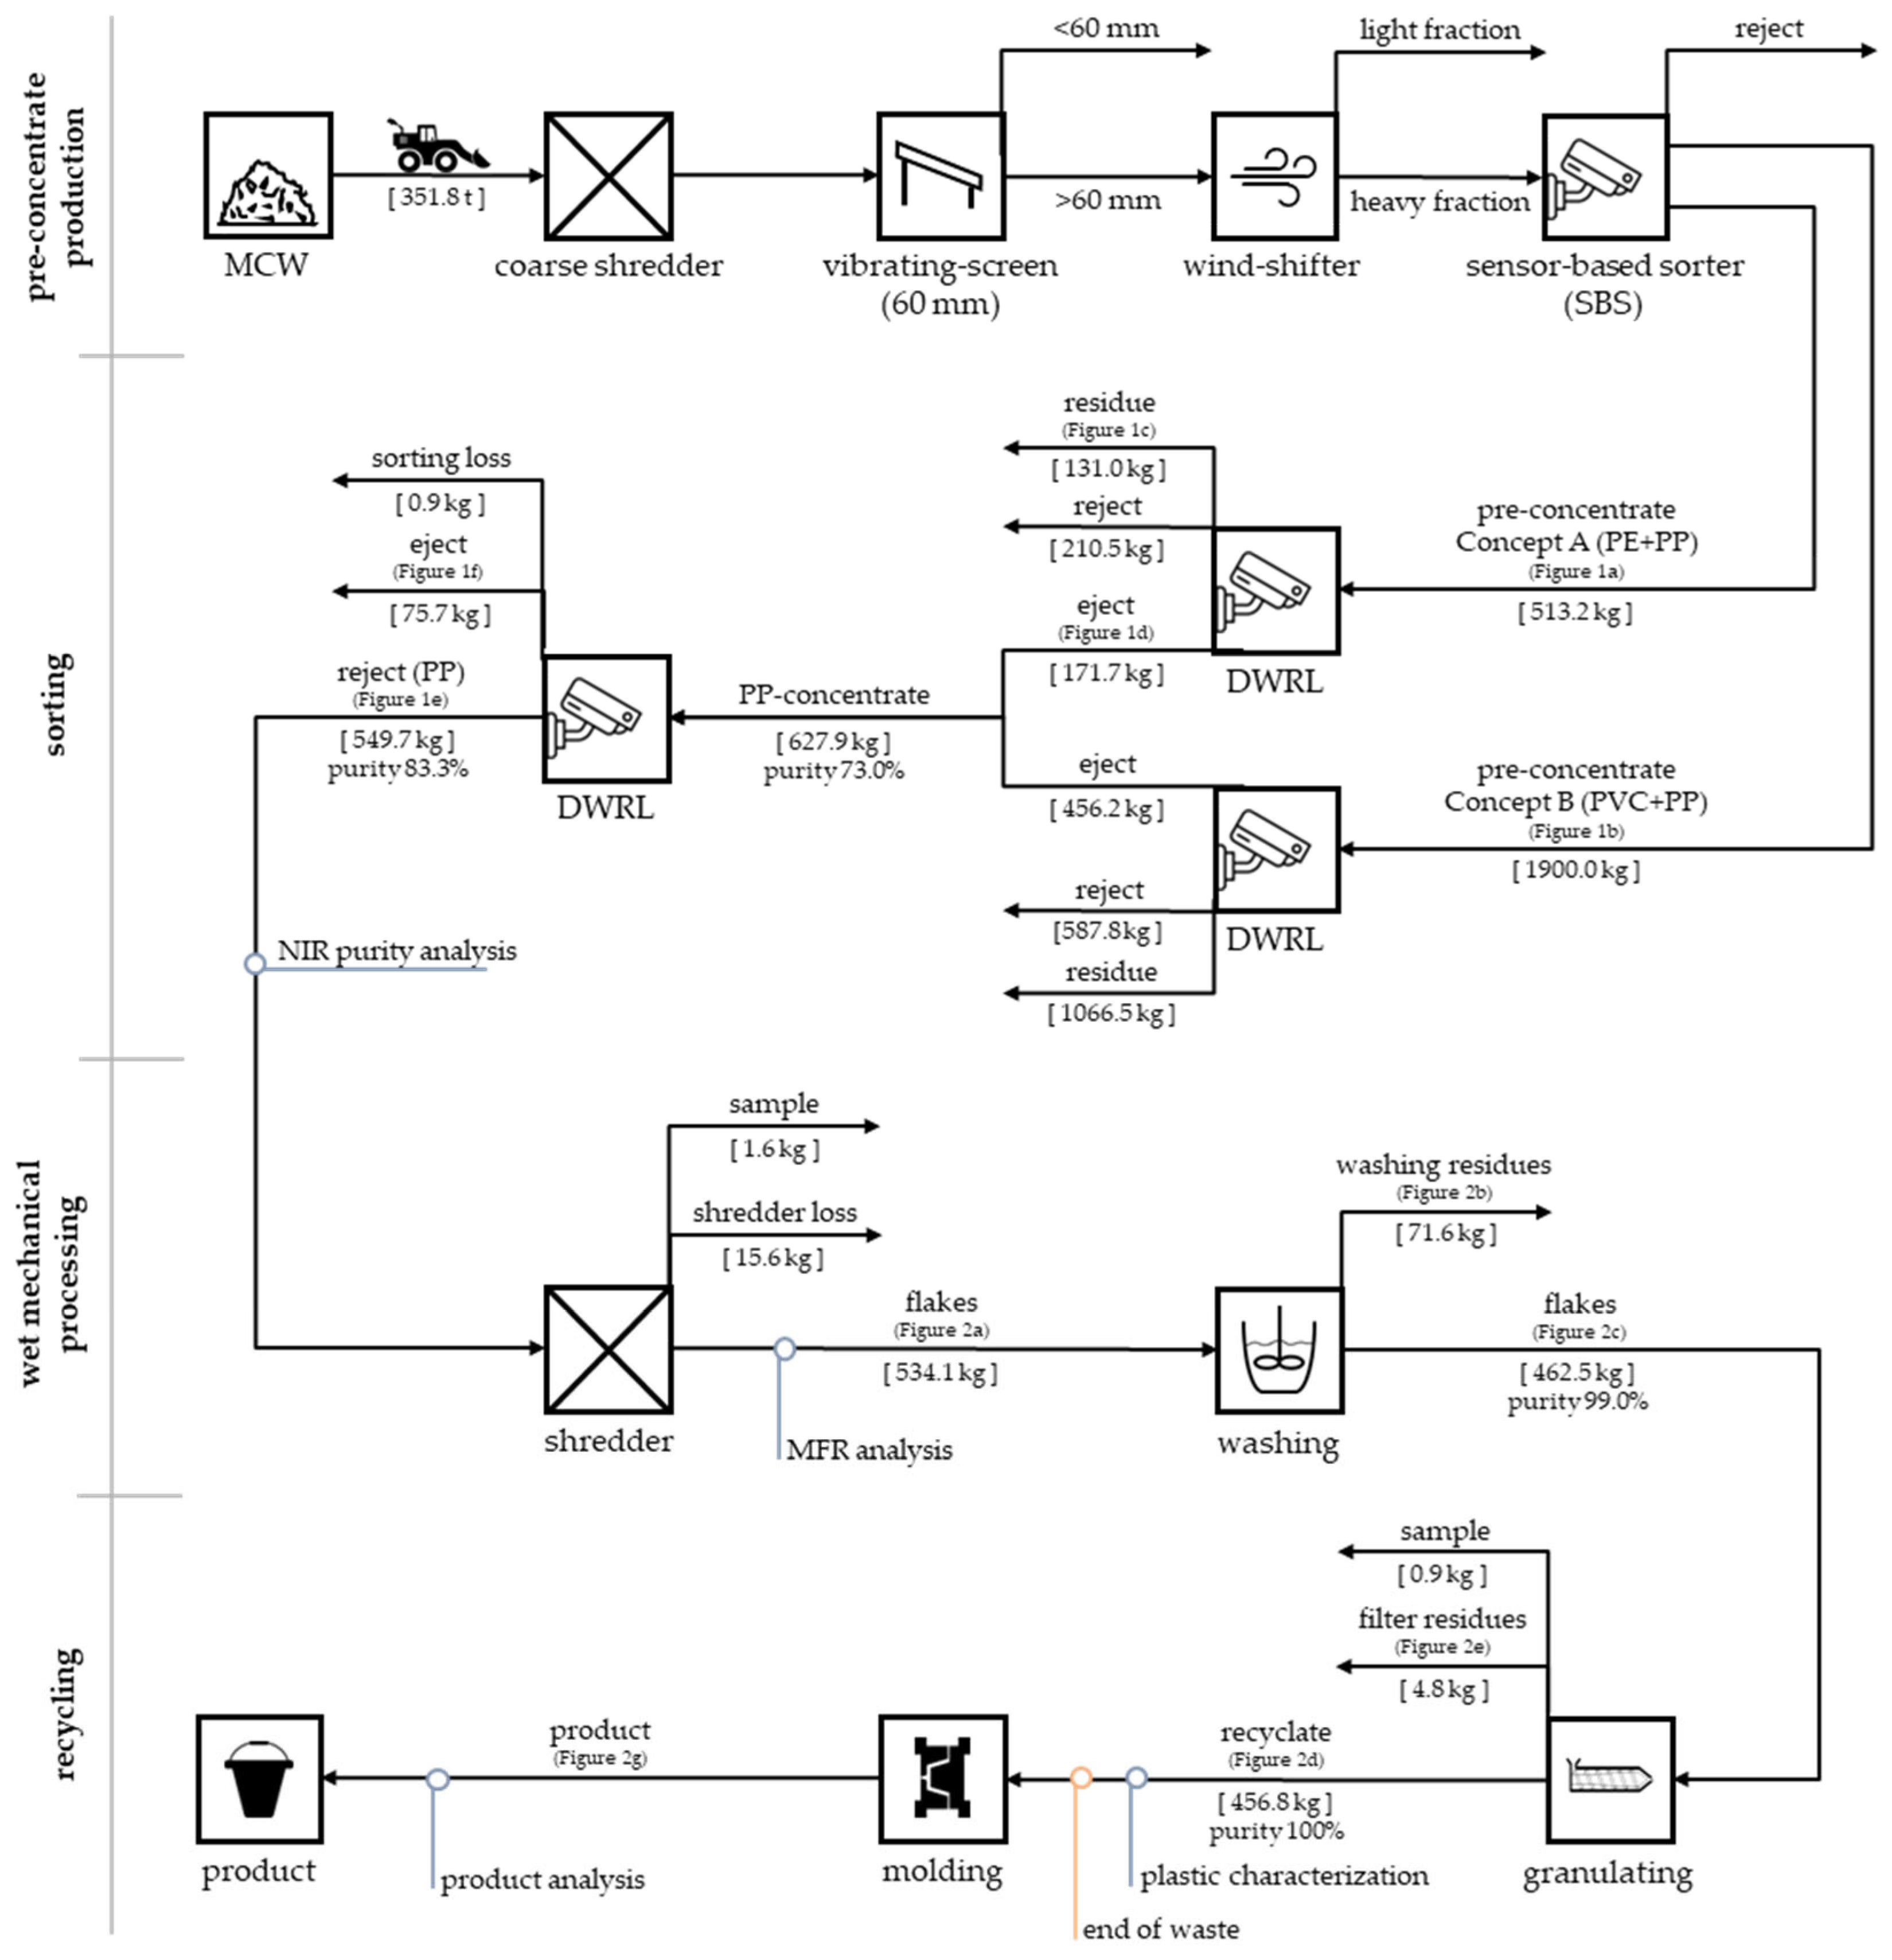
2.1. Pre-Concentrate Production
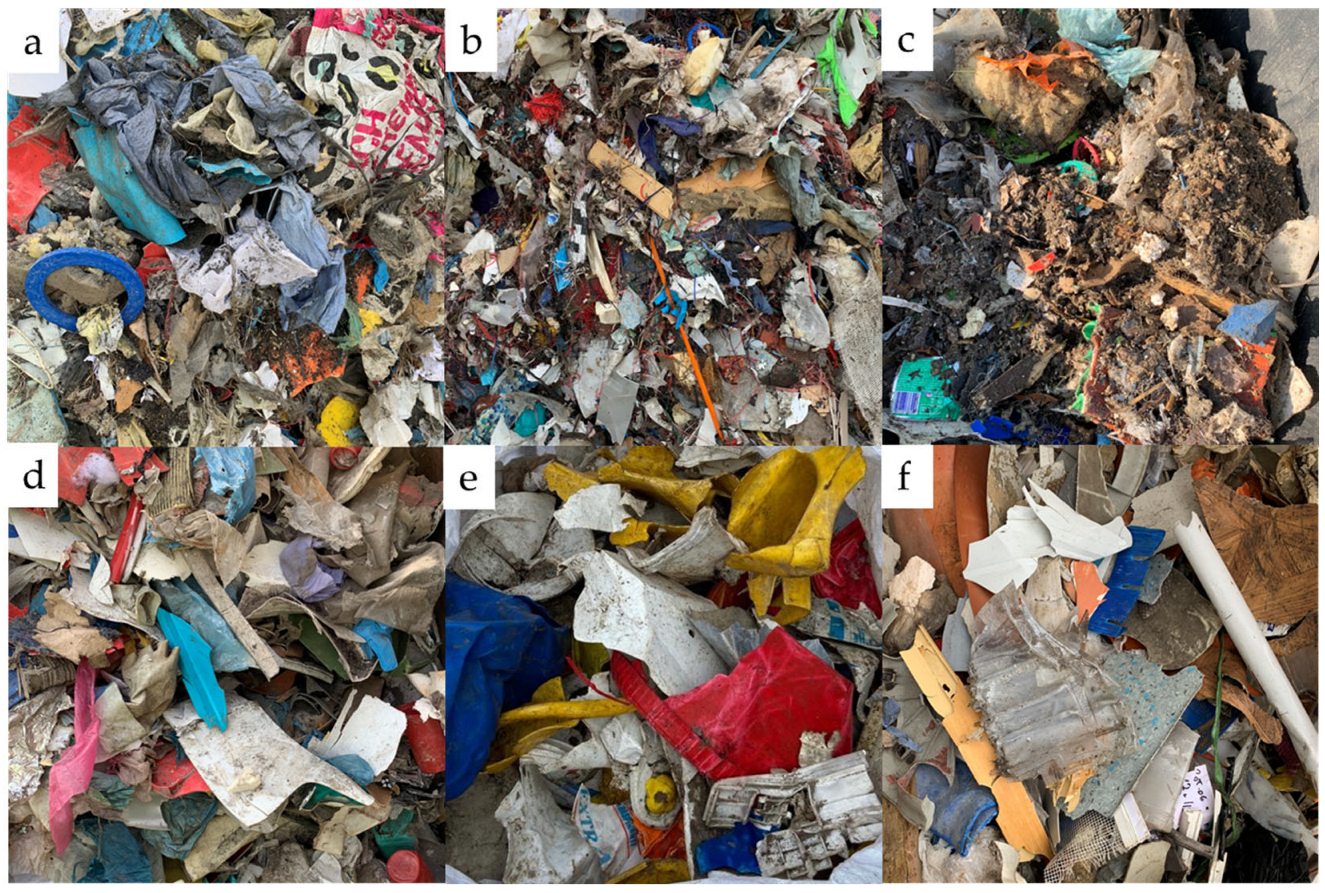
Two concepts were developed to produce a plastic pre-concentrate for mechanical recycling recovered from MCW. The corresponding data related to these concepts is presented in Table 1. The production times were 662 min for Concept A and 497 min for Concept B, resulting in an average throughput of 17.4 t/h for Concept A and 19.2 t/h for Concept B, respectively, indicating comparable performance between the two concepts. Production time was influenced by downtimes, e.g., conveyor belt clogging. The cumulative material volume conveyed to the SBS unit during each concept was 1346 m3 for Concept A and 684 m3 for Concept B. Notably, while the SBS unit in Concept A processed twice the volume of Concept B, only 20.1% more mass was handled by the plant. Since the WTP operated under identical machine settings for both concepts, these differences are attributed to variations in MCW composition and the resulting separation performance of upstream machinery. During Concept A, 513.2 kg of pre-concentrate was ejected, compared to 1900 kg of pre-concentrate in Concept B. It is assumed that the high proportion of PE films in Concept A resulted in a higher volume throughput to the SBS but led to a lower mass of pre-concentrate. The differences in the ejected masses can also be linked to variations in sorting criteria and the composition of the input material.

2.2. Sorting

The first sorting of the pre-concentrate in the Digital Waste and Research Lab (DWRL) resulted in a PP concentrate (eject) (Figure 1d), a reject, and a residual fraction (Figure 1c). This residual fraction primarily consisted of fines (approximately <40 mm) and non-plastic particles. The pre-concentrate from Concept A (Figure 1a) primarily consisted of PP and PE materials, with PE mainly present in the form of foils. The high two-dimensional content significantly affected the sorting process, as the films were incorrectly discharged into the eject by the air stream. Consequently, a different production method was implemented for the pre-concentrate production in Concept B (Figure 1b). The nearly doubled reject rate in Concept A is attributed to the high proportion of two-dimensional particles and the lower share of PP in the pre-concentrate.
A visual inspection of the reject from Concept A indicated that the material was unsuitable for further PE recycling due to the high proportion of two-dimensional materials and their significant contamination levels.
The pre-concentrate from Concept B primarily consisted of PP and polyvinyl chloride (PVC) particles, with a significantly higher proportion of fines and non-plastic material. This resulted in a larger residual fraction, mainly due to differences in the input material and, consequently, the performance of the machines in the WTP. The results of the first sorting process are presented in Table 2. A total mass of 627.9 kg of PP concentrate was produced for further sorting.
During the second sorting step, all materials not identified as PP were removed by the SBS machine. Between the first and second sorting, 0.9 kg of material losses was recorded, likely due to dust formation. The results of the second sorting step are presented in Table 2. A visual evaluation of the non-PP fraction (eject) revealed that it primarily consisted of two-dimensional PE foils and PVC pipes, with a low content of PP (Figure 1f), leading to the decision not to proceed with further sorting for PP recovery. A total of 551.7 kg of PP concentrate with a purity of 83.3% related to the total mass of the final products (Equation (1)) was obtained from the second sorting for subsequent processing.
After the second sorting, the DWRL was used to assess the purity of the resulting PP concentrate (Figure 1e). The analysis revealed that the material consisted of 91.6% PP, with 0.9% being PVC and PE. The remaining 7.5% was classified as undefined. This undefined fraction included non-identifiable particles and errors in the conveyor belt that were misidentified as particles. As a result, the reported PP purity should be considered a lower estimate.

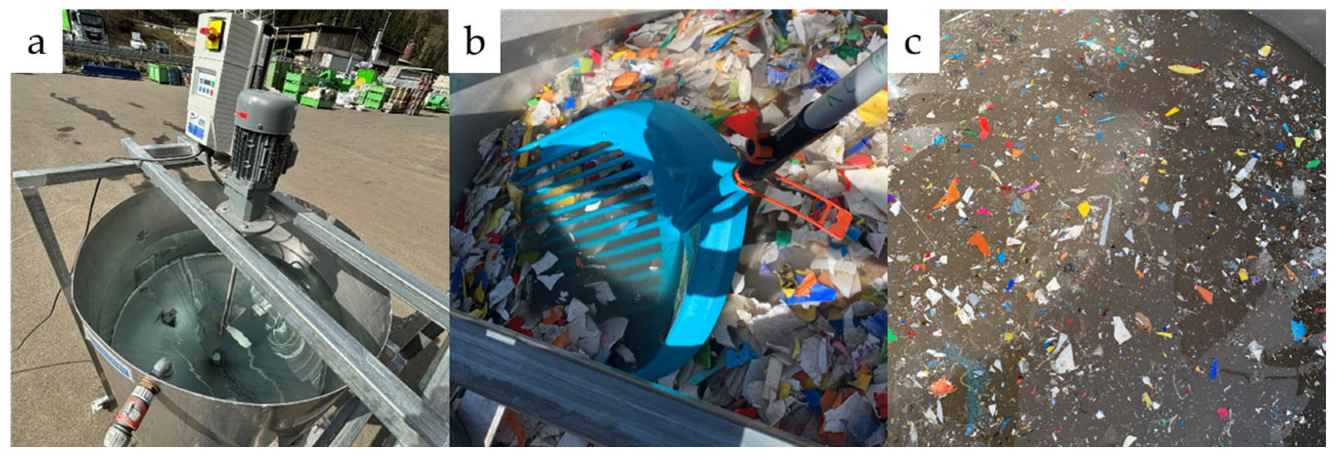
2.3. Wet Mechanical Processing

The comminution of the PP concentrate resulted in a mass loss of 17.2 kg, likely due to dust formation and material retention in the shredder. Figure 2a depicts the material after shredding. For melt flow rate (MFR) measurement, flake scan, and illustrative purposes, a sample of 1.6 kg of PP flakes was taken. The analysis resulted in an MFR of 9.9 g/10 min at 190 °C.
The washing process resulted in a mass loss of 70.0 kg. The filtered washing residue primarily consisted of sludge and plastic particles, as shown in Figure 2b. After washing and drying, the total dry weight of the PP flakes was 462.5 kg (Figure 2c).

2.4. Recycling

Before extrusion of the recyclate, a flake scan was performed, revealing a PP purity of 96.3% and a color distribution of 0.6% black, 8.5% blue, 12.6% clear/natural, 3.0% green, 0.2% magenta, 8.5 orange, 8.1% red, 4.7% silver, 38.4% white, and 15.4% yellow. Figure 2d illustrates the recyclate obtained through the granulation process, which was produced without any operational difficulties. During granulation, the use of a 150 µm filter generated 4.8 kg of filter residues (Figure 2e). The resulting recyclate displayed uniform coloration and emitted a characteristic plastic odor.
The blown film (Figure 2f) produced from this recyclate was free of defects (e.g., holes in the material) and was manufactured without operational issues. The film appeared gray, slightly transparent, and contained visible particles.
The results of the material characterization of the recyclate are presented in Table 3, alongside the material analysis of the recyclate obtained from packaging PP waste bales [33]. The material from MCW shows a higher MFR while the material from packaging waste demonstrates greater tensile strength and Young’s modulus, suggesting higher robustness. The recyclate from MCW exhibits a higher impact resistance and higher elongation at break, indicating greater flexibility and resistance to fracture. In contrast, the recyclate from packaging waste, which has a higher density, exhibits stronger mechanical properties. A total of 0.9 kg of recyclate was used for the material analyses, the production of a blown film, and as illustrative material, leaving 456.8 kg available for product manufacturing. A mass balance over the processes sorting, wet mechanical processing, and recycling is provided in Appendix B.
The results of the elemental concentration analysis can be found in Appendix C. The findings demonstrate that levels of heavy metals, such as lead (Pb), mercury (Hg), cadmium (Cd), and chromium (VI) (Cr VI), are well below the threshold limits established by the Restriction of Hazardous Substances Directive (RoHS) [34] and Directive 94/62/EC on Packaging and Packaging Waste [35]. Additionally, the elevated concentration of titanium (Ti) in the recyclate is noteworthy. It is hypothesized that this result is attributable to the common use of titanium oxide as a colorant in plastic manufacturing [36]. As these results confirm that the recyclate meets all required quality standards and thereby complies with the criteria outlined in the Waste Framework Directive [32], this processing step is defined as the point at which End-of-Waste status is achieved.
After confirming that the material met all quality requirements, it was fed into an industrial-use injection molding machine. Figure 2g shows the finished products (paint buckets and storage boxes), which have a dark gray color and typical plastic odor. The production of the items proceeded without issues, as the machines were able to process the recyclate with minimal adjustments to the molding machine settings. The manufacturer’s visual assessment confirmed that the final products were free of defects. The dimensional measurements showed no deviations compared to those made from virgin material. Mechanical testing revealed a 5% lower compression resistance, though still within the acceptable tolerance range. The products passed a standard stacking test at 60 °C for 28 days under a load of 250 kg, and the impact resistance results were comparable to those of other PP granulates. Based on production and quality testing of the manufacturer, the material met the standards of approved PP grades and was deemed suitable for sale.

3. Discussion

As outlined in the introduction, MCW contains a certain proportion of potentially recyclable materials. According to data from Enengel et al. [24], the proportion of PP in MCW that is technically available for the WTP used (three-dimensional and >60 mm) is 1.6%. Based on the total processed input mass, this corresponds to a potential recovery of 5629 kg of PP. However, only 551.3 kg (9.8%) of PP concentrate was produced in both concepts. This is attributed to the substantial inhomogeneity in MCW composition and the fact that the WTP is not optimized to extract secondary raw materials. The machines in the WTP still offer the potential to increase the recovery rate of PP; e.g., dynamic control of the machines adapted to the waste composition would probably significantly improve the recovery rate. Due to the lack of analysis of the input composition during the two concepts, no reliable statement can be made regarding the recovery rate or the recycling rate of the PP. This represents a major limitation of the present study and should be addressed in future trials. At present, determining the composition of MCW using conventional methods is highly labor-intensive and time-consuming, requiring extensive manual sampling and sorting. However, with the introduction of digital composition analysis, such as sensor-based or AI-supported detection systems, this process is expected to become significantly more efficient and scalable in the future. Nonetheless, this work demonstrates that the PP recovered from MCW can be processed to achieve a market-ready quality while complying with all legal requirements regarding the content of heavy metals.
Concept B not only demonstrated improved pre-concentrate quality but also enabled the simultaneous removal of contaminants (PVC) and secondary raw materials (PP) from the WTP. However, the resulting material still contained a considerable proportion of two-dimensional and fine fractions. Given that ballistic separators can effectively separate a material stream into three distinct fractions—three-dimensional, two-dimensional, and fines [37,38]—it is hypothesized that the use of such a separator would be a suitable preprocessing step to remove these undesired fractions prior to subsequent sorting stages (SBS), thereby improving overall sorting efficiency. Future studies should experimentally validate this approach by integrating ballistic separation into the sorting chain and quantifying its impact on product purity and yield.
The shredded PP flakes were washed in a single processing step using only cold water in a laboratory-scale setup, without the addition of detergents or further treatment. In contrast, industrial wet mechanical recycling processes typically involve multiple stages (e.g., friction washers and sink–float separation) to achieve the desired material purity [39,40]. Despite the minimal processing effort, the resulting granulate already exhibited promising quality. As a next step, larger quantities of PP flakes recovered from MCW should be produced and subjected to industrial-scale washing processes. This would allow for an assessment of the material’s suitability for standard industrial treatment and further validate its potential for high-quality recycling applications.
Having demonstrated that PP from MCW can achieve sufficient quality for mechanical recycling, future research efforts can now focus on the recovery rate of PP from the WTP and the development of new process concepts for the extraction of PP concentrates on an industrial scale. Additionally, the application of digital waste analysis would allow for rapid and efficient analysis of multiple samples, providing accurate data on the potential of the composition of the input stream and recoverable materials. Moreover, MCW contains other recyclable materials that merit further investigation to develop suitable recycling processes (wood, PET).
Based on a state-of-the-science analysis, the material processed in this study is the first extracted from MCW (besides metals) and successfully transformed into a product. It also provides a methodological foundation for future efforts to recover additional plastic fractions from heterogeneous waste streams. This work highlights that the mechanical recycling of PP from MCW is feasible and can be accomplished with limited resources, representing a significant step towards a circular economy.

4. Materials and Methods

Figure 3 illustrates the method used to recover recyclable material from MCW and process it into a market-ready product. The process consists of four main stages: pre-concentrate production, sorting, wet mechanical processing, and recycling. In the first stage, a state-of-the-art WTP was used to generate a pre-concentrate through two different concepts. During the subsequent sorting stage, this material undergoes further refinement. The resulting PP concentrate is then subjected to wet mechanical processing, where it is transformed into flakes suitable for mechanical recycling. In the final stage, these flakes are converted into PP recyclate and molded into a finished product. The purity shown in Figure 3 was calculated using Equation (1).
p u r i t y   [ % ] = t o t a l   m a s s   o f   t h e   f i n a l   p r o d u c t   [ k g ] m a s s   o f   t h e   c o r r e s p o n d i n g   s t r e a m   [ k g ] 100 %

4.1. Pre-Concentrate Production

The pre-concentrate was produced in an Austrian WTP. A detailed flow-chart-based description of this plant is provided by Sarc and Viczek [25]. In the meantime, the first screen (200 mm) was removed from the technical concept of the plant. An updated and edited scheme of the process layout can be found in Appendix D. The input material consisted of non-hazardous MCW, representing typical feedstock for this WTP. Due to the material’s inhomogeneity, determining its exact composition would require significant effort [24,26] and was therefore not conducted. The MCW was fed into the WTP using a wheel loader, with the input mass measured by the loader’s integrated scale. After passing through a coarse shredder, the material was transported to a vibrating screen (60 mm). A wind shifter further separated the >60 mm fraction into a light fraction and a heavy fraction, after which the heavy fraction was conveyed through a magnetic separator and an eddy current separator to the SBS machine. A volume flow sensor by Samsoric [41] was used to estimate the cumulative material volume processed by the SBS machine.
Two concepts were developed to produce a PP pre-concentrate for mechanical recycling. Each concept was implemented during a typical production day, operating in a two-shift schedule. The experimental duration was calculated by excluding downtime, reflecting the actual production time. The settings for all machines in the plant were kept constant, reflecting standard operational conditions. The only adjustments made were to the sorting parameters of the SBS machine in between the two concepts. This machine, which uses near-infrared (NIR) technology, has been used in the WTP to identify and eject undesired materials such as PVC. For this study, it was reconfigured to sort and generate the polyolefin-rich pre-concentrate required for Concept A and Concept B. Concept B was planned and realized after the first sorting step of the pre-concentrate from Concept A.
Concept A: The first concept was established following a series of preliminary tests and optimizations of the SBS machine, e.g., adaptations to the sorting recipe. The SBS machine was configured to sort PE and PP out of the material stream. The sorting recipe was trained using plastic particles obtained during these preliminary trials, which were characterized with a handheld near-infrared spectrometer (microPHAZIR Analyzer, Thermo Fisher Scientific, Waltham, MA, USA [42]) with a manufacturer’s standard program to ensure accurate material identification. The resulting pre-concentrate (eject) was collected in several 1.4 m3 containers and weighed.
Concept B: For the second concept, the sorting recipe was changed to sort PP and polyvinyl chloride (PVC) out of the material stream. The change in the sorting recipe was based on two insights from Concept A: (i) The pre-concentrate generated in Concept A contained a high share of foils, which in MCW are mainly made of PE [24]. These films had a negative effect on the subsequent sorting process, as they were discharged incorrectly and thus reduced the purity of the eject. (ii) PVC is a contaminant in WTP products (SRF), and therefore it needs to be removed from the material stream [43]. The adjustments in the sorting recipe for Concept B allowed for the recovery of recyclable material (PP) while simultaneously removing contaminants (PVC) and improving the subsequent sorting of the pre-concentrate. The pre-concentrate from Concept B was collected in a 30 m3 container and was then weighed with a container scale.

4.2. Sorting

To achieve a material quality suitable for mechanical recycling, the pre-concentrate underwent two sorting steps using an SBS machine, which is part of the DWRL at Montanuniversitaet Leoben. A detailed description of the DWRL can be found in the publication of Kandlbauer et al. [44]. The eject fraction refers to the material actively diverted by the SBS machine using an air pulse, while the reject fraction comprises the material that remains in the stream without redirection. The sorting recipe was developed based on particles (PE, PP, PVC) obtained from preliminary tests. The material type of the particles was determined using a handheld near-infrared spectrometer (microPHAZIR Analyzer [42]).
First sorting: The material was manually fed into the DWRL, excluding small particles (approx. <40 mm) and non-plastic materials, as these fractions would negatively affect the sorting performance of the SBS. This manual pre-sorting step was deemed necessary and intended to simulate the function of a preprocessing unit (e.g., ballistic separator). The pre-concentrates of both concepts were sorted to separate PP, resulting in three fractions: (i) eject (PP concentrate), (ii) reject (non-PP materials), and (iii) residual (fines and non-plastic materials).
Second sorting: To ensure sufficient purity for mechanical recycling, a second sorting step was performed. The PP concentrate from the first sorting was fed again manually into the DWRL. For logistical reasons, the material from both concepts was processed together in a single batch. This stage aimed to increase the purity of the PP concentrate by removing all materials except PP, with the SBS unit resulting in two fractions: (i) eject (non-PP materials) and (ii) reject (PP concentrate).
To verify whether the necessary purity for mechanical recycling had been achieved, the surface-related purity of the double-sorted PP concentrate was assessed using the near-infrared sensor of the DWRL. The near-infrared data in the DWRL is recorded as classified data and can be exported as a CSV file. The hyperspectral camera (900–1700 nm) used captures full spectra at 320 pixels with 9 nm resolution and a sampling rate of up to 446 Hz [44]. For the calculation, the number of pixels n in each material class i was counted during the test run and later used to obtain the relative share of each material class according to Equation (2) (all calculations were performed in Matlab version R2024a). The considered material classes were PP, PE, and PVC, as well as an “undefined” class that covers all remaining materials. The MFR (according to ISO 1133-1 [45] at 190 °C/2.16 kg) was also measured to obtain an estimate of the material’s properties.
s u r f a c e r e l a t e d   p u r i t y   f o r   P P = n P P n i
n p p … Total number of PP pixels
n i … Total number of pixels in material i;

4.3. Wet Mechanical Processing

Once sufficient purity was confirmed in the PP concentrate, the material was shredded to prepare it for the washing process. A maximum particle size of 60 mm was deemed ideal for this step, so a 60 mm screen basket was installed into the shredder [46] used. The shredded material was washed in batches (80 l) for seven minutes using a washing container (see Figure 4a), which had a diameter of 810 mm and a capacity of 180 L. Cold water (approximately 10 °C) without any detergents was used for the washing process. During washing, the material was agitated by a mixer. After the washing process was completed, the material was left to settle for three minutes to take advantage of the density differences of the materials as a further separation step, as PP has a density <1000 kg/m3, which results in PP floating on the surface of the water [47]. The washed PP concentrate was then skimmed off using a rake with a mesh size of 8 mm (see Figure 4b). The water was reused for three to five additional washing cycles, depending on the level of contamination (Figure 4c). The water was drained through a 1 mm mesh screen. The material collected in the screen during drainage consisted mainly of sunken plastics and fine particles. After all the material had been washed, a single batch (80l) was washed again using the same method. This second wash revealed minimal additional contaminants being released into the water, leading to the decision not to perform further washing cycles. To ensure an accurate mass balance, the washed PP flakes were sun-dried before being weighed. Once fully dried, the material was stored in big bags for subsequent processing.

4.4. Recycling

Before processing the dried PP flakes into a recyclate, a quality check was performed using a Flake Scan from Sesotech [48] equipped with near-infrared and color sensors to analyze a 1 kg sample. A single screw extruder (recoSTAR dynamic 85 C-VAC, Vienna, Austria [49]) with a continuous blade 150 μm laser filter and incorporated water ring pelletizing was used to produce the recyclate. To ensure that the recyclate’s quality was suitable for product manufacturing, a blown film was made to validate its processing capabilities and standard methods for plastic characterization were applied: MFR was measured under a load of 2.16 kg at 230 °C according to ISO 1133 [45] using an Mflow Flowability Tester [50]; tensile properties were assessed at 23 °C according to ISO 527 [51] on an EZ-Test LX with a 5 kN load cell [52]; Charpy impact strength was determined at 23 °C according to ISO 179 [53] using a HIT 5.5P impact tester [54]; ash content was analyzed at 600 °C using a PA-7697 oven (CEM GmbH); density was measured at 23 °C according to ISO 1183 [55] with a DME-220HE balance (Shinko Denshi Co., Ltd., Tokyo, Japan); thermal properties were examined by Differential Scanning Calorimetry (DSC) on a DSC1/500 instrument (Mettler Toledo GmbH, Greifensee, Switzerland); and color measurements were performed under D65/10° conditions using a CI-4200 spectrophotometer [56]. The concentrations of Antimony (Sb), Arsenic (As), Barium (Ba), Bismuth (Bi), Bromine (Br), Cadmium (Cd), Chlorine (Cl), Chromium (Cr), Copper (Cu), Gold (Au), Iron (Fe), Lead (Pb), Mercury (Hg), Nickel (Ni), Selenium (Se), Tin (Sn), Titanium (Ti), Vanadium (V), and Zinc (Zn) elements were determined through X-ray fluorescence analysis (XRF) based on the procedures outlined in ÖNORM EN 16424 [57] with a Niton™ XL2 XRF Analyzer [58]. Chromium (VI) (Cr6+) concentration was determined in accordance with DIN 38405-24 Method 3060 A [59].
After confirming that the required quality standards were met, the manufacturing of a market-ready product commenced. Paint buckets and storage boxes were selected for this purpose, as paint buckets constitute a significant portion of PP products found in MCW, thereby facilitating the closure of the recycling loop. The final products were manufactured on a production line using an injection molding machine configured to standard production settings.
The resulting products underwent a standard quality assessment by the product manufacturer to ensure compliance with industry standards. This included an optical inspection, a measurement to verify dimensional stability, and an assessment of mechanical properties at 25 and 60 °C. Mechanical testing included a stacking test at 60 °C for 28 days under a load of 250 kg, as well as an impact resistance test at 25 °C with a maximum drop height of 800 mm.

5. Conclusions

This study demonstrates that polypropylene (PP) can be successfully recovered from MCW and mechanically recycled into granulate of marketable quality, even under simplified washing conditions. Across both sorting concepts tested, Concept B yielded significantly more PP pre-concentrate than Concept A (1900 kg vs. 513.2 kg), highlighting the importance of adjusted sorting parameters and the influence of input material heterogeneity. Despite operating under industrial constraints and using standard plant settings, a total of 456.8 kg was produced and successfully processed into market-ready products. Although the recovery yield was significantly lower than the theoretical potential, primarily due to the inhomogeneous nature of MCW and the limitations of the existing WTP, the results indicate untapped potential.
A key limitation of this study lies in the absence of a comprehensive input composition analysis. Conventional methods for such assessments remain labor-intensive and inefficient. However, the future integration of digital composition analysis tools, such as sensor-based and AI-supported systems, is expected to enable more efficient, accurate, and scalable material characterization.
Moreover, the use of ballistic separation was identified as a promising approach to remove undesired two-dimensional and fine fractions before subsequent sorting steps. Similarly, transferring the washing of PP flakes to industrial-scale wet mechanical processes is a necessary step toward validating the material’s recyclability at scale.
Beyond PP, MCW contains additional recyclable materials such as PET and wood, which warrant further investigation. This study not only provides proof of concept for the mechanical recycling of PP from MCW but also lays the groundwork for broader recovery strategies from heterogeneous waste streams. It represents a meaningful contribution toward establishing a circular economy.

Author Contributions

Conceptualization, M.J.E.; methodology, M.J.E.; software, L.K.; investigation, M.J.E., J.R., T.L. and L.K.; data curation, M.J.E.; writing—original draft preparation, M.J.E. and J.R.; writing—review and editing, L.K., T.L. and R.S.; visualization, M.J.E.; supervision, M.L.; project administration, R.S.; funding acquisition, R.S. All authors have read and agreed to the published version of the manuscript.

Funding

This research was funded by BMK, BMAW, and the federal state of Styria, grant number 882512.

Data Availability Statement

All data generated and analyzed during this study have been published within this publication.

Conflicts of Interest

The authors declare no conflicts of interest.

Abbreviations

The following abbreviations are used in this manuscript:
AsArsenic
AuGold
BaBarium
BiBismuth
BrBromine
CdCadmium
ClChlorine
CrChromium
Cr VIChromium (VI)
CuCopper
DSVDifferential Scanning Calorimetry
DWRLDigital Waste Research Lab
EUEuropean Union
FeIron
HgMercury
MCWMixed commercial waste
MFRMelt flow rate
MMWMixed municipal waste
NiNickel
PbLead
PEPolyethylene
PETPolyethylene terephthalate
PET BBPET beverage bottles
PET nBBPET non-beverage bottles
PPPolypropylene
PPCPaper/paperboard/cardboard
PSPolystyrene
PVCPolyvinyl chloride
RoHsRestriction of Hazardous Substances Directive
SbAntimony
SBSSensor-based sorting
SeSelenium
SnTin
TiTitanium
VVanadium
weeWaste of electrical and electronic equipment
WTPWaste treatment plant
XRFX-ray fluorescence analysis
ZnZinc

Appendix A. Composition of MCW >60 mm

Table A1. Composition of MCW >60 mm published by Enengel et al. [24] with an evaluation of the recyclability of each fraction. Note: Values equal or less than 0.004% are represented as 0.00%. The absence of particles in a fraction is indicated with *. PET BB: PET beverage bottles; PET nBB: PET non-beverage bottles; PS: polystyrene; wee: waste of electrical and electronic equipment.
60–8080–100100–200>200TotalRecyclability Evaluation
3DPE0.42%0.45%1.25%0.32%2.44%potentially recyclable fraction
PP0.44%0.40%0.67%0.09%1.60%potentially recyclable fraction
PET0.51%0.47%0.60%0.11%1.69%potentially recyclable fraction
PET BB0.29%0.36%0.28%0.00%0.93%no sufficient quantities (<1%)
PET nBB0.03%0.01%0.02%*0.06%no sufficient quantities (<1%)
PS1.08%0.42%0.64%0.05%2.19%no established recycling market
PVC0.34%0.28%0.40%0.13%1.15%no established recycling market
composite0.17%0.21%0.34%0.24%0.96%no established recycling market
residual0.18%0.11%0.18%0.09%0.56%no established recycling market
2D PE0.76%0.70%2.13%1.00%4.59%not technically sortable
PP0.35%0.19%0.19%0.03%0.76%not technically sortable
PET0.11%0.09%0.13%0.03%0.36%not technically sortable
PS0.05%0.04%0.07%0.01%0.17%not technically sortable
PVC0.07%0.03%0.08%0.00%0.18%no established recycling market
composite0.14%0.07%0.07%0.01%0.29%no established recycling market
residual0.08%0.05%0.05%0.01%0.19%no established recycling market
paper/paperboard/cardboard1.60%1.15%2.23%0.04%5.02%potentially recyclable fraction
black/gray1.34%0.99%2.40%0.58%5.31%not technically sortable
composite1.24%1.01%2.60%0.43%5.28%no established recycling market
metal1.33%1.08%1.55%0.12%4.08%already recycled
wood1.72%0.71%0.86%0.01%3.30%potentially recyclable fraction
inert1.06%0.37%0.38%0.00%1.81%no established recycling market
textile0.53%0.46%1.54%0.99%3.52%no established recycling market
rubber0.09%0.03%0.05%0.26%0.43%no sufficient quantities (<1%)
wee0.18%0.06%0.12%0.00%0.36%no sufficient quantities (<1%)
organic0.04%0.03%0.14%0.00%0.21%no sufficient quantities (<1%)
beverage carton0.05%0.05%0.05%*0.15%no sufficient quantities (1%)
packaging with contents0.04%0.02%0.02%*0.08%no established recycling market
batteries0.01%***0.01%no sufficient quantities (<1%)
residual0.32%0.10%0.26%0.06%0.74%no established recycling market
total14.57%9.94%19.30%4.61%48.42%

Appendix B. Mass Balance with Respect to the Sorting Processes, Wet Mechanical Process, and Recycling

Table A2. The upper part shows the mass balance for each process step: the first sorting step, second sorting step, wet mechanical processing, and recycling; the lower part shows the mass balance with respect to all process steps.
Concept AConcept B
first sorting step input pre-concentrate 513.21900
output reject 210.5377.3
residue 131.01066.5
PP concentrate 171.7456.2
second sorting step input PP concentrate A 171.7
PP concentrate B 456.2
output eject 75.7
sorting loss 0.9
PP concentrate 551.3
wet mechanical processing input PP concentrate 551.3
output shredder loss 17.2
flake sample 1.6
washing residue 70.0
flakes 462.5
recycling input flakes 462.5
output filter residue 4.8
granulate sample 0.9
recyclate/ final product 456.8
input:output:
pre-concentrate A 513.2 reject first sorting of Concept A 210.5
pre-concentrate B 1900.0 residue first sorting of Concept A 131.0
total 2413.2 reject first sorting of Concept B 377.3
residue first sorting of Concept B 1066.5
eject second sorting 75.7
sorting loss second sorting 0.9
shredder loss 17.2
flake sample 1.6
washing residue 70.0
filter residue 4.8
granulate sample 0.9
recyclate/final product 456.8
total 2413.2

Appendix C. Results of the Elemental Analysis

Table A3. Results of the elemental analysis of the recyclate derived from MCW, analyzed by X-ray fluorescence analysis (XRF). Chromium (VI) (Cr6+) was determined in accordance with DIN 38405-24 Method A. All values marked with an * are below the limit of quantification.
As0.1mg/kg*
As0.1mg/kg*
Au0.1mg/kg*
Ba189.2mg/kg
Bi8.6mg/kg
Br44.4mg/kg
Cd13.9mg/kg
Cl0.1mg/kg*
Cr11.4mg/kg
Cr6+2.0mg/kg*
Cu18.2mg/kg
Fe288.9mg/kg
Hg0.2mg/kg
Ni2.8mg/kg
Pb30.7mg/kg
Sb19.4mg/kg
Se3.6mg/kg
Sn0.1mg/kg*
Ti3080.8mg/kg
V39.7mg/kg
Zn54.1mg/kg

Appendix D. Results of the Elemental Analysis

Figure A1. Updated and edited scheme of the process layout of the waste treatment plant used; the original figure can be found in Sarc and Viczek [25]. The first screen (200 mm) was removed; the green arrow indicates the path of the pre-concentrate through the waste treatment plant.
Recycling 10 00128 g0a1

References

  1. European Commission. A New Circular Economy Action Plan: For a Cleaner and More Competitive Europe. 2020. Available online: https://eur-lex.europa.eu/legal-content/EN/TXT/?qid=1583933814386&uri=COM:2020:98:FIN (accessed on 28 June 2023).
  2. Eurostat. Recycling Rate of Municipal Waste; Eurostat: Luxembourg, 2023. Available online: https://ec.europa.eu/eurostat/databrowser/view/sdg_11_60/default/table (accessed on 3 March 2025).
  3. Bundesministerium für Klimaschutz, Umwelt, Energie, Mobilität, Innovation und Technologie. Die Bestandsaufnahme der Abfallwirtschaft in Österreich: Statusbericht 2023 für das Referenzjahr 2021; Bundesministerium für Klimaschutz, Umwelt, Energie, Mobilität, Innovation und Technologie: Vienna, Austria, 2023. [Google Scholar]
  4. Bundesministerium für Klimaschutz, Umwelt, Energie, Mobilität, Innovation und Technologie. Verordnung der Bundesministerin für Klimaschutz, Umwelt, Energie, Mobilität, Innovation und Technologie über ein Abfallverzeichnis (Abfallverzeichnisverordnung 2020); Bundesministerium für Klimaschutz, Umwelt, Energie, Mobilität, Innovation und Technologie: Vienna, Austria, 2020. [Google Scholar]
  5. Flamme, S.; Geiping, J. Quality standards and requirements for solid recovered fuels: A review. Waste Manag. Res. 2012, 30, 335–353. [Google Scholar] [CrossRef] [PubMed]
  6. Nasrullah, M.; Vainikka, P.; Hannula, J.; Hurme, M.; Kärki, J. Mass, energy and material balances of SRF production process. Part 1: SRF produced from commercial and industrial waste. Waste Manag. 2014, 34, 1398–1407. [Google Scholar] [CrossRef]
  7. Ranieri, E.; Ionescu, G.; Fedele, A.; Palmieri, E.; Ranieri, A.C.; Campanaro, V. Sampling, characterisation and processing of solid recovered fuel production from municipal solid waste: An Italian plant case study. Waste Manag. Res. 2017, 35, 890–898. [Google Scholar] [CrossRef] [PubMed]
  8. Bessi, C.; Lombardi, L.; Meoni, R.; Canovai, A.; Corti, A. Solid recovered fuel: An experiment on classification and potential applications. Waste Manag. 2016, 47, 184–194. [Google Scholar] [CrossRef] [PubMed]
  9. Kahawalage, A.C.; Melaaen, M.C.; Tokheim, L.-A. Opportunities and challenges of using SRF as an alternative fuel in the cement industry. Clean. Waste Syst. 2023, 4, 100072. [Google Scholar] [CrossRef]
  10. Samolada, M.C.; Zabaniotou, A.A. Energetic valorization of SRF in dedicated plants and cement kilns and guidelines for application in Greece and Cyprus. Resour. Conserv. Recycl. 2014, 83, 34–43. [Google Scholar] [CrossRef]
  11. Kara, M. Environmental and economic advantages associated with the use of RDF in cement kilns. Resour. Conserv. Recycl. 2012, 68, 21–28. [Google Scholar] [CrossRef]
  12. Zeschmar-Lahl, B.; Schönberger, H.; Waltisberg, J. Abfallmitverbrennung in Zementwerken; Umweltbundesamt: Dessau-Roßlau, Germany, 2020. [Google Scholar]
  13. Pomberger, R. Über theoretische und reale Recyclingfähigkeit. Osterr. Wasser Abfallwirtsch. 2021, 73, 24–35. [Google Scholar] [CrossRef]
  14. Wellacher, M.; Pomberger, R. Recyclingpotenzial von gemischtem Gewerbeabfall. Osterr. Wasser Abfallwirtsch. 2017, 69, 437–445. [Google Scholar] [CrossRef]
  15. Blasenbauer, D.; Lipp, A.-M.; Fellner, J.; Tischberger-Aldrian, A.; Stipanović, H.; Lederer, J. Recovery of plastic packaging from mixed municipal solid waste. A case study from Austria. Waste Manag. 2024, 180, 9–22. [Google Scholar] [CrossRef]
  16. Cimpan, C.; Maul, A.; Jansen, M.; Pretz, T.; Wenzel, H. Central sorting and recovery of MSW recyclable materials: A review of technological state-of-the-art, cases, practice and implications for materials recycling. J. Environ. Manag. 2015, 156, 181–199. [Google Scholar] [CrossRef]
  17. Soto, J.M.; Blázquez, G.; Calero, M.; Quesada, L.; Godoy, V.; Martín-Lara, M.Á. A real case study of mechanical recycling as an alternative for managing of polyethylene plastic film presented in mixed municipal solid waste. J. Clean. Prod. 2018, 203, 777–787. [Google Scholar] [CrossRef]
  18. Liikanen, M.; Sahimaa, O.; Hupponen, M.; Havukainen, J.; Sorvari, J.; Horttanainen, M. Updating and testing of a Finnish method for mixed municipal solid waste composition studies. Waste Manag. 2016, 52, 25–33. [Google Scholar] [CrossRef] [PubMed]
  19. Beigl, P. Auswertung der Restmüllzusammensetzung in Österreich 2018/2019; Bundesministeriums für Klimaschutz, Umwelt, Energie, Mobilität, Innovation und Technologie: Vienna, Austria, 2020; Available online: https://forschung.boku.ac.at/de/projects/13233 (accessed on 25 June 2025).
  20. Esguerra, J.L.; Carlsson, A.; Johansson, J.; Anderberg, S. Characterization, recyclability, and significance of plastic packaging in mixed municipal solid waste for achieving recycling targets in a Swedish city. J. Clean. Prod. 2024, 468, 143014. [Google Scholar] [CrossRef]
  21. Sahimaa, O.; Hupponen, M.; Horttanainen, M.; Sorvari, J. Method for residual household waste composition studies. Waste Manag. 2015, 46, 3–14. [Google Scholar] [CrossRef]
  22. Dahlbo, H.; Poliakova, V.; Mylläri, V.; Sahimaa, O.; Anderson, R. Recycling potential of post-consumer plastic packaging waste in Finland. Waste Manag. 2018, 71, 52–61. [Google Scholar] [CrossRef]
  23. Weissenbach, T.; Pomberger, R.; Sarc, R. Composition of Mixed Commercial Waste with Focus on Recyclable Fractions. In Proceedings of the 7th International Conference on Sustainable Solid Waste Management, Heraklion, Greece, 26–29 June 2019; Available online: http://uest.ntua.gr/heraklion2019/proceedings/pdf/HERAKLION2019_Weissenbach_etal.pdf (accessed on 25 June 2025).
  24. Enengel, M.J.; Lasch, T.; Kandlbauer, L.; Viczek, S.A.; Pomberger, R.; Sarc, R. Particle Size Distribution of Materials and Chemical Element Composition in Mixed Commercial Waste. Waste 2025, 3, 9. [Google Scholar] [CrossRef]
  25. Sarc, R.; Viczek, S.A. Co-processing of solid recovered fuels from mixed municipal and commercial waste in the cement industry—A pathway to a circular economy. Waste Manag. Res. 2023, 42, 260–272. [Google Scholar] [CrossRef]
  26. Khodier, K.; Viczek, S.A.; Curtis, A.; Aldrian, A.; O’Leary, P.; Lehner, M.; Sarc, R. Sampling and analysis of coarsely shredded mixed commercial waste. Part I: Procedure, particle size and sorting analysis. Int. J. Environ. Sci. Technol. 2020, 17, 959–972. [Google Scholar] [CrossRef]
  27. Laner, D.; Brunner, P.H. Kriterien zur Trennung von Siedlungsabfall aus Industrie und Gewerbe als Voraussetzung zur Zuordnung zu Behandlungsverfahren; Institut für Wassergüte, Ressourcenmanagement und Abfallwirtschaft: Vienna, Austria, 2008. [Google Scholar]
  28. Umweltbundesamt. Aufkommen, Verbleib und Ressourcenrelevanz von Gewerbeabfällen; Umweltbundesamt: Dessau-Roßlau, Germany, 2011.
  29. Umweltbundesamt. Stoffstromorientierte Lösungsansätze für Eine Hochwertige Verwertung von Gemischten Gewerblichen Siedlungsabfällen; Umweltbundesamt: Dessau-Roßlau, Germany, 2014. Available online: https://www.umweltbundesamt.de/sites/default/files/medien/378/publikationen/texte_18_2015_stoffstromorientierte_loesungsansaetze_fuer_eine_hochwertige_verwertung_0.pdf (accessed on 25 June 2025).
  30. Bundesministerium für Klimaschutz, Umwelt, Energie, Mobilität, Innovation und Technologie. Pfandverordnung für Einweggetränkeverpackungen; Bundesministerium für Klimaschutz, Umwelt, Energie, Mobilität, Innovation und Technologie: Vienna, Austria, 2024; Available online: https://www.ris.bka.gv.at/GeltendeFassung.wxe?Abfrage=Bundesnormen&Gesetzesnummer=20012363 (accessed on 19 November 2024).
  31. Möllnitz, S.; Feuchter, M.; Duretek, I.; Schmidt, G.; Pomberger, R.; Sarc, R. Processability of Different Polymer Fractions Recovered from Mixed Wastes and Determination of Material Properties for Recycling. Polymers 2021, 13, 457. [Google Scholar] [CrossRef]
  32. European Commission. Directive 2008/98/EC of the European Parliament and of the Council of 19 November 2008 on Waste and Repealing Certain Directives (Waste Framework Directive): Waste Framework Directive; European Commission: Brussels, Belgium, 2008.
  33. Geier, J.; Barretta, C.; Hinczica, J.; Haar, B.; Bredács, M.; Witschnigg, A.; Mayrbäurl, E.; Oreski, G. Feasibility study on the production of low melt flow rate recycled polypropylene from postconsumer waste. J. Appl. Polym. Sci. 2024, 141, e55694. [Google Scholar] [CrossRef]
  34. European Commission. Directive 2011/65/EU of the European Parliament and of the Council of 8 June 2011 on the Restriction of the Use of Certain Hazardous Substances in Electrical and Electronic Equipment (RoHS 2): RoHS, 2011. Official Journal of the European Union. Available online: https://eur-lex.europa.eu/legal-content/EN/TXT/?uri=CELEX%3A32011L0065 (accessed on 25 June 2025).
  35. Directive 94/62/EC of the European Parliament and of the Council of 20 December 1994 on Packaging and Packaging Waste; EUR-Lex: Luxembourg, 1994.
  36. Murphy, J. Additives for Plastics Handbook, 2nd ed.; Elsevier Science & Technology: Kidlington, UK, 2001. [Google Scholar]
  37. Letcher, T. Plastic Waste and Recycling: Environmental Impact, Societal Issues, Prevention, and Solutions; Academic Press: Amsterdam, The Netherlands, 2020; ISBN 9780128178812. [Google Scholar]
  38. Martens, H.; Goldmann, D. Manuelle und mechanische Verfahrenstechniken zur Aufbereitung von Abfällen und zur Schadstoffentfrachtung: [Manual and mechanical process technologies for waste treatment and pollutant removal]. In Recyclingtechnik: Fachbuch für Lehre und Praxis, 2nd ed.; Springer Fachmedien Wiesbaden GmbH: Wiesbaden, Germany, 2015; Available online: https://link.springer.com/chapter/10.1007/978-3-658-02786-5_3 (accessed on 25 June 2025).
  39. Kasper, J.B.; Parker, L.A.; Postema, S.; Höppener, E.M.; Leighton, A.H.; Finnegan, A.M.D.; Rutten, S.B.; Nijman, J.; Larasati, A.; Soares, A.C.C.; et al. Losses and emissions in polypropylene recycling from household packaging waste. Waste Manag. 2025, 191, 230–241. [Google Scholar] [CrossRef] [PubMed]
  40. Ragaert, K.; Delva, L.; van Geem, K. Mechanical and chemical recycling of solid plastic waste. Waste Manag. 2017, 69, 24–58. [Google Scholar] [CrossRef] [PubMed]
  41. Samsoric. VOLpower. 2024. Available online: https://www.samsoric.com/en/volpower (accessed on 22 January 2025).
  42. Thermo Scientific. microPHAZIER Analyzer User Guide: 110-00026-07. 2018. Available online: https://qa1-assets.thermofisher.cn/TFS-Assets/CAD/Product-Guides/microPHAZIR-User-Manual.pdf (accessed on 25 June 2025).
  43. Gerassimidou, S.; Velis, C.A.; Williams, P.T.; Castaldi, M.J.; Black, L.; Komilis, D. Chlorine in waste-derived solid recovered fuel (SRF), co-combusted in cement kilns: A systematic review of sources, reactions, fate and implications. Crit. Rev. Environ. Sci. Technol. 2021, 51, 140–186. [Google Scholar] [CrossRef]
  44. Kandlbauer, L.; Sarc, R.; Pomberger, R. Großtechnische experimentelle Forschung im Digital Waste Research Lab und Digitale Abfallanalytik und -behandlung. Osterr. Wasser Abfallwirtsch. 2023, 76, 32–41. [Google Scholar] [CrossRef]
  45. ISO 1133-1:2022; ÖNORM EN ISO 1133-1 Kunststoffe—Bestimmung der Schmelze-Massefließrate (MFR) und der Schmelze-Volumenfließrate (MVR) von Thermoplasten—Teil 1: Allgemeines Prüfverfahren. Austrian Standards Institute: Vienna, Austria, 2022.
  46. Andritz, A.G. ADuro P Shredder. 2023. Available online: https://www.andritz.com/resource/blob/459268/acf9fd4ea402c1377d6d155cd21f3dc3/brochure-aduro-p-recycling-updated23-data.pdf (accessed on 9 January 2025).
  47. Maddah, H.A. Polypropylene as a promising plastic: A review. Am. J. Polym. Sci. 2016, 6, 1–11. [Google Scholar]
  48. Sesotec GmbH. Flake Scan. Available online: https://www.sesotec.com/emea/en/lp/flake-scan (accessed on 17 March 2025).
  49. Starlinger & Co Gesellschaft m.b.H. Recycling Line recoSTAR Dynamic. Available online: https://www.starlinger.com/en/imprint (accessed on 3 May 2025).
  50. ZwickRoell GmbH & Co. KG. Mflow Extrusion Plastometer. Available online: https://www.zwickroell.com/products/extrusion-plastometer/mflow-extrusion-plastometer/ (accessed on 17 March 2025).
  51. ISO 527-1:2019; ÖNORM EN ISO 527—Plastics—Determination of Tensile Properties. Austrian Standards Institute: Vienna, Austria, 2019.
  52. Shimadzu Handelsgesellschaft GmbH. EZ-SX/LX: Small Table-Top Universal Testing Machine. Available online: https://shimadzu-testing.com/en/products/universal-testing-machines/ez-sx/ (accessed on 17 March 2025).
  53. ISO 179-1:2023; ÖNORM EN ISO 179-1 Kunststoffe—Bestimmung der Charpy-Schlageigenschaften—Teil 1: Nicht Instrumentierte Schlagzähigkeitsprüfung. Austrian Standards Institute: Vienna, Austria, 2023.
  54. ZwickRoell GmbH & Co. KG. HIT Pendulum Impact Testers. Available online: https://www.zwickroell.com/fileadmin/content/Files/SharePoint/user_upload/Brochures_EN/14_573_HIT_Pendulum_Impact_Testers_5_to_50_Joule_FP_EN.pdf (accessed on 17 March 2025).
  55. Deutsche Fassung EN ISO 1183-1:2019; DIN EN ISO 1183-1 Kunststoffe—Verfahren zur Bestimmung der Dichte von Nicht Verschäumten Kunststoffen—Teil 1: Eintauchverfahren, Verfahren mit Flüssigkeitspyknometer und Titrationsverfahren (ISO 1183-1:2019, Korrigierte Fassung 2019-05). German Institute for Standardization: Berlin, Germany, 2019.
  56. X-Rite GmbH. Ci4200: Benchtop Spectrophotometers. Available online: https://www.xrite.com/-/media/xrite/files/literature/l10/l10-400_l10-499/l10-479_ci4200_sell_sheet/l10-479_ci4200_en.pdf (accessed on 17 March 2025).
  57. ÖNORM EN 16424:2015 03 01; Charakterisierung von Abfällen—Screening-Verfahren zur Bestimmung der Elementaren Zusammensetzung mit Tragbaren Röntgenfluoreszenzspektrometern. Austrian Standards Institute: Vienna, Austria, 2015.
  58. Thermo Scientific. Niton XL2 XRF Analyzer. 2025. Available online: https://assets.thermofisher.com/TFS-Assets/CAD/Specification-Sheets/TS-Niton-XL2-SpecSheet-v4.pdf (accessed on 16 June 2025).
  59. DIN 38405-24—1987-05; DIN 38405-24 Deutsche Einheitsverfahren zur Wasser-, Abwasser- und Schlammuntersuchung; Anionen (Gruppe D); Photometrische Bestimmung von Chrom(VI) mittels 1,5-Diphenylcarbazid (D 24). German Institute for Standardization: Berlin, Germany, 1987.
Figure 1. Output fractions from mechanical sorting. (a) Pre-concentrate from Concept A; (b) pre-concentrate from Concept B; (c) residual fraction of the first sorting step of pre-concentrate from Concept A; (d) PP concentrate after the first sorting step of pre-concentrate from Concept A; (e) PP concentrate after the first sorting step of pre-concentrate from Concept B; (f) eject fraction from the second sorting step.
Recycling 10 00128 g001
Figure 2. Output fractions with respect to wet mechanical processing, the recycling process, and the production process. (a) Flakes after the second sorting step and comminution before washing; (b) washing residue after the washing process; (c) PP flakes after the washing process; (d) recyclate after granulating; (e) filter residue; (f) blown film made out of the recyclate; (g) final products—a painting bucket (bottom) and storage box (top).
Recycling 10 00128 g002
Figure 3. Illustration of the methodology. The purity is related to the total mass of the market-ready product (Equation (1)). DWRL: Digital Waste and Research Lab; MFR: melt flow rate; eject: material actively diverted by the SBS via air pulse; reject: material remaining in the stream without redirection.
Recycling 10 00128 g003
Figure 4. Wet mechanical processing images. (a) Washing container used; (b) skimmer used with an 8 mm mesh size; (c) wastewater before disposal after several washing cycles.
Recycling 10 00128 g004
Table 1. Data related to pre-concentrate production; as different scales were used to weigh the PP concentrate, the reported values accordingly reflect varying numbers of significant digits.
Concept AConcept BTotal
input mass [t]194.8157.0351.8
production time [min]6624971159
total volume [m3]13466842030
PP concentrate [kg]513.219002413.2
Table 2. Results of the first and second sorting steps.
Concept AConcept BTotal
[kg][%][kg][%][kg]
first sorting stepeject (PP)171.733.5%456.224.0%627.9
reject210.541.0%377.319.9%587.8
residue131.025.5%1066.556.1%1197.5
total513.2100.0%1900.0100.0%2413.2
Concept A+B
[kg][%]
second sorting stepeject75.712.1%
reject (PP)551.387.8%
losses0.90.1%
total627.9100.0%
Table 3. Results of the material analyses of the recyclate. Left: values from the current study; right: values from the study by Geier et al. [33].
ParameterMCWPackaging Waste
Geier et al. [33]
MFR (2.16 kg; 230 °C)[g/10 min]20.313.4
Young’s modulus[MPa]1228 ± 201346 ± 12
Elongation at break[%]35.2 ± 9.538.6 ± 12
Tensile strength[MPa]24.2 ± 0.127.6 ± 0.2
Charpy impact test (23 °C)[kJ/m2]7.86 ± 0.305.15 ± 0.67
Density (23 °C)[Kg/m3]0.9180.928
DSC (Differential Scanning Calorimetry)[j/g]80.3-
Ash content (600 °C)[%]1.4-
Color (D65/10°)
L-value[-]67.33-
A-value[-]−0.72-
B-value[-]6.41-
Disclaimer/Publisher’s Note: The statements, opinions and data contained in all publications are solely those of the individual author(s) and contributor(s) and not of MDPI and/or the editor(s). MDPI and/or the editor(s) disclaim responsibility for any injury to people or property resulting from any ideas, methods, instructions or products referred to in the content.

