1. Introduction
The spread of electronic devices and the world’s disposable culture plague the planet with an enormous and continuously growing amount of waste electrical and electronic equipment (WEEE). According to the European Union (EU), 13,500 kt of WEEE was sold in 2021 (
Table 1). Of these, roughly 4900 kt was collected and 4800 kt was treated. More than 90% was recycled or recovered as energy (4400 kt). Finally, over 90% (4000 kt) was reused. The average WEEE production per EU citizen for the period 2018–2020 was 12 kg y
−1, whereas the recovery for 2021 was estimated at 5.5 kg y
−1. The EU (Directive 2012/19/EU) target was 65% recovery by 2019; however, only Bulgaria and Slovakia reached this target [
1].
Despite falling short of the EU target, collection of WEEE has increased steadily over the last several years (
Table 1). The content of metals (including precious metals), rare elements, and other compounds, such as plastic, make WEEE a great source of secondary raw materials; in 2016 alone, raw materials from WEEE were valued at EUR 55 billion. The potential value of some materials available from WEEE are as follows: 16,000 kt of iron is valued at EUR 3600 million, 2200 kt of Cu at EUR 9500 million, and 12,000 kt of plastics are valued at EUR 15,000 million [
2]. High-impact polystyrene (HIPS) comprises 25% of the plastic in WEEE and 20% of the WEEE is plastic.
Charitopoulou et al. estimated that 7% of WEEE plastics contain brominated fire retardants (BFRs) [
3]. Recovering these materials with poor infrastructure may bring more harm than benefit, releasing toxic compounds (affecting primarily those handling it) and generating greenhouse gases. Finding alternatives to close the loop has become a primary objective for sustainable development, which can be addressed by increased recyclability (e.g., designed for disassembling), development of recovery processes, refurbishing, etc. Toxic compounds confound recycling plastic from e-waste because of the extra process steps and it requires dedicated management systems. Moreover, plastic waste that ends up in the ocean breaks into micro-particles, potentially releasing the additives, which further increases society’s concern about these polymers [
4]. Unfortunately, the side effect of stricter environmental and handling regulations have increased the costs, making recycling of WEEE less attractive. Developed countries have opted to land-fill or export their WEEE to developing countries, where handling and recycling regulations are less onerous and the labor forces is less costly [
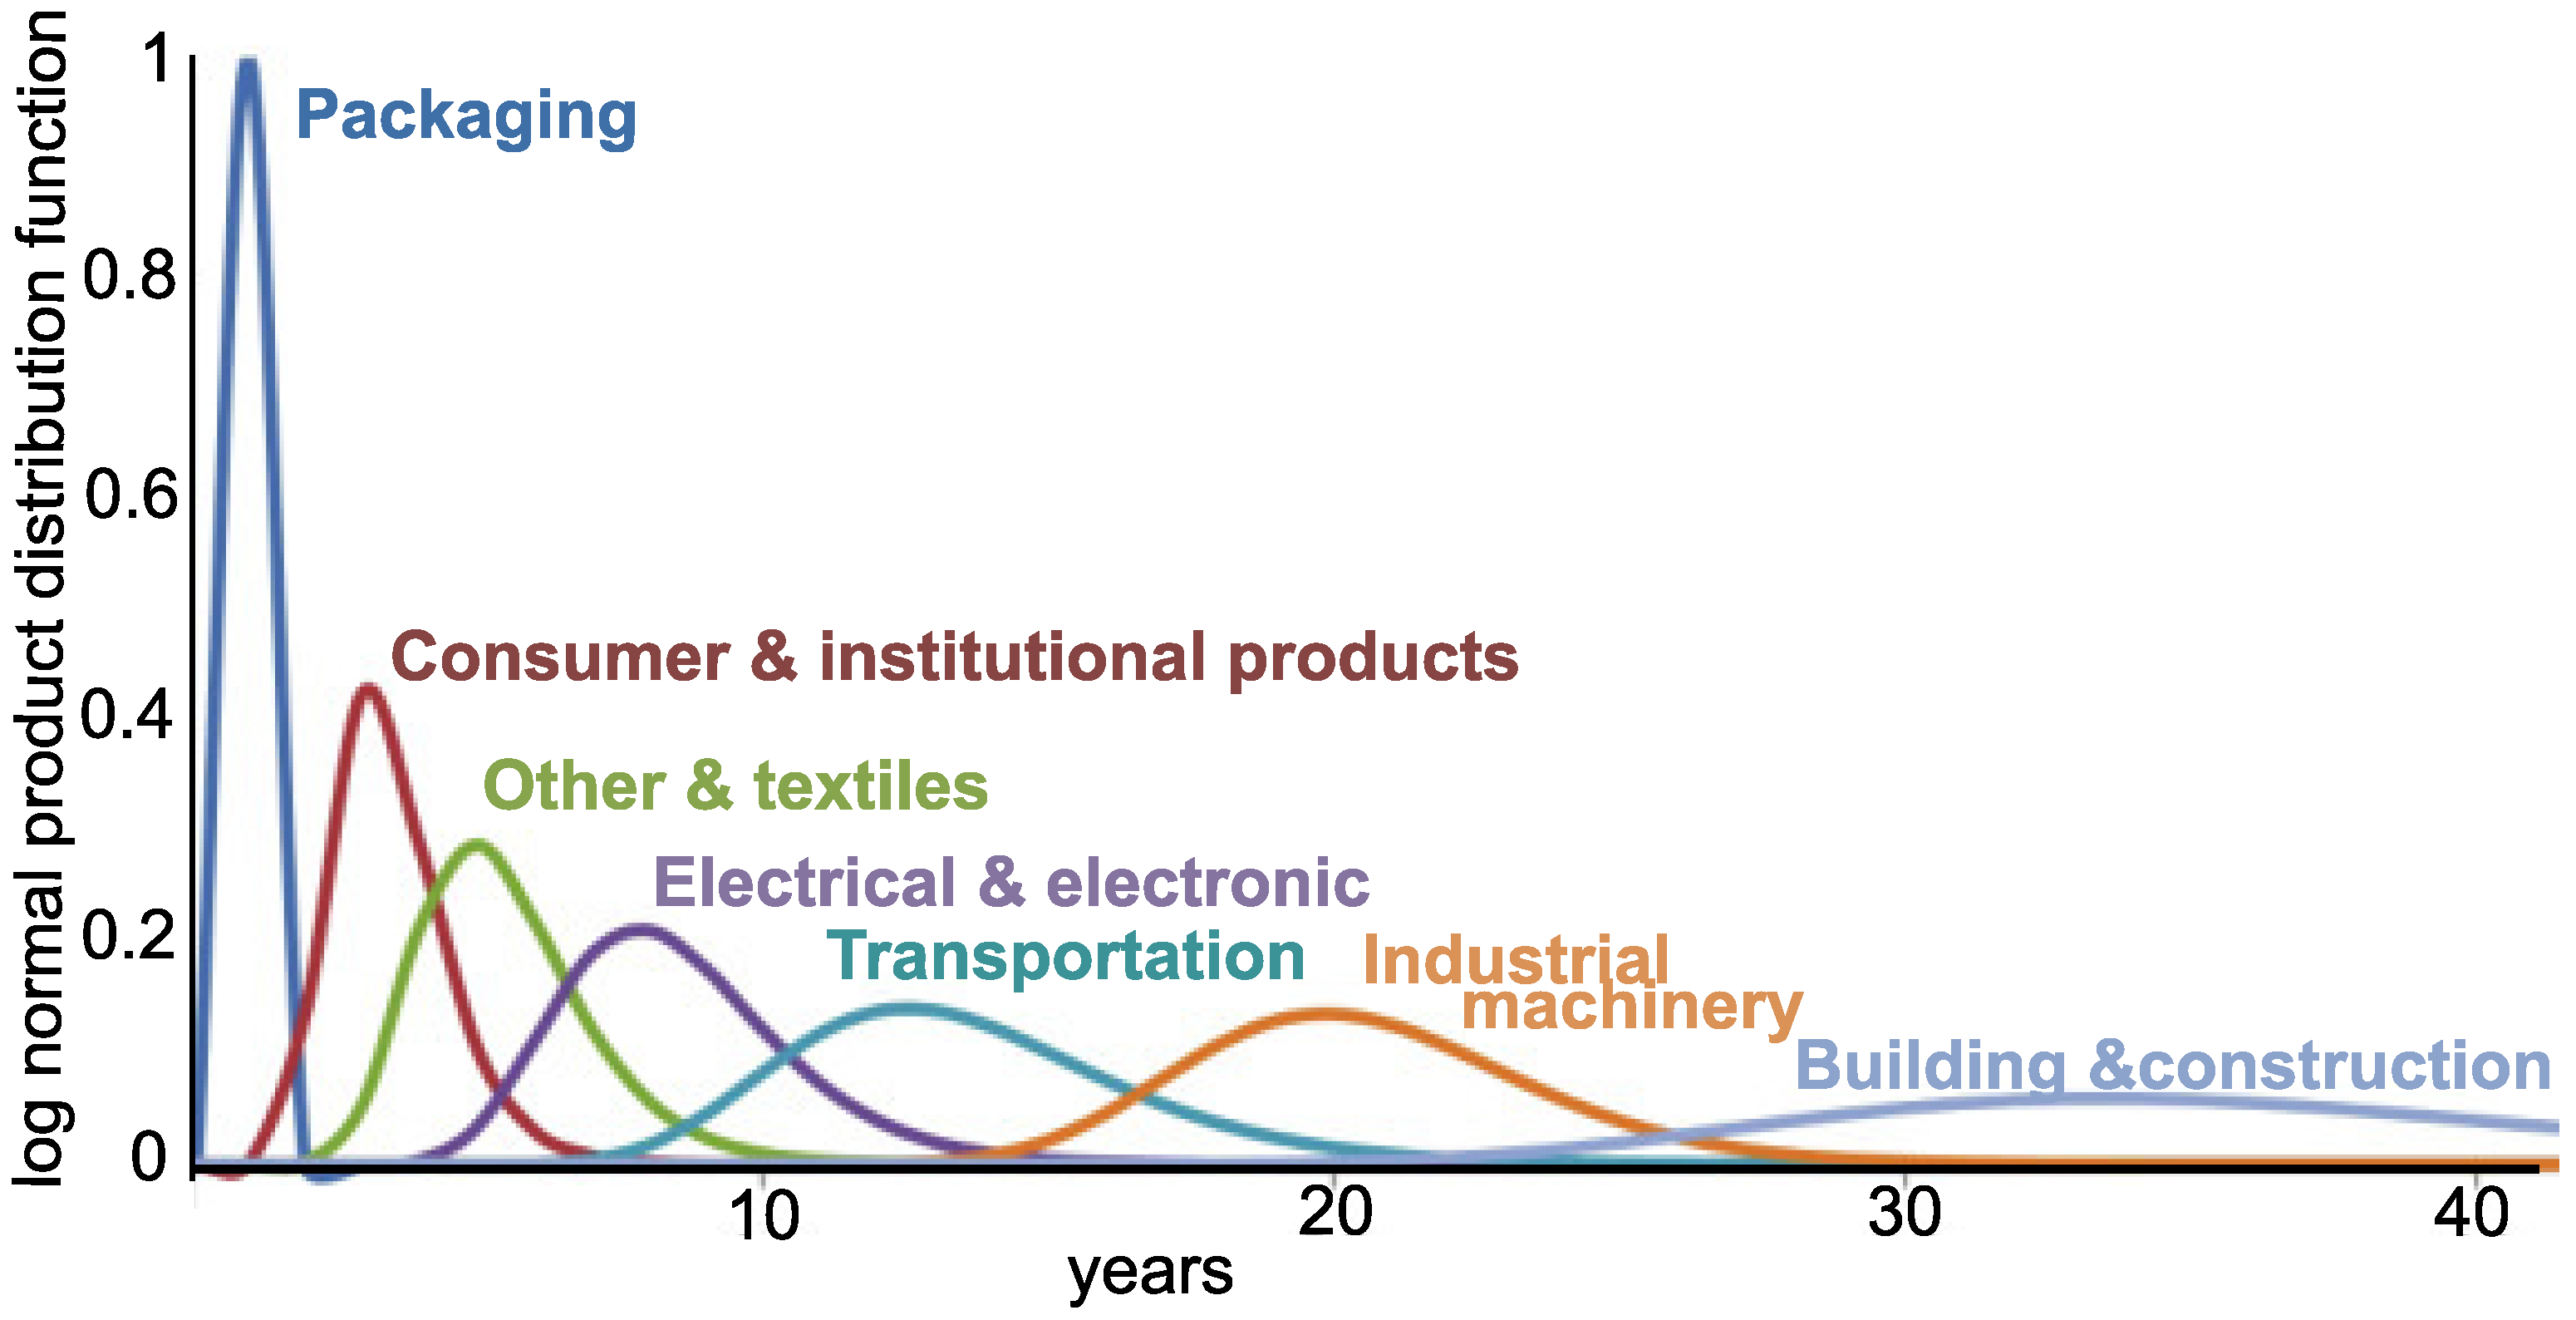
5]. The recovery and recyclability problems are compounded when taking into account that most WEEE plastic has a life span of around 10 years; i.e., most of the plastic currently reaching recovery facilities was fabricated 10 years ago (
Figure 1). Therefore there would be a gap of 10 years before these additives were out of the end-of-life polymers if all BFRs were banned now [
6].
BFRs are defined as organic molecules with various configurations of bromine atoms bonded to the molecular backbone [
7]. The most abundant are polybrominated biphenyls (PBBs), polybrominated diphenyl ethers (PBDEs), and tetrabromobisphenol A (TBBPA). BRFs are manufactured by replacing hydrogen atoms of the diphenyl oxide structure with bromine atoms. The number of bromine atoms varies from 3 to 10 atoms depending on the reaction chemistry. Commercially, BFRs comprise a range of PBBs, PBDEs, and TBBA. PBBs were discontinued voluntarily in the US after the 1973–1974 agriculture contamination crisis in Michigan [
8]. Thus, the current extent of PBB in consumer products is low since manufacturers replaced it by the two alternatives. Metal synergistic additives like antimony oxide (Sb
2O
3) accompany BFRs [
9,
10].
This research focuses solely on brominated fire retardants. Currently, most technology to debrominate WEEE degrades the polymer and produces unrecoverable byproducts and monomers whose remaining value is a fuel [
11]. However, combusting and pyrolyzing (thermal degradation in the absence of oxygen) these compounds and mixtures produces toxic brominated dibenzodioxins and dibenzofurans [
12]. In addition to toxic compounds, pyrolysis generates char, oil, and syngas. Conventional pyrolysis, fast pyrolysis, and slow pyrolysis have been tested for Br-HIPS: Fast and slow pyrolysis yield the highest amount of fuel and chemicals [
13]. In a fixed-bed reactor, pyrolyzing Br-HIPS at 430 °C produced an oil with 12% Br (76% of the bromine in the plastic) [
14]. When Br-HIPS was pyrolyzed in a fluidized-bed reactor from 450 °C to 550 °C, the oil contained more than 90% of the bromine [
15]. Further treatment is required, either before or after pyrolysis, to extract all of the bromine from the oil. Catalytic cracking has several advantages compared to a strictly thermal treatment: It reduces the reaction time and temperature while improving product quality and reducing the percentage of undesirable byproducts. Silica–alumina, zeolites, metal-based catalysts, and minerals have been developed [
13]. The oil yield with BaO as a catalyst exceeded 93%, with 76% styrene monomer and 18% dimer [
16]. However, a second step was required to remove the Br to repolymerize the styrene. BFR and antimony interfere with the catalytic reaction due to the modified thermal behavior compared to pure polymers. Sodium zeolite effectively releases the Br from the WEEE; however, it remains with the oil [
12,
17]. Hydrothermal treatment degrades polymers at a lower temperature than pyrolysis. In situ treatments remove bromine and antimony from the produced oil. Researches have reported 96% debromination of Br-HIPS at 280 °C with polypropylene as a reductive agent; also, supercritical CO
2 debrominated 97% of a HIPS sample, reducing the concentration of Br below 0.1%. The low Br concentration in the oil comes at the expense of the energy required to achieve supercritical conditions [
13]. Bromine was also extracted from Br-HIPS with an autoclave at 280 °C, with the addition of polypropylene as the H
2 source. The product oil contained 1.2% of the original Br, while the water retained the rest of the Br as HBr [
18]. Co-pyrolysis, pyrolysis of two or more compounds simultaneously, improved oil yield without a catalyst, solvent, or chemicals. Polypropylene and polyethylene react synergistically with the HIPS to achieve high debromination rates. The quality and quantity of the wax and oil depends on the source of Br-HIPS and how much PP is added. Co-pyrolysis of Br-HIPS has also been tested with biomass/coal, yielding 62% oil compared to 53% oil from pyrolysis of Br-HIPS alone, with bromine staying with the char rather than in the oil [
13]. Alkali compounds, such as calcium, sodium, and potassium, capture bromine in-situ when it is released during thermal and supercritical decomposition [
13,
18]. Similarly, an ammonia quench traps Br after it is released and becomes volatile [
19]. Since ammonia can trap HBr, it can convert more than 90% of the mass fraction of bromine to inorganic ammonium bromine. Grause et al. [
20] extracted bromine from HIPS without destroying the polymer matrix: Decabromodiphenyl ethane was reacted in a ball mill charged with a solution of ethylene glycol (EG) and 0.5 M NaOH at 190 °C for 24 h to recover 98% of the Br.
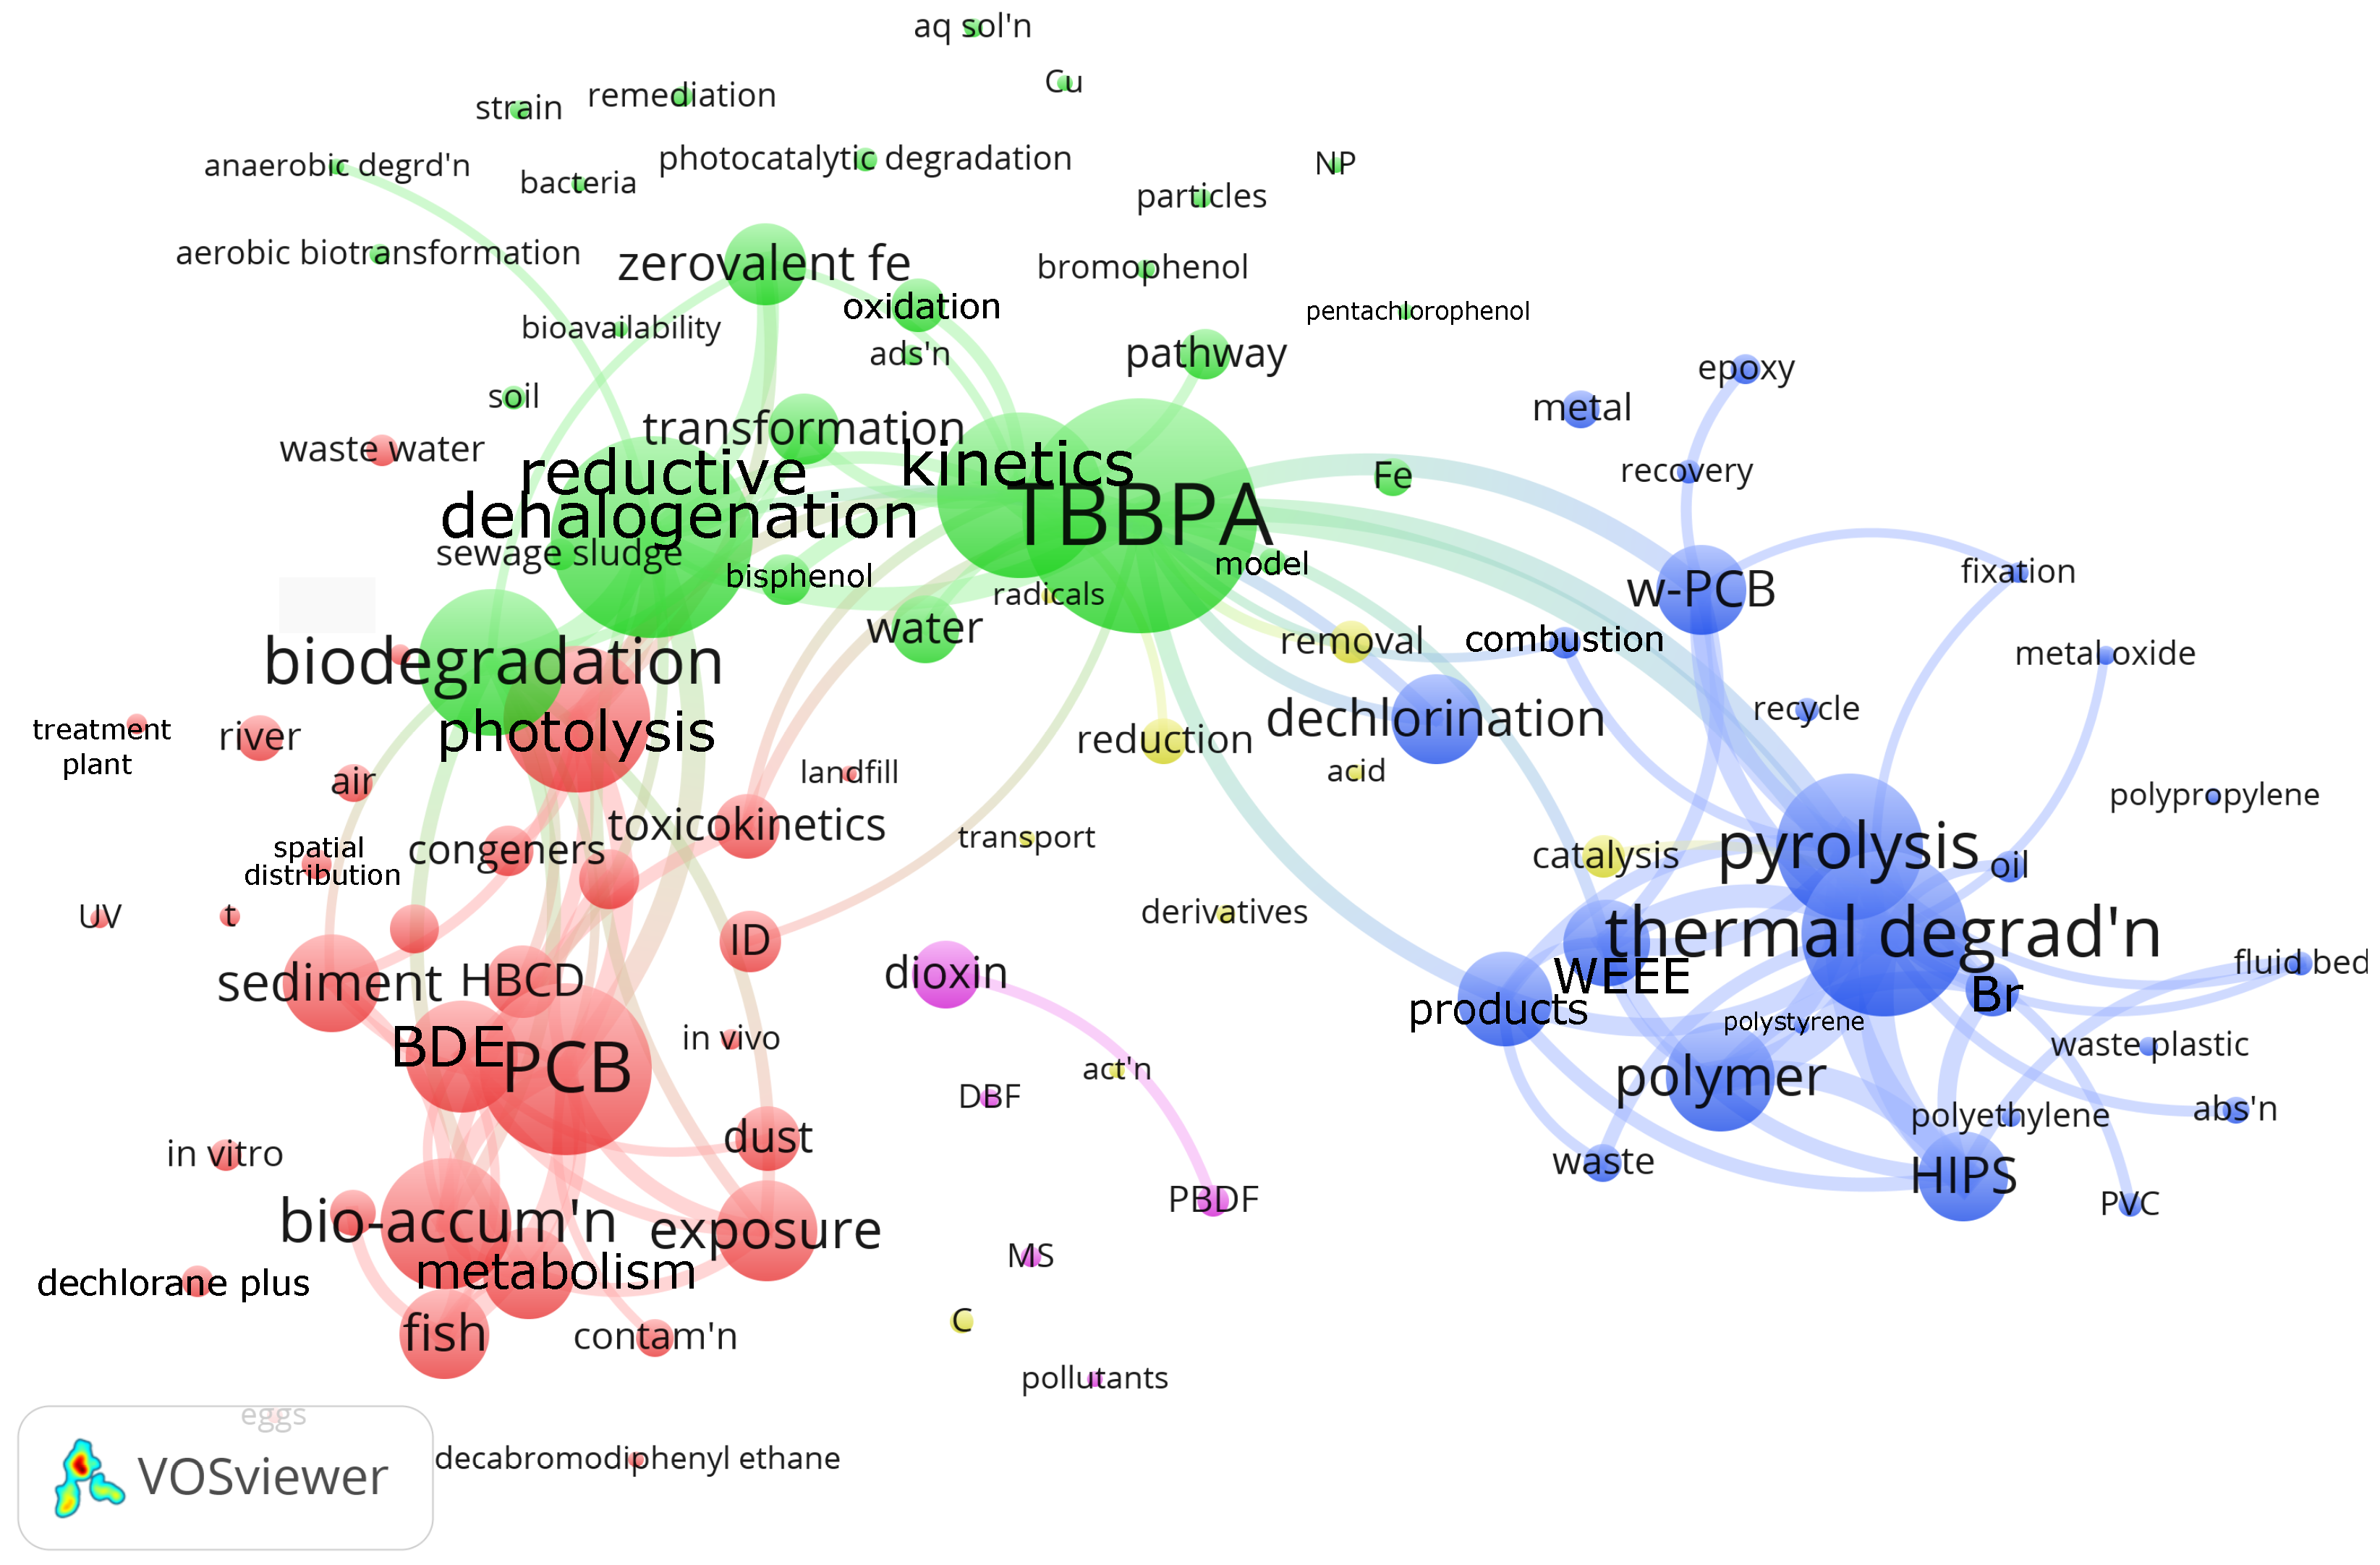
We generated a bibliographic map based on the VOSViewer open software (Version 1.6.20) and the Web of Science reference database to assess the research focus around debromination of flame retardants in plastic (
Figure 2). Web of Science has indexed 2320 articles with debromination as the keyword in the “All Fields” search field. We manually searched for articles in this selection with the keywords “retardant” OR “suppressant” and “flame” OR “fire”, and “polymer” OR “plastic”, which reduced the number of articles to 561. VOSViewer grouped the 110 most often mentioned keywords into five clusters. The red cluster has 33 keywords, including
PCB (polychlorinated biphenyl), photolysis, bioaccumulation. VOSViewer assigned 29 keywords to the green cluster, centered on
TBBPA (tetrabromobisphenol), reductive halogenation, biodegradation. The blue cluster, with 25 keywords, is dedicated to
thermal degradation, pyrolysis, and polymers, including HIPS, polystyrene, polyethylene, and polypropylene. The yellow and magenta clusters have 11 and 5 keywords, respectively.
In this work, we test solvothermal methods to extract Br from commercial brominated HIPS waste electrical and electronic equipment (specifically from printers). Our focus is to test glycols with a reasonably high boiling point to accelerate the reaction kinetics and diffusion of alkali (reacting species) and glycol. We show that reaction rates in filamentous HIPS are orders of magnitude higher than for bulk HIPS.
2. Results and Discussion
Unlike pure blends of polymer and brominated fire retardants for controlled experiments, end-of-life plastic contains various additives; antimony oxide added to halogenated fire retardants, for example [
23]. Commercial plastics have carbon black, TiO
2, and glass fiber, all of which impact debromination rates. Strong alkalis scavenge bromine atoms from fire retardant compounds.
The final element of the reaction sequence is expected to be either NaBr or KBr. Antimony trioxide Sb
2O
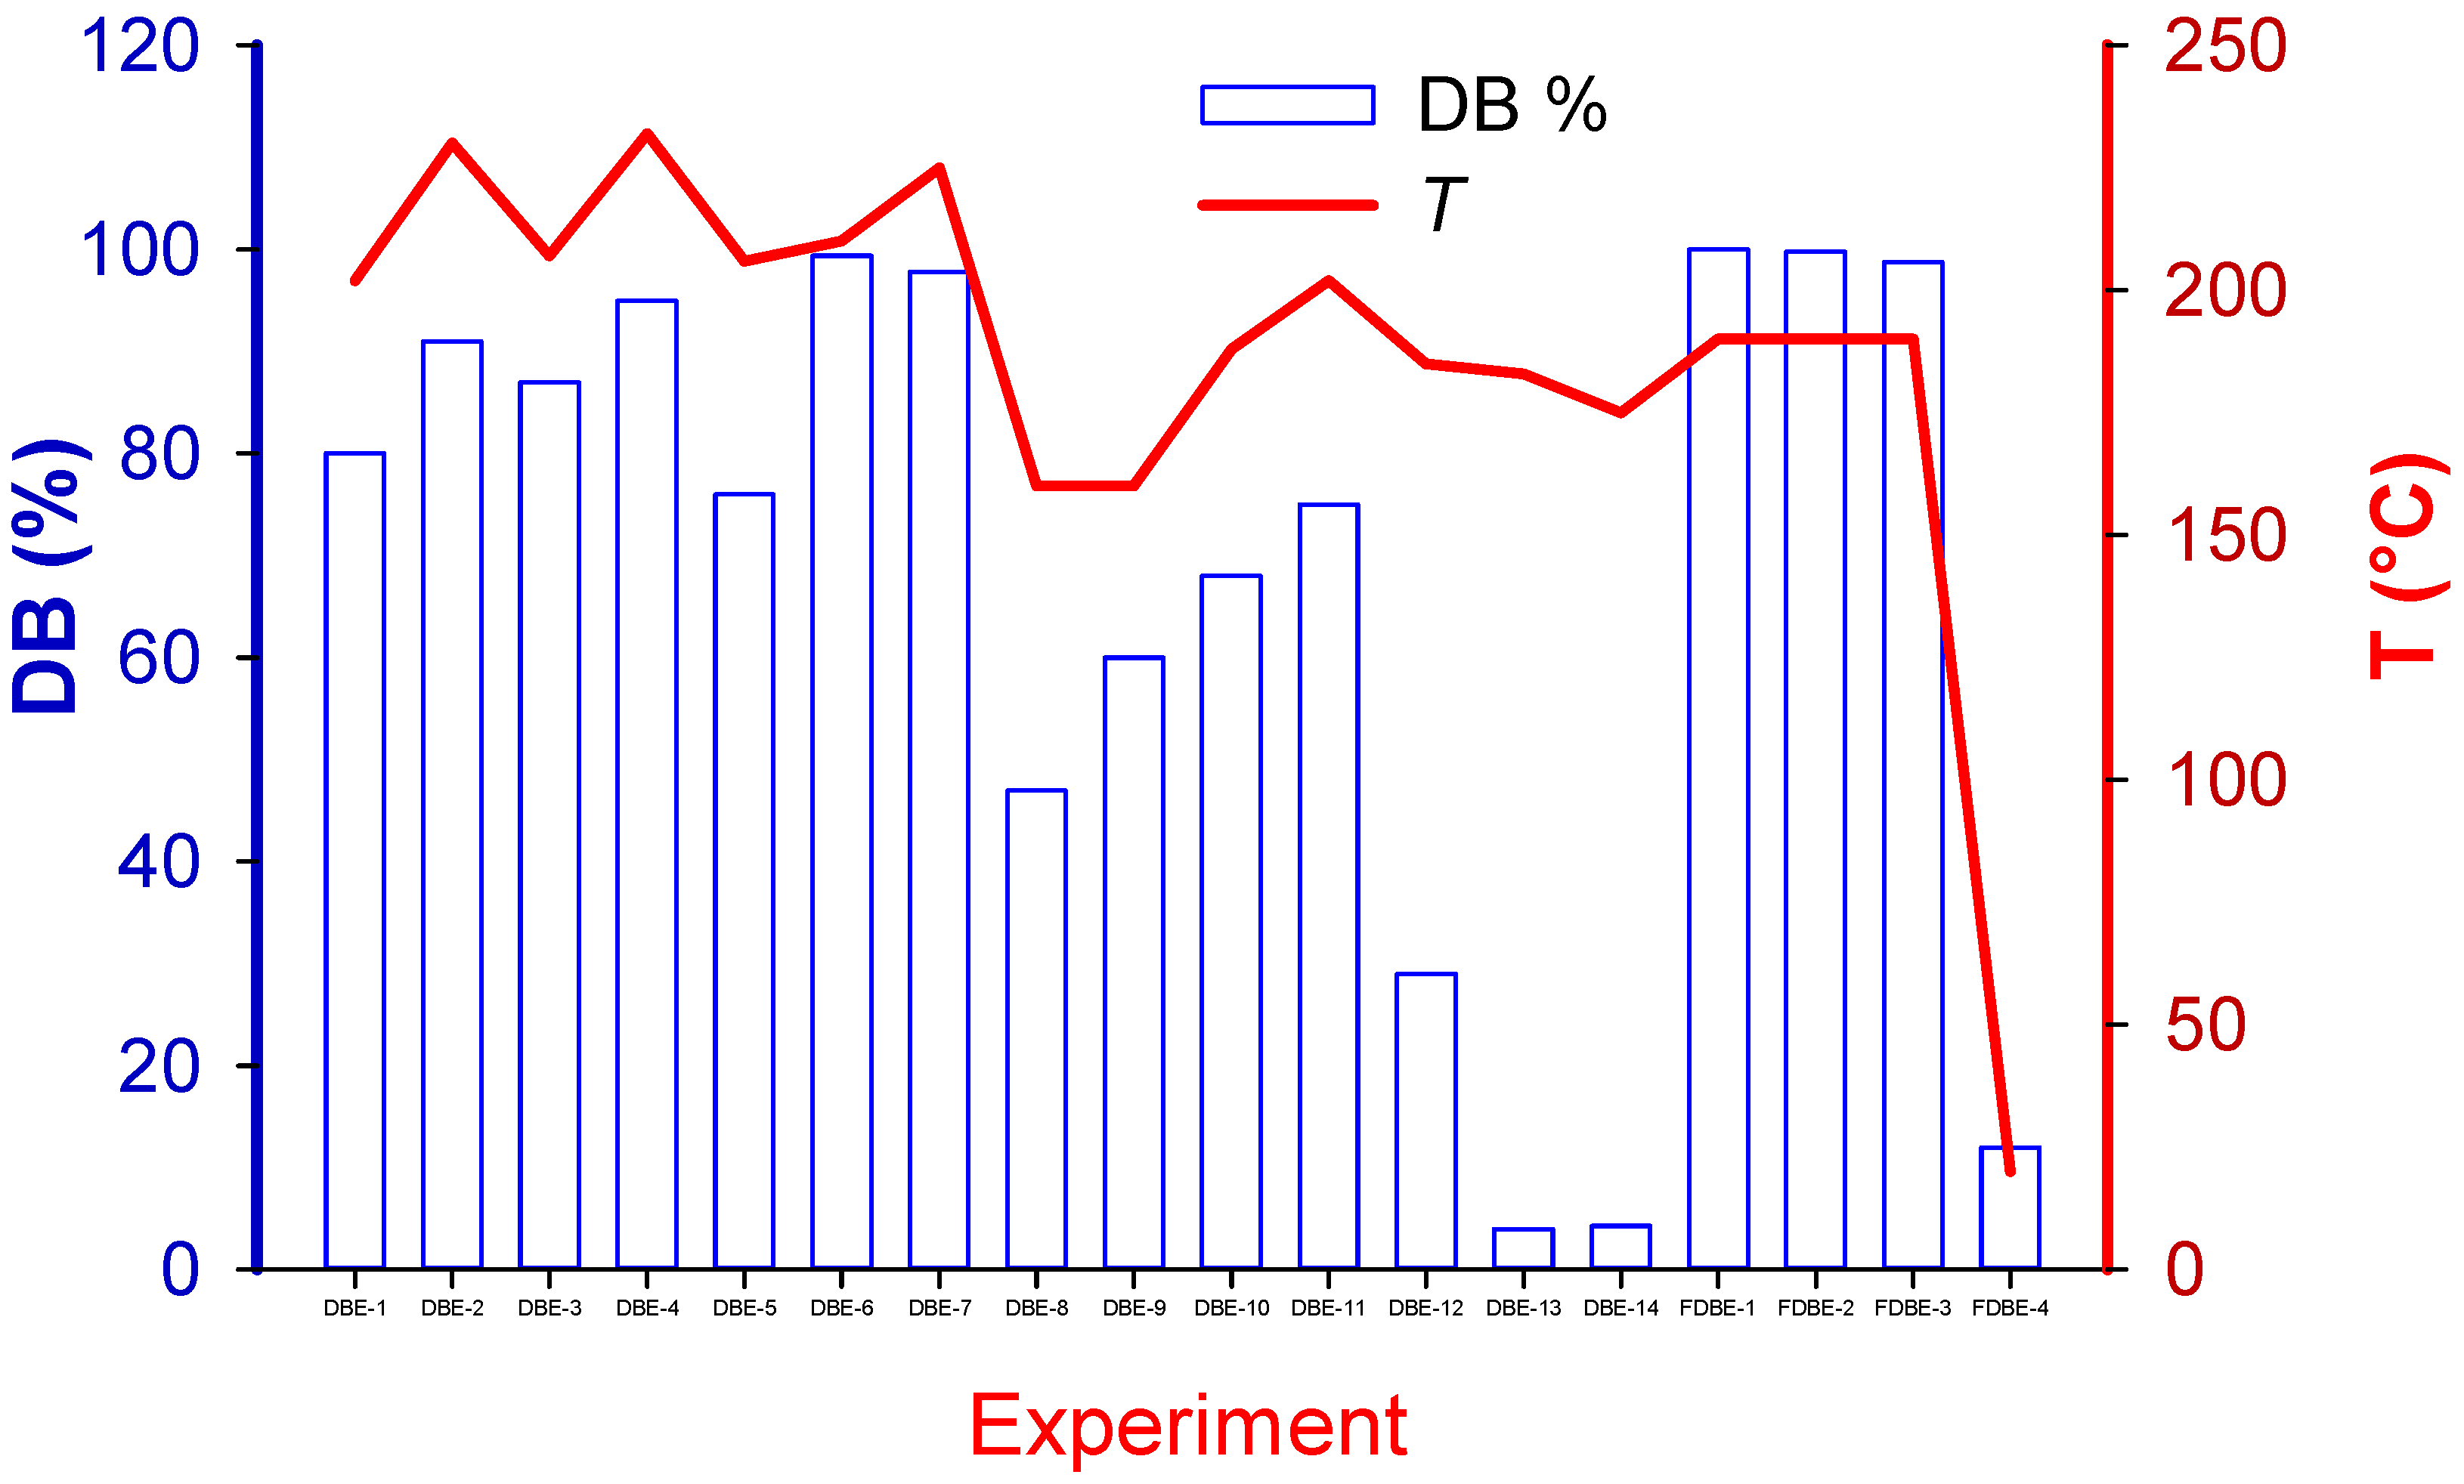
3 appears to be inert in this reaction and remains with the polymeric matrix or in the solvent. To account for the contribution of each factor to the extent Br was extracted from the sample (
Figure 3),
X, we assumed a completely back-mixed reactor model with a first-order reaction rate,
, where
k is the rate constant,
t is time, and
V is volume.
Description of Variables
: Concentration of brominated species.
: Activation energy.
: Rate constant.
k: Regression rate constant accounting for contributions from factors in design of experiment (DOE).
: Rate constant at .
: Reaction rate of brominated species.
R: Universal gas constant.
t: Time.
T: Temperature.
: Reference temperature (150 °C).
TEG: Factor representing the use of TEG as solvent (2 for TEG, 1 for EG).
V: Volume of solvent.
: Pellet morphology factor (1 for large pellets, 2 for filament).
X: Conversion factor.
: Agitation rate.
: Exponents for reaction rate dependencies.
where the reference temperature,
, is 150 °C:
Standard statistical models assume a linear relationship to characterize the relationship between the primary variables and factors, but they often miss the fact that the relationships are non-linear [
24]. Therefore, we introduced power-law expressions to account for how the reaction rate,
k, varies with the following factors:
V (volume of solvent); TEG (2 = TEG as solvent, 1 = EG as solvent); KOH (2 = KOH as extractant, 1 = NaOH as extractant);
(agitation rate); and
(pellet morphology: 1 = large pellets, 2 = filament).
Assigning a value of 1 or 2 to the stochastic factor accounts for how the reaction rate depends on it quantitatively. For example, the best-fit exponent for NaOH is 0.8, so the reaction rate constant is greater by
with NaOH versus KOH. The best-fit expression that fit the experimental data for
k becomes
The exponent for
translates to a kinetic rate constant
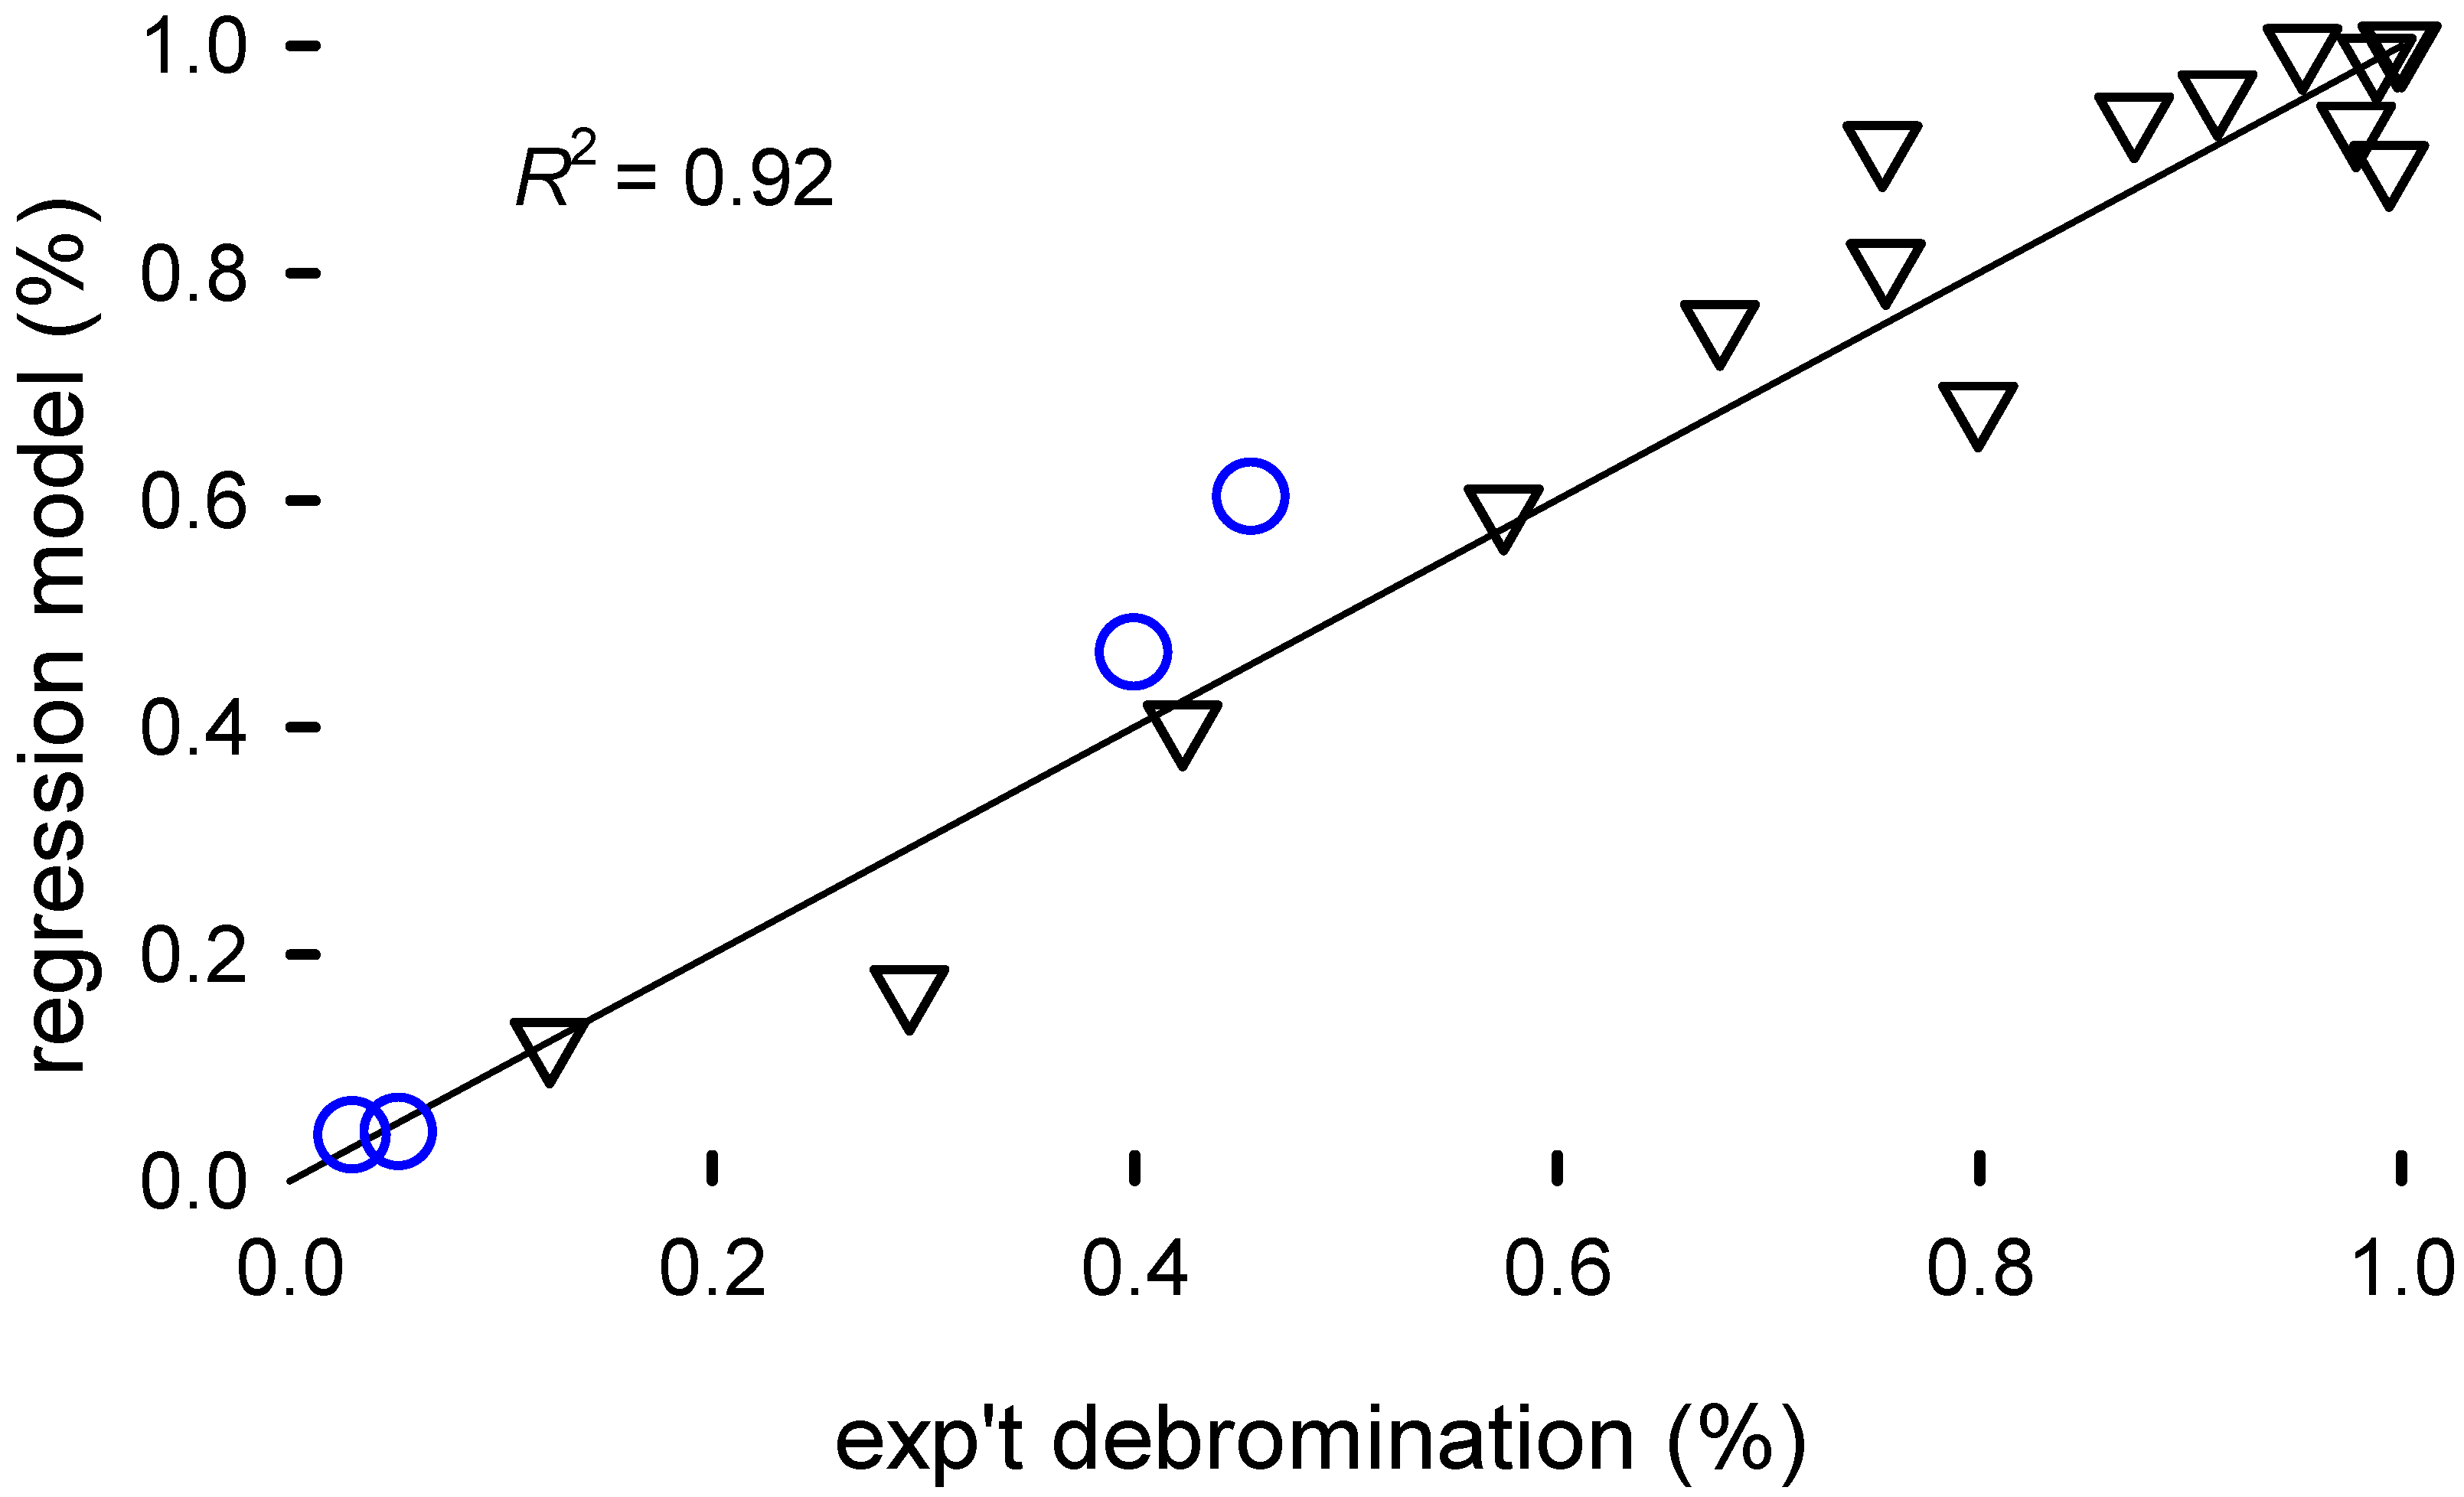
higher for the filaments compared to the pellets. This indicates that mass transfer in the plastic matrix limits reaction rates. The TEG solvent is 8 times more effective than EG, but this might also be due to the possibility of working at higher temperatures, i.e., solvent and temperature as factors might be confounded. Unsurprisingly, the stirring rate has no substantial contribution to the reaction rate as mass transfer across the matrix must be limiting. The model—Equations (
4) and (
6)— accounts for 92% of the variance in the data (
Figure 4).
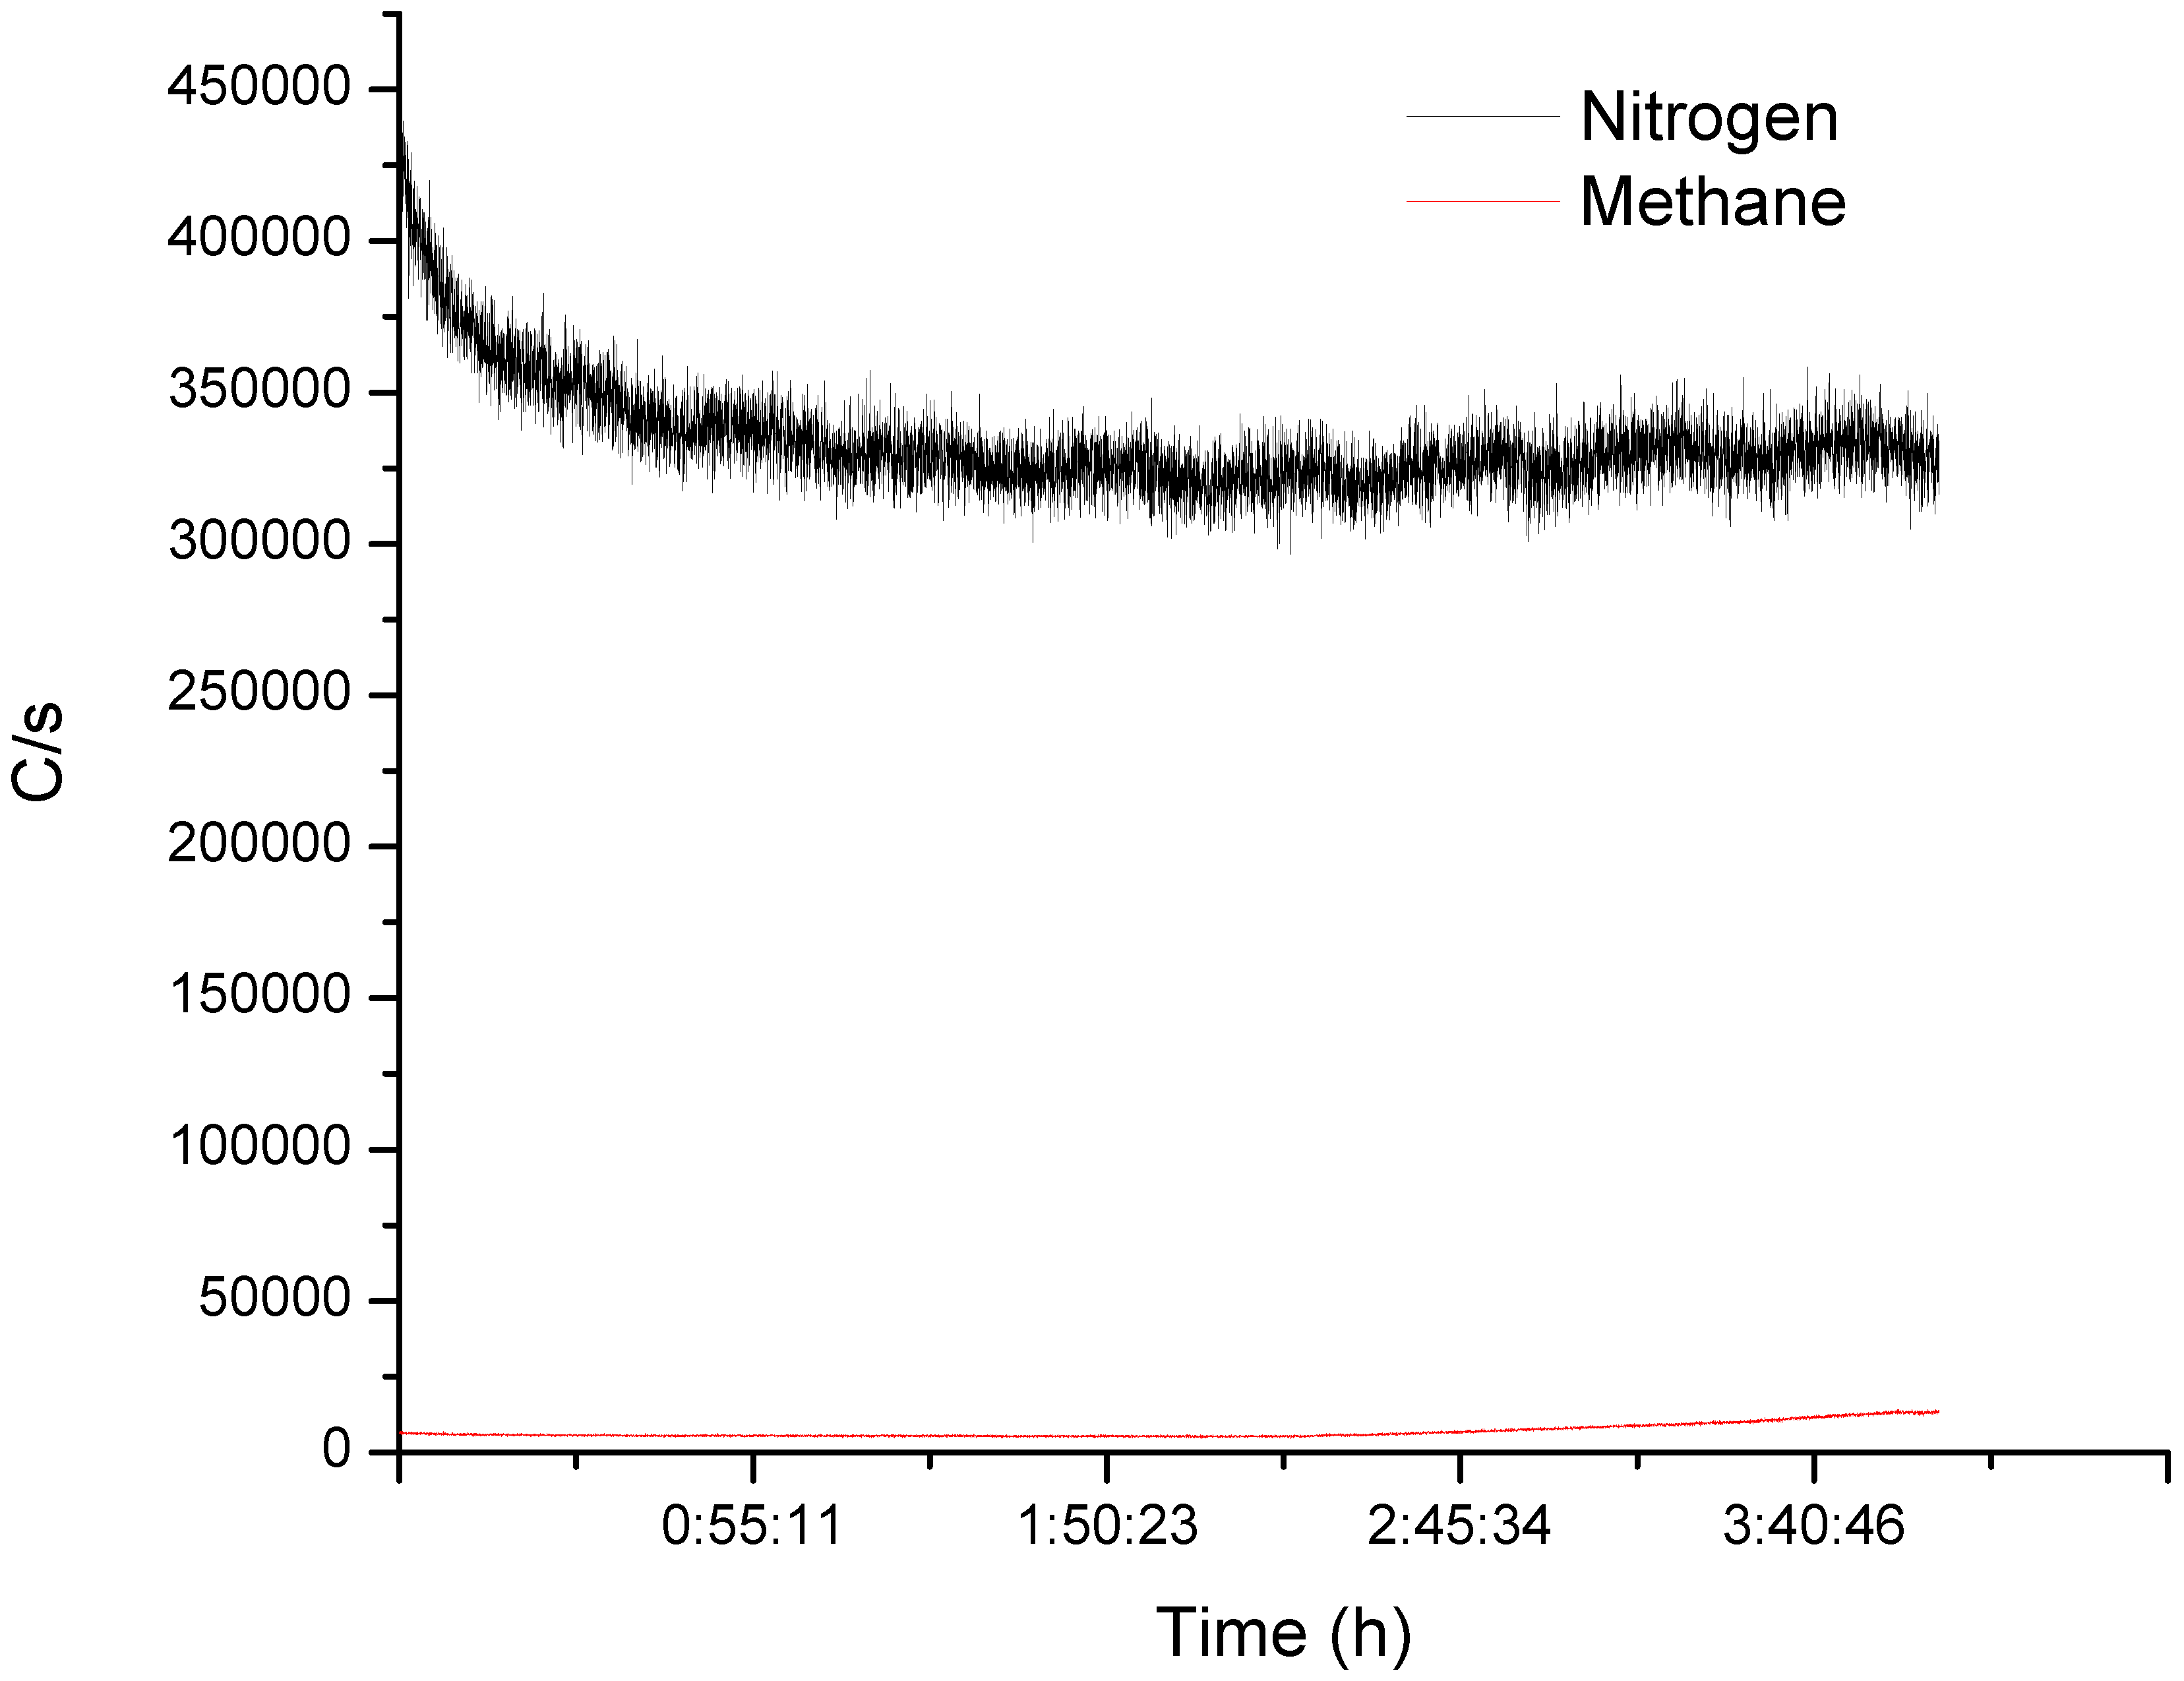
This statistical model estimates the energy of activation (
) is equal 71 kJ mol
−1, which is higher than expected since mass transfer is limiting the rate. To fully characterize the reaction, we coupled the effluent gas to an on-line mass spectrometer to monitor the concentration of non-condensable gases. The MS detected a low level of methane after 3 h of reaction (
Figure 5).
Statistical models for scale-up introduces uncertainty but this psuedo-engineering model advocates pellet comminution (generating filaments) to increase surface area, using NaOH, higher temperature, and TEG. A more focused experimental design would better substantiate how the reaction rate changes with concentration, pellet size/morphology, and temperature. While building the model, we excluded four data points to later assess how well it predicts conversion. The model fits two of the data points at very low conversion () surprisingly well. At higher conversion, the model is less accurate but reasonably good considering the breadth of the conditions in the screening design.
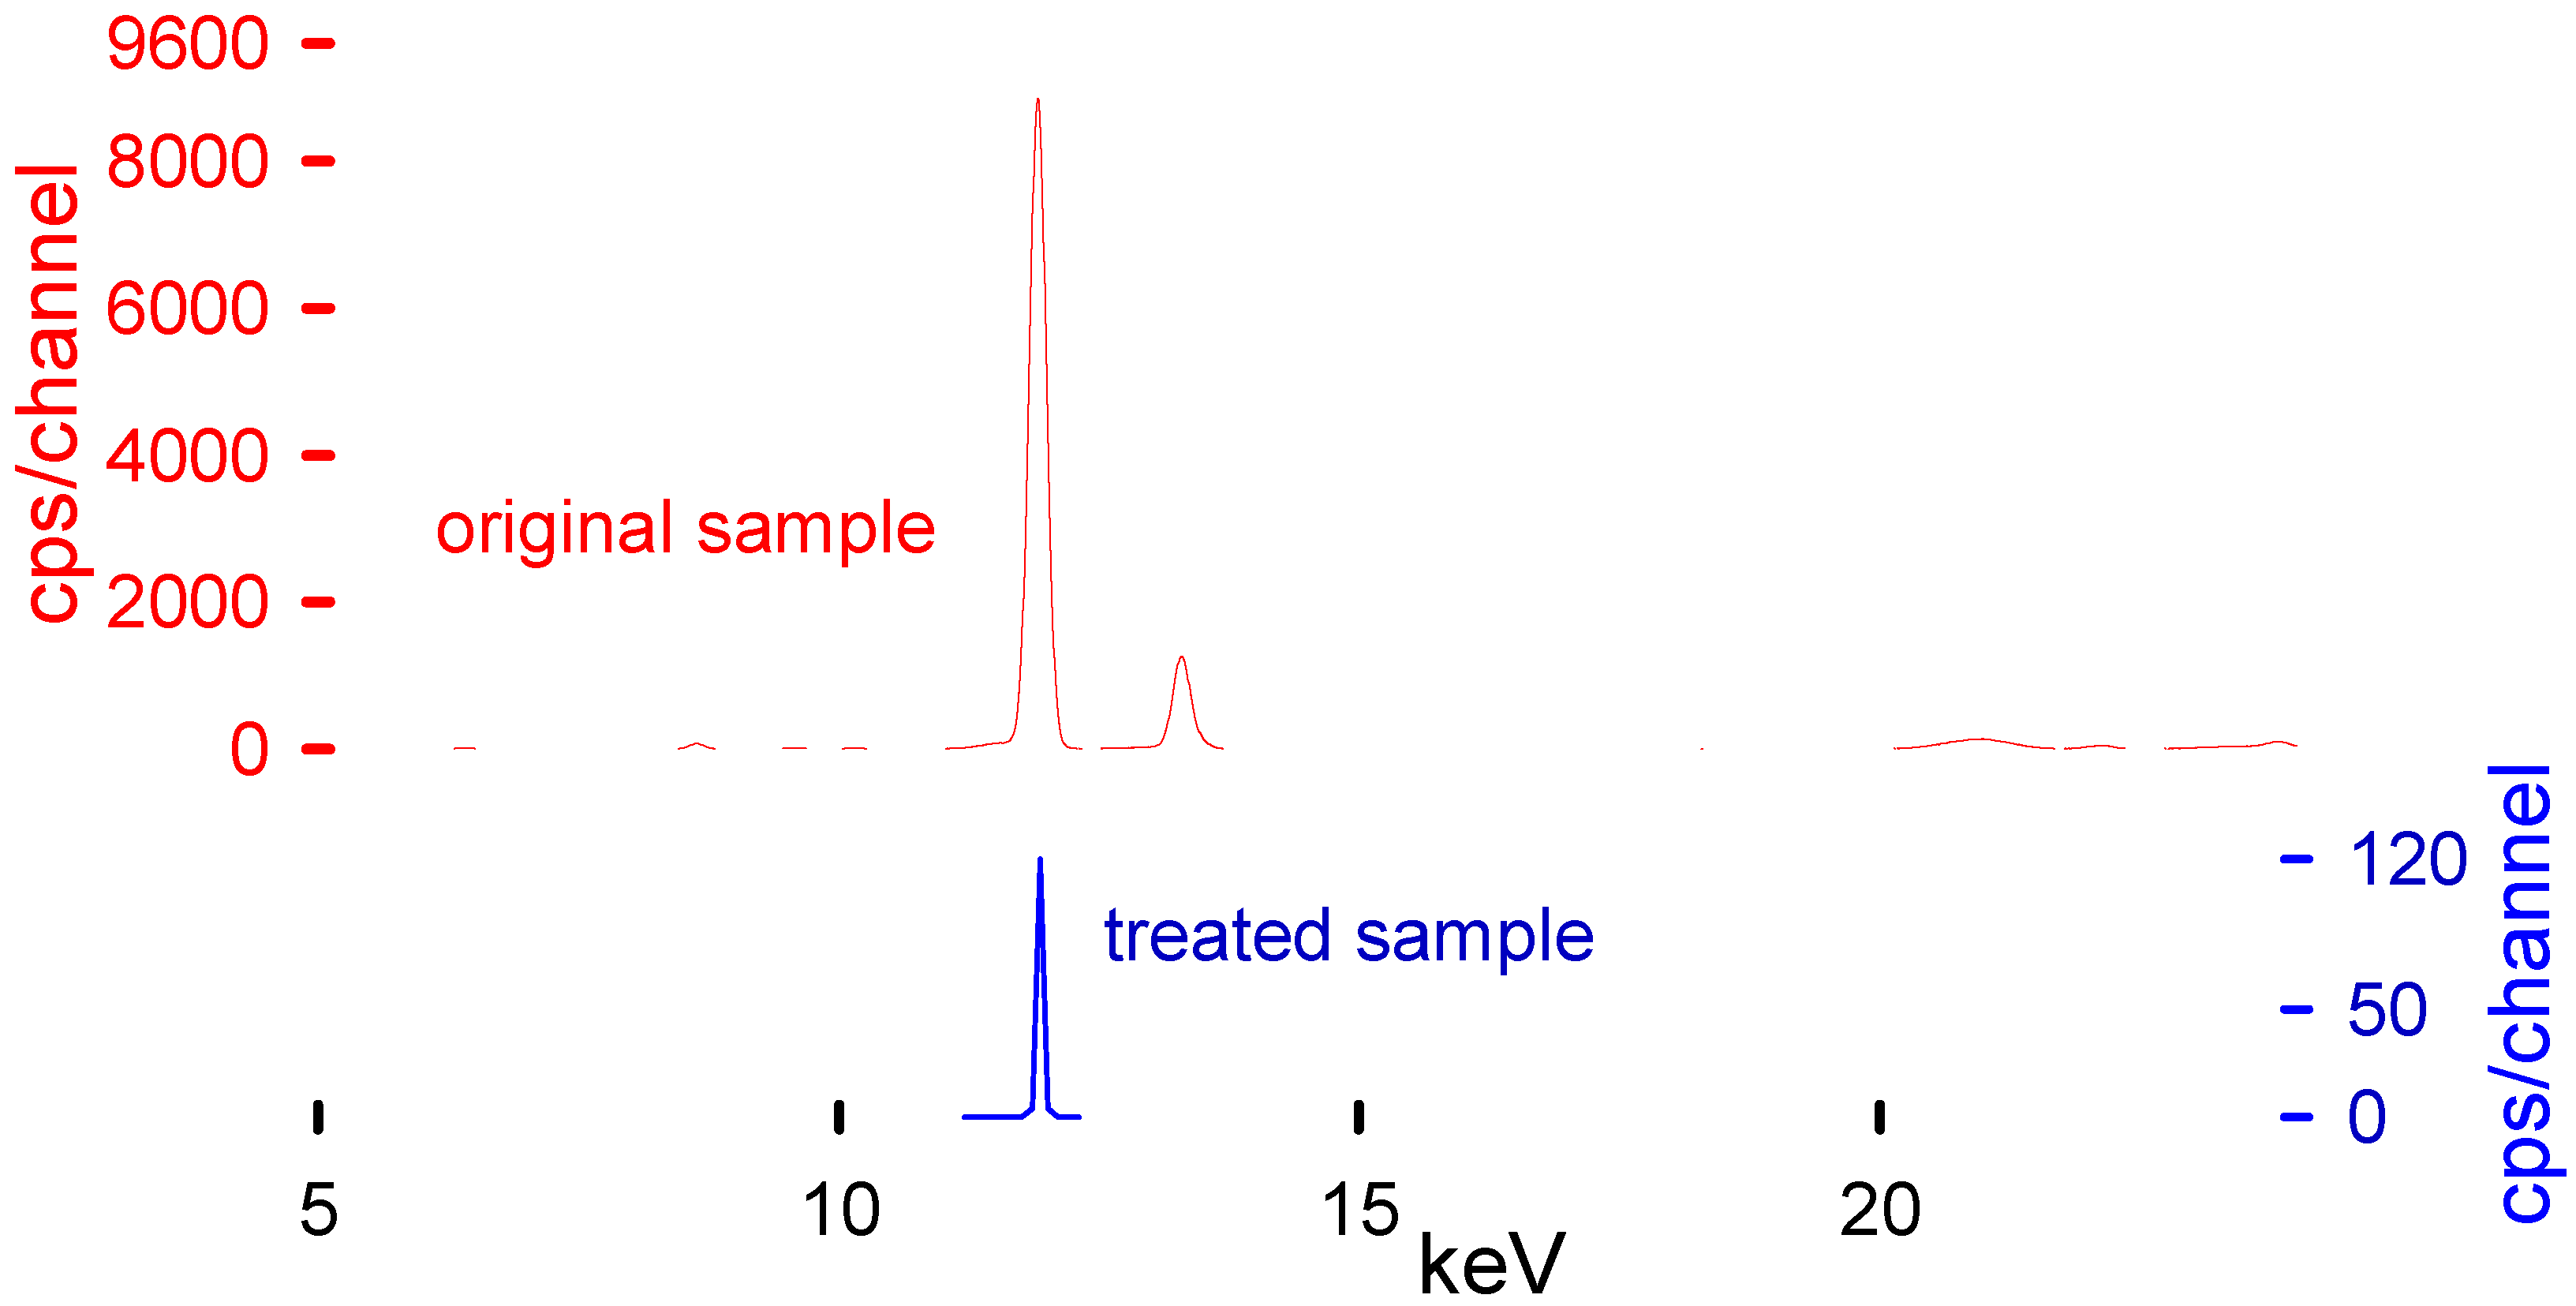
2.1. XRF
XRF was used to determine the Br content in the plastic samples and the solvent (
Table 2). XRF has proven to be a fast and reliable technique to measure Br [
25]. Because they are non-destructive analyses, the same sample could be characterized with complementary techniques such as FTIR and TGA [
26,
27]. Additionally, the instrument results were validated regularly with RoHS standards to guarantee their fidelity.
Table 3 represents the main transition energies for the most common elements present within the polymeric matrix. These transition energies of the elements correspond to the peaks present in the XRF spectra (
Figure 6).
Although XRF is a superficial analytical technique, it is suitable for our application. The penetration depth into the polymeric matrix is higher than in other materials and bromine is heavy enough to be easily detectable by this technique. There are already articles comparing the results of XRF’s capability to quantify the Br elemental concentration in different polymeric samples, reaching the precision of GC-MS techniques [
28,
29,
30]. We took the needed measures to improve the representativity of the measurements by measuring each piece at least five times; different pieces from each bath were measured and the thickness was never higher than 2 mm. It is reasonable to assume that the concentration was homogeneous throughout the polymer. Other techniques such as ICP analysis would have been an ideal complement to this study, However, as we were aware of the limitations of the XRF, and we wanted to ensure that our results were trustworthy, our equipment was calibrated and checked periodically with RoHS calibration standards. Finally, to elevate our confidence even more, we analyzed different polymeric samples with different Br contents and then sent them to the neutron activation analysis (NAA) laboratory at Polytechnique Montreal, proving the validity of the method (the results are shown in Table 7 of Ferreiro et al. [
25]). The equipment used was specifically calibrated by its use in the plastic industry, with a specific mode to target RoHS compounds, primarily Br.
All the samples were measured five times before and after the reaction. The reaction media leached some of the metal additives and contaminants.
2.2. FTIR
The FTIR analysis shows (
Figure 7) that the treatment removes the polybutadiene fraction of HIPS, since its characteristic peaks are no longer present in the FTIR spectrum. It is unclear if its being removed or undergoing a side reaction (hydrolysis of double bonds from PB, as suggested by Grause et al. [
20]) or undergoes cross-linking. Other studies claim that OH radicals bind to the superficial aromatic rings without opening it. This hydroxyl radical additionally increases the hydrophilicity of the polymer. Since we used an alcohol and a strong base, there are enough OH radicals to react with the polymer surface. This could explain, at least partially, the persistence of the OH peak in the FTIR spectrum even after thoroughly drying the polymer. The same study also shows that at high concentrations, OH and O radicals react with the ring, opening it and leading to some cross-linking [
31]. The extent to which these reactions happen under our conditions, if at all, remains unclear. None of the other analyses present indications of a noticeable change of the polymeric properties after the treatment.
The OH vibrations at around 3500 cm
−1 were absent in some samples. This could be due to an incomplete reaction or due to a better drying that eliminated the solvent, or it could be due to a substitution reaction [
20]. The fire-retardant backbone could remain inside the polymer because its aromatic structure will be masked by the polystyrene spectrum. The FTIR analysis (
Figure 8) shows a consistent PS-like spectrum, indicating that the base polymer remains unchanged by the reaction.
Selecting two points of each spectrum (one for the peak changing and one for the aliphatic C-H stretching that we assume remains unchanged during the process), we can normalize the results. Then, by comparing the ratios, we can determine the absolute variation.
The absorbance ratios for HIPS and DBE at different wavenumbers can be written as
where the 1539 cm
−1 peak (associated with polybutadiene) is decreasing relative to the 2919 cm
−1 peak (aliphatic C-H stretching).
For HIPS, the ratio is approx 1.45, indicating higher presence of the polybutadiene-related peak.
For DBE-8, the ratio is approx 2.73, indicating a less prominent polybutadiene-related peak.
Additionally, the HIPS FTIR spectrum clearly shows a peak at 1537 cm
−1 related to the carbon double bond of polybutadiene. This peak disappears after the treatment, indicating the removal or degradation of polybutadiene. It is, however, possible that the polybutadiene is losing the double bond due to temperature, which could induce a cross-linking reaction and double bond loss [
32].
2.3. TGA and DCS
The TGA results give a consistent PS-like decomposition pattern (
Figure 9). However, the decomposition starts at a higher temperature for the debrominated polymer (HIPS 8) compared with virgin PS (green line) and brominated HIPS (black line). This may be explained by a partial cross-linking of the polymer during the treatment, due to the presence of other components providing an increased stability, and by lower decomposition temperatures of the brominated fire retardant [
20,
33].
Sb
2O
3 shifts the curve towards a lower temperature because of its synergy with the brominated fire retardant [
34]. The decomposition of most of the brominated fire retardant and Sb
2O
3 in this first step also means that the remaining pattern is the polymer (HIPS) itself (
Figure 10).
Finally, due to the high viscosity of ethylene and triethylene glycol, they remained in the polymeric matrix, even after washing with water and drying at 60 °C for several days. The presence of EG or TEG was obvious due to their specific boiling points appearing on the TGA trace.
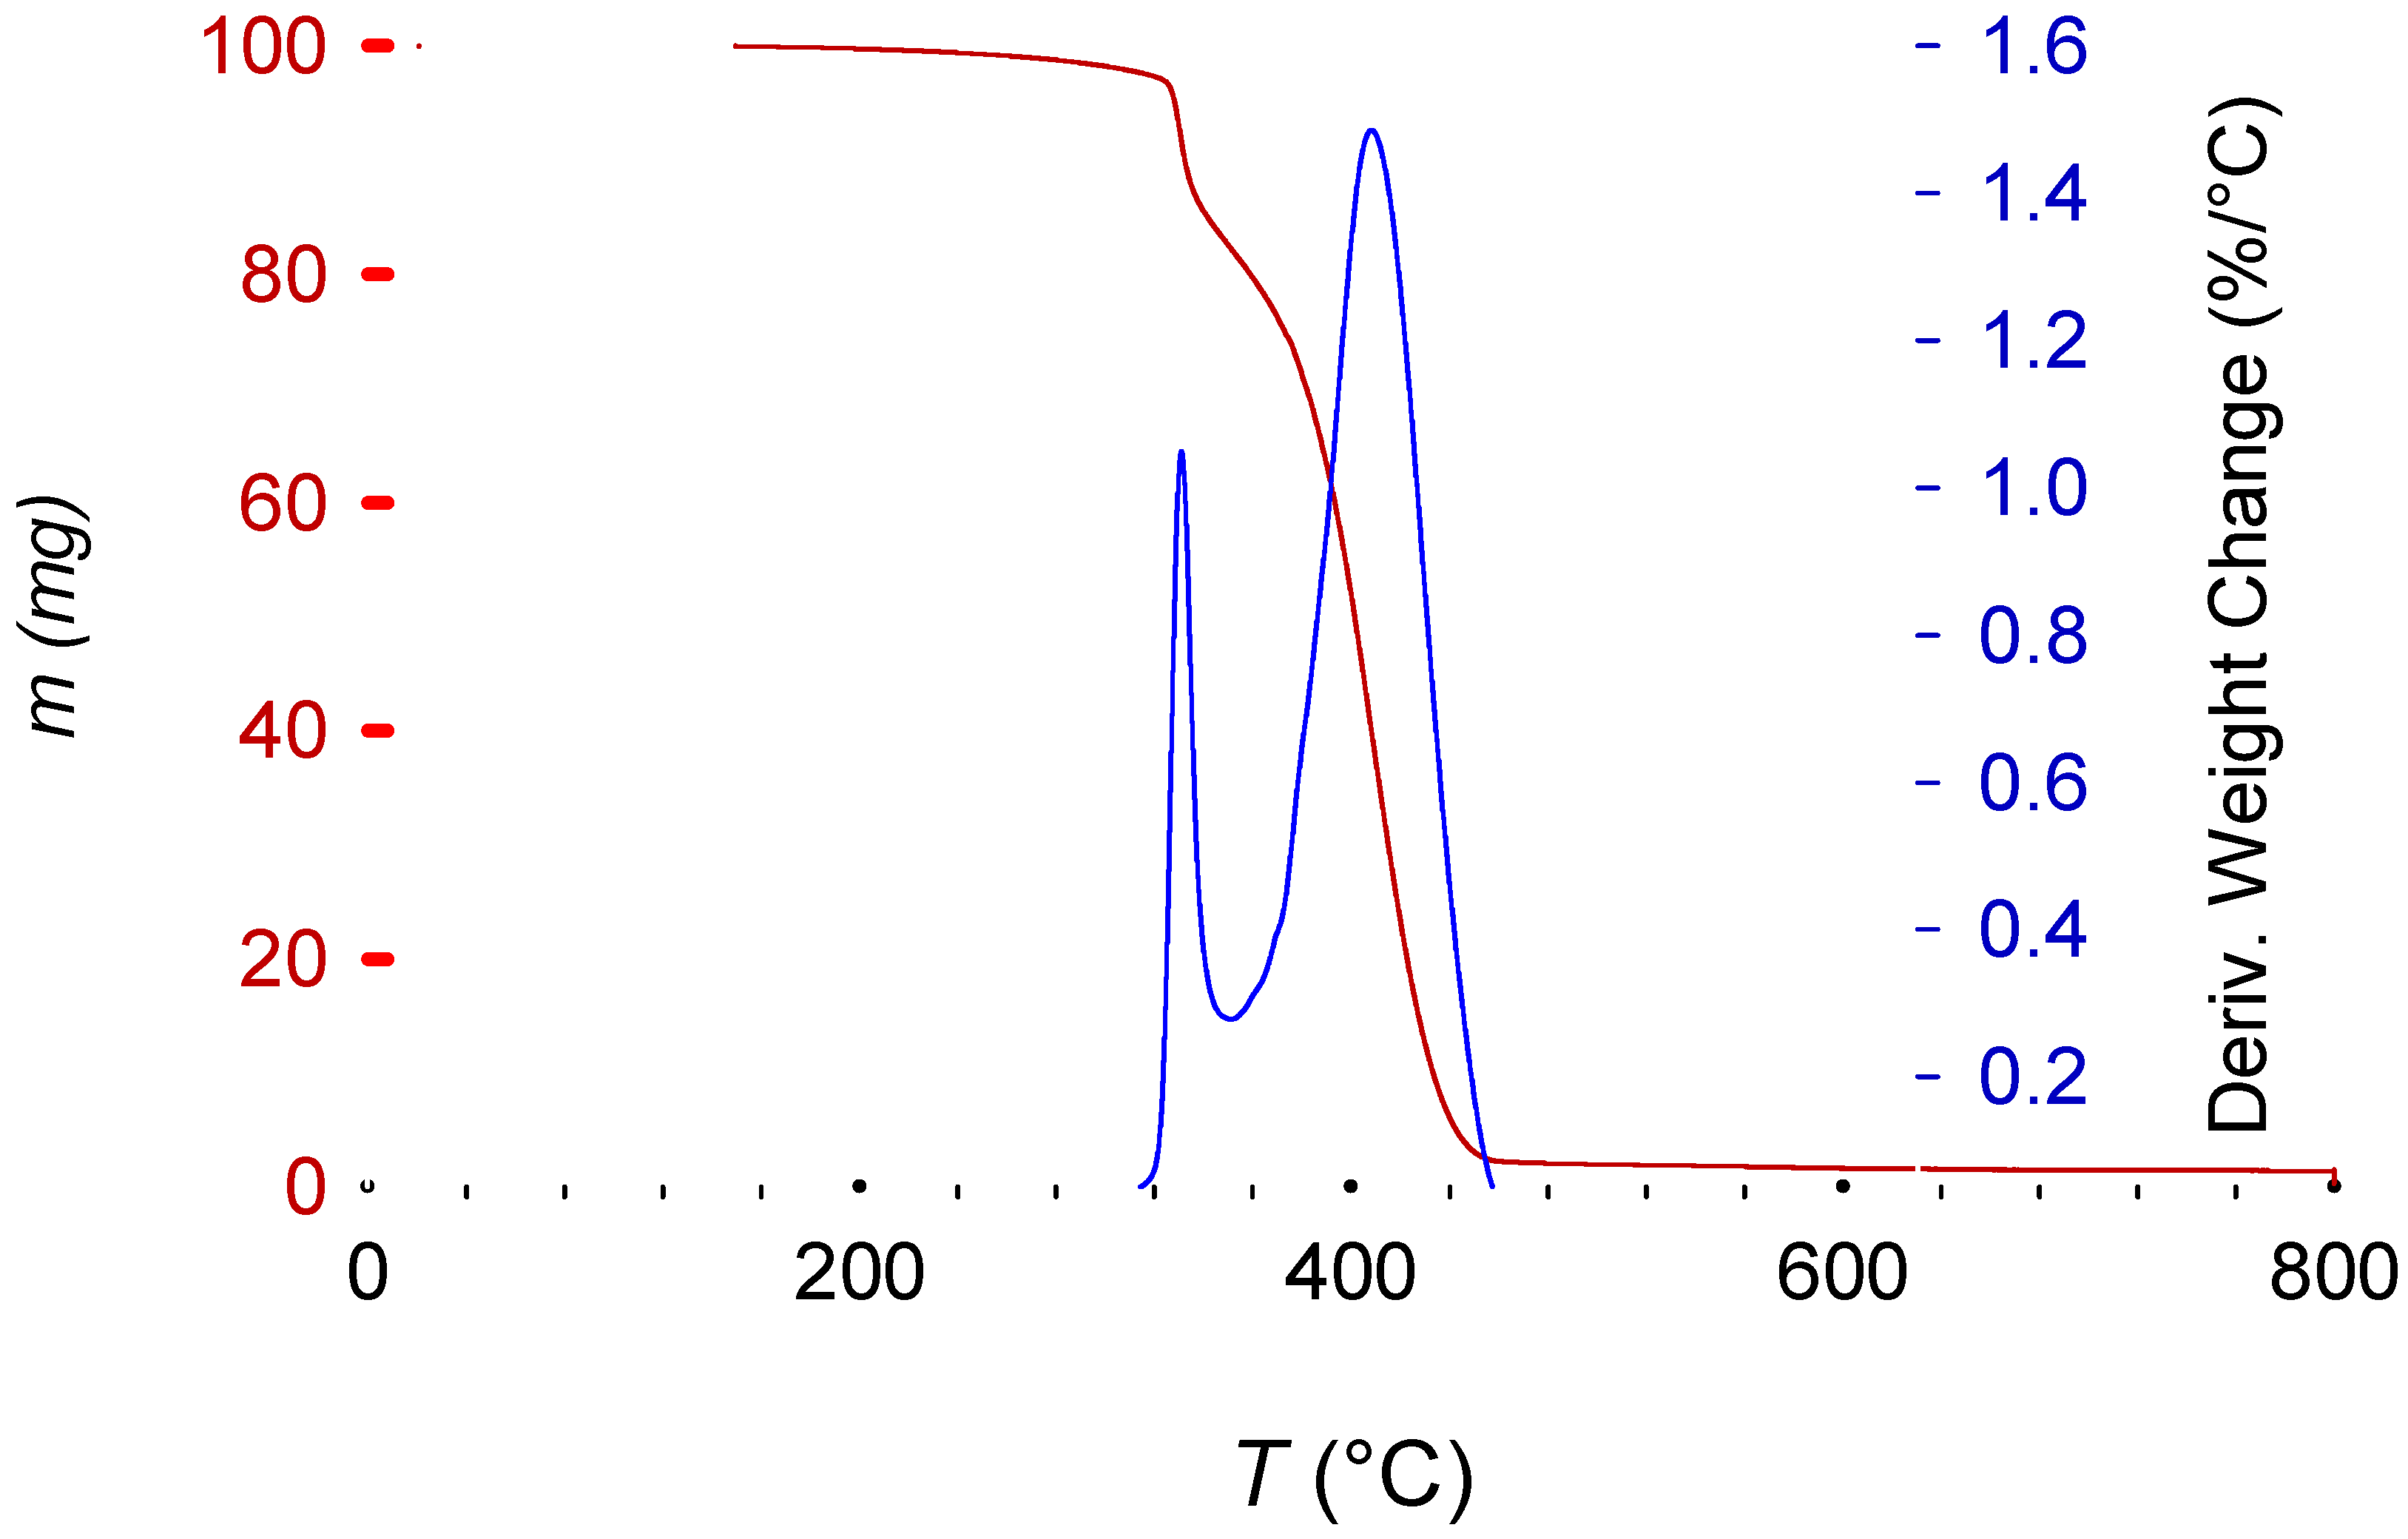
Figure 10 presents the characteristic two-step decomposition of a brominated fire retardant plus Sb
2O
3 synergyst, with the first occurring at about 330 °C, due to the synergistic action of the fire retardant and Sb
2O
3. According to E. Jakab et al. [
34], this is the moment when the fire- retardant mechanism starts. By scavenging radicals from the decomposing polymer (the primary function of the fire retardant), the Br and Sb
2O
3 react to form SbBr
3. This reaction also removes some hydrogen from the polymeric chain, which then take part in an intermediate reaction to form BrH. This hydrogen bromide reacts later with the oxygen from the Sb
2O
3 to form H
2O. Removing H from the main chain induces a beta-scission, initiating the polymer decomposition (explaining the earlier decomposition when compared with non-brominated equivalents). Radical scavengers increase the energy required to induce oxidation and therefore the combustion of the polymer [
12,
34,
35,
36]. The last peak, starting at 360 °C until 470 °C, represents the normal polymeric decomposition.
Figure 9 additionally shows a decrease in the remaining mass at 800 °C, when there is a change to an oxygen atmosphere to clean the pan and remove any organic remnants, providing additional information about possible additives and decomposition pathways.
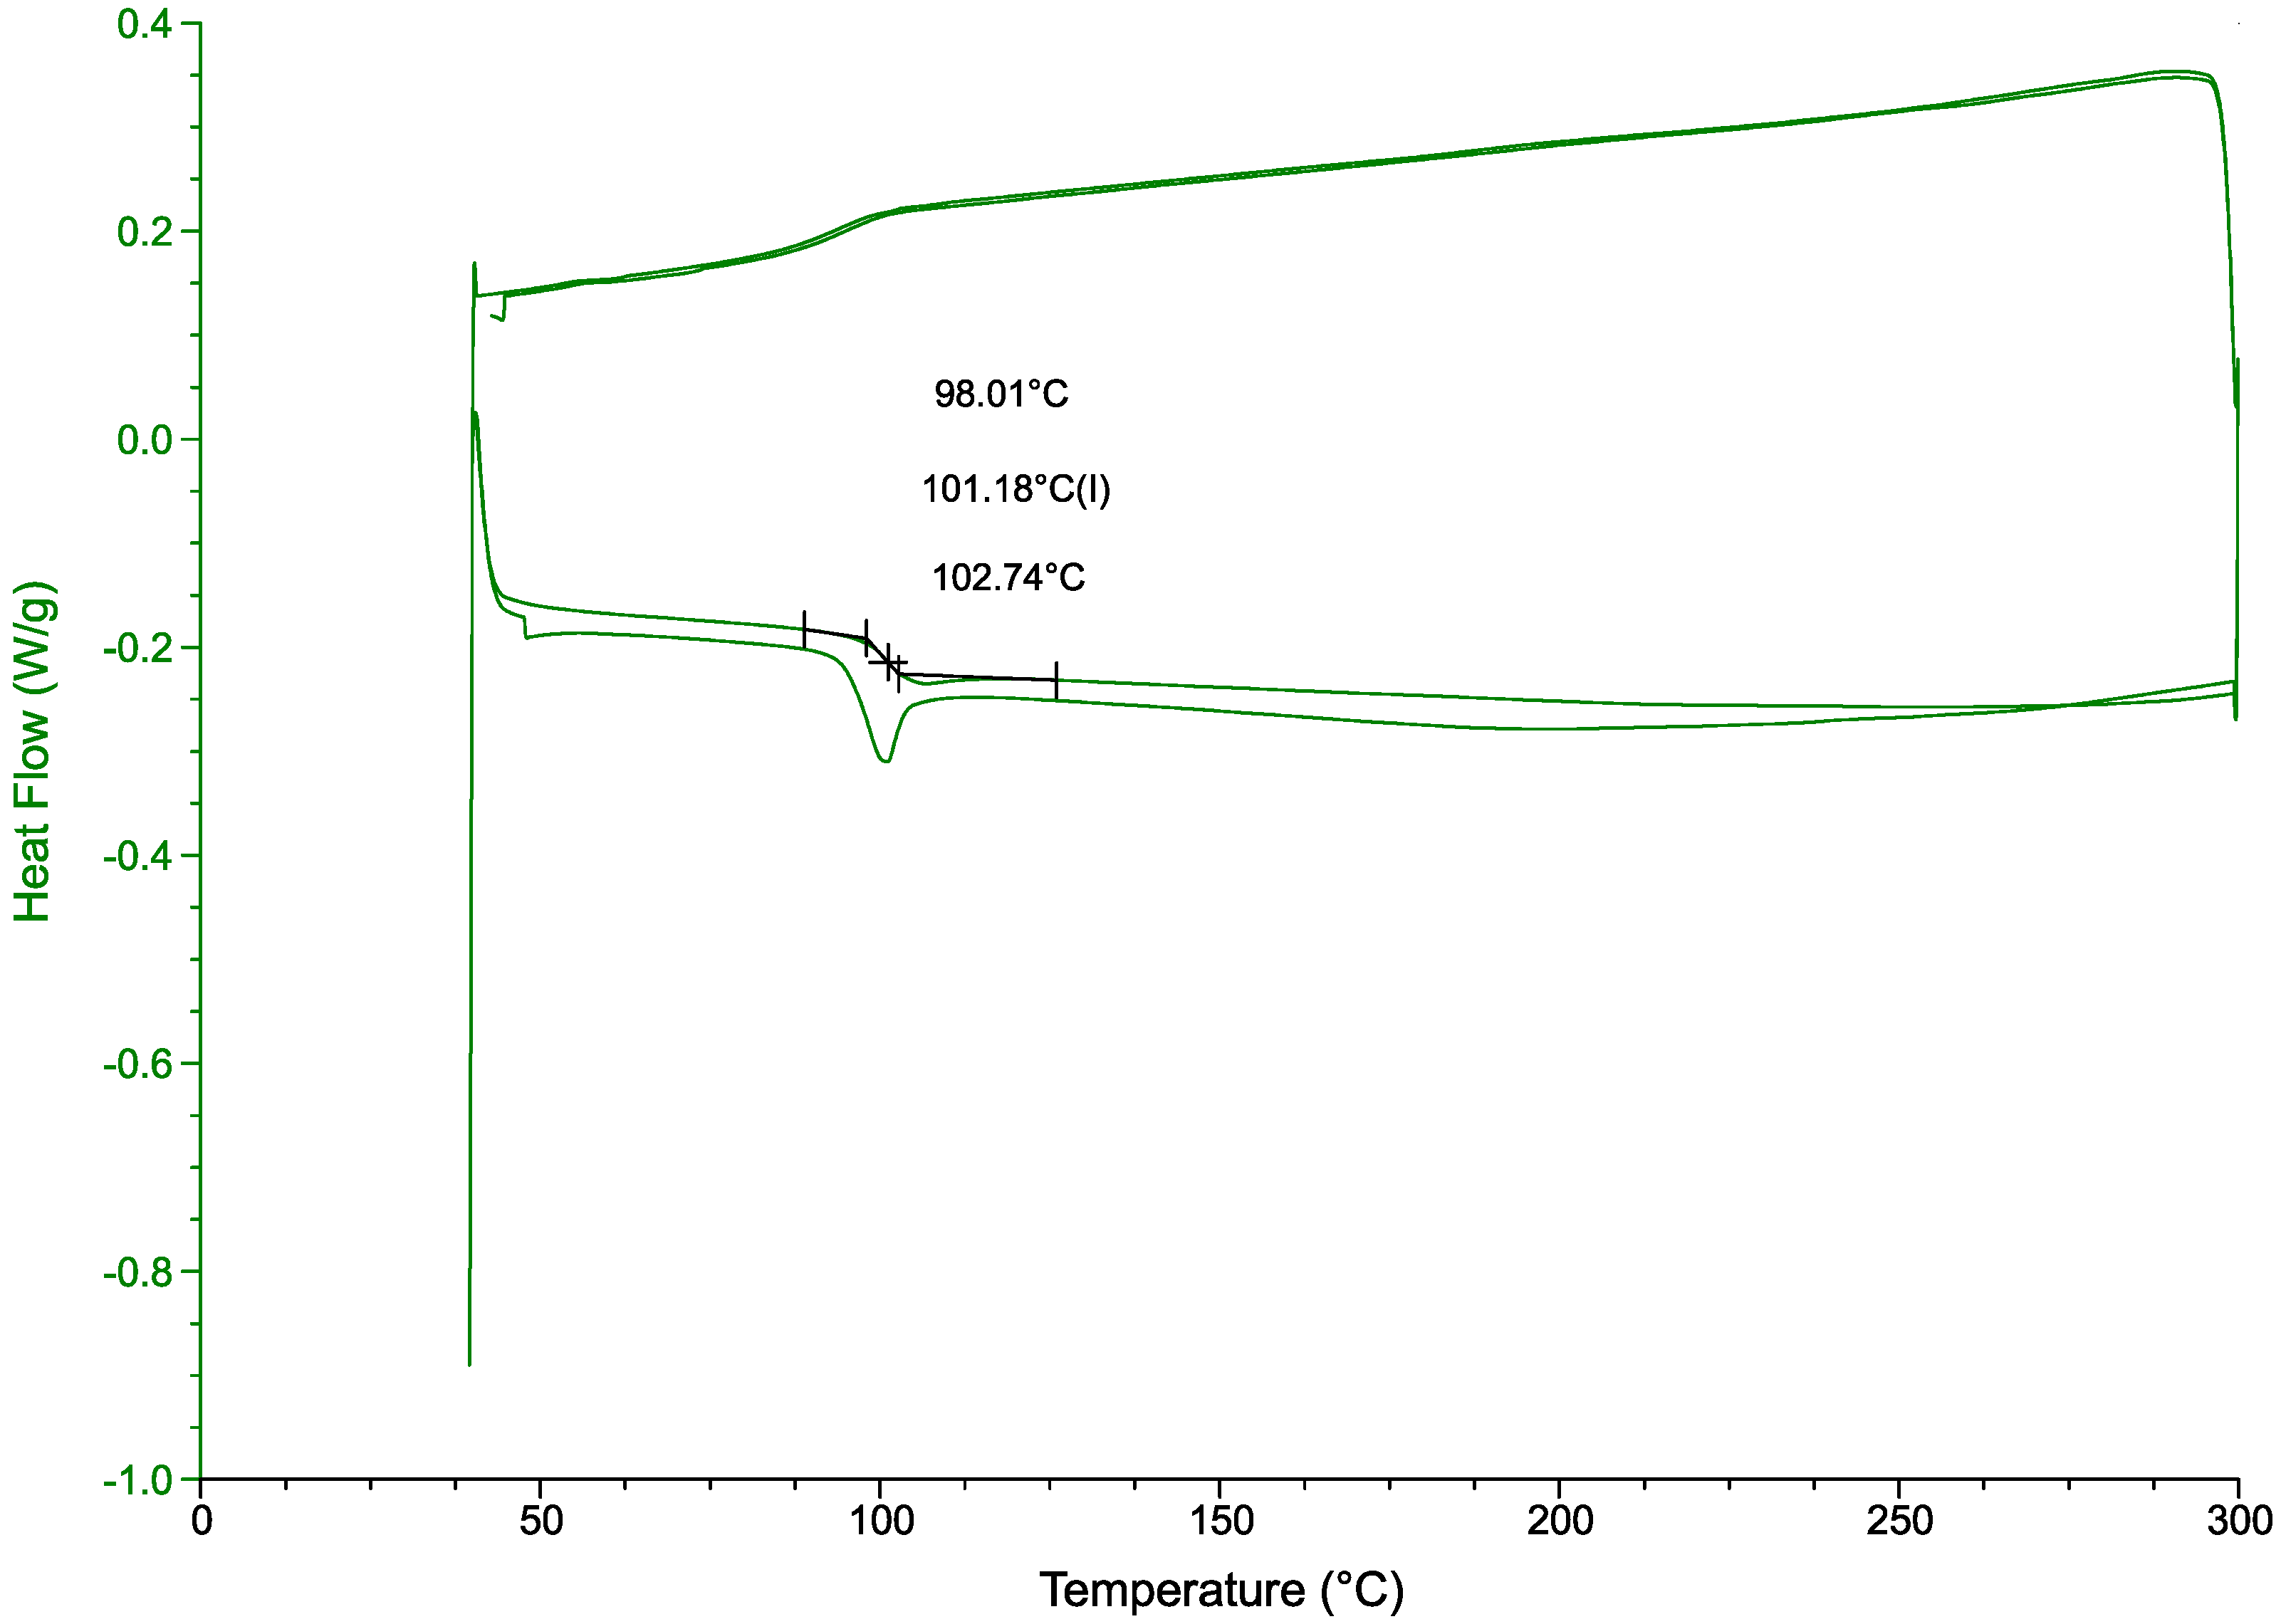
A DSC analysis (
Figure 11) further confirmed the chemical resistance of the polymer to the treatment [
37]. With a glass transition temperature of 101.2 °C fitting within the values for this polymer 85 °C to 102 °C [
38]. Siregar et al. report a HIPS glass transition temperature of 105 °C [
39]. Another study, comparing virgin PS with PS containing clay particles, reports a glass transition temperature of 94 °C for the virgin polymer and 106 °C for the clay-filled polymer. The end-of-life polymer in this study includes fire retardant fillers and colorants, which modify the
, but its value is consistent with those reported in the literature.
2.4. Activation Energy Calculation from TGA Data
There are many kinetic methods to determine the
from TGA data. For this analysis, which compares such energies for the polymer before and after determination, we decided to follow the approach used by Turk et al. [
40].
They assumed that there is only one decomposition mechanism with an activation energy specific to it, and that the polymer decomposition follows the following basic rate equation:
where
For this study we tested two the Coats-Refern and Horowitz–Metzger calculation methods.
2.4.1. Coats–Redfern Method
The Coats–Redfern method assumes a first-order reaction, using the following equation to calculate the activation energy (
):
where
is the fractional mass loss.
T is the temperature in K.
A is the pre-exponential factor.
R is the gas constant (0.0083145 kJ mol−1K−1).
is the activation energy in kJ mol−1.
The activation energy is then obtained by plotting
where the activation energy is obtained from the slope of the plot that corresponds to
.
2.4.2. Horowitz–Metzger Method
The Horowitz–Metzger method obtains the activation energy (
) using the following expression:
where
is the initial weight of the sample.
W is the weight of the sample at temperature T.
is the temperature at which .
.
R is the gas constant (0.0083145 kJ mol−1K−1).
is the activation energy in kJ mol−1.
Again the activation energy is obtained by plotting
where the activation energy is obtained from the slope of the linear plot that is given by
.
The results obtained in this initial thermoanalytical study are consistent with the results found in the literature for thermoplastics of numbers ranging from about 50 kJ mol
−1 to 150 kJ mol
−1 [
40,
41,
42]. As expected, the Coats–Redfern method yields lower values. The Horowitz–Metzger method gives higher values but more variability (
Table 4). Despite the theoretical suitability of this method to analyze polymers, the arbitrary temperature selection might be a cause of imprecision when studying the decomposition of additivated polymers [
40,
41,
42].
Unfortunately, these initial results did not provide any clear information in relation to the debrominated polymer, brominated polymer, or pure polystyrene. It is possible that more precise studies on the different steps of the decomposition together with methods that study more advanced reaction orders could provide better insights into the process.
2.5. Diffusion Calculations
Due to the nature of the process studied, we considered that solvent–polymer diffusion is the main limitation for the debromination; in this case, the ethylene glycol/triethylene glycol into the HIPS/PS polymeric matrix [
20,
43]. Diffusion is a process primarily controlled by temperature, with an activation energy of 71 kJ mol
−1, followed by the chemical nature of the diffusing species, and the diffusion matrix. Once the polymer reaches the glass transition temperature, diffusion is mostly defined by Fick’s law. There are several models and theories that characterize solvent diffusion in polymers. The model of Petit et al. [
44] considers diffusion in both polymeric solutions and gels. Since the treatment temperatures in this work exceed the glass transition and the solvent is absorbed by the polymer, we assume it behaves as a gel, and for this reason we have adopted their model. The model shows that the solvent diffusivity correlates with the jump frequency (
):
where
= frequency pre-factor.
= height of the potential barrier (in J).
= Boltzmann constant (1.38 × 10⁻²³ J K−1).
= temperature in kelvin.
D = diffusion coefficient.
= pre-factor for the concentration term.
c = polymer concentration.
= parameter depending on polymer concentration.
First, we calculate the rate constant
k with the equation and data from our statistical model. We tested 190 °C because of the excellent debromination performance on the filaments at this temperature. Also, we assumed EG as the sole solvent for the modeling and an ideal polymer shape of 1 mm
2 and 2 mm thickness.
where
= 0.15.
= 71,000 J/mol.
T = 463.15 K.
Substituting the values into the equation gives
Then, we obtain the frequency pre-factor
A from the Arrhenius equation:
Rearranging the equation to solve for
A:
where
To improve the accuracy of our results we assume that the debromination ratio is equal to the diffusion into the sample. To simplify the model, we assume that the reaction between the alkali and the fire retardant is instantaneous and there are no other limitations.
First, the debromination percentage is normalized to represent the jump frequency
k. Then, the potential barrier height
is derived from the Arrhenius equation:
Rearranging for
:
where
: Potential barrier height (joules).
: Boltzmann constant ().
T: Temperature in kelvin ().
k: Normalized jump frequency.
: Frequency pre-factor ().
Once the mathematical frame for the calculations is defined, we use a python program to run all our samples to calculate the jump frequency, the potential barrier height, and the diffusion coefficient (
Table 5). For such calculations we had to estimate some parameters, such as the pre-factor for the concentration term (
=
), the polymer concentration (
c = 1 (dimensionless)), a nd the model parameter for the polymer concentration (
= 0.5). Future work can explore different parameters and define which ones best fit the experimental data.
3. Materials and Methods
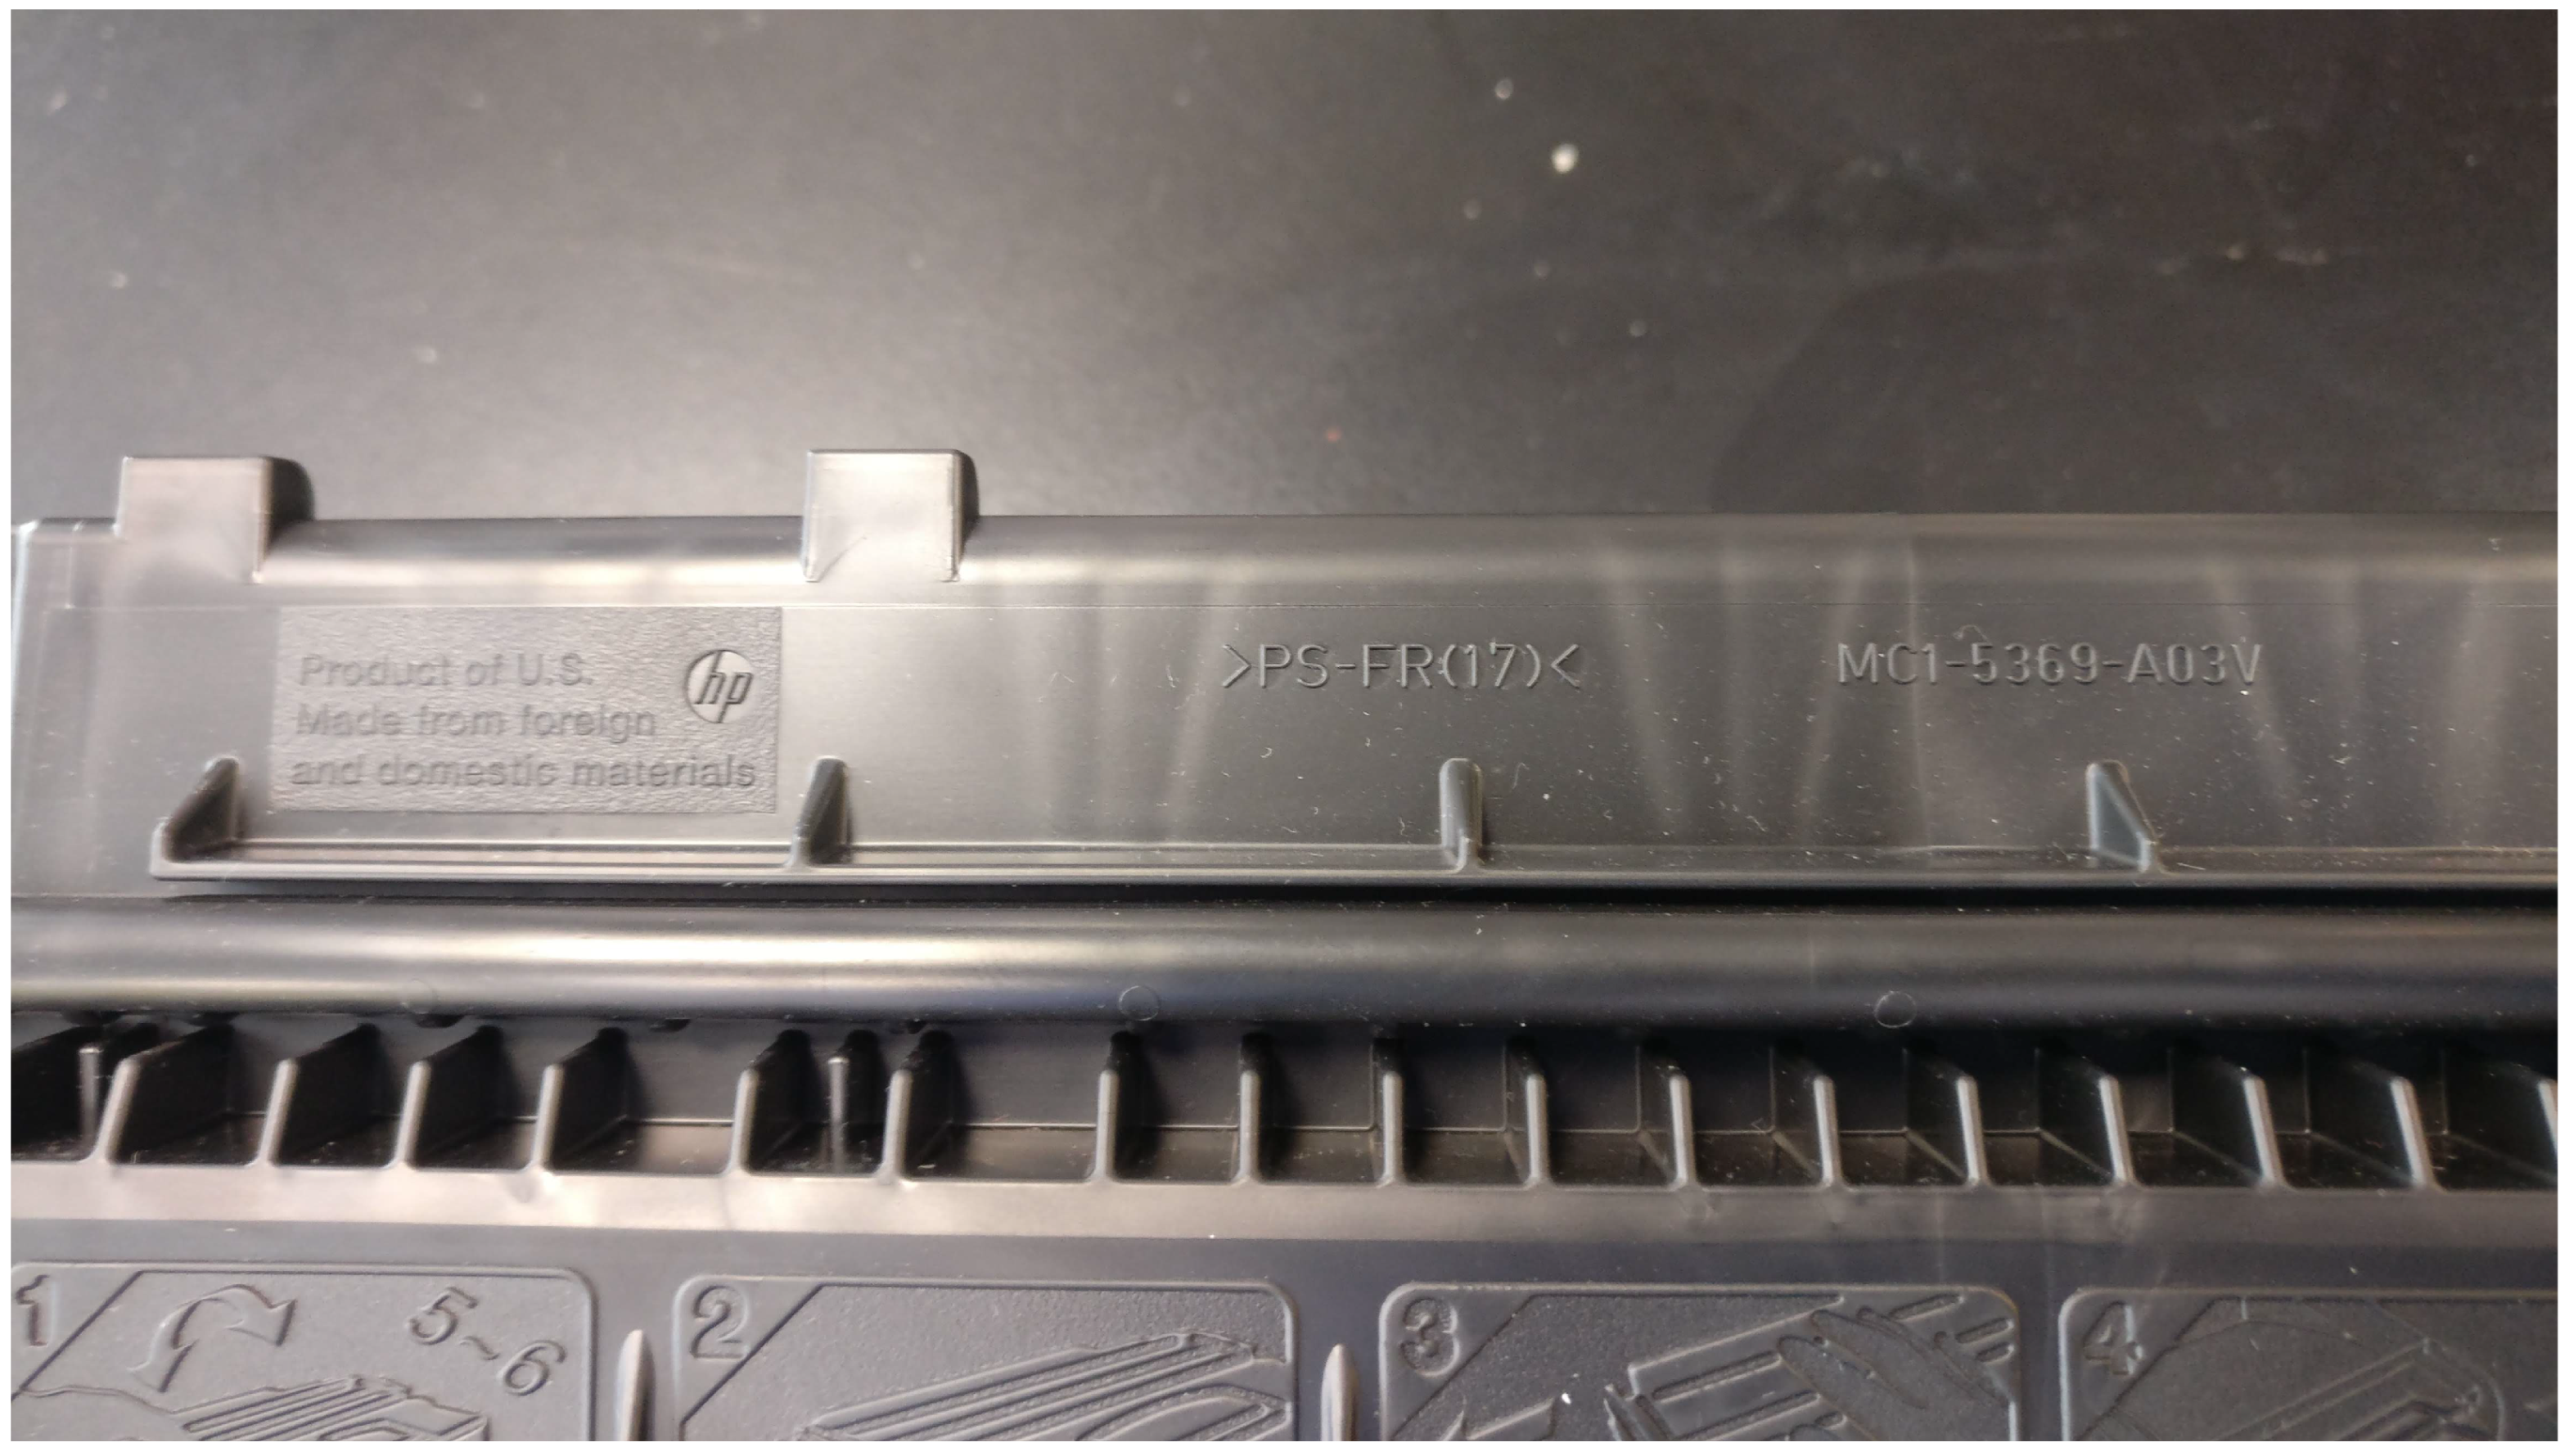
3.1. Brominated PS/HIPS
PS and HIPS with brominated fire retardant additives from electronic waste recovered at Polytechnique Montreal were used. We classified the pieces and labeled them regarding resin and fire retardant additives. Most of the HIPS came from used printer toner manufactured by Hewlett Packard (Montreal, QC, Canada). The pure polystyrene used as the reference was bought from Sigma Aldrich and the virgin HIPS was provided by Lavergne Group Inc. (Montreal, QC, Canada).
3.2. Analytical Methods
An EDXRF Epsylon4 from Malvern Panalytical (Almelo, The Netherlands) and a Brucker S1 TITAN handheld (Billerica, MA, USA) XRF determined the bromine content in the samples and in the solvent. A PerkinElmer Spectrum 65 FTIR, (Perkin Elmer: Waltham, MA, USA) evaluated the samples before and after the reaction to determine if the polymer structure was altered during the experiment by observing changes in the absorbance peaks. The wave numbers ranged from 500 cm−1 to 4000 cm−1, with a measurement interval of 2 cm−1 and 4 accumulations. A TGA Q500 V6.7 (TA Instruments, 159 Lukens Dr, New Castle, DE 19720, USA) was used for the thermogravimetrical analysis under a nitrogen atmosphere. The temperature ramp for the analysis was 30 °C min−1 up to 150 °C, followed by a 5 min hold to stabilize the oven temperature, then 5 °C min−1 until 650 °C, followed by a final ramp of 10 °C min−1 up to 800 °C. Once the temperature reached 800 °C, the instrument substituted the nitrogen for air to decompose the char and recover any remaining minerals. The glass transition properties were studied using a DSC Q20 from TA Instruments (159 Lukens Dr, New Castle, DE 19720, USA).
3.3. Experimental Design
Initially, the end-of-life brominated high-impact polystyrene was recovered from the local electronic waste collection system. This polymeric waste was sorted and separated according to resin and coding (
Figure 12).
We measured the Br content with the XRF instruments and characterized the sample with an FTIR, TGA, and DSC to ensure that the chemical characteristics corresponded with the manufacturer code and to detect possible impurities or cross-contamination. Once the polymer was cataloged, it was dried and stored.
The reaction medium consisted of either ethylene glycol (EG) or triethylene glycol (TEG), with either sodium hydroxide or potassium hydroxide as the debromination solute (extractant: 0.5 M to 2 M). The reaction was carried out in stirring flasks with temperature control and a reflux column. On one occasion we coupled the flask to an on-line mass spectrometer. Together with the solvent and extractant, the screening experimental design comprised reaction time (5 min, 4 h, 8 h, 12 h, and 24 h), temperature (160 °C to 230 °C), agitation (with or without), and pellet size to explore the prominent factors that impacted reaction rates and estimate process efficacy. We assumed that the Br was evenly distributed throughout. Achieving the 230 °C set temperature was problematic due to heat losses. TEG has a higher boiling point than ethylene glycol, so most of the experiments were conducted using it, but an equal number of experiments were conducted with NaOH and KOH.
To maximize signal-to-noise requires extracting from 20% to 80% of the Br [
24], but in as little as 5 min,
of the Br left the polymer matrix. Because the extraction rates in the pellets were much slower, internal diffusion through the matrix was the rate limiting step.
The objective of the work was to maintain the chemical integrity, so that the polymer could be mechanically recycled after the treatment. However, all the conditions applied to debrominate the samples are well know aging factors [
45]. At the end of each test, the sample was dried for at least 8 h at 40 °C and then analyzed to determine its bromine content and its chemical integrity with TGA, DSC, and FTIR.
The primary variable is the percent extraction—conversion—of Br (not brominated compounds as the XRF only detects elements) (
Table 2). The XRF recorded the % Br before the test and after and we also analyzed the liquid phase after each test to close a mass balance.
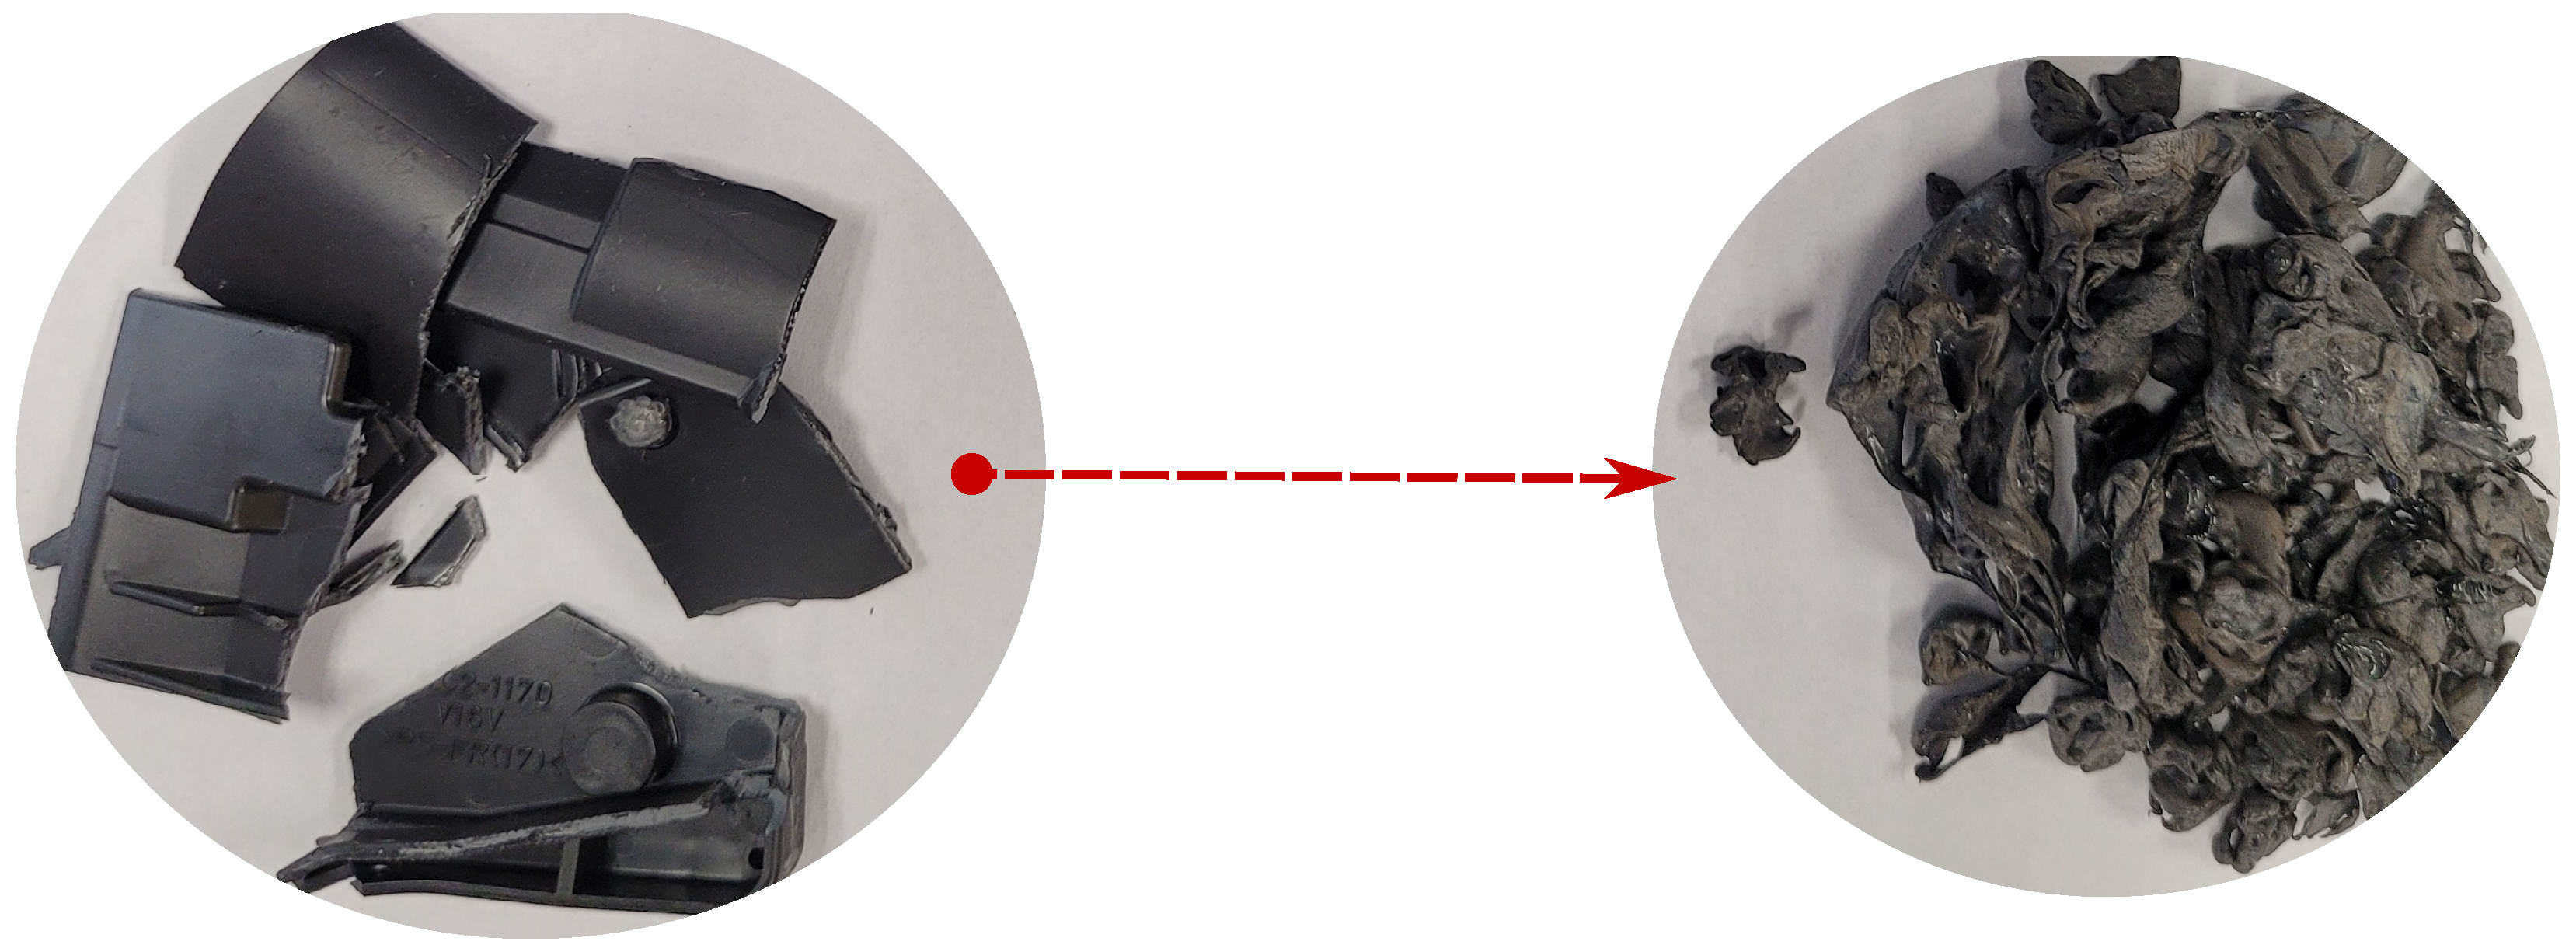
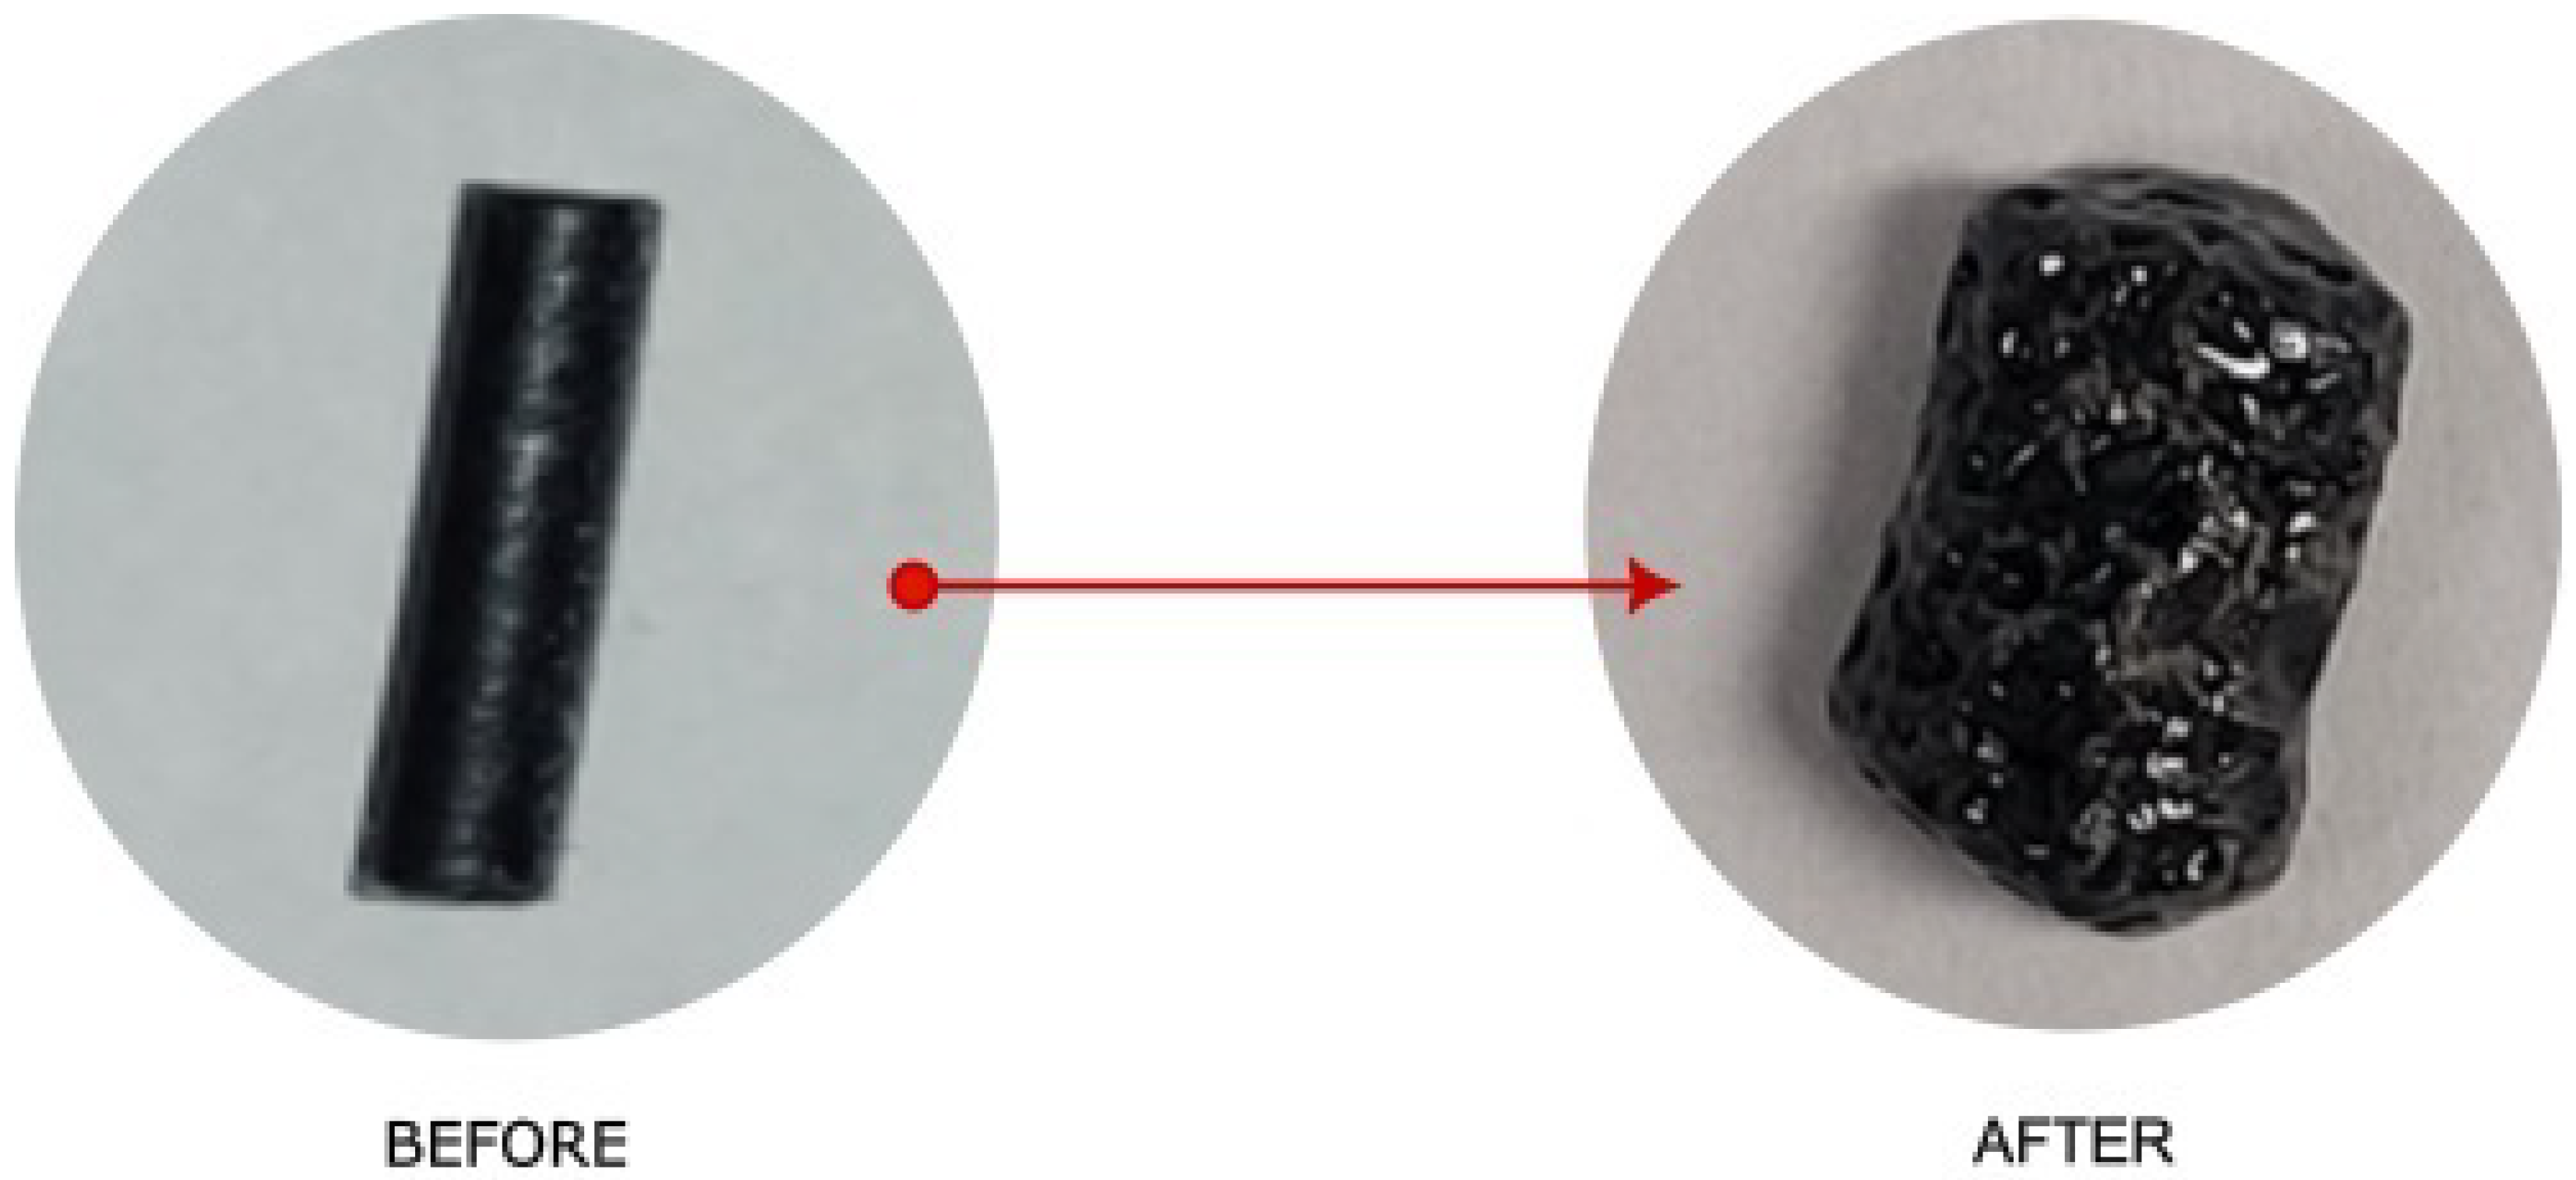
Pellet morphology turned out to be the factor that had the greatest impact on the extraction rate; we tested both pellets of 60 mm (
Figure 13) and fibers that were 5 mm long and as low as 60 μm in diameter (
Figure 14).
All tests with filaments were conducted with 25 mm of solvent; even at 5 min, conversion exceeded 99%. The use of KOH versus NaOH and TEG versus EG was also varied but because the conversion was so fast, the tests were incapable of differentiating between the contributions of these factors. The final factor was the 4 levels of stirring rate used: 400 rpm, 300 rpm, 100 rpm, and no stirring. Seven tests were completed with 1 g of HIPS and 50 mL of solvent, while 4 tests were conducted with 25 g of HIPS and either 100 mL or 500 mL of solvent. Interestingly, at high temperature with no stirring the solvent/caustic extracted more than 90% of the Br. In the tests with 25 g or 100 g of HIPS, conversion was lower than expected and this was likely due to the agglomerates formed during the test, which would introduce an external mass transfer resistance.
4. Conclusions
A solvothermal treatment removed more than 90% of bromine from commercial WEEE HIPS: °C, KOH or NaOH, and h for bulky pieces and min for filaments. High-boiling-point solvents, like ethylene glycol or triethylene glycol, dissolve the alkali and operate at temperatures high enough to accelerate the kinetics. A drawback of this treatment is the apparent damage to the polybutadiene fraction of the HIPS, leaving polystyrene polymer. The chemical properties of this dibrominated HIPS remain consistent with the virgin PS, as confirmed with DSC, TGA, and FTIR measurements. The treatment also partially removes any Sb2O3, which is a synergistic compound added with the brominated fire retardants; this compound is recovered with the solvent.
The efficacy of the treatment is limited by the solvent diffusion and thus the temperature: the debromination reaction rate is much greater above 200 °C (about two times greater than the glass transition temperature), but the limitation is the solvent volatility, which could be moderated by operating at a higher pressure. However, the upper limit on temperature is the melting point of PS, at 270 °C. Due to the nature of polymers, the transition phase does not occur at one temperature but is instead progressive. Logically, operating as close as possible to the melting point is optimal as it maximizes the debromination kinetics. Another limitation encountered is that when treating more than 10 g of polymer, ball-shaped agglomerates form, which reduces the debromination rate as the diffusion path to the solution is longer. Polymer filaments and small pellets debrominate in a matter of minutes rather than hours. The difference between NaOH and KOH is statistically insignificant but a more extensive series of tests is required to confirm this finding. With respect to safety, KOH reacts to form KBr, which is less toxic than NaBr.
The screening design used in this work considered many factors like temperature, polymer morphology, solvent, solute, and time. A full-factorial statistical design would be required to better characterize how each factor affects the debromination rate. However, here, with the screening design, a kinetic model identified the major factors that limit reaction rates. The critical factor for scale-up will be to maximize the surface area of the polymer matrix to the solvent and alkali. Bulk samples take hours to treat versus minutes for filaments. Furthermore, ensuring an adequate mixing between the solvent and polymer will be the second most critical parameter, particularly to avoid any agglomeration that will reduce the reaction rates.


