Article

Understanding Demographic and Behavioral Determinants of Engagement in Plastic Tableware Reduction: Behavior, Support, and Price Sensitivity

1
Graduate Institute of Earth Science, Chinese Culture University, Taipei 11114, Taiwan
2
Department of Geography, Chinese Culture University, Taipei 11114, Taiwan
*
Author to whom correspondence should be addressed.
Recycling 2025, 10(3), 103; https://doi.org/10.3390/recycling10030103
Submission received: 3 March 2025 / Revised: 2 April 2025 / Accepted: 14 May 2025 / Published: 20 May 2025

Abstract

:
Plastic waste reduction has become a global priority, with consumer engagement playing a crucial role in the success of sustainability initiatives. This study examines the demographic and behavioral determinants of consumer engagement in plastic tableware reduction. Using survey data from Hong Kong residents and a Multivariate Analysis of Variance (MANOVA) approach, this study analyzes how age, gender, education, income, housing type, order frequency, opt-out effectiveness, and their interactions influence the four dimensions of engagement, namely plastic tableware opt-out behavior, support for government policies, support for plastic-free restaurants, and price sensitivity. The results indicate that age significantly affects plastic tableware reduction engagement, with order frequency and opt-out effectiveness moderating the effects of age and education. The study contributes to the literature by providing empirical insights into consumer-driven sustainability efforts and the role of behavioral factors in shaping engagement in plastic waste reduction. These findings offer valuable implications for policymakers and businesses promoting sustainable consumption practices.

1. Introduction

Plastic waste pollution has become one of the most pressing global environmental challenges, with single-use plastic products contributing significantly to ecosystem degradation, marine pollution, and public health risks [1]. It is estimated that more than 380 million tons of plastic are produced annually, of which 50% is designed for single-use purposes [2]. Much of this plastic waste ends up in the ocean, threatening marine biodiversity and disrupting fragile ecosystems [3].
Disposable plastic tableware, commonly used in food takeout and delivery services, accounts for a substantial share of plastic pollution. The global food delivery market has surged in recent years, with an estimated increase from USD 130.2 billion in 2022 to USD 223.7 billion in 2027 [4]. The increasing use of disposable plastic tableware highlights the urgent need for effective reduction strategies, including policy-driven interventions and consumer engagement efforts.
Governments and environmental organizations worldwide have implemented various policies to mitigate plastic waste. For example, the European Union’s directive on single-use plastics aims to ban disposable plastic items such as cutlery and plates [5]. China has also enacted strict regulations to phase out single-use plastics [6]. However, plastic tableware use in food takeout and delivery services remains prevalent due to consumer convenience preferences, inconsistent policy enforcement, and business adaptation challenges [7].
Hong Kong generates a large amount of single-use plastic waste, with an estimated 200 tonnes of discarded plastic tableware sent to landfills every day [8]. This amounts to the disposal of approximately 14.6 billion pieces of plastic cutlery annually, or about 1940 pieces per person per year [8]. In response to this challenge, the government launched the “Plastic-Free Takeaway, Use Reusable Tableware” Campaign and proposed legislation to ban single-use plastic utensils [9].
While policy interventions are essential for driving large-scale plastic tableware reduction, consumer participation is critical to success. Consumer engagement in plastic tableware reduction extends beyond compliance with regulations; it involves behavioral changes such as actively opting out of plastic tableware, attitudinal support for government policy, preference for plastic-free businesses, and price sensitivity for sustainable alternatives [10]. Despite increasing public awareness of environmental sustainability, engagement levels remain inconsistent, with many consumers continuing to use disposable plastic tableware [11].
Research on plastic tableware reduction has identified a wide range of predictors of consumer engagement [12]. While some studies focus on psychological and behavioral factors [13], other research has emphasized the role of demographics, such as gender, age, and education, from a broader perspective [14]. There are also some studies investigating the role of regulatory frameworks, corporate initiatives, and economic costs in shaping pro-environmental behaviors [15,16,17]. The existing literature has highlighted the complexity of engagement in plastic tableware reduction, and no single factor or perspective is sufficient to understand consumer engagement.
Despite increasing research on sustainability engagement, limited studies have examined the influences of demographic characteristics, behavioral factors, and their interactions. It is noted that behavioral factors may not only directly influence engagement but may also serve as moderators [18]. Identifying the determinants of engagement and understanding their complex interactions are essential for designing effective strategies that encourage broader participation in plastic tableware reduction efforts.
This study aims to fill this research gap by investigating how demographic and behavioral factors affect consumer engagement in plastic tableware reduction. Specifically, the study addresses the following research questions:
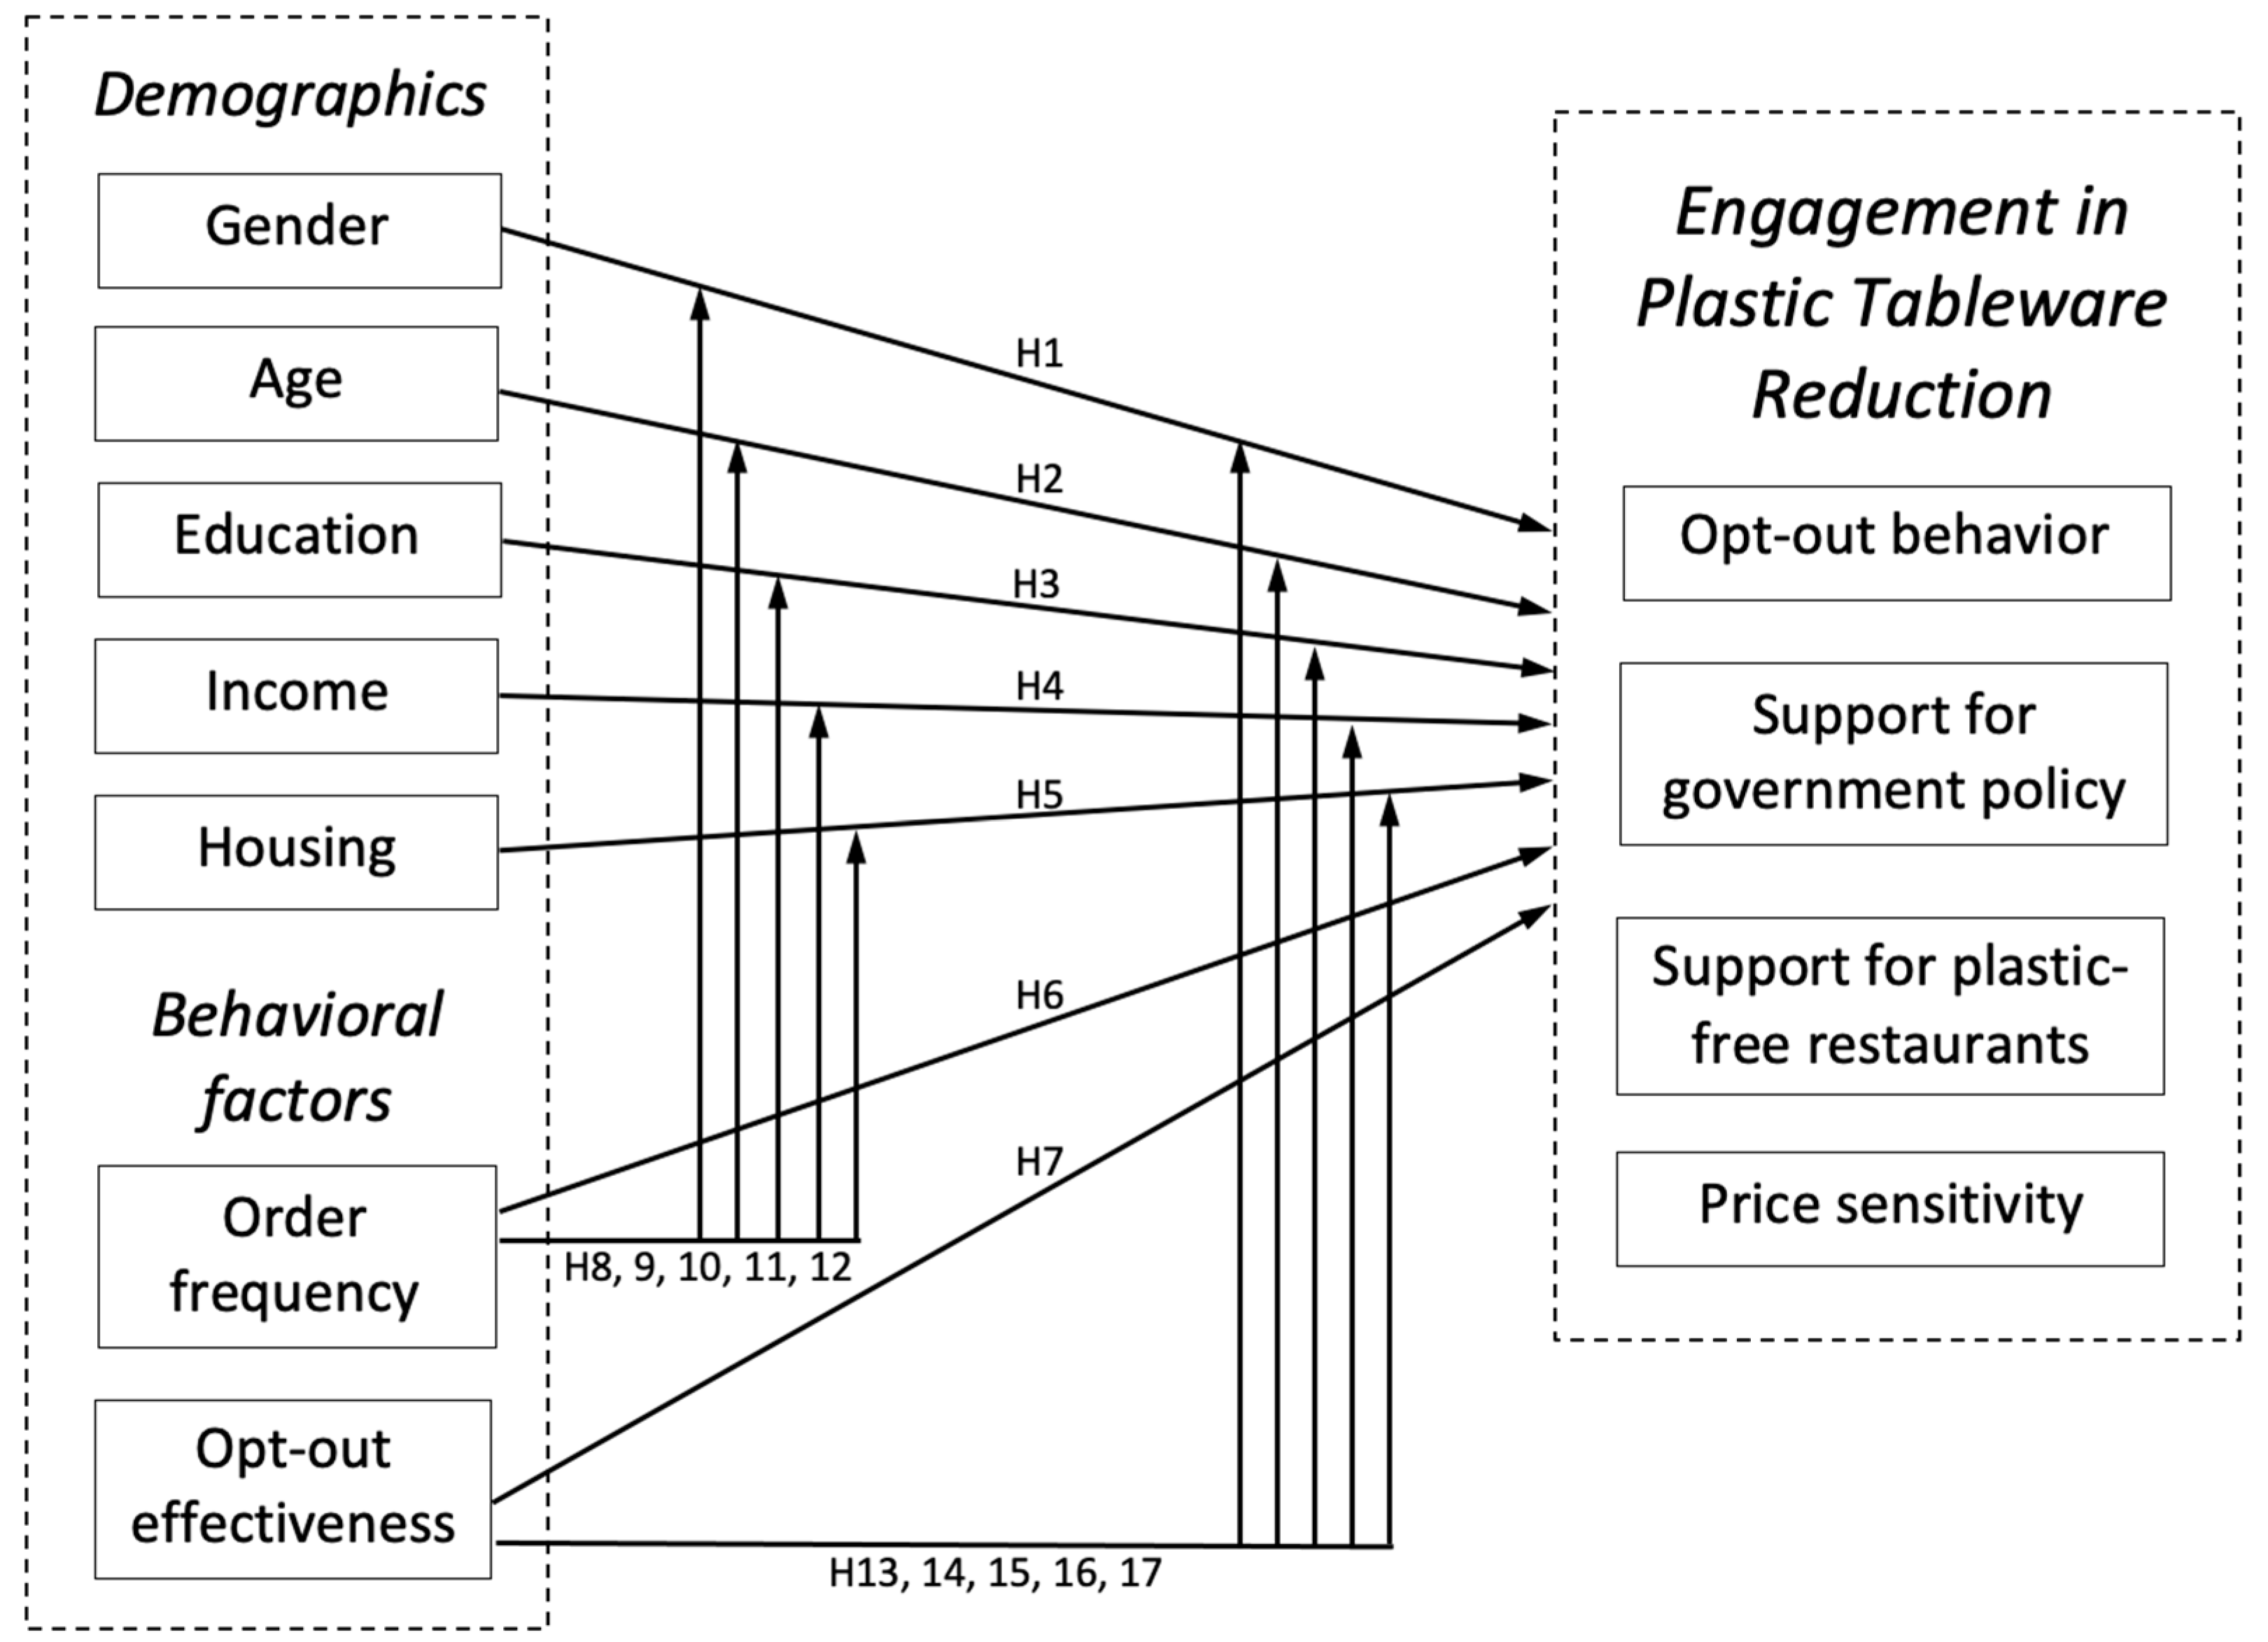
  • Do demographic factors (i.e., age, gender, income, education, housing type) influence consumer engagement in plastic tableware reduction?
  • Do behavioral factors (i.e., order frequency, opt-out effectiveness) influence consumer engagement in plastic tableware reduction?
  • Do behavioral factors (i.e., order frequency, opt-out effectiveness) moderate the relationship between demographics and engagement in plastic tableware reduction?
Hong Kong, a city with a particularly dense food delivery culture and persistent challenges in plastic waste management, represents a perfect venue to examine how demographic characteristics and behavioral experiences jointly shape consumer engagement in plastic tableware reduction. The city’s recent policy actions, high levels of urban consumption, and growing public awareness of sustainability make it a relevant and insightful setting for developing evidence-based strategies to enhance plastic tableware reduction.
This study supplements the sustainability and consumer behavior literature by providing a novel understanding of the complexity of plastic tableware reduction behaviors. Furthermore, the findings offer practical recommendations for policymakers and businesses to develop targeted interventions that enhance consumer engagement in plastic-free initiatives.
The remainder of this paper is structured as follows: Section 2 provides a literature review of plastic tableware reduction engagement that evaluates theoretical perspectives and empirical studies on the role of demographics and behavioral factors in shaping pro-environmental behavior. Section 3 outlines the research methodology, including data collection, measurement instruments, and statistical analysis. Section 4 systematically presents the study findings that detail the relationships between demographic and behavioral factors and consumer engagement outcomes. Section 5 discusses the meanings of the findings, highlights limitations, and offers recommendations for future research and policy development. Section 6 concludes the study.

2. Literature Review

2.1. Consumer Engagement in Plastic Tableware Reduction

Consumer engagement is defined as the level of an individual’s cognitive, emotional, and behavioral investment in an activity or cause [19]. The concept has evolved from traditional models of consumer participation (e.g., brand loyalty, product co-creation, etc.) to broader engagement in pro-social and pro-environmental behaviors [19]. Consumer engagement has been extensively studied across multiple disciplines, including marketing, psychology, and pro-environmental behavior research.
Consumer engagement represents a multidimensional construct encompassing behavioral actions, attitudinal support, and economic commitments toward a specific issue [20]. In the context of sustainability and pro-environmental behaviors, consumer engagement refers to active participation in environmentally friendly practices, including waste reduction, sustainable consumption, and support for green policies [21].
For plastic tableware reduction, consumer engagement involves a range of behaviors that contribute to reducing the consumption of disposable plastic tableware. This study conceptualizes consumer engagement in plastic tableware reduction as consisting of four dimensions:
  • Plastic tableware opt-out behavior, referring to the active decision to refuse single-use plastic tableware when ordering food.
  • Support for government policy, reflecting individuals’ attitudes toward regulations restricting or banning disposable plastic tableware [15].
  • Support for plastic-free restaurants, indicating consumer preference for restaurants and food vendors that voluntarily eliminate plastic tableware from their orders [21].
  • Price sensitivity, capturing the extent to which individuals are financially motivated to support plastic-free takeaways [22].
These four dimensions align with existing sustainability engagement frameworks, emphasizing that consumer engagement goes beyond purchasing decisions to include policy advocacy, behavioral choices, and financial investment [23].
Previous studies on pro-environmental behaviors have indicated that consumer engagement is influenced by a combination of intrinsic and extrinsic factors [24,25]. Recent studies suggest that the engagement is context-dependent, varying across different environmental issues such as climate change, recycling, and plastic tableware reduction [26].

2.2. Demographic Factors Influencing Plastic Tableware Reduction Engagement

Demographic factors are crucial in shaping individuals’ engagement in various pro-environmental behaviors, including waste reduction [25]. Age, gender, education, income, and housing type have been extensively studied as predictors of pro-environmental behaviors [27,28].
Gender differences in environmental engagement have been widely documented, with studies consistently finding that women are more likely than men to engage in pro-environmental behaviors [29]. However, a few studies reported that men display higher pro-environmental behaviors than females [30]. In the context of plastic tableware reduction, women have been found to express more substantial environmental concerns and are more favorable to the plastic bag levy [31].
Age has been found to influence pro-environmental behavior, but the existing literature has shown that different age groups perform different pro-environmental behaviors to various degrees [32]. Some studies reported that middle-aged consumers perform a higher level of pro-environmental behavior than young and older consumers [30]. Still, others indicated that different pro-environmental behaviors exist in various age groups. Eco-friendly clothing and green transportation were more common in younger individuals, while older people were active in recycling and conservation [33]. Interestingly, a few authors indicated no significant relationship between age and pro-environmental behavior [34].
Education is also a key determinant of sustainability engagement. Higher education levels are often associated with greater environmental awareness and knowledge, leading to increased engagement in waste reduction [35]. Although education promotes environmental consciousness, it does not always translate into behavioral engagement in sustainable alternatives [36].
Income has been found to be a significant predictor of pro-environmental purchasing decisions, as higher-income individuals have greater financial flexibility to choose sustainable products and services [37]. However, a city comparison study reported that income is correlated with the recycling rate in Barcelona, but such a relationship was not found in London [38]. Environmental attitudes are suggested to outweigh financial considerations in determining sustainability engagement [26].
Housing type may also influence pro-environmental behaviors. Individuals living in public housing may have different access to environmental resources and sustainability initiatives than those living in private housing [39]. Some studies suggest that individuals in private housing may have more opportunities to adopt pro-environmental behaviors due to greater autonomy over consumption choices and better waste management facilities [40]. Nevertheless, a few studies reported no significant relationship between housing types and pro-environmental behavior [41].
Based on the above insights, five sets of hypotheses are formulated:
  • H1(a; b; c; d; e): Gender has a significant effect on (a/overall engagement in plastic tableware reduction; b/opt-out behavior; c/support for government plastic opt-out policy; d/support for plastic-free restaurants; e/price sensitivity of plastic-free takeaways).
  • H2(a; b; c; d; e): Age has a significant effect on (a/overall engagement in plastic tableware reduction; b/opt-out behavior; c/support for government plastic opt-out policy; d/support for plastic-free restaurants; e/price sensitivity of plastic-free takeaways).
  • H3(a; b; c; d; e): Educational has a significant effect on (a/overall engagement in plastic tableware reduction; b/opt-out behavior; c/support for government plastic opt-out policy; d/support for plastic-free restaurants; e/price sensitivity of plastic-free takeaways).
  • H4(a; b; c; d; e): Income has a significant effect on (a/overall engagement in plastic tableware reduction; b/opt-out behavior; c/support for government plastic opt-out policy; d/support for plastic-free restaurants; e/price sensitivity of plastic-free takeaways).
  • H5(a; b; c; d; e): Housing type has a significant effect on (a/overall engagement in plastic tableware reduction; b/opt-out behavior; c/support for government plastic opt-out policy; d/support for plastic-free restaurants; e/price sensitivity of plastic-free takeaways).

2.3. Behavioral Factors Influencing Plastic Tableware Reduction Engagement

Beyond demographics, behavioral factors such as order frequency and past opt-out effectiveness influence consumer engagement in plastic tableware reduction. Research on habitual behaviors suggests that individuals with high-frequency consumption patterns may develop routines that facilitate or hinder sustainability engagement [42]. In the case of food delivery, individuals who frequently order takeout may be more accustomed to default options that include plastic tableware, making them less likely to opt out unless strong external incentives or habit disruptions occur.
Opt-out effectiveness, or the extent to which consumers’ choices to forgo plastic tableware are honored, plays a critical role in shaping future behavior. According to reinforcement theory, individuals are more likely to repeat behaviors that yield positive outcomes [43]. When consumers successfully opt out of plastic tableware and see their preferences respected, they may be more inclined to continue engaging in plastic tableware reduction behaviors. Conversely, repeated failures to have opt-out requests honored may lead to disengagement and skepticism toward sustainability initiatives [44].
Based on the above insights, two sets of hypotheses are formulated:
  • H6(a; b; c; d; e): Order frequency has a significant effect on (a/overall engagement in plastic tableware reduction; b/opt-out behavior; c/support for government plastic opt-out policy; d/support for plastic-free restaurants; e/price sensitivity of plastic-free takeaways).
  • H7(a; b; c; d; e): Opt-out effectiveness has a significant effect on (a/overall engagement in plastic tableware reduction; b/opt-out behavior; c/support for government plastic opt-out policy; d/support for plastic-free restaurants; e/price sensitivity of plastic-free takeaways).

2.4. Moderating Effects of Order Frequency and Opt-Out Effectiveness

Recent studies emphasize the importance of understanding the complexity of pro-environmental behaviors, particularly how the interactions of intrinsic and extrinsic factors influence environmental engagement [18]. In this regard, order frequency may serve as a moderator that influences how demographic factors shape plastic tableware reduction engagement. For instance, younger individuals who frequently place food orders may be less inclined to engage in waste reduction due to convenience [45]. In contrast, older individuals with a high order frequency may be more aware of the cumulative environmental impact of their consumption choices [32].
Based on the above insights, five sets of hypotheses on the moderation role of order frequency are proposed:
  • H8(a; b; c; d; e): Order frequency moderates the effect of gender on (a/overall engagement in plastic tableware reduction; b/opt-out behavior; c/support for government plastic opt-out policy; d/support for plastic-free restaurants; e/price sensitivity of plastic-free takeaways).
  • H9(a; b; c; d; e): Order frequency moderates the effect of age on (a/overall engagement in plastic tableware reduction; b/opt-out behavior; c/support for government plastic opt-out policy; d/support for plastic-free restaurants; e/price sensitivity of plastic-free takeaways).
  • H10(a; b; c; d; e): Order frequency moderates the effect of education on (a/overall engagement in plastic tableware reduction; b/opt-out behavior; c/support for government plastic opt-out policy; d/support for plastic-free restaurants; e/price sensitivity of plastic-free takeaways).
  • H11(a; b; c; d; e): Order frequency moderates the effect of income on (a/overall engagement in plastic tableware reduction; b/opt-out behavior; c/support for government plastic opt-out policy; d/support for plastic-free restaurants; e/price sensitivity of plastic-free takeaways).
  • H12(a; b; c; d; e): Order frequency moderates the effect of housing type on (a/overall engagement in plastic tableware reduction; b/opt-out behavior; c/support for government plastic opt-out policy; d/support for plastic-free restaurants; e/price sensitivity of plastic-free takeaways).
Similarly, opt-out effectiveness may reinforce or discourage the relationship between demographics and plastic tableware reduction engagement. For example, consumers are more inclined to engage in pro-environmental actions when they consistently experience successful outcomes [21]. However, even highly motivated individuals may become disengaged from plastic tableware reduction efforts if opt-out effectiveness is low.
Based on the above insights, five sets of hypotheses on the moderation role of opt-out effectiveness are formulated:
  • H13(a; b; c; d; e): Opt-out effectiveness moderates the effect of gender on (a/overall engagement in plastic tableware reduction; b/opt-out behavior; c/support for government plastic opt-out policy; d/support for plastic-free restaurants; e/price sensitivity of plastic-free takeaways).
  • H14(a; b; c; d; e): Opt-out effectiveness moderates the effect of age on (a/overall engagement in plastic tableware reduction; b/opt-out behavior; c/support for government plastic opt-out policy; d/support for plastic-free restaurants; e/price sensitivity of plastic-free takeaways).
  • H15(a; b; c; d; e): Opt-out effectiveness moderates the effect of education on (a/overall engagement in plastic tableware reduction; b/opt-out behavior; c/support for government plastic opt-out policy; d/support for plastic-free restaurants; e/price sensitivity of plastic-free takeaways).
  • H16(a; b; c; d; e): Opt-out effectiveness moderates the effect of income on (a/overall engagement in plastic tableware reduction; b/opt-out behavior; c/support for government plastic opt-out policy; d/support for plastic-free restaurants; e/price sensitivity of plastic-free takeaways).
  • H17(a; b; c; d; e): Opt-out effectiveness moderates the effect of housing type on (a/overall engagement in plastic tableware reduction; b/opt-out behavior; c/support for government plastic opt-out policy; d/support for plastic-free restaurants; e/price sensitivity of plastic-free takeaways).

2.5. Theoretical Framework of This Study

Integrating the insights and hypotheses above, this study develops a multivariate conceptual framework to examine the combined effects of demographic and behavioral influences (Figure 1). Acknowledging the multidimensional nature of engagement, this framework facilitates a new understanding of consumer engagement in plastic tableware reduction.

3. Results

3.1. Profile of the Respondents

The demographic characteristics of the respondents (n = 355) are summarized in Table 1. The sample comprised 119 males (35.5%) and 216 females (64.5%). The age distribution showed that 17.9% of respondents were between 15 and 24 years old, 31.9% were 25–34, 24.5% were 35–44, and 25.7% were 45 years or older. Regarding education level, 14.0% had secondary education or below, 11.3% held a post-secondary diploma or certificate, and the majority (74.6%) had attained college, university, or higher education. Monthly income levels varied, with 18.8% earning less than HKD 9999, 23.9% earning between HKD 10,000–19,999, 29.9% between HKD 20,000–29,999, and 27.5% earning HKD 30,000 or more. Regarding housing type, 42.4% of respondents resided in public housing, while 57.6% lived in private housing or other arrangements.

3.2. ANOVA

Sequential ANOVA was performed to test the influences of individual demographic variables on each dimension of plastic tableware reduction engagement (Table 2). Gender and housing type did not have significant effects on any aspect of engagement in plastic tableware reduction (p > 0.05), indicating that these factors were not strong predictors of individual engagement.
Age significantly affected support for government policies (F = 2.834, p = 0.038) and support for plastic-free restaurants (F = 2.696, p = 0.046). The post hoc test indicated that the age group of 25–34 was less supportive of regulatory measures, and the age group of 35–44 was more likely to order foods from plastic-free restaurants.
Education level exhibited a significant effect on opt-out behavior (F = 8.557, p = 0.000) and support for plastic-free restaurants (F = 4.573, p = 0.011). The post hoc test indicated that individuals with secondary education or lower were less likely to opt out of plastic tableware and order foods from plastic-free restaurants.
Monthly income had a significant effect on opt-out behavior (F = 3.057, p = 0.029). The post hoc test indicated that individuals who earned less than HKD 19,999 monthly were less likely to opt out of plastic tableware than those who earned HKD 20,000 or more. However, income did not significantly impact other engagement dimensions.
Order frequency had a strong effect on multiple aspects of plastic tableware reduction engagement. It significantly influenced opt-out behavior (F = 6.089, p = 0.014), support for government policies (F = 8.743, p = 0.003), and support for plastic-free restaurants (F = 5.321, p = 0.022). The post hoc test indicated that individuals who frequently order food are more likely to opt out of plastic tableware, support the regulatory measures, and order foods from plastic-free restaurants.
Opt-out effectiveness significantly influenced price sensitivity (F = 3.889, p = 0.049), indicating that individuals who have successfully opted out of plastic tableware in past orders are more price-sensitive to plastic-free alternatives. However, opt-out effectiveness did not significantly impact other engagement aspects.
Although the above findings provide insights into how demographic factors shape engagement with plastic tableware reduction initiatives, it is essential to note that conducting multiple ANOVAs increases the risk of Type I error that results in false positives [46], as each test is performed independently on different dependent variables. Given these limitations, Welch’s MANOVA was employed as a more robust statistical approach to assess the multivariate effects of demographic factors while controlling for the potential inflation of Type I error.

3.3. Welch’s MANOVA

Due to violations of variance homogeneity found in Levene’s test, Welch’s MANOVA, which controls for unequal variances, was applied. Because there are a total of 85 hypotheses, Table 3 lists only the significant influences of demographic variables and their interactions on the overall and individual dimensions of plastic tableware reduction engagement. The results of MANOVA of the main effects of demographic variables on overall engagement and the between-subject effects of demographic variables on four dimensions of plastic reduction engagement are listed in Appendix A and Appendix B, respectively.

3.3.1. Influences of Demographic Variables on Plastic Tableware Reduction Engagement

Age had a statistically significant main effect on the overall engagement in plastic tableware reduction (Wilks’ Lambda = 0.925, F = 1.982, p = 0.023, η2 = 0.026). Specifically, age had a significant effect on support for plastic-free restaurants (F = 2.721, p = 0.045, η2 = 0.026). Thus, H2a and H2d are accepted. However, age had no significant impacts on other dimensions of plastic tableware reduction engagement.
Education and opt-out effectiveness did not significantly influence people’s overall engagement in plastic tableware reduction. However, education had a significant effect on opt-out behavior (F = 6.65, p = 0.001, η2 = 0.042). Thus, H3b is accepted. Opt-out effectiveness had a significant effect on price sensitivity (F = 4.712, p = 0.031, η2 = 0.015). Thus, H7e is accepted.
Other demographic factors, i.e., gender, education, income, housing, and ordering frequency, did not significantly influence overall and individual dimensions of people’s engagement in plastic tableware reduction.

3.3.2. Influences of Interactions on Plastic Tableware Reduction Engagement

Age × order frequency showed a significant interaction effect (Wilks’ Lambda = 0.910, F = 2.394, p = 0.005, η2 = 0.031) on the overall engagement in plastic tableware reduction. Thus, H9a is accepted. Specifically, order frequency moderated the influences of age on opt-out behavior (F = 4.380, p = 0.005, η2 = 0.042), and support for plastic-free restaurants (F = 5.122, p = 0.002, η2 = 0.048). Thus, H9b and H9d are accepted.
Age × opt-out effectiveness (Wilks’ Lambda = 0.894, F = 2.848, p = 0.001, η2 = 0.037) showed a significant interaction effect on the overall engagement in plastic tableware reduction. Thus, H14a is accepted. Specifically, opt-out effectiveness moderated the effect of age on opt-out behavior (F = 5.01, p = 0.002, η2 = 0.048) and price sensitivity (F = 3.742, p = 0.012, η2 = 0.036). Thus, H14b and H14e are accepted.
Education × opt-out effectiveness (Wilks’ Lambda = 0.946, F = 2.114, p = 0.033, η2 = 0.028). Thus, H15a is accepted. Specifically, the moderation of opt-out effectiveness mainly worked on the effect of education on opt-out behavior (F = 3.912, p = 0.021, η2 = 0.025). Thus, H15b is accepted.
Although income × order frequency (Wilks’ Lambda = 0.951, F = 1.278, p = 0.226, η2 = 0.017) did not show a significant main effect on the overall engagement in plastic tableware reduction, the interaction significantly affected support for plastic-free restaurants (F = 3.133, p = 0.026, η2 = 0.030). Thus, H11d is accepted.
Other interactions did not significantly influence overall and individual dimensions of people’s engagement in plastic tableware reduction.

4. Discussion

4.1. The Effects of Demographic Determinants on the Engagement in Plastic Tableware Reduction

The results of the between-subject test of MANOVA generally align with ANOVA, but the latter suggested more significant factors than the former. This reflects that MANOVA effectively controls the potential inflation of Type I error caused by sequential ANOVA. Furthermore, MANOVA bundles the four dimensions of engagement into a composite variable that represents the overall measure of engagement. Therefore, the discussion below is primarily based on MANOVA results, while ANOVA results serve as additional insights.

4.1.1. Overall Engagement

This study demonstrates that demographic factors play varying roles in shaping consumer engagement in plastic tableware reduction. Age emerged as a significant predictor (Wilks’ Lambda = 0.925, F = 1.982, p = 0.023, η2 = 0.026), with middle-aged individuals exhibiting higher engagement in opt-out behaviors. This aligns with previous studies suggesting that middle-aged people are likely to adopt pro-environmental behavior [30]. The differences in pro-environmental behavior may be caused by generational disparities in lifestyle [47].
There were significant interaction effects of age × order frequency (Wilks’ Lambda = 0.910, F = 2.394, p = 0.005, η2 = 0.031). The finding aligns with previous studies that found that repeated exposure to sustainability decisions moderates the overall engagement in plastic tableware reduction [32,45]. Additionally, age × opt-out effectiveness (Wilks’ Lambda = 0.894, F = 2.848, p = 0.001, η2 = 0.037) and education × opt-out effectiveness (Wilks’ Lambda = 0.946, F = 2.114, p = 0.033, η2 = 0.028) suggest that the success of previous sustainability actions reinforces future engagement, particularly among middle-aged and highly educated individuals. This aligns with findings that highly educated consumers tend to have stronger pro-environmental identities and are more likely to adopt habitual sustainable behaviors [48]. These findings also highlight the importance of institutional support and reliability in opt-out programs to maintain long-term consumer engagement [10].

4.1.2. Four Dimensions of Engagement

The between-subject effects confirmed that nine factors significantly influenced different engagement dimensions. For plastic tableware opt-out behavior, significant predictors included education (F = 6.650, p = 0.001), education × opt-out effectiveness (F = 3.912, p = 0.021), age × order frequency (F = 4.380, p = 0.005), and age × opt-out effectiveness (F = 5.031, p = 0.002). These findings align well with previous research that found that higher education enhances sustainability awareness and fosters responsible consumption behaviors [36,48]. Additionally, successful opt-out experiences reinforce continued participation in sustainability behaviors, supporting habit formation and behavioral reinforcement theories [10,43].
For support for government policies, none of the demographic or behavioral factors were significant predictors (p > 0.05), suggesting that support for plastic tableware reduction policies is widespread across demographic groups and not driven by specific personal characteristics. This result may indicate that policy acceptance is more influenced by broader societal norms and public discourse rather than individual-level demographics or consumption habits [26,49]. Prior research suggests that pro-environmental policy support is often shaped by political ideology, perceived effectiveness of government intervention, and media exposure rather than individual demographics alone [50,51].
For support for plastic-free restaurants, age (F = 2.721, p = 0.045), age × order frequency (F = 5.122, p = 0.002), and income × order frequency (F = 3.133, p = 0.026) were significant predictors. Similar to opt-out behavior, middle-aged individuals demonstrated stronger preferences for restaurants implementing plastic tableware reduction strategies. Furthermore, order frequency moderates the influences of age and income on the selection of restaurants. These findings are supported by previous studies that emphasized the role of habit formation in promoting plastic-free consumption behaviors [42].
Price sensitivity was affected by opt-out effectiveness (F = 4.712, p = 0.031) and age × opt-out effectiveness (F = 3.742, p = 0.012). These findings align with previous studies. Positive past opt-out experiences make individuals more price-sensitive for plastic-free alternatives. Furthermore, the opt-out effectiveness reinforces the price sensitivity among middle-aged individuals [52].

4.2. Implications for Theory and Policy

This study adds to the body of knowledge on plastic tableware reduction practices by highlighting the varying roles of demographic factors and interaction effects in shaping engagement. While previous studies have extensively examined individual predictors of pro-environmental behavior [53,54], this research emphasizes the importance of interaction effects, demonstrating that demographic influences are context-dependent and shaped by behavioral experiences. The findings suggest that engagement in plastic tableware reduction should be understood not as a uniform process but as a dynamic interaction between individual characteristics and situational factors.
An additional theoretical implication of this study is its contribution to understanding behavioral patterns. In this study, order frequency and opt-out effectiveness interact with demographic characteristics to shape sustainability engagement. Although these moderators did not directly impact overall engagement, they reinforced or discouraged individuals from responding to plastic tableware reduction efforts in specific contexts. These findings supplement the existing literature on consumer engagement by highlighting the role of habitual consumption patterns and past experience in sustainability research.
From a policy perspective, sustainability campaigns should be tailored to different demographic groups. Since middle-aged individuals exhibit higher engagement, age-targeted strategies can help mobilize support among younger or less engaged populations. For example, social marketing initiatives can emphasize convenience or social impact to better resonate with younger consumers.
Second, ensuring the reliability of opt-out systems is crucial. Food delivery restaurants and businesses should recognize the consumer experience’s role in fostering sustainability engagement. Because honoring the opt-out requests can increase consumer trust and drive long-term commitment to plastic-free alternatives, policymakers should therefore work with restaurants and food delivery platforms to standardize and enforce opt-out mechanisms.
Third, food delivery applications can play an instrumental role in encouraging sustainable choices. Prior research suggests that nudging, such as pre-selecting sustainable choices for users, can significantly influence behavior without restricting consumer freedom [55]. Implementing default opt-out options for plastic tableware in food delivery apps could subtly steer consumers toward more sustainable behaviors while allowing them the flexibility to opt in if necessary. These types of interventions are practical, low-cost, and supported by behavioral economics research.
Fourth, public awareness campaigns should emphasize habit formation. Given the interaction between demographic traits and behavioral patterns, it is important to promote consistent, rewarding sustainability practices, especially among frequent food delivery users.

4.3. Limitations and Recommendations for Future Research

While this study provides valuable insights, it has some limitations. First, the reliance on self-reported survey data introduces the possibility of social desirability bias, where respondents may overstate their commitment to sustainability practices [56]. Future research could incorporate observational or experimental methods to validate self-reported behaviors.
Second, while this study examined a few demographic and behavioral factors affecting plastic tableware reduction engagement, it did not incorporate psychological and contextual influences, such as environmental concern, social norms, and perceived convenience. Future studies should integrate these variables to provide a more comprehensive understanding of sustainability engagement. Furthermore, longitudinal studies could also examine how demographic influences on plastic tableware reduction behaviors evolve over time and in response to policy changes.
Third, the findings of this study are context-specific and based on the behavior of Hong Kong residents. The city’s high population density, strong food delivery culture, and recent policy interventions shape behavioral patterns that may not be generalizable to other sociocultural contexts. Thus, caution should be exercised in applying these findings to different geographic or regulatory settings. Future comparative studies across diverse urban environments are encouraged to validate and extend the applicability of these insights.
Finally, while ANOVA provided valuable insights into individual predictor effects, it is susceptible to Type I error inflation due to multiple comparisons. The use of Welch’s MANOVA in this study addressed this limitation by considering the multivariate relationships between demographic factors and plastic tableware reduction engagement. Future research should consider alternative methodological approaches, such as structural equation modeling (SEM), which can offer an integrated analysis of direct and moderating effects. Nevertheless, the present study employs a combination of ANOVA and MANOVA to allow for a detailed stepwise examination of how individual variables and their interactions influence different aspects of engagement. This approach offers clarity in understanding specific relationships that might be masked in the SEM model.

5. Methodology

5.1. Instruments

This study employs a quantitative approach to investigate the factors influencing engagement in plastic tableware reduction using an online self-administered questionnaire survey.
The questionnaire design was informed by a panel discussion comprising government officers, academics, green groups, and NGO representatives, who provided expert insights into plastic tableware reduction engagement. The draft questionnaire was circulated among panel members and revised based on their feedback. A pilot study of 15 respondents was conducted to identify the ambiguous wordings of the questionnaire, and then the questionnaire was revised to enhance face and content validity [57].
The finalized questionnaire was structured into three sections. The first section measured engagement in plastic tableware reduction across four dimensions:
  • Plastic tableware opt-out behavior: “How often do you choose to opt out of plastic tableware when ordering takeaway or delivery foods?” (a 5-point Likert scale from 1 (never) to 5 (always)).
  • Support for government policy: “To what extent do you agree with the statement: ‘I support the government policy prohibiting restaurants from providing disposable plastic tableware for free.’” (a 7-point Likert scale from 1 (strongly disagree) to 7 (strongly agree)).
  • Support for plastic-free restaurants: “To what extent do you agree with the statement: ‘I prefer to order takeaway or delivery foods from restaurants that have adopted plastic-free tableware.’” (a 7-point Likert scale from 1 (strongly disagree) to 7 (strongly agree)).
  • Price sensitivity of plastic-free takeaways: “What is the minimum discount that would encourage you to choose plastic-free takeaway or delivery?” (open-ended response indicating the amount of money).
The second section measured order frequency and opt-out effectiveness:
  • Order frequency: “On average, how many times per week do you order takeaway or delivery food?” (open-ended response; respondents ordering ≤ 1 time per week were classified as infrequent consumers, while those ordering ≥ 1 time per week were classified as frequent consumers).
  • Opt-out effectiveness: “When you opt out of plastic tableware, how effective is it?” (ineffective/effective).
The third section collected demographic information from respondents, including the following:
  • Gender (male/female).
  • Age (15–24/24–34/35–44/45 or older).
  • Education level (secondary or below/post-secondary diploma or certificate/college, university, or post-graduate).
  • Monthly income (less than HKD 9999/HKD 10,000–19,999/HKD 20,000–29,999/HKD 30,000 or more).
  • Housing type (public housing/private housing and others).

5.2. Data Collection and Sample

Data were collected through an online self-administered questionnaire, which was distributed via the website of a local green group promoting waste reduction, social media platforms, and email invitations. The decision to conduct the survey online was based on the efficiency of reaching a broad population in Hong Kong, where internet penetration is high. Given that food delivery consumption is frequently facilitated through mobile apps and online platforms, an online survey aligns well with the study’s target population.
The research population comprised Hong Kong residents aged 15 and above who had ordered food via takeout or delivery at least once within the past year. This target group was selected because they are the primary users of food delivery services and, therefore, the most relevant consumers in relation to single-use plastic tableware usage. The age threshold of 15 years was chosen because individuals in this age group are capable of making independent consumption choices. To ensure the relevance of responses, a screening question was included at the beginning of the survey: “In the past year, have you ordered food via takeout or delivery?” Respondents who answered “no” were excluded from the study.
A purposive sampling approach was employed to ensure that participants were familiar with the topic and could provide relevant insights into plastic tableware opt-out behavior [58]. The final sample consisted of 355 valid responses, which is sufficient to support meaningful multivariate analysis [59]. Furthermore, 20 to 30 participants per group for comparison are required for detecting moderate effect sizes (i.e., η2 > 0.025) in factorial designs [60]. The observed power values in our MANOVA tests (reported in Section 4.3) confirm the sufficiency of this sample for detecting both main and interaction effects.
Ethical approval was obtained before data collection, ensuring adherence to research ethics guidelines. Participants were informed about the voluntary nature of the study and provided informed consent before participation. The questionnaire did not collect personally identifiable information, ensuring anonymity and confidentiality. Respondents were allowed to withdraw from the questionnaire at any moment.

5.3. Statistical Analysis

Before conducting the main statistical analyses, data cleaning and screening included checking for missing values, assessing the normality of variables, and ensuring the suitability of data for statistical modeling. Levene’s test tested the homogeneity of variances to ensure the appropriate selection of parametric tests.
At the first level of analysis, sequential ANOVA was performed to assess the impact of individual independent variables on each dependent variable. This allowed for an initial understanding of how demographic and behavioral factors separately influence the four dimensions of engagement in plastic tableware reduction.
At the second level of analysis, MANOVA was performed to assess the multivariate effects of independent and moderating variables on the four dimensions of engagement. Interaction effects were analyzed to determine whether order frequency and opt-out effectiveness moderated the relationships between demographic variables and engagement outcomes. The above sequential ANOVA and MANOVA were performed using IBM SPSS version 26.0.

6. Conclusions

This study provides a novel and comprehensive examination of consumer engagement in plastic tableware reduction by integrating demographic and behavioral determinants into a multidimensional framework. Unlike previous research that has primarily focused on policy effectiveness or consumer attitudes in isolation, this study advances the understanding of how demographic characteristics, habitual consumption patterns, and past opt-out experiences interact to shape engagement behaviors. By employing a MANOVA-based analytical approach, this research uniquely captures the complexity of plastic tableware reduction engagement, demonstrating that consumer engagement in sustainability efforts is shaped by a combination of demographic and behavioral factors, with order frequency and opt-out effectiveness playing a critical role in moderating these relationships.
Importantly, this study is grounded in the unique urban context of Hong Kong, where the prevalence of food delivery services and government-led plastic waste initiatives provide a distinctive backdrop for examining sustainable behavior. The findings reflect behavioral patterns specific to this setting, such as high-frequency ordering and consumer sensitivity to opt-out effectiveness, which may not directly apply to rural or less densely populated regions. Nonetheless, the methodological framework and analytical approach presented in this study offer valuable tools for analyzing consumer engagement in other metropolitan areas facing similar waste reduction challenges.
This study supplements the existing literature by offering empirical evidence on how demographic factors influence engagement in plastic tableware reduction and how behavioral factors, such as order frequency and opt-out effectiveness, shape these relationships. The findings highlight the need for further research into the underlying mechanisms that drive sustainable behaviors and the conditions under which individuals are more likely to engage in plastic tableware reduction efforts. Future studies should explore additional psychological and contextual variables that further explain consumer engagement in sustainability initiatives, and consider how transferability may be shaped by institutional, cultural, and infrastructural differences across settings.

Author Contributions

Conceptualization, S.-L.N.; methodology, S.-L.N.; software, S.-L.N.; validation, S.-L.N. and Y.-C.H.; formal analysis, S.-L.N.; investigation, S.-L.N.; resources, S.-L.N.; data curation, S.-L.N.; writing—original draft preparation, S.-L.N.; writing—review and editing, S.-L.N. and Y.-C.H.; visualization, S.-L.N. and Y.-C.H.; supervision, S.-L.N.; project administration, S.-L.N.; funding acquisition, S.-L.N. All authors have read and agreed to the published version of the manuscript.

Funding

This research received no external funding.

Data Availability Statement

The raw data supporting the conclusions of this article will be made available by the authors upon request.

Acknowledgments

The authors are grateful to Caimei Zhang, Vivien Y. W. Cheng, and the staff of The Green Earth for assisting with the questionnaire survey.

Conflicts of Interest

The authors declare that no known competing financial interests or personal relationships could have appeared to influence the work reported in this paper.

Appendix A

Table A1. MANOVA of the main effects of demographic variables on overall engagement in plastic reduction.
Independent VariableWilks’ LambdaFProb.Partial η2Non-
Centrality Parameter
Observed PowerDecision
Gender0.9851.1090.3520.0154.4380.348Reject H1a
Age0.9251.9820.023 *0.02620.9420.879Accept H2a
Educational level0.9511.8910.0590.02515.1290.797Reject H3a
Monthly income0.9660.8740.5740.0129.2400.460Reject H4a
Housing type0.9910.6430.6320.0092.5710.209Reject H5a
Order frequency0.9920.6020.6620.0082.4060.198Reject H6a
Opt-out effectiveness0.9692.3570.0540.0319.4260.679Reject H7a
Gender × order frequency0.9811.4510.2170.0195.8030.449Reject H8a
Age × order frequency0.9102.3940.005 **0.03125.2830.941Accept H9a
Educational level × order frequency0.9770.8820.5320.0127.0530.415Reject H10a
Monthly income × order frequency0.9461.4110.1550.01814.9160.714Reject H11a
Housing type × order frequency0.9861.0290.3920.0144.1180.324Reject H12a
Gender × opt-out effectiveness0.9880.8710.4820.0123.4850.277Reject H13a
Age × opt-out effectiveness0.8942.8480.001 **0.03730.0660.975Accept H14a
Educational level × opt-out effectiveness0.9462.1140.033 *0.02816.9150.848Accept H15a
Monthly income × opt-out effectiveness0.9511.2780.2260.01713.5060.659Reject H16a
Housing type × opt-out effectiveness0.0120.8790.4770.0123.5160.279Reject H17a
* Prob. < 0.05; ** Prob. < 0.01.

Appendix B

Table A2. MANOVA of the between-subject effects of demographic variables on four dimensions of plastic reduction engagement.
Independent
Variable
Dependent VariableFProb.Partial η2Non-
Centrality Parameter
Observed PowerDecision
GenderOpt-out behavior1.7030.1930.0061.7030.255Reject H1b
Support for government policy0.1230.7260.0000.1230.064Reject H1c
Support for plastic-free restaurants1.8950.1700.0061.8950.279Reject H1d
Price sensitivity0.8220.3650.0030.8220.148Reject H1e
AgeOpt-out behavior2.4390.0650.0247.3170.605Reject H2b
Support for government policy2.0140.1120.0206.0410.515Reject H2c
Support for plastic-free restaurants2.7210.045 *0.0268.1620.658Accept H2d
Price sensitivity1.3370.2630.0134.0100.355Reject H2e
Educational levelOpt-out behavior6.6500.001 **0.04213.3000.912Accept H3b
Support for government policy0.9830.3750.0061.9660.220Reject H3c
Support for plastic-free restaurants1.6030.2030.0113.2060.338Reject H3d
Price sensitivity0.2760.7590.0020.5530.094Reject H3e
Monthly incomeOpt-out behavior0.7430.5270.0072.2300.209Reject H4b
Support for government policy0.2790.8400.0030.8380.103Reject H4c
Support for plastic-free restaurants0.6670.5730.0072.0000.190Reject H4d
Price sensitivity1.0990.3500.0113.2960.296Reject H4e
Housing typeOpt-out behavior1.7780.1830.0061.7780.265Reject H5b
Support for government policy0.0020.9660.0000.0020.050Reject H5c
Support for plastic-free restaurants0.4060.5240.0010.4060.097Reject H5d
Price sensitivity0.1920.6610.0010.1920.072Reject H5e
Order frequencyOpt-out behavior0.3340.5640.0010.3340.089Reject H6b
Support for government policy2.2700.1330.0072.2700.324Reject H6c
Support for plastic-free restaurants0.9880.3210.0030.9880.168Reject H6d
Price sensitivity0.3370.5620.0010.3370.089Reject H6e
Opt-out
effectiveness
Opt-out behavior3.6850.0560.0123.6850.482Reject H7b
Support for government policy0.0160.9000.0000.0160.052Reject H7c
Support for plastic-free restaurants2.5750.1100.0082.5750.360Reject H7d
Price sensitivity4.7120.031 *0.0154.7120.581Accept H7e
Gender ×
order frequency
Opt-out behavior1.7770.1830.0061.7770.265Reject H8b
Support for government policy0.0080.9280.0000.0080.051Reject H8c
Support for plastic-free restaurants0.0490.8250.0000.0490.056Reject H8d
Price sensitivity2.5680.1100.0082.5680.359Reject H8e
Age ×
order
frequency
Opt-out behavior4.3800.005 **0.04213.1400.870Accept H9b
Support for government policy2.1850.0900.0216.5540.553Reject H9c
Support for plastic-free restaurants5.1220.002 **0.04815.3670.920Accept H9d
Price sensitivity0.3400.7970.0031.0190.116Reject H9e
Educational level × order frequencyOpt-out behavior2.1710.1160.0144.3420.443Reject H10b
Support for government policy0.6050.5470.0041.2100.151Reject H10c
Support for plastic-free restaurants1.4590.2340.0102.9180.311Reject H10d
Price sensitivity1.0170.3630.0072.0340.227Reject H10e
Monthly income × order frequencyOpt-out behavior1.0470.3720.0103.1410.283Reject H11b
Support for government policy1.6910.1690.0175.0740.441Reject H11c
Support for plastic-free restaurants3.1330.026 *0.0309.3980.726Accept H11d
Price sensitivity0.8120.4880.0082.4350.225Reject H11e
Housing type ×
order frequency
Opt-out behavior0.3960.5300.0010.3960.096Reject H12b
Support for government policy0.0850.7710.0000.0850.060Reject H12c
Support for plastic-free restaurants3.0690.0810.0103.0690.416Reject H12d
Price sensitivity0.1250.7240.0000.1250.064Reject H12e
Gender ×
opt-out
effectiveness
Opt-out behavior0.8050.3700.0030.8050.145Reject H13b
Support for government policy0.1700.6810.0010.1700.070Reject H13c
Support for plastic-free restaurants0.6420.4240.0020.6420.126Reject H13d
Price sensitivity0.9370.3340.0030.9370.162Reject H13e
Age ×
opt-out
effectiveness
Opt-out behavior5.0310.002 **0.04815.0920.915Accept H14b
Support for government policy0.1730.9140.0020.5200.082Reject H14c
Support for plastic-free restaurants2.6050.0520.0257.8160.636Reject H14d
Price sensitivity3.7420.012 *0.03611.2270.807Accept H14e
Educational level × opt-out
effectiveness
Opt-out behavior3.9120.021 *0.0257.8240.703Accept H15b
Support for government policy0.3580.6990.0020.7160.107Reject H15c
Support for plastic-free restaurants2.8270.0610.0185.6530.553Reject H15d
Price sensitivity1.2730.2810.0082.5470.276Reject H15e
Monthly income × opt-out
effectiveness
Opt-out behavior0.8520.4660.0082.5570.235Reject H16b
Support for government policy1.9790.1170.0195.9370.508Reject H16c
Support for plastic-free restaurants1.6960.1680.0175.0880.442Reject H16d
Price sensitivity0.6470.5850.0061.9410.185Reject H16e
Housing type ×
opt-out
effectiveness
Opt-out behavior2.5900.1090.0092.5900.361Reject H17b
Support for government policy2.2390.1360.0072.2390.320Reject H17c
Support for plastic-free restaurants1.1970.2750.0041.1970.193Reject H17d
Price sensitivity0.0540.8160.0000.0540.056Reject H17e
* Prob. < 0.05; ** Prob. < 0.01.

References

  1. Geyer, R.; Jambeck, J.R.; Law, K.L. Production, use, and fate of all plastics ever made. Sci. Adv. 2017, 3, e1700782. [Google Scholar] [CrossRef] [PubMed]
  2. Plastic Oceans International. The Facts. 2022. Available online: https://www.plasticoceans.org/ (accessed on 25 February 2025).
  3. Jambeck, J.R.; Geyer, R.; Wilcox, C.; Siegler, T.R.; Perryman, M.; Andrady, A.; Law, K.L. Plastic waste inputs from land into the ocean. Science 2015, 347, 768–771. [Google Scholar] [CrossRef] [PubMed]
  4. Simoni, M.D.; Winkenbach, M. Crowdsourced on-demand food delivery: An order batching and assignment algorithm. Transp. Res. Part C Emerg. Technol. 2023, 149, 104055. [Google Scholar] [CrossRef]
  5. European Commission. Single-Use Plastics Directive: New Rules to Reduce Marine Litter. 2019. Available online: https://ec.europa.eu/commission/presscorner/detail/en/ip_18_3927 (accessed on 25 February 2025).
  6. Xanthos, D.; Walker, T.R. International policies to reduce plastic marine pollution from single-use plastics (plastic bags and microbeads): A review. Mar. Pollut. Bull. 2017, 118, 17–26. [Google Scholar] [CrossRef] [PubMed]
  7. Nordic Council of Ministers. Economic Policy Instruments for Plastic Waste: A Review with Nordic Perspectives (TemaNord 2014:569). Nordic Council of Ministers. 2015. Available online: https://www.norden.org/en/publication/economic-policy-instruments-plastic-waste (accessed on 25 February 2025).
  8. Environmental Protection Department Regulation of Disposable Plastic Tableware. 2021. Available online: https://www.epd.gov.hk/epd/sites/default/files/epd/english/environmentinhk/waste/pub_consult/files/tableware-con-doc-en.pdf (accessed on 25 February 2025).
  9. Environmental Campaign Committee. “Plastic-Free Takeaway, Use Reusable Tableware” Campaign. 2023. Available online: https://www.ecc.org.hk/en/publicity/plastic-free-takeaway.html (accessed on 25 February 2025).
  10. Verplanken, B.; Whitmarsh, L. Habit and climate change. Curr. Opin. Behav. Sci. 2021, 42, 42–46. [Google Scholar] [CrossRef]
  11. Steg, L.; Vlek, C. Encouraging pro-environmental behavior: An integrative review and research agenda. J. Environ. Psychol. 2009, 29, 309–317. [Google Scholar] [CrossRef]
  12. Vander Schee, B.A.; Peltier, J.; Dahl, A.J. Antecedent consumer factors, consequential branding outcomes and measures of online consumer engagement: Current research and future directions. J. Res. Interact. Mark. 2020, 14, 239–268. [Google Scholar] [CrossRef]
  13. Liu, L.; Liu, R.; Lee, M.; Chen, J. When will consumers be ready? A psychological perspective on consumer engagement in social media brand communities. Internet Res. 2019, 29, 704–724. [Google Scholar] [CrossRef]
  14. Senturk, G.; Dumludag, D. The relationship between consumption of single-use plastic bags, environmental awareness, and socio-demographic factors. J. Mater. Cycles Waste Manag. 2022, 24, 1494–1507. [Google Scholar] [CrossRef]
  15. Steg, L.; Dreijerink, L.; Abrahamse, W. Why are energy policies acceptable and effective? Environ. Behavior. 2006, 38, 92–111. [Google Scholar] [CrossRef]
  16. Fontecha, J.E.; Nikolaev, A.; Walteros, J.L.; Zhu, Z. Scientists wanted? A literature review on incentive programs that promote pro-environmental consumer behavior: Energy, waste, and water. Socio-Econ. Plan. Sci. 2022, 82, 101251. [Google Scholar] [CrossRef]
  17. Latif, B.; Gunarathne, N.; Gaskin, J.; Ong, T.S.; Ali, M. Environmental corporate social responsibility and pro-environmental behavior: The effect of green shared vision and personal ties. Resour. Conserv. Recycl. 2022, 186, 106572. [Google Scholar] [CrossRef]
  18. O’Malley, M.; Voight, A.; Renshaw, T.L.; Eklund, K. School climate, family structure, and academic achievement: A study of moderation effects. Sch. Psychol. Q. 2015, 30, 142–157. [Google Scholar] [CrossRef] [PubMed]
  19. Brodie, R.J.; Hollebeek, L.D.; Juric, B.; Ilić, A. Customer engagement: Conceptual domain, fundamental propositions, and implications for research. J. Serv. Res. 2011, 14, 252–271. [Google Scholar] [CrossRef]
  20. Van Doorn, J.; Lemon, K.N.; Mittal, V.; Nass, S.; Pick, D.; Pirner, P.; Verhoef, P.C. Customer engagement behavior: Theoretical foundations and research directions. J. Serv. Res. 2010, 13, 253–266. [Google Scholar] [CrossRef]
  21. White, K.; Habib, R.; Hardisty, D.J. How to shift consumer behaviors to be more sustainable: A literature review and guiding framework. J. Mark. 2019, 83, 22–49. [Google Scholar] [CrossRef]
  22. Yue, B.B.; Sheng, G.H.; She, S.X.; Xu, J.Q. Impact of consumer environmental responsibility on green consumption behavior in China: The role of environmental concern and price sensitivity. Sustainability 2020, 12, 2074. [Google Scholar] [CrossRef]
  23. Boström, M.; Klintman, M. Eco-Standards, Product Labelling and Green Consumerism; Palgrave Macmillan: London, UK, 2019. [Google Scholar]
  24. Bamberg, S.; Möser, G. Twenty years after Hines, Hungerford, and Tomera: A new meta-analysis of psycho-social determinants of pro-environmental behavior. J. Environ. Psychol. 2007, 27, 14–25. [Google Scholar] [CrossRef]
  25. Li, D.; Zhao, L.; Ma, S.; Shao, S.; Zhang, L. What influences an individual’s pro-environmental behavior? A literature review. Resour. Conserv. Recycl. 2019, 146, 28–34. [Google Scholar] [CrossRef]
  26. Gifford, R.; Nilsson, A. Personal and social factors that influence pro-environmental concern and behavior: A review. Int. J. Psychol. 2014, 49, 141–157. [Google Scholar] [CrossRef]
  27. Ebreo, A.; Vining, J. How similar are recycling and waste reduction? Future orientation and reasons for reducing waste as predictors of self-reported behavior. Environ. Behav. 2001, 33, 424–447. [Google Scholar] [CrossRef]
  28. Cox, J.; Giorgi, S.; Sharp, V.; Strange, K.; Wilson, D.C.; Blakey, N. Household waste prevention—A review of evidence. Waste Manag. Res. 2010, 28, 193–219. [Google Scholar] [CrossRef]
  29. Zelezny, L.C.; Chua, P.P.; Aldrich, C. New ways of thinking about environmentalism: Elaborating on gender differences in environmentalism. J. Soc. Issues 2000, 56, 443–457. [Google Scholar] [CrossRef]
  30. Patel, J.; Modi, A.; Paul, J. Pro-environmental behavior and socio-demographic factors in an emerging market. Asian J. Bus. Ethics 2017, 6, 189–214. [Google Scholar] [CrossRef]
  31. Muralidharan, S.; Kim, S. The role of guilt in influencing sustainable pro-environmental behaviors among shoppers. J. Advert. Res. 2017, 58, 349–362. [Google Scholar] [CrossRef]
  32. Wiernik, B.M.; Ones, D.S.; Dilchert, S. Age and environmental sustainability: A meta-analysis. J. Manag. Psychol. 2013, 28, 826–856. [Google Scholar] [CrossRef]
  33. Ágoston, C.; Balázs, B.; Mónus, F.; Varga, A. Age differences and profiles in pro-environmental behavior and eco-emotions. Int. J. Behav. Dev. 2024, 48, 132–144. [Google Scholar] [CrossRef]
  34. Kheiry, B.; Nakhaei, A. Consumers’ green purchase decision: An examination of environmental beliefs, environmental literacy and demographics. Int. J. Mark. Technol. 2012, 2, 171–183. [Google Scholar]
  35. Grazhdani, D. Assessing the variables affecting on the rate of solid waste generation and recycling: An empirical analysis in Prespa Park. Waste Manag. 2016, 48, 3–13. [Google Scholar] [CrossRef]
  36. Kollmuss, A.; Agyeman, J. Mind the gap: Why do people act environmentally and what are the barriers to pro-environmental behavior? Environ. Educ. Res. 2002, 8, 239–260. [Google Scholar] [CrossRef]
  37. Sekito, T.; Prayogo, T.B.; Dote, Y.; Yoshitake, T.; Bagus, I. Influence of a community-based waste management system on people’s behavior and waste reduction. Resour. Conserv. Recycl. 2013, 72, 84–90. [Google Scholar] [CrossRef]
  38. Valenzuela-Levi, N. Do the rich recycle more? Understanding the link between income inequality and separate waste collection within metropolitan areas. J. Clean. Prod. 2019, 213, 440–450. [Google Scholar] [CrossRef]
  39. Woodard, R.; Rossouw, A. An evaluation of interventions for improving pro-environmental waste behaviour in social housing. Sustainability 2021, 13, 7272. [Google Scholar] [CrossRef]
  40. Ng, S.L. An assessment of multi-family dwelling recycling in Hong Kong: A managerial perspective. Waste Manag. 2019, 89, 294–302. [Google Scholar] [CrossRef]
  41. Du Toit, J.; Wagner, C. The effect of housing type on householders’ self-reported participation in recycling. Smart Sustain. Built Environ. 2020, 9, 395–412. [Google Scholar] [CrossRef]
  42. Verplanken, B.; Roy, D. Empowering interventions to promote sustainable lifestyles: Testing the habit discontinuity hypothesis in a field experiment. J. Environ. Psychol. 2016, 45, 127–134. [Google Scholar] [CrossRef]
  43. De Young, R. Expanding and evaluating motives for environmentally responsible behavior. J. Soc. Issues 2000, 56, 509–526. [Google Scholar] [CrossRef]
  44. Van der Werff, E.; Steg, L.; Keizer, K. The value of environmental self-identity: The relationship between biospheric values, environmental self-identity, and environmental preferences, intentions, and behavior. J. Environ. Psychol. 2013, 34, 55–63. [Google Scholar] [CrossRef]
  45. Clement, J.; Alenčikienė, G.; Riipi, I.; Starkutė, U.; Čepytė, K.; Buraitytė, A.; Zabulionė, A.; Šalaševičienė, A. Exploring causes and potential solutions for food waste among young consumers. Foods 2023, 12, 2570. [Google Scholar] [CrossRef]
  46. Mccarroll, D.; Crays, N.; Dunlap, W.P. Sequential ANOVAs and Type I error rates. Educ. Psychol. Meas. 1992, 52, 387–393. [Google Scholar] [CrossRef]
  47. Liang, J.; Li, J.; Cao, X.; Zhang, Z. Generational differences in sustainable consumption behavior among Chinese residents: Implications based on perceptions of sustainable consumption and lifestyle. Sustainability 2024, 16, 3976. [Google Scholar] [CrossRef]
  48. Franzen, A.; Meyer, R. Environmental attitudes in cross-national perspective: A multilevel analysis of the ISSP 1993 and 2000. Eur. Sociol. Rev. 2010, 26, 219–234. [Google Scholar] [CrossRef]
  49. Stern, P.C. Toward a coherent theory of environmentally significant behavior. J. Soc. Issues 2000, 56, 407–424. [Google Scholar] [CrossRef]
  50. Whitmarsh, L.; O’Neill, S.; Lorenzoni, I. Public engagement with climate change: What do we know and where do we go from here? Int. J. Media Cult. Politics 2013, 9, 7–25. [Google Scholar] [CrossRef]
  51. Truelove, H.B.; Parks, C. Perceptions of behaviors that cause and mitigate global warming and intentions to perform these behaviors. J. Environ. Psychol. 2012, 32, 246–259. [Google Scholar] [CrossRef]
  52. Fang, Y.; Qureshi, I.; Sun, H.; Mccole, P.; Ramsey, E.; Lim, K.H. Trust, satisfaction, and online repurchase intention: The moderating role of perceived effectiveness of E-commerce institutional mechanisms. MIS Q. 2014, 38, 407–427. [Google Scholar] [CrossRef]
  53. Gifford, R. The dragons of inaction: Psychological barriers that limit climate change mitigation and adaptation. Am. Psychol. 2011, 66, 290–302. [Google Scholar] [CrossRef] [PubMed]
  54. Steg, L.; Bolderdijk, J.W.; Keizer, K.; Perlaviciute, G. An integrated framework for encouraging pro-environmental behaviour: The role of values, situational factors and goals. J. Environ. Psychol. 2014, 38, 104–115. [Google Scholar] [CrossRef]
  55. Rivers, N.; Shenstone-Harris, S.; Young, N. Using nudges to reduce waste? The case of Toronto’s plastic bag levy. J. Environ. Manag. 2017, 188, 153–162. [Google Scholar] [CrossRef]
  56. Kormos, C.; Gifford, R. The validity of self-report measures of pro-environmental behavior: A meta-analytic review. J. Environ. Psychol. 2014, 40, 359–371. [Google Scholar] [CrossRef]
  57. Etchegaray, J.M.; Fischer, W.G. Understanding evidence-based research methods: Pilot testing surveys. HERD 2011, 4, 143–147. [Google Scholar] [CrossRef]
  58. Tongco, M.D.C. Purposive sampling as a tool for informant selection. Ethnobot. Res. Appl. 2007, 5, 147–158. Available online: http://hdl.handle.net/10125/227 (accessed on 25 February 2025). [CrossRef]
  59. Cohen, J. Statistical Power Analysis for the Behavioral Sciences, 2nd ed.; Lawrence Erlbaum Associates: Hillsdale, NJ, USA, 1988. [Google Scholar]
  60. Tabachnick, B.G.; Fidell, L.S. Using Multivariate Statistics, 6th ed.; Pearson Education: Boston, MA, USA, 2013. [Google Scholar]
Figure 1. Conceptual framework of this study.
Recycling 10 00103 g001
Table 1. Demographic profile of the respondents (n = 355).
Demographic CharacteristicCategoryNumber (%)
GenderMale119 (35.5%)
Female216 (64.5%)
Age15–2460 (17.9%)
25–34107 (31.9%)
35–4482 (24.5%)
≥4586 (25.7%)
Educational levelSecondary or below47 (14.0%)
Post-secondary diploma or certificate38 (11.3%)
College, university, or postgraduate250 (74.6%)
Monthly income
(USD 1 = HKD 7.8)
≤HKD 999963 (18.8%)
HKD 10,000–19,99980 (23.9%)
HKD 20,000–29,999100 (29.9%)
≥HKD 30,00092 (27.5%)
Housing typePublic housing142 (42.4%)
Private housing and others193 (57.6%)
Table 2. Sequential ANOVA of the influences of demographic variables on the four dimensions of plastic reduction engagement.
Independent VariableOpt-Out
Behavior
Support for
Government
Policy
Support for
Plastic-Free
Restaurants
Price
Sensitivity
FProb.FProb.FProb.FProb.
Gender1.6040.2060.0170.8952.3460.1271.1320.288
Age1.9130.1272.8340.038 *2.6960.046 *0.7720.510
Educational level8.5570.000 **0.4250.6544.5730.011 *0.8000.450
Monthly income3.0570.029 *0.9240.4290.4790.6972.0030.113
Housing type3.3810.0670.1580.6910.7930.3740.0060.939
Order frequency6.0890.014 *8.7430.003 **5.3210.022 *2.0940.149
Opt-out effectiveness2.7320.0990.3730.5420.0370.8473.8890.049 *
* Prob. < 0.05; ** Prob. < 0.01.
Table 3. Significant main and between-subject effects of demographic variables on overall engagement in plastic reduction.
Independent VariableDependent VariableWilks’ LambdaFProb.Partial η2Non-
Centrality
Observed PowerSupport
AgeOverall0.9251.9820.023 *0.02620.9420.879H2a
AgeSupport for plastic-free restaurants--2.7210.045 *0.0268.1620.658H2d
Educational levelOpt-out behavior--6.6500.001 **0.04213.3000.912H3b
Opt-out effectivenessPrice sensitivity--4.7120.031 *0.0154.7120.581H7e
Age × order frequencyOverall0.9102.3940.005 **0.03125.2830.941H9a
Age × order frequencyOpt-out behavior--4.3800.005 **0.04213.1400.870H9b
Age × order frequencySupport for plastic-free restaurants--5.1220.002 **0.04815.3670.920H9d
Monthly income × order frequencySupport for plastic-free restaurants--3.1330.026 *0.0309.3980.726H11d
Age × opt-out effectivenessOverall0.8942.8480.001 **0.03730.0660.975H14a
Age × opt-out effectivenessOpt-out behavior--5.0310.002 **0.04815.0920.915H14b
Age × opt-out effectivenessPrice sensitivity--3.7420.012 *0.03611.2270.807H14e
Educational level × opt-out effectivenessOverall0.9462.1140.033 *0.02816.9150.848H15a
Educational level × opt-out effectivenessOpt-out behavior--3.9120.021 *0.0257.8240.703H15b
* Prob. < 0.05; ** Prob. < 0.01.
Disclaimer/Publisher’s Note: The statements, opinions and data contained in all publications are solely those of the individual author(s) and contributor(s) and not of MDPI and/or the editor(s). MDPI and/or the editor(s) disclaim responsibility for any injury to people or property resulting from any ideas, methods, instructions or products referred to in the content.

