
Macro Stickies Content Evaluation of Different Cellulose-Based Materials Through Image Analysis


 , , ,
, , ,  ,
,  and
and 
Abstract
1. Introduction
2. Materials and Methods
2.1. Cellulose-Based Materials
2.2. Experimental Methodology–Macro Stickies Screening
2.3. Experimental Methodology–Optical Analysis
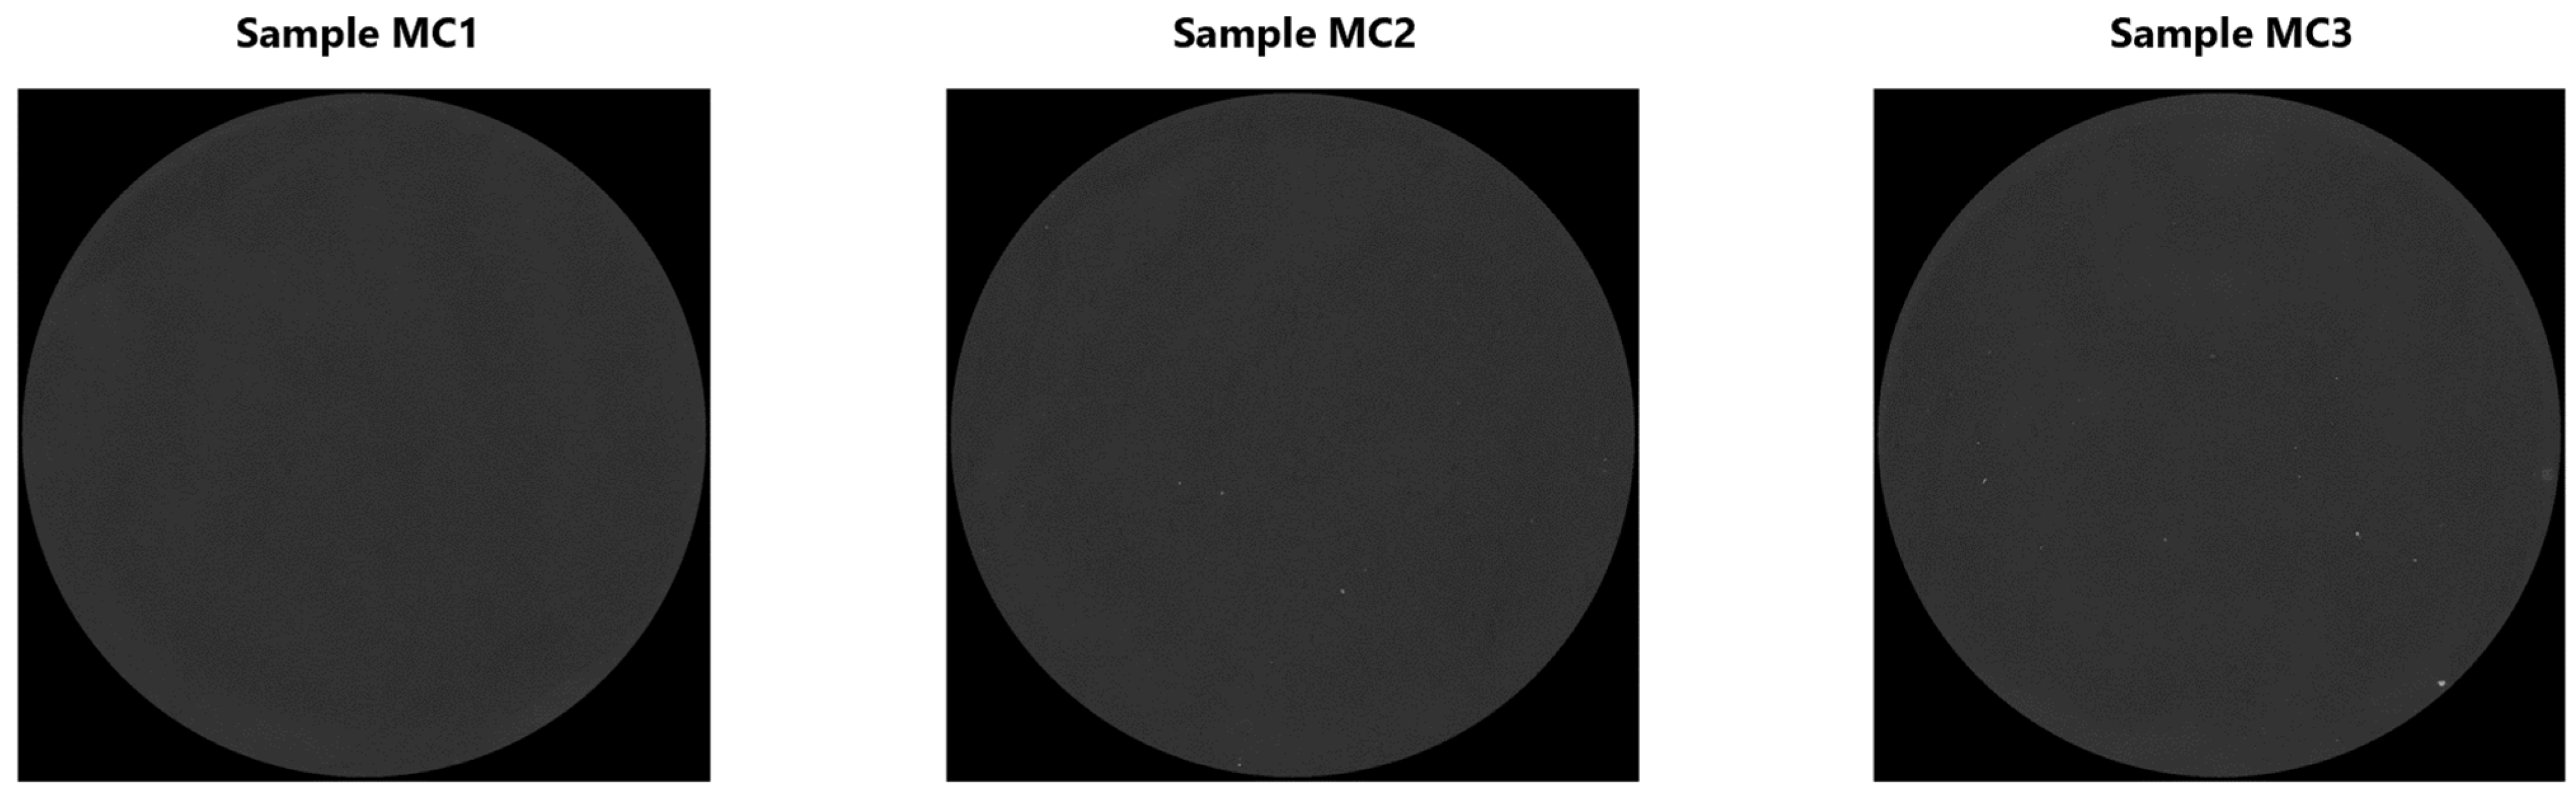
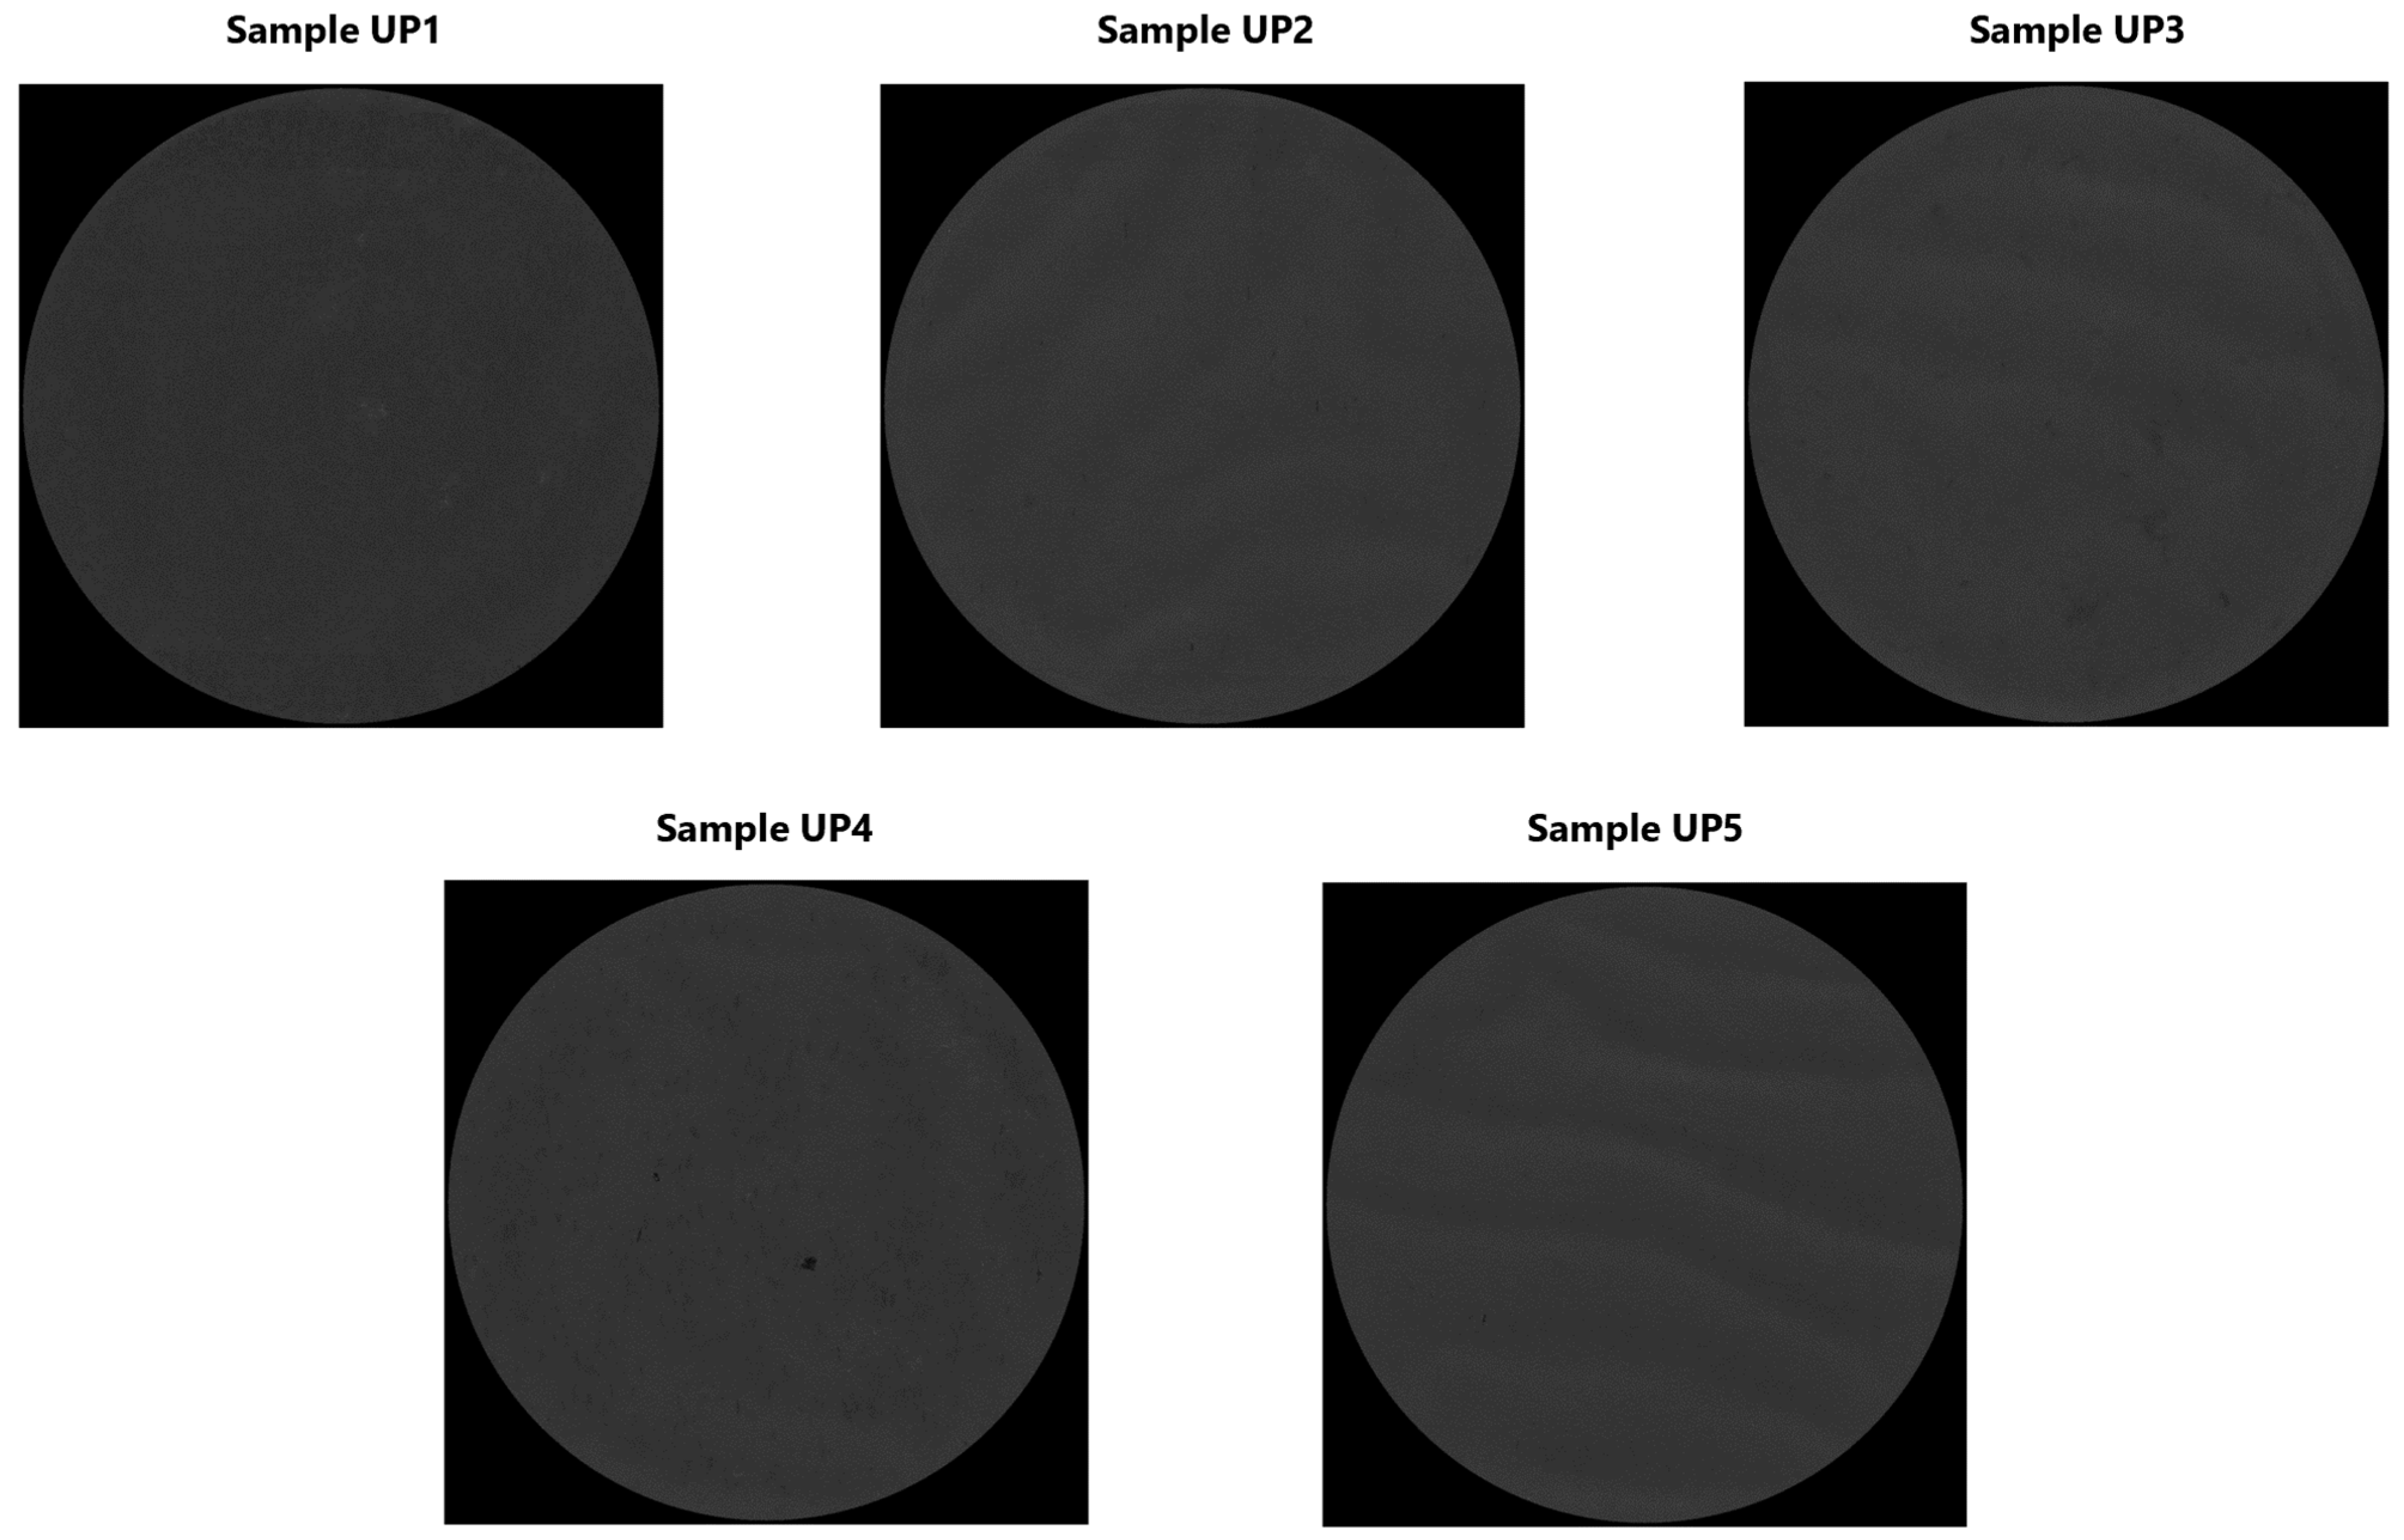
2.3.1. Optical Analysis–Scanning Step
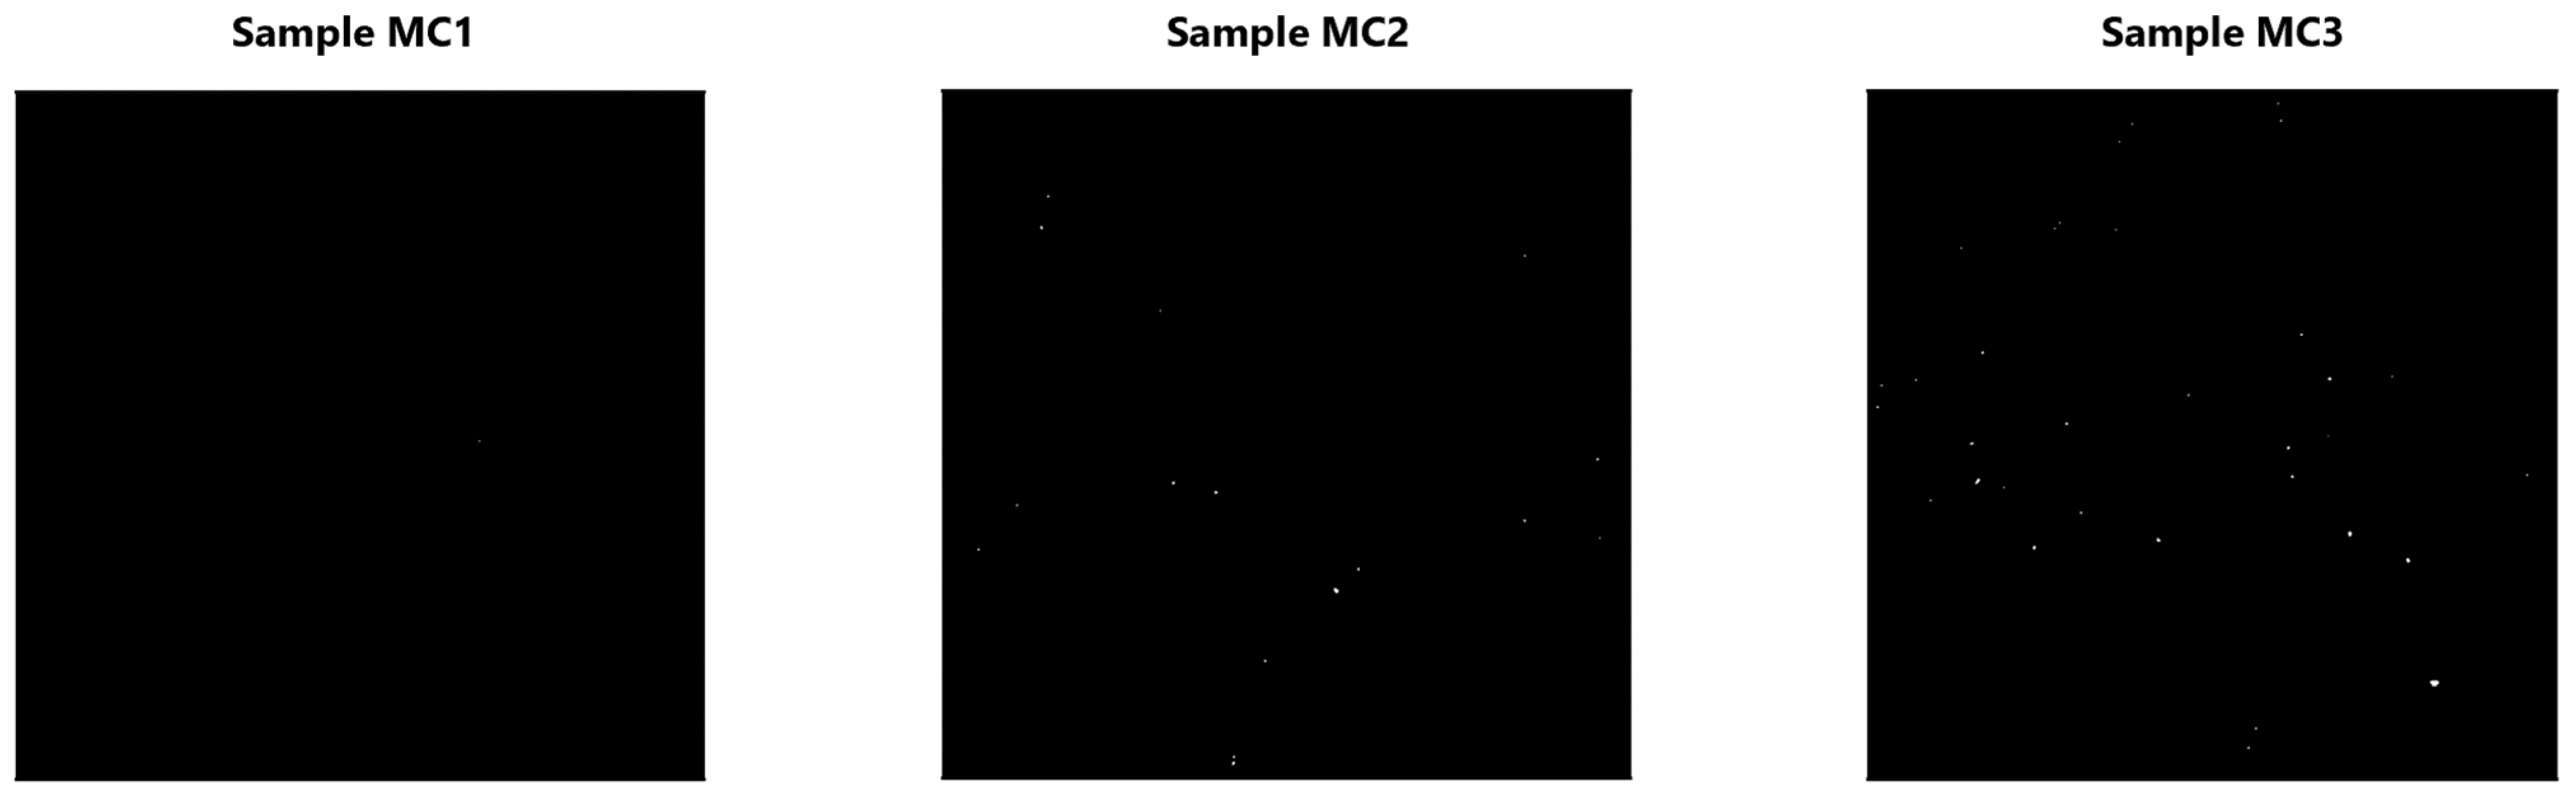
2.3.2. Optical Analysis–Processing Step
3. Results and Discussion
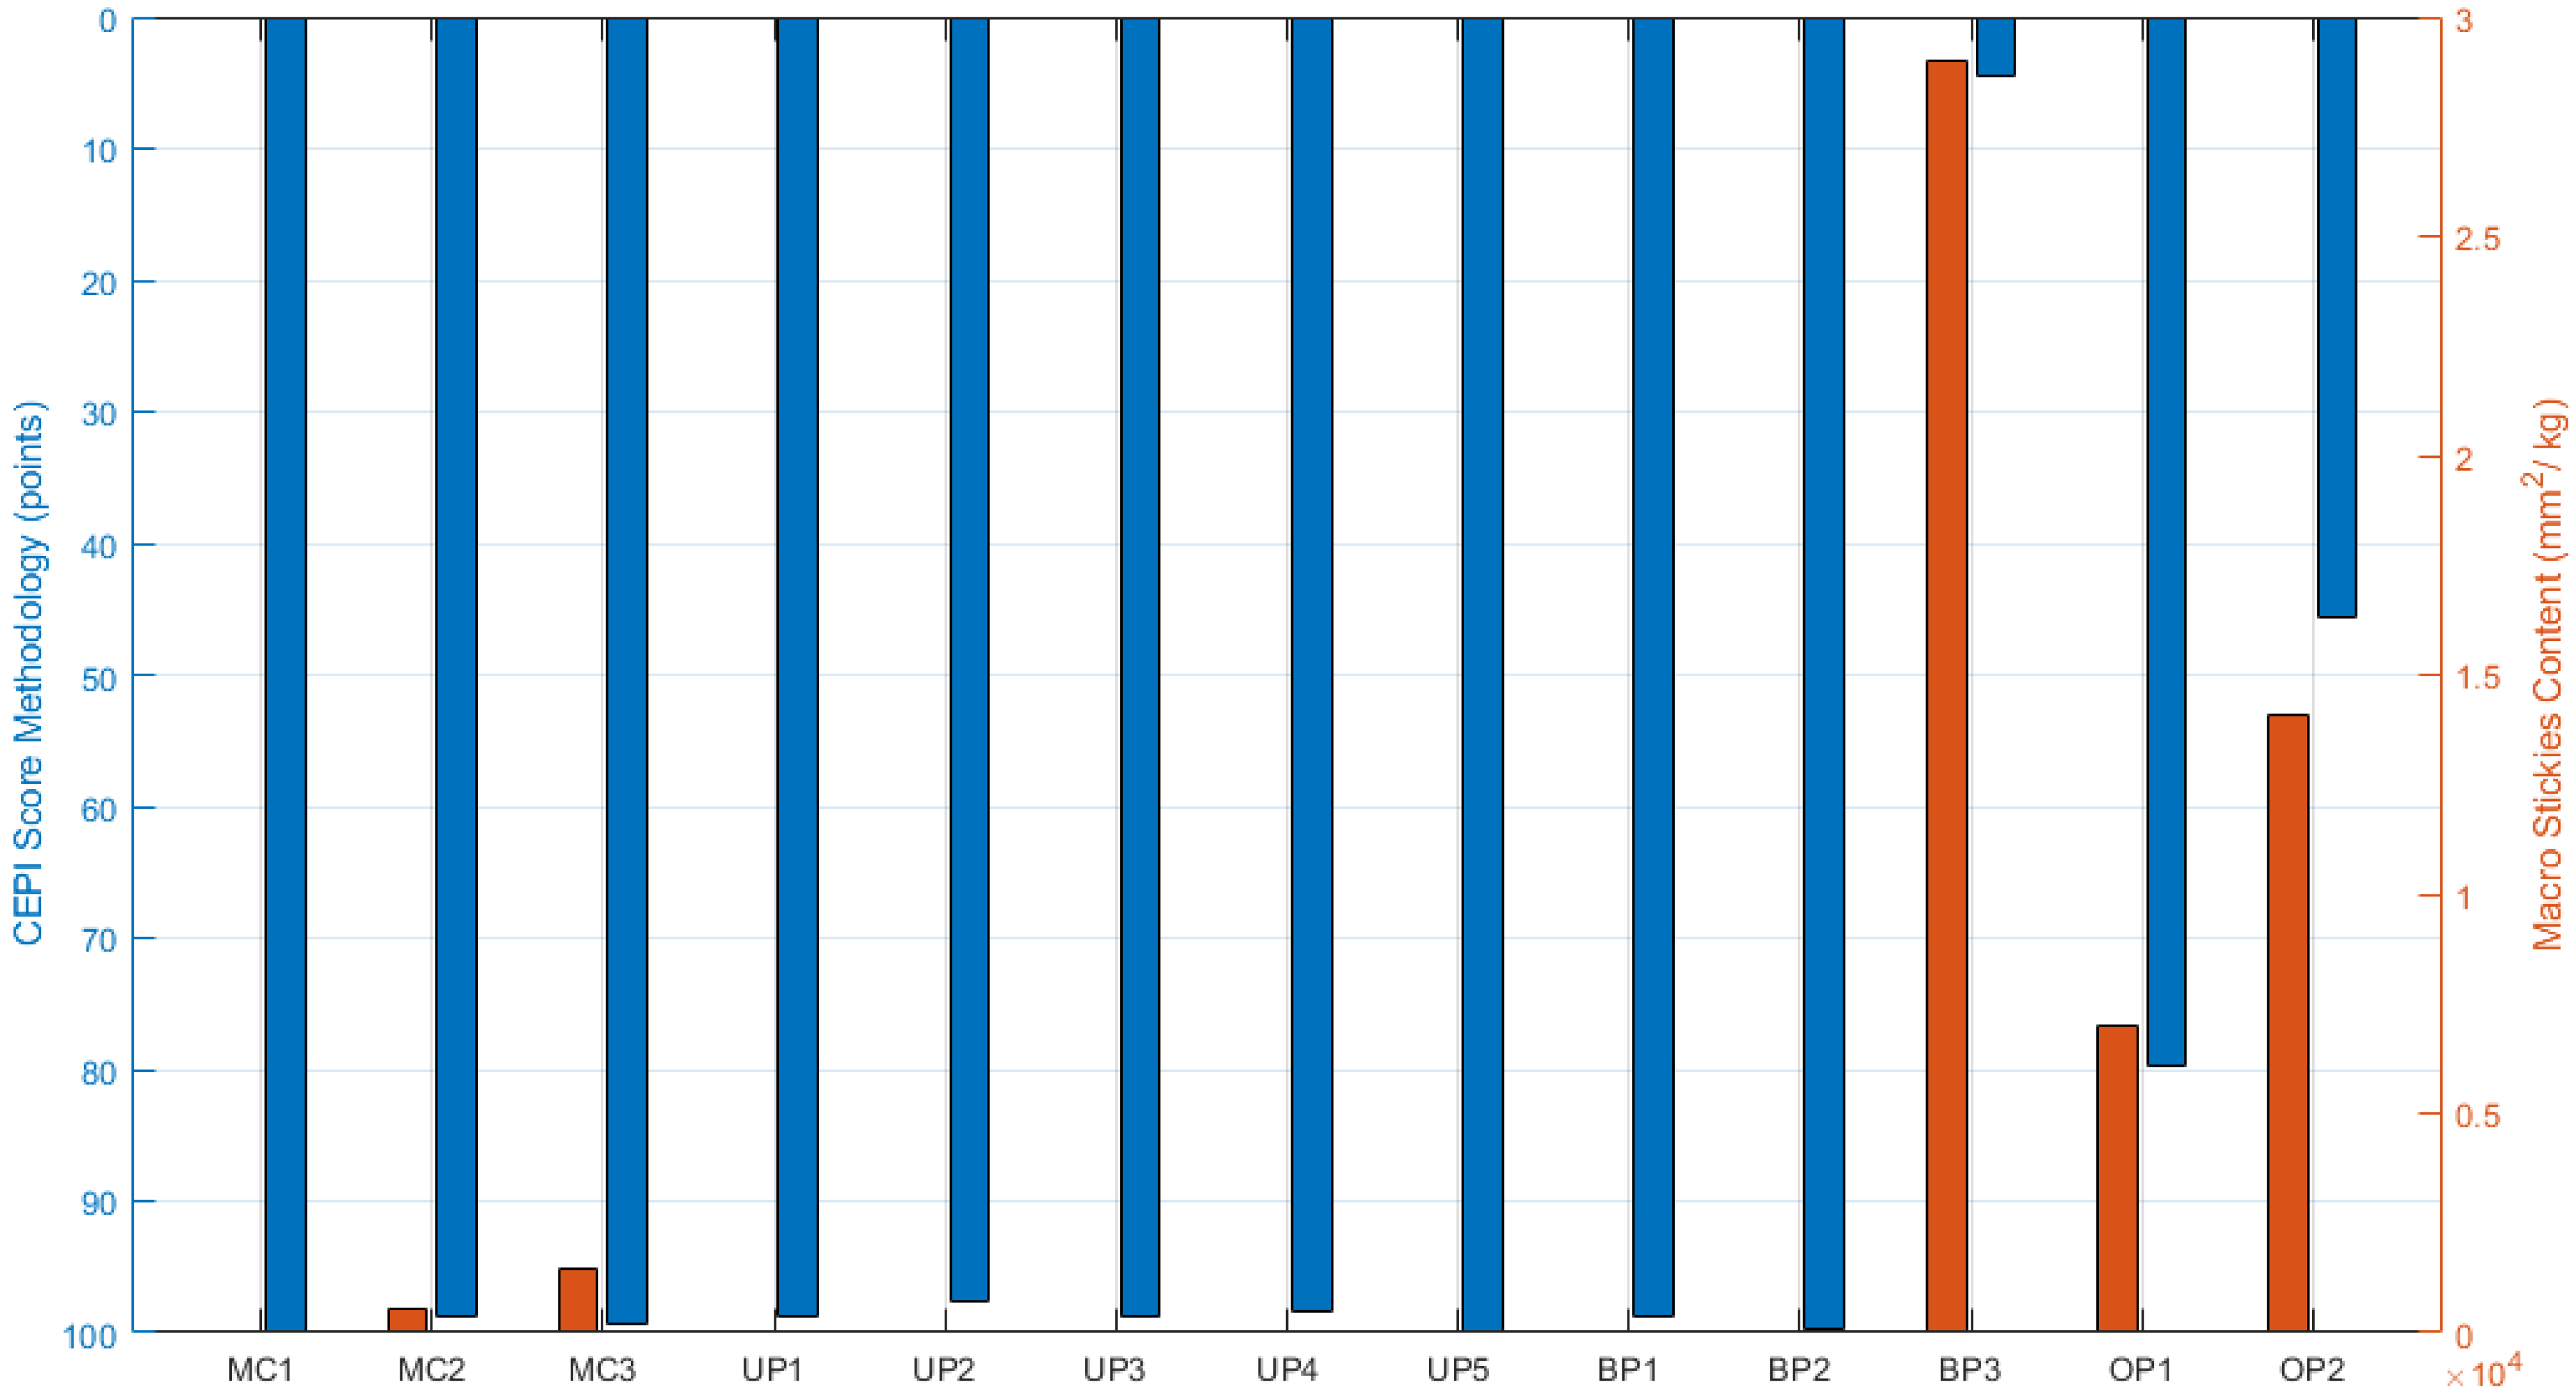
3.1. Global Analysis
- -
- Number of detected elements (units);
- -
- Total area of detected elements (mm2);
- -
- Total area of detected elements per oven-dried mass of pulp (mm2/kg).
3.2. Analysis per Classes
4. Conclusions
Author Contributions
Funding
Data Availability Statement
Acknowledgments
Conflicts of Interest
References
- Minelgaité, A.; Liobikiené, G. Waste problem in European Union and its influence on waste management behaviours. Sci. Total Environ. 2019, 667, 86–93. [Google Scholar] [CrossRef]
- Almansour, M.; Akrami, M. Towards Zero Waste: An In-Depth Analysis of National Policies, Strategies, and Case Studies in Waste Minimisation. Sustainability 2024, 16, 10105. [Google Scholar] [CrossRef]
- Tabish, M.; Khan, S.A.R.; Yu, Z.; Tanveer, M. A thorough overview of the literature on waste recycling in the circular economy: Current practices and future perspectives. Environ. Sci. Pollut. Res. 2024, 31, 61377–61396. [Google Scholar] [CrossRef]
- Georgeson, L.; Maslin, M.; Poessinouw, M. The global green economy: A review of concepts, definitions, measurement methodologies and their interactions. Geo-Geogr. Environ. 2017, 4, e0036. [Google Scholar] [CrossRef]
- Li, J.; Song, G.; Cai, M.; Bian, J.; Mohammed, B.S. Green environment and circular economy: A state-of-the-art analysis. Sustain. Energy Technol. Assess. 2022, 52, 102106. [Google Scholar] [CrossRef]
- D’Amato, D.; Korhonen, J. Integrating the green economy, circular economy and bioeconomy in a strategic sustainability framework. Ecol. Econ. 2021, 188, 107143. [Google Scholar] [CrossRef]
- Meng, W.; Sun, H.; Su, G. Plastic packaging-associated chemicals and their hazards—An overview of reviews. Chemosphere 2023, 331, 138795. [Google Scholar] [CrossRef] [PubMed]
- Syeda, S.R.; Khan, E.A.; Padungwatanaroj, O.; Kuprasertwong, N.; Tula, A.K. A perspective on hazardous chemical substitution in consumer products. Curr. Opin. Chem. Eng. 2022, 36, 100748. [Google Scholar] [CrossRef]
- Vishtal, A.; Retulainen, E. Deep-Drawing of Paper and Paperboard: The Role of Material Properties. Bioresources 2012, 7, 4424–4450. [Google Scholar] [CrossRef]
- Wang, J.; Wang, L.; Gardner, D.J.; Shaler, S.M.; Cai, Z. Towards a cellulose-based society: Opportunities and challenges. Cellulose 2021, 28, 4511–4543. [Google Scholar] [CrossRef]
- Chen, Z.; Aziz, T.; Sun, H.; Ullah, A.; Ali, A.; Cheng, L.; Ullah, R.; Khan, F.U. Advances and Applications of Cellulose Bio-Composites in Biodegradable Materials. J. Polym. Environ. 2023, 31, 2273–2284. [Google Scholar] [CrossRef]
- Carolin, F.C.; Kamalesh, T.; Kumar, P.S.; Hemavathy, R.V.; Rangasamy, G. A critical review on sustainable cellulose materials and its multifaceted applications. Ind. Crops Prod. 2023, 203, 117221. [Google Scholar] [CrossRef]
- Silva, F.A.G.S.; Dourado, F.; Gama, M.; Poças, F. Nanocellulose Bio-Based Composites for Food Packaging. Nanomaterials 2020, 10, 2041. [Google Scholar] [CrossRef]
- Forbes. Available online: https://www.forbes.com/sites/claraludmir/2023/09/13/nespresso-launches-its-pilot-of-home-compostable-capsules/ (accessed on 19 November 2024).
- Gutierrez, J.N.; Royals, A.W.; Jameel, H.; Venditti, R.A.; Pal, L. Evaluation of Paper Straws versus Plastics Straws: Development of a Methodology for Testing and Understanding Challenges for Paper Straws. Bioresources 2019, 14, 8345–8363. [Google Scholar] [CrossRef]
- Ilyas, M.; Ahmad, W.; Khan, H.; Yousaf, S.; Khan, K.; Nazir, S. Plastic waste as a significant threat to environment—A systematic literature review. Rev. Environ. Health 2018, 33, 383–406. [Google Scholar] [CrossRef]
- Thushari, G.G.N.; Senevirathna, J.D.M. Plastic pollution in the marine environment. Heliyon 2020, 6, e04709. [Google Scholar] [CrossRef] [PubMed]
- Rede, D.; Delerue-Matos, C.; Fernandes, V.C. The Microplastics Iceberg: Filling Gaps in Our Understanding. Polymers 2023, 15, 3356. [Google Scholar] [CrossRef]
- Nayanathara, P.G.C.; Pilapitiya, T.; Ratnayake, A.S. The world of plastic waste: A review. Clean. Mater. 2024, 11, 100220. [Google Scholar] [CrossRef]
- Iroegbu, A.O.C.; Ray, S.S.; Mbarane, V.; Bordado, J.C.; Sardinha, J.P. Plastic Pollution: A Perspective on Matters Arising: Challenges and Opportunities. ACS Omega 2021, 6, 19343–19355. [Google Scholar] [CrossRef]
- CEPI Renewable Recycled Responsible European. Available online: https://www.cepi.org/wp-content/uploads/2022/10/Cepi-recyclability-laboratory-test-method_FINAL.pdf (accessed on 20 November 2024).
- 4evergreen. Available online: https://4evergreenforum.eu/wp-content/uploads/Fibre-based-packaging-recyclability-evaluation-protocol-4EG-Beta-Release.pdf (accessed on 20 November 2024).
- Huber, P.; Delagoutte, T.; Ossard, S.; Soysouvanh, D.; Borel, P. A proposed link between machine runnability and stickies distribution within the sheet. In Advances in Pulp and Paper Research, Cambridge 2013 Transactions of the 15th Fundamental Research Symposium Held in Cambridge, September 2013 in Three Volumes; Printondemand: Peterborough, UK, 2013. [Google Scholar]
- Blanco, A.; Miranda, R.; Negro, C.; García-Suarez, C.; García-Prol, M.; Sanchez, A. Full characterization of stickies in a newsprint mill: The need for a complementary approach. Tappi J. 2007, 6, 19–25. [Google Scholar] [CrossRef]
- Chakrabarti, S.K.; Verma, P.; Tripathi, S.; Barnie, S.; Varadhan, R. Stickies: Management and Control. IPPTA J. 2011, 2, 101–107. [Google Scholar]
- 4evergreen. Available online: https://4evergreenforum.eu/wp-content/uploads/4evergreen-Circularity-by-Design-Guideline-version-2.pdf (accessed on 20 November 2024).
- ISO 15360-2; Recycled Pulps—Estimation of Stickies and Plastics—Part 2: Image Analysis Method. International Organization for Standardization: Geneva, Switzerland, 2015.
- Runte, S.; Putz, H.J.; Bussini, D.; Limongi, L.; Elegir, G. Recyclability Criteria for Paper Based Packaging Products. Cellulose Chem. Technol. 2015, 49, 667–676. [Google Scholar]
- ISO 15360-1; Recycled Pulps—Estimation of Stickies and Plastics—Part 1: Visual Method. International Organization for Standardization: Geneva, Switzerland, 2000.
- Huber, P.; Borel, P.; Soysouvanh, D.; Ossard, S.; Delagoutte, T. Macrostickies measurement by an automated method using laser triangulation and near infrared spectroscopy. Nord. Pulp Pap. Res. J. 2015, 30, 234–242. [Google Scholar] [CrossRef]
- Paper Technology International. Available online: https://papertechnologyinternational.com/wp-content/uploads/2021/10/Reliable-and-simple-determination-of-stickies-PTI-2022-LR.pdf (accessed on 21 November 2024).
- Heise, O.; Cao, B.; Dehm, J.; Holik, H.; Schabel, S.; Kriebel, A. A new stickies test method—Statistically sound and user friendly. TAPPI J. 1999, 82, 143–151. [Google Scholar]
- TAPPI/ANSI T 277 sp-21; Macro Stickies Content in Pulp: The “Pick-Up” Method. TAPPI, S&P Global: Peachtree Corners, GA, USA, 2021.
- ISO 1762; Paper, Board, Pulps and Cellulose Nanomaterials—Determination of Residue (Ash Content) on Ignition at 525 °C. International Organization for Standardization: Geneva, Switzerland, 2019.
- NP EN 13432; Packaging—Requirements for Packaging Recoverable Through Composting and Bio-Degradation—Test Scheme and Evaluation Criteria for the Final Acceptance of Packaging. European Committee for Standardization: Brussels, Belgium, 2015.
- EN 14995; Plastics—Evaluation of Compostability—Test Scheme and Specifications. European Committee for Standardization: Brussels, Belgium, 2006.
- Gonzalez, R.C.; Woods, R.E. Digital Image Processing; Addison-Wesley Publishing Company, Inc.: Reading, MA, USA, 1992. [Google Scholar]
- Pratt, W.K. Digital Image Processing, 2nd ed.; John Wiley & Sons, Inc.: Hoboken, NJ, USA, 1991. [Google Scholar]
- Mendes, A.D.O.; Fiadeiro, P.T.; Miguel, R.A.L.; Lucas, J.M. Optical Estimation of a Set of Pilling Coefficients for Textile Fabrics. Text. Res. J. 2009, 79, 410–417. [Google Scholar] [CrossRef]
- Huber, P.; Delagoutte, T.; Ossard, S. The concept of stickies exposure for paper recycling processes. Nord. Pulp Pap. Res. J. 2013, 28, 82–93. [Google Scholar] [CrossRef]
- Ran, Z.; Zhijun, H.; Guangjun, Z. Preparation Method of Neutral Esterase and Stickies Control Enzyme Reagent for Waste Paper Papermaking Process. Chinese Patent CN109957558A; Worldwide Applications, 29 March 2019. [Google Scholar]
- Doshi, M.R.; Blanco, A.; Negro, C.; Monte, C.; Dorris, G.M.; Castro, C.C.; Hamann, A.; Haynes, R.D.; Houtman, C.; Scallon, K.; et al. Comparison of Microstickies Measurement Methods Part II: Results and Discussion. Prog. Paper Recycl. 2003, 13, 44–62. [Google Scholar]


| Category | Sample ID | CEPI Total Final Score * (Points) |
|---|---|---|
| Molded Cellulose | MC1 | 99.9 |
| MC2 | 98.7 | |
| MC3 | 99.3 | |
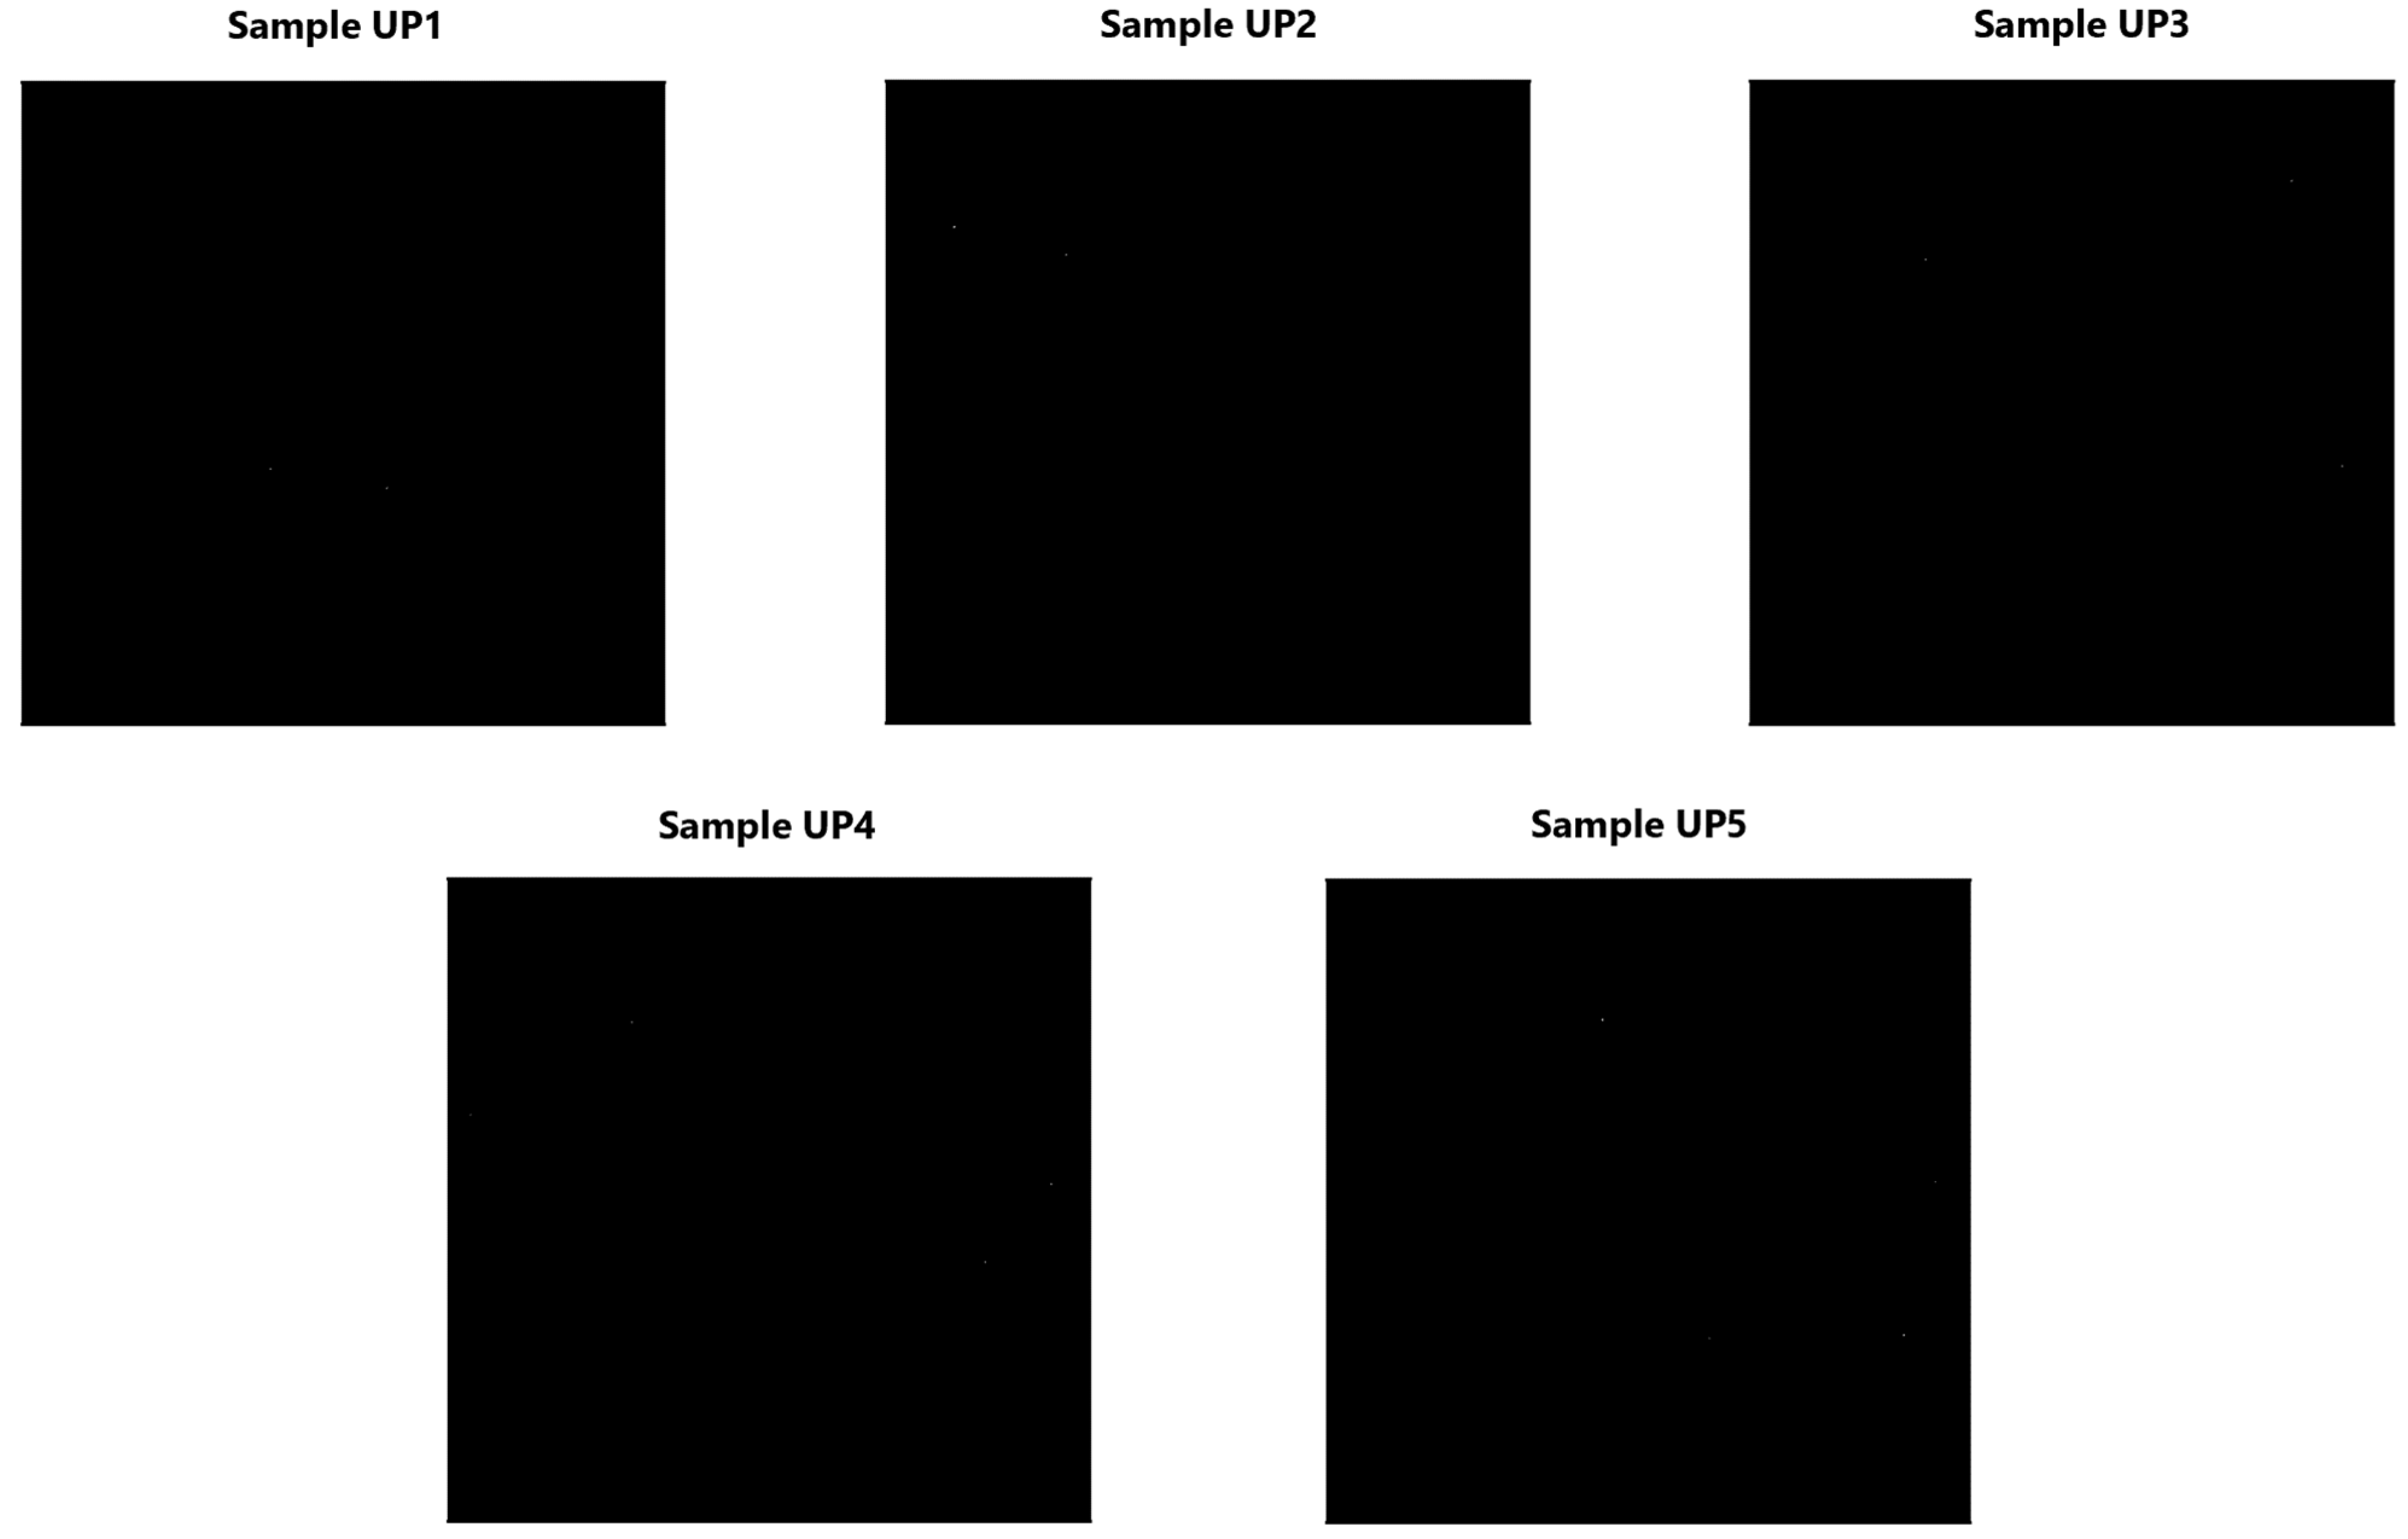
| Unbleached Kraft Papers | UP1 | 98.8 |
| UP2 | 97.6 | |
| UP3 | 98.8 | |
| UP4 | 98.3 | |
| UP5 | 99.9 | |
| Barrier Papers | BP1 | 98.8 |
| BP2 | 99.8 | |
| BP3 | 4.5 | |
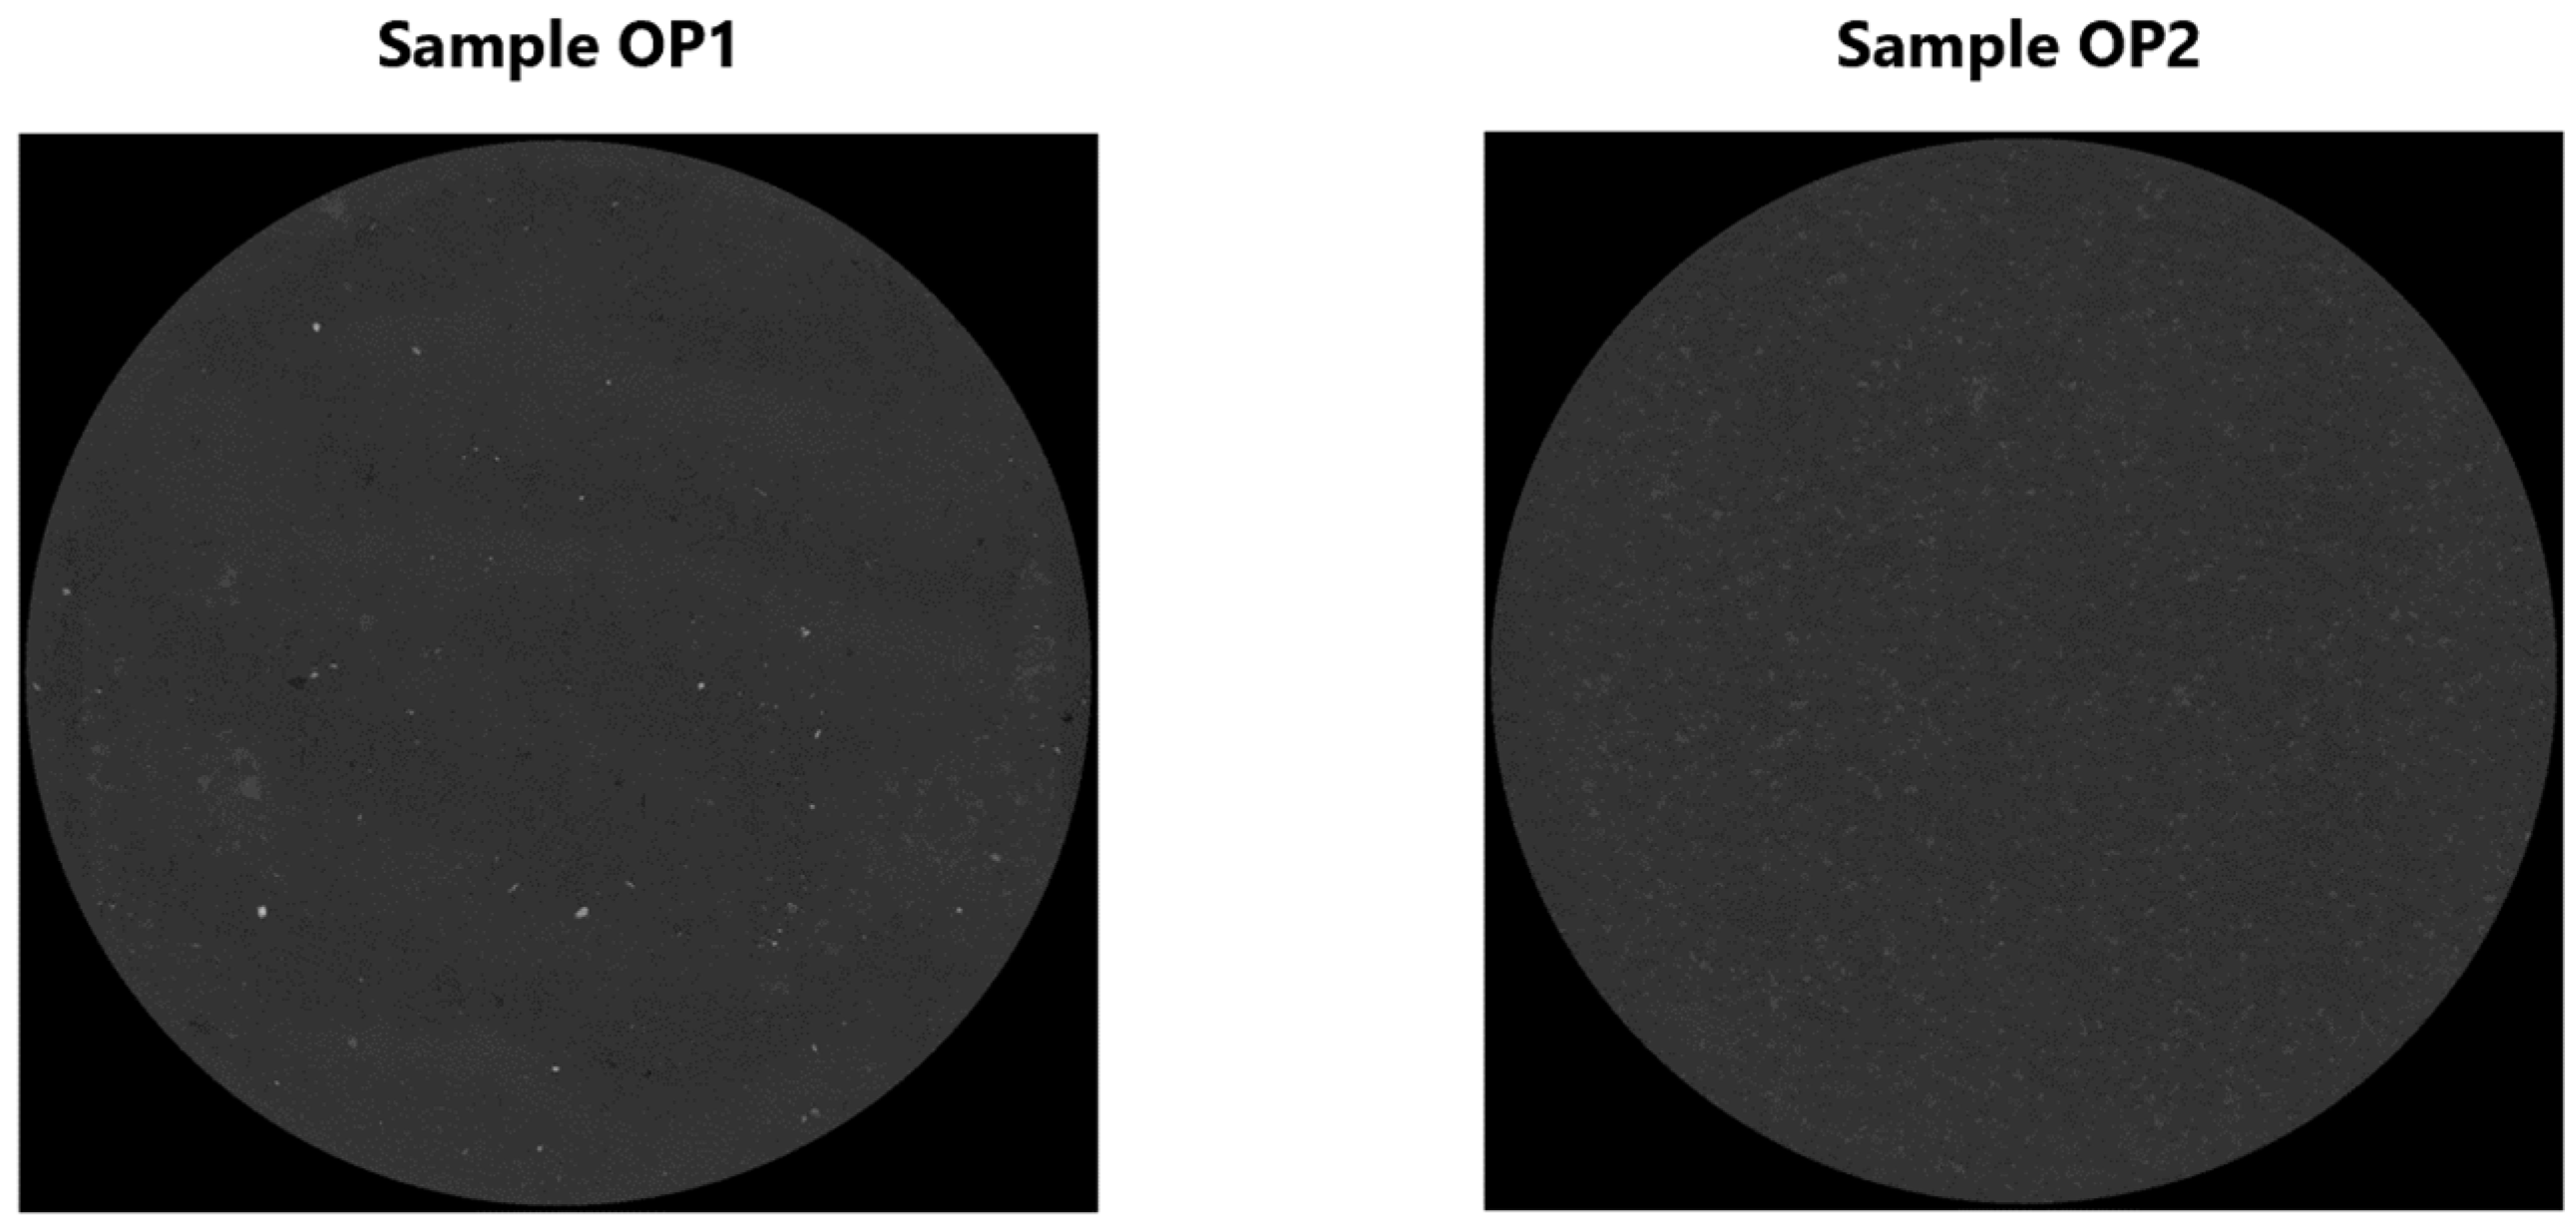
| Other Papers | OP1 | 79.7 |
| OP2 | 45.6 |
| Macro Stickies (Global Analysis) | |||
|---|---|---|---|
| Sample ID | Detected Elements (Units) | Total Area (mm2) | Area per Mass (mm2/kg) |
| MC1 | 1 | 0.03 | 6.10 |
| MC2 | 19 | 2.82 | 564.52 |
| MC3 | 36 | 7.25 | 1450.54 |
| UP1 | 2 | 0.04 | 8.60 |
| UP2 | 2 | 0.08 | 16.48 |
| UP3 | 3 | 0.08 | 16.12 |
| UP4 | 4 | 0.14 | 27.24 |
| UP5 | 4 | 0.15 | 29.04 |
| BP1 | 2 | 0.11 | 22.58 |
| BP2 | 5 | 0.13 | 26.16 |
| BP3 | 1783 | 144.87 | 28,973.42 |
| OP1 | 141 | 34.99 | 6998.56 |
| OP2 * | 678 | 35.15 | 14,058.76 |
| Class Designation | Dimensions of Macro Stickies per Class |
|---|---|
| C1 | ≥0.01 mm2, <0.05 mm2 |
| C2 | ≥0.05 mm2, <0.10 mm2 |
| C3 | ≥0.10 mm2, <0.20 mm2 |
| C4 | ≥0.20 mm2, <0.50 mm2 |
| C5 | ≥0.50 mm2, <1.00 mm2 |
| C6 | ≥1.00 mm2, <2.00 mm2 |
| C7 | ≥2.00 mm2, <5.00 mm2 |
| C8 | ≥5.00 mm2 |
| Macro Stickies (Analysis per Classes mm2)–Detected Elements (Units) | ||||||||
|---|---|---|---|---|---|---|---|---|
| Sample ID | C1 0.01–0.05 | C2 0.05–0.1 | C3 0.1–0.2 | C4 0.2–0.5 | C5 0.5–1.0 | C6 1.0–2.0 | C7 2.0–5.0 | C8 >5.0 |
| MC1 | 1 | 0 | 0 | 0 | 0 | 0 | 0 | 0 |
| MC2 | 7 | 3 | 4 | 4 | 1 | 0 | 0 | 0 |
| MC3 | 19 | 5 | 5 | 4 | 2 | 0 | 1 | 0 |
| UP1 | 2 | 0 | 0 | 0 | 0 | 0 | 0 | 0 |
| UP2 | 1 | 1 | 0 | 0 | 0 | 0 | 0 | 0 |
| UP3 | 3 | 0 | 0 | 0 | 0 | 0 | 0 | 0 |
| UP4 | 4 | 0 | 0 | 0 | 0 | 0 | 0 | 0 |
| UP5 | 3 | 1 | 0 | 0 | 0 | 0 | 0 | 0 |
| BP1 | 1 | 1 | 0 | 0 | 0 | 0 | 0 | 0 |
| BP2 | 5 | 0 | 0 | 0 | 0 | 0 | 0 | 0 |
| BP3 | 957 | 476 | 231 | 95 | 17 | 6 | 1 | 0 |
| OP1 | 42 | 27 | 28 | 25 | 14 | 3 | 2 | 0 |
| OP2 * | 450 | 161 | 56 | 10 | 1 | 0 | 0 | 0 |
| Macro Stickies (Analysis per Classes mm2)–Total Area (mm2) | ||||||||
|---|---|---|---|---|---|---|---|---|
| Sample ID | C1 0.01–0.05 | C2 0.05–0.1 | C3 0.1–0.2 | C4 0.2–0.5 | C5 0.5–1.0 | C6 1.0–2.0 | C7 2.0–5.0 | C8 >5.0 |
| MC1 | 0.03 | 0 | 0 | 0 | 0 | 0 | 0 | 0 |
| MC2 | 0.18 | 0.16 | 0.49 | 1.19 | 0.81 | 0 | 0 | 0 |
| MC3 | 0.66 | 0.34 | 0.86 | 1.26 | 1.38 | 0 | 2.75 | 0 |
| UP1 | 0.04 | 0 | 0 | 0 | 0 | 0 | 0 | 0 |
| UP2 | 0.02 | 0.06 | 0 | 0 | 0 | 0 | 0 | 0 |
| UP3 | 0.08 | 0 | 0 | 0 | 0 | 0 | 0 | 0 |
| UP4 | 0.14 | 0 | 0 | 0 | 0 | 0 | 0 | 0 |
| UP5 | 0.09 | 0.06 | 0 | 0 | 0 | 0 | 0 | 0 |
| BP1 | 0.04 | 0.07 | 0 | 0 | 0 | 0 | 0 | 0 |
| BP2 | 0.13 | 0 | 0 | 0 | 0 | 0 | 0 | 0 |
| BP3 | 33.09 | 33.01 | 31.28 | 27.23 | 10.60 | 7.61 | 2.05 | 0 |
| OP1 | 1.31 | 1.85 | 3.98 | 7.67 | 10.61 | 3.64 | 5.93 | 0 |
| OP2 * | 13.17 | 11.07 | 7.42 | 2.96 | 0.53 | 0 | 0 | 0 |
| Macro Stickies (Analysis per Classes mm2)–Area per Mass (mm2/kg) | ||||||||
|---|---|---|---|---|---|---|---|---|
| Sample ID | C1 0.01–0.05 | C2 0.05–0.1 | C3 0.1–0.2 | C4 0.2–0.5 | C5 0.5–1.0 | C6 1.0–2.0 | C7 2.0–5.0 | C8 >5.0 |
| MC1 | 6.10 | 0 | 0 | 0 | 0 | 0 | 0 | 0 |
| MC2 | 36.92 | 31.54 | 97.14 | 237.28 | 161.64 | 0 | 0 | 0 |
| MC3 | 132.26 | 67.38 | 171.32 | 252.32 | 276.34 | 0 | 550.90 | 0 |
| UP1 | 8.60 | 0 | 0 | 0 | 0 | 0 | 0 | 0 |
| UP2 | 4.30 | 12.18 | 0 | 0 | 0 | 0 | 0 | 0 |
| UP3 | 16.12 | 0 | 0 | 0 | 0 | 0 | 0 | 0 |
| UP4 | 27.24 | 0 | 0 | 0 | 0 | 0 | 0 | 0 |
| UP5 | 17.92 | 11.12 | 0 | 0 | 0 | 0 | 0 | 0 |
| BP1 | 8.60 | 13.98 | 0 | 0 | 0 | 0 | 0 | 0 |
| BP2 | 26.16 | 0 | 0 | 0 | 0 | 0 | 0 | 0 |
| BP3 | 6617.20 | 6601.80 | 6255.18 | 5446.58 | 2120.42 | 1521.86 | 410.40 | 0 |
| OP1 | 262.72 | 370.60 | 795.70 | 1534.76 | 2121.14 | 727.24 | 1186.40 | 0 |
| OP2 * | 5269.50 | 4427.96 | 2966.30 | 1182.80 | 212.20 | 0 | 0 | 0 |
Disclaimer/Publisher’s Note: The statements, opinions and data contained in all publications are solely those of the individual author(s) and contributor(s) and not of MDPI and/or the editor(s). MDPI and/or the editor(s) disclaim responsibility for any injury to people or property resulting from any ideas, methods, instructions or products referred to in the content. |
© 2025 by the authors. Licensee MDPI, Basel, Switzerland. This article is an open access article distributed under the terms and conditions of the Creative Commons Attribution (CC BY) license (https://creativecommons.org/licenses/by/4.0/).
Share and Cite
Mendes, A.d.O.; Vieira, J.C.; Costa, V.L.D.; Pinto, P.; Soares, B.; Barata, P.; Curto, J.M.R.; Amaral, M.E.; Costa, A.P.; Fiadeiro, P.T. Macro Stickies Content Evaluation of Different Cellulose-Based Materials Through Image Analysis. Recycling 2025, 10, 69. https://doi.org/10.3390/recycling10020069
Mendes AdO, Vieira JC, Costa VLD, Pinto P, Soares B, Barata P, Curto JMR, Amaral ME, Costa AP, Fiadeiro PT. Macro Stickies Content Evaluation of Different Cellulose-Based Materials Through Image Analysis. Recycling. 2025; 10(2):69. https://doi.org/10.3390/recycling10020069
Chicago/Turabian StyleMendes, António de O., Joana C. Vieira, Vera L. D. Costa, Paula Pinto, Belinda Soares, Paulo Barata, Joana M. R. Curto, Maria E. Amaral, Ana P. Costa, and Paulo T. Fiadeiro. 2025. "Macro Stickies Content Evaluation of Different Cellulose-Based Materials Through Image Analysis" Recycling 10, no. 2: 69. https://doi.org/10.3390/recycling10020069
APA StyleMendes, A. d. O., Vieira, J. C., Costa, V. L. D., Pinto, P., Soares, B., Barata, P., Curto, J. M. R., Amaral, M. E., Costa, A. P., & Fiadeiro, P. T. (2025). Macro Stickies Content Evaluation of Different Cellulose-Based Materials Through Image Analysis. Recycling, 10(2), 69. https://doi.org/10.3390/recycling10020069